The views expressed in this paper are those of the writer(s) and are not necessarily those of the ARJ Editor or Answers in Genesis.
Abstract
It has come to the attention of this author that recent versions of the BLASTN algorithm employed as a local installation may be omitting significant levels of query sequences in large-scale genomic searches. This claim potentially affects the results of past research done by this author, particularly in relation to human-chimp DNA similarity. Therefore, six different versions of the BLASTN algorithm (2.2.25+, 2.2.26+, 2.2.27+, 2.2.28+, 2.2.29+, 2.2.30+) were tested using chimpanzee genomic sequence queried against human in sequence sets of ‘10’, ‘100’, ‘1,000’, ‘10,000’ and ‘100,000’ sequences of randomly obtained 300 base fragments derived from three different chimpanzee chromosomes (providing three experimental replications). Surprisingly, only BLASTN version 2.2.25+ returned hits for nearly all query sequences. Every later version of the algorithm omitted significant levels of query sequence with the problem generally increasing with progressive algorithm releases. Therefore, a previous study by this author (using v. 2.2.27+) in which chimpanzee chromosomes were compared to human was repeated using the 2.2.25+ version of the algorithm in addition to the use of two other DNA pairwise algorithms (LASTZ and nucmer). For both LASTZ and nucmer, alignments as low as 50% identity were allowed along with the inclusion of all repetitive sequence. The analyses with BLASTN v 2.2.25+ and nucmer indicate that the alignable portions of the current chimpanzee genome assembly are 88% similar on average to human. The LASTZ algorithm only returned an average overall similarity of 73%. Detailed results and issues associated with each analysis are discussed.
Keywords: comparative genomics, human-chimp DNA similarity, human genome, chimpanzee genome, pair-wise alignments, BLASTN, nucmer, LASTZ
Introduction
A common evolutionary claim is that the DNA of chimpanzees (Pan troglodytes) and humans (Homo sapiens) are nearly identical, despite the fact that a vast chasm of phenotypic differences exist. This oversimplified claim has even been called into question by some evolutionists such as Todd Preuss who recently stated, “It is now clear that the genetic differences between humans and chimpanzees are far more extensive than previously thought; their genomes are not 98 or 99% identical” (Preuss 2012). In Preuss’ estimate, however, the alignable regions of the genomes are on average about 96% similar.
As noted in several recent reports, one of the overriding issues with past evolutionary research in comparative DNA analysis between chimps and humans is that a great deal of preferential and selective data analysis has been employed (Bergman and Tomkins 2012; Tomkins and Bergman 2012). In all studies examined by Tomkins and Bergman, only the most evolutionarily supportive data such as gene-rich sequences and other highly alignable regions that exist in both species are utilized, often after several levels of data filtering for sequence homogeneity. In addition, non-alignable regions and large gaps in DNA sequence alignments are typically omitted, thus increasing the levels of reported similarity.
The premier publication regarding the chimpanzee genome and its comparison to human was the 2005 paper from the Chimpanzee Genome Sequencing Consortium (The Chimpanzee Sequencing and Analysis Consortium 2005). Unfortunately, this paper had several major issues of concern. The first issue of note was the fact that the individual chimpanzee shotgun sequences were assembled using the human genome as a reference framework. Interestingly, the researchers also performed a de novo assembly (without a reference genome) using a different algorithm than the one used for reporting results in the paper, but did not employ that assembly for the comparative studies used in the report. The comparative data with human utilized the more human-like assembly and was done in a highly selective and obfuscated manner using algorithm parameters that omitted non-similar sequence. Overall, the bioinformatics tended to be mostly focused on hypothetical evolutionary analyses for various divergence rates and selective forces allegedly operating in highly similar homologous regions. Nevertheless, enough data from the 2005 chimp genome project was available to allow rough ad hoc estimates of overall genome similarity when compared to the statistics of the human assembly of its day in which Tomkins and Bergman (2012) derived an overall similarity of 81% which included reported substitutions, insertions, and deletions, and the amount of sequence not alignable to human. Geneticist Richard Buggs took a somewhat similar approach and came up with an even lower estimate of about 72% overall similarity (Buggs 2008).
These ad hoc estimates of a much lower genome similarity between chimpanzee and human appeared to have multiple sources of empirical support. During an early phase of the chimpanzee genome sequencing project, three million individual reads were queried against the human genome and the researchers reported, that only “About two thirds could be unambiguously aligned to DNA sequences in humans” (Ebersberger et al. 2002). The one-third that could not be aligned “unambiguously” were either highly repetitive (had many matches) or did not align at all. In another study, researchers extracted 10,000 30-base segments at random from each assembled chimpanzee chromosome and then matched each fragment against its human chromosome homolog and only achieved an average of about 66% similarity for all chromosomes (Cosmo 2012). Then in 2013, this author performed a comprehensive alignment of each chimpanzee chromosome against its human counterpart using optimized sequence slice sizes and the BLASTN algorithm (v2.2.27+) and achieved an average overall genome similarity of about 70%—in general agreement with the aforementioned previous efforts (Tomkins 2013).
As of 2013, the issue of overall genome similarity between chimpanzee and humans seemed to be about 70% based on five different reports, three of which were based on actual data analyses. However, in 2014 , a computer programmer of financial trading algorithms discovered an apparent bug in the BLASTN algorithm and notified this author of the situation (Glenn Williamson, Tibra Capital, personal communication).
When this author began investigating the matter further, it became apparent that depending on the version of the BLASTN algorithm being used, a significant portion of query sequences that are not highly similar to the target database (typically less than 98% identity), are omitted and not aligned. In fact, this behavior is observed irrespective of the algorithm parameters for word size (initial string match length), e-value (statistical threshold), or x-dropoff during gap extension (Tomkins unpublished data). Adding even more mystery to the errant behavior of the algorithm was the fact that when controls are employed, such as matching the query sequence against the genome of the query species, 100% of the hits are returned at about 100% similarity (Tomkins 2014).
In light of this discovery, this author performed a comprehensive inquiry into the behavior of the BLASTN algorithm. In this effort, six different versions of the BLASTN algorithm (2.2.25+, 2.2.26+, 2.2.27+, 2.2.28+, 2.2.29+, 2.2.30+) were employed using chimpanzee genomic sequence queried against the human genome. To ascertain if query set size was also a major factor, sequence sets of ‘10’, ‘100’, ‘1,000’, ‘10,000’ and ‘100,000’ sequences were tested. The query sets used randomly obtained 300 base fragments derived from three different chimpanzee chromosomes (providing three experimental replications).
Following this analysis of the BLASTN algorithm, the entire 2013 study performed by this author was repeated using an older intact version of the BLAST algorithm prior to the introduction of the bug in question. In addition, two other pairwise alignment algorithms (LASTZ and nucmer) were also employed to compare the entire chimpanzee genome (chromosome-by-chromosome) to human.
Materials and Methods
All versions of the BLASTN algorithm (2.2.25+, 2.2.26+, 2.2.27+, 2.2.28+, 2.2.29+, 2.2.30+) were obtained from NCBI (ftp://ftp.ncbi.nlm.nih.gov/blast/executables/) and freshly installed locally on a Debian linux server with dual Intel Xeon 10-core Processors (E5-2690 v2) providing 40 logical cores and 384 Gb RAM. The query and target genome data were accessed from 12 Gb/sec SAS-connected solid state drives. Two such identical systems were utilized for the other studies (nucmer and LASTZ) described below. BLASTN commands/jobs were run within UNIX shell scripts and execution time was measured in seconds as determined by programmatically subtracting end from start times using standard shell commands in the job scripts. Query sequence sets of ‘10’, ‘100’, ‘1,000’, ‘10,000’, and ‘100,000’ sequences were individually tested. The query sets used randomly obtained 300 base fragments (via the Python3 random library) that were void of non-DNA characters (e.g. Ns) derived from three different chimpanzee chromosomes (3, 4, and 5) which provided three experimental replications for the study. The target database was the respective corresponding human homolog chromosome (3, 4, or 5) formatted using the “makeblastdb” program. Files were outputted in csv format with chromosome IDs and execution time log data post-job added to the csv files. Individual csv files were then concatenated and imported as a single dataframe into the R statistical package (v 3.2.1). Main categorical fixed effects (factors) were “BLAST version” and “data set size.” Continuous response variables analyzed were execution speed (sequences blasted per second), percentage of hits returned, and alignment identity. Main effects and interactions were analyzed using a standard general linear model and other statistical functions provided by the R base package. Plotting of data for the figures in this paper was performed in R using the ggplot2 library or the base R package. BLASTN parameters utilized were as follows: evalue 10, word_size 11, max_target_seqs 1, dust no, soft_ masking false, ungapped, and num_threads 6.
In preliminary studies, BLASTN version 2.2.25+ was tested with gapping allowed, but resulted in a continuous loop effect returning no hits. In later BLASTN versions, gapping returned hits, but the bug effect of omitting query sequences was similar to using ungapped. Therefore, the ungapped parameter was employed experiment-wide to statistically compare all algorithm versions. The BLAST+ software architecture and applications have been described in an earlier publication (Camacho et al. 2009).
To validate the ability of the BLASTN v2.2.25+ algorithm for consistency in returning hits at lower levels of identity (<95%), an additional experiment was performed. Ten random 300 base sequences from human chr22 were selected and then randomly mutated at 2% levels (incrementally) down to 74% identity using a Perl script written by this author. Sequence identity of each mutated sequence compared to the original and the BLAST output was evaluated using a Perl script written by this author.
The 2013 study performed by this author was repeated for all chromosomes using version 2.2.25+ of the BLASTN algorithm with the parameters described above and a sequence slice of 300 bases.
The nucmer genome alignment algorithm is part of the MUMmer3 package, which was downloaded from http://mummer.sourceforge.net and previously described in an earlier publication (Kurtz et al. 2004). Whole chimpanzee chromosomes were aligned onto human without the need for sequence slicing due to the nature of the algorithm. The following command sequence run in a shell script was used for each chimpanzee chromosome: nucmer -maxmatch -c 100 -p <human_chrom.fasta> <chimp_chrom.fasta> (commands showing shell output, redirection, and log file creation not shown). Data from the resulting nucmer delta file was extracted using the “showcoords” MUMmer command and the output was reformatted into a csv file using a shell script written by this author. The data was then imported into the R statistical package for basic summary statistics and plotting.
The LASTZ algorithm was developed by the Miller lab at the Penn State University Center for Comparative Genomics and Bioinformatics (Harris 2007) and downloaded at the following url: http://www.bx.psu.edu/miller_lab/dist/lastz-1.02.00.tar.gz. Due to the nature of the LASTZ algorithm when applied to whole chromosome alignments in preliminary studies done by this author, the chimpanzee chromosomes were sliced into 10,000 base fragments (retaining Ns) using a Python script written by this author. Typical default use of the LASTZ algorithm in comparing chimpanzee to human utilizes sequence masking to speed up the alignments and alleviate system resource restraints. Default parameters also omit non-similar sequence below a threshold of 95 to 98% identity. Therefore, to obtain a more realistic comparison of chimpanzee to human DNA, the following LASTZ command line sequence was employed in shell script format: lastz <human_chrom_fasta_file>[unmask] <chimp_chrom_file> --step=10 --seed=match12 --notransition --exact=20 --noytrim --ambiguous=n --filter=coverage:50 --filter=identity:50 –-format =general:start1, end1, length1, length2, strand2, identity > <out_file.dat>. The resulting data file from each alignment was reformatted into a csv file using a shell script written by this author and then imported into the R statistical package for basic summary statistics and plotting.
All UNIX shell, Python, R, and Perl scripts used in this study along with parameters for the various algorithms (contained inside shell scripts) were deposited at https://github.com/jt-icr/chimp_human_dna.
Results
BLASTN algorithm analysis
For the main response variables analyzed (identity, percent hits, search speed), the only interactions observed between the two main factors (BLASTN version, data set size) was for the percent hits returned. This interaction was characterized by a decrease in the percent hits returned as the data set size increased for several versions of the algorithm containing the bug.
For the most part, the behavior of the BLASTN algorithm in this study can largely be explained by the factor “BLASTN version” which was significant as a main effect (P < 0.001) for all of the response variables tested. Treatment combination means are all listed in Tables 1–3. The trends are best visualized by the graphs presented in Figs. 1 and 2. The only apparently intact release of the BLASTN algorithm was version 2.2.25+ which returned hits at close to 100% and functioned as would be expected. Since the chimpanzee genome was assembled using human as a reference, and unanchored contigs were not included, one would expect that nearly all sequences extracted from the assembly would hit on their respective human homologs. However, later versions of the algorithm all appear to exhibit the anomaly of omitting significant levels of query sequence, which varied depending on the version of the algorithm used. Based on this data, the bug was first introduced in version 2.2.26+. Interestingly, in version 2.2.27+, the returned amount of hits generally parallels the similarity results reported in 2013.
| BLASTN v. | Number of Sequences in Query Set | ||||
|---|---|---|---|---|---|
| 10 | 100 | 1,000 | 10,000 | 100,000 | |
| 2.2.25+ | 87.7 | 87.3 | 88.7 | 87.0 | 89.0 |
| 2.2.26+ | 88.3 | 99.0 | 99.0 | 100.0 | 100.0 |
| 2.2.27+ | 93.7 | 99.0 | 99.0 | 93.7 | 99.0 |
| 2.2.28+ | 100.0 | 100.0 | 100.0 | 100.0 | 100.0 |
| 2.2.29+ | 99.3 | 99.7 | 98.0 | 98.0 | 98.0 |
| 2.2.30+ | 100.0 | 99.7 | 100.0 | 100.0 | 100.0 |
| BLASTN v. | Number of Sequences in Query Set | ||||
|---|---|---|---|---|---|
| 10 | 100 | 1,000 | 10,000 | 100,000 | |
| 2.2.25+ | 100.0 | 100.0 | 100.0 | 100.0 | 100.0 |
| 2.2.26+ | 86.7 | 68.3 | 33.4 | 11.7 | 11.7 |
| 2.2.27+ | 86.7 | 68.3 | 59.8 | 62.7 | 63.4 |
| 2.2.28+ | 10.0 | 2.0 | 1.2 | 1.0 | 1.1 |
| 2.2.29+ | 23.3 | 9.0 | 22.2 | 24.6 | 24.9 |
| 2.2.30+ | 10.0 | 2.3 | 2.2 | 2.1 | 2.2 |
| BLASTN v. | Number of Sequences in Query Set | ||||
|---|---|---|---|---|---|
| 10 | 100 | 1,000 | 10,000 | 100,000 | |
| 2.2.25+ | 2.5 | 2.3 | 2.2 | 2.2 | 2.2 |
| 2.2.26+ | 10.0 | 19.8 | 12.6 | 10.6 | 10.8 |
| 2.2.27+ | 8.3 | 18.1 | 13.9 | 14.0 | 14.4 |
| 2.2.28+ | 8.3 | 18.1 | 16.0 | 16.5 | 17.1 |
| 2.2.29+ | 7.8 | 13.7 | 6.4 | 6.0 | 5.9 |
| 2.2.30+ | 6.7 | 17.0 | 15.5 | 16.3 | 15.5 |
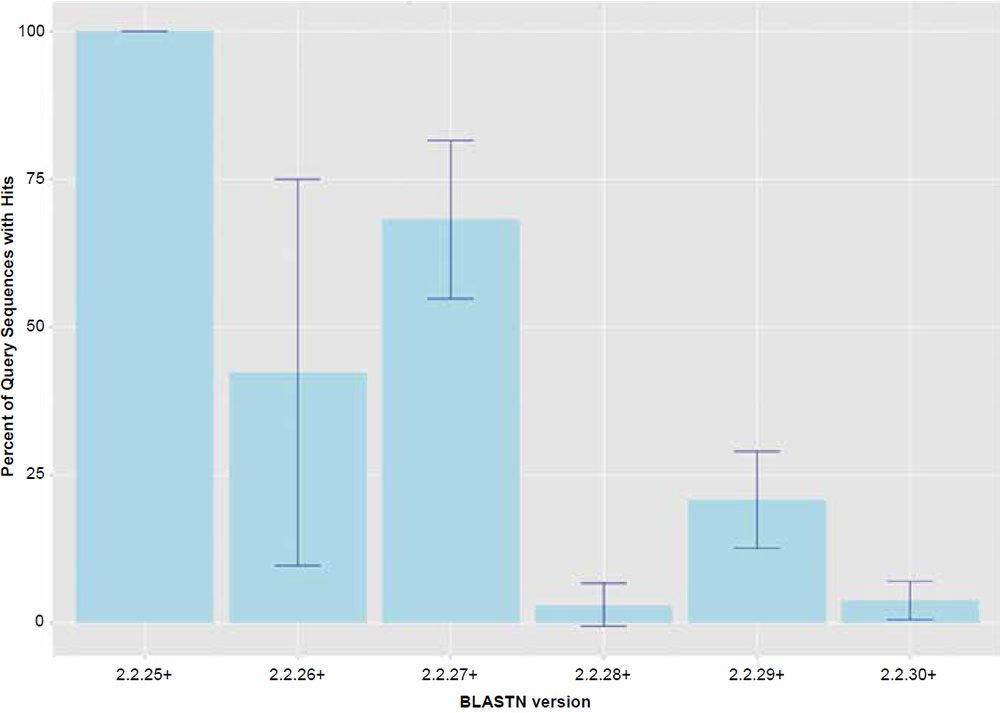
Fig. 1. Percent query hits returned for each of the BLASTN algorithm versions. Data averaged across all data set sizes.
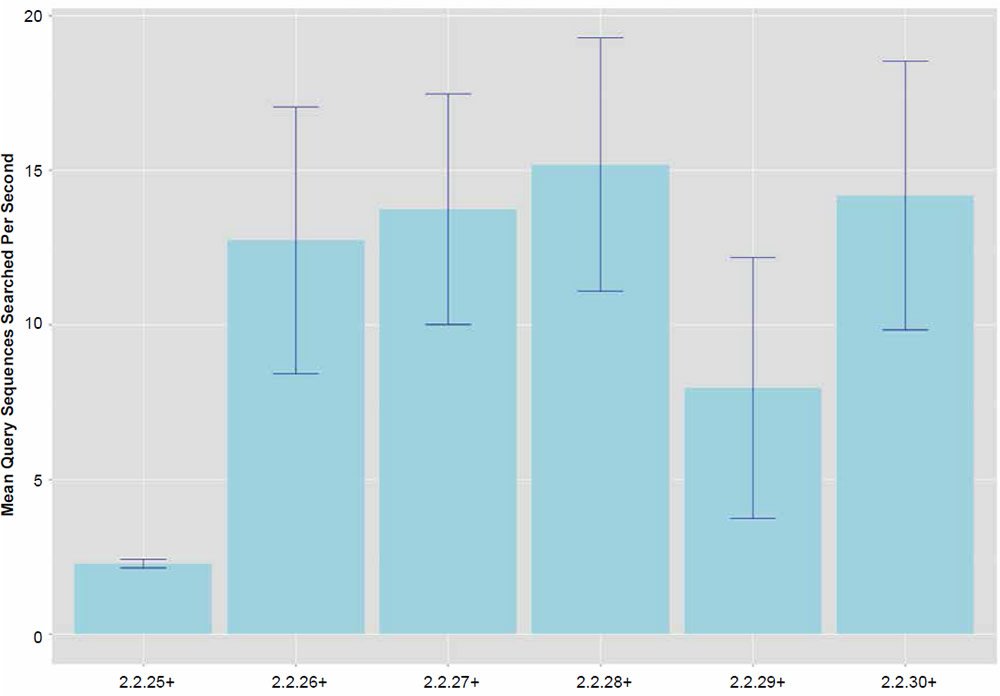
Fig. 2. Search speeds (average number of query sequences returned per second) for each of the BLASTN algorithm versions. Data averaged across all data set sizes.
In general, the percent hits returned was inversely proportional to the general increase in algorithm search speed and percent identity. The overall statistical trend indicates that algorithm development exhibited a goal of increasing execution speed at the expense of inter-taxonomic comparative accuracy under the conditions employed in this study. Not only are highly non-similar sequences omitted at a higher frequency, but the experimental error also radically increases after version 2.2.25+ for all response variables, indicating that the algorithm performance became more erratic as well. The association between the amount of hits returned and algorithm speed is depicted in Fig. 3 where a negative correlation of −0.51 was found. The correlation was not more highly significant because of the distribution of data as noted by the box plots for the x and y response variables positioned on the periphery of the plot. The box plot in Fig. 4 further depicts the variable and erratic performance of the algorithm in all releases after version 2.2.25+ showing how the distribution of data varies widely with each software version release.
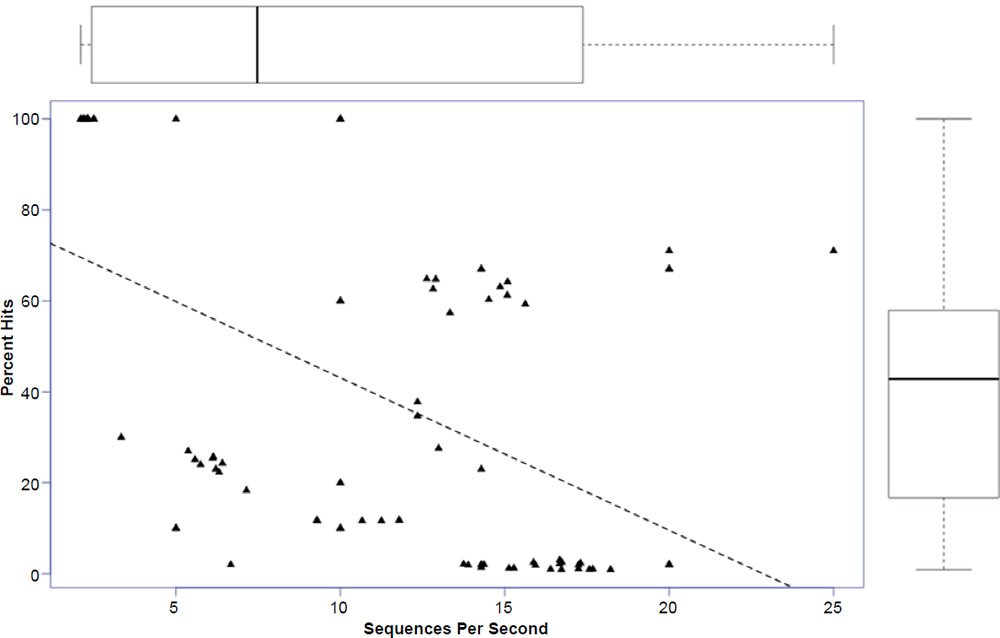
Fig. 3. Regression of percent hits on search speed with box plots of data superimposed on the axes. Lines in box plots represent means.
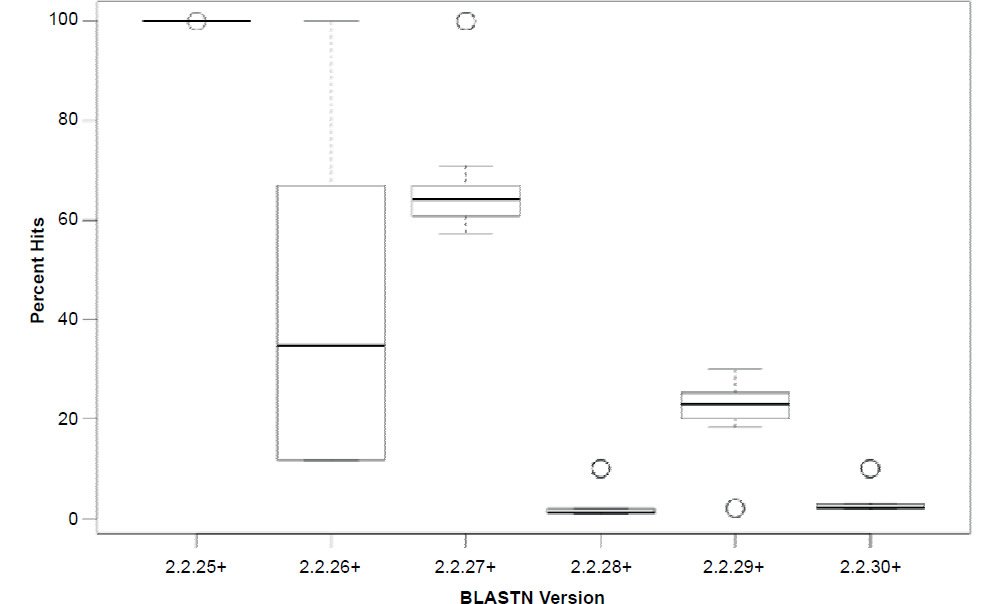
Fig. 4. Box plots of percent hits for each of the BLASTN algorithms showing the variability of the data. Lines in boxes represent means.
Reanalysis of the Chimpanzee Genome Using BLASTN v2.2.25+
Following the analysis of the six different versions of the BLASTN algorithm at different data set sizes, the entire 2013 study originally performed by this author using v2.2.27+ was repeated using the older intact version of the BLAST algorithm (v2.2.25+) prior to the introduction of the bug in question. As in the previous study, a sequence slicing strategy of the chromosomal query sequence was employed to overcome the inability of the BLASTN algorithm to produce alignments beyond a few hundred bases. A sequence slice of 300 bases was used which according to the alignment length results produced by the nucmer algorithm (discussed below) was appropriate because Nucmer, on average, produced alignment lengths of 300 bases or more for all chimpanzee chromosomes.
Average genome similarity for the complete reblasting of all chimpanzee chromosomes against their human chromosome homolog produced an average of about 88% identity based on the amount of total dissimilar sequence not aligned in each 300 base fragment. A distribution of the alignment identities is shown in Fig. 5. In contrast to the previous 2013 study using BLASTN v2.2.27+, 100% of the chimpanzee query sequences hit on their respective human chromosome target databases, except for the Y chr which returned 99.8%.
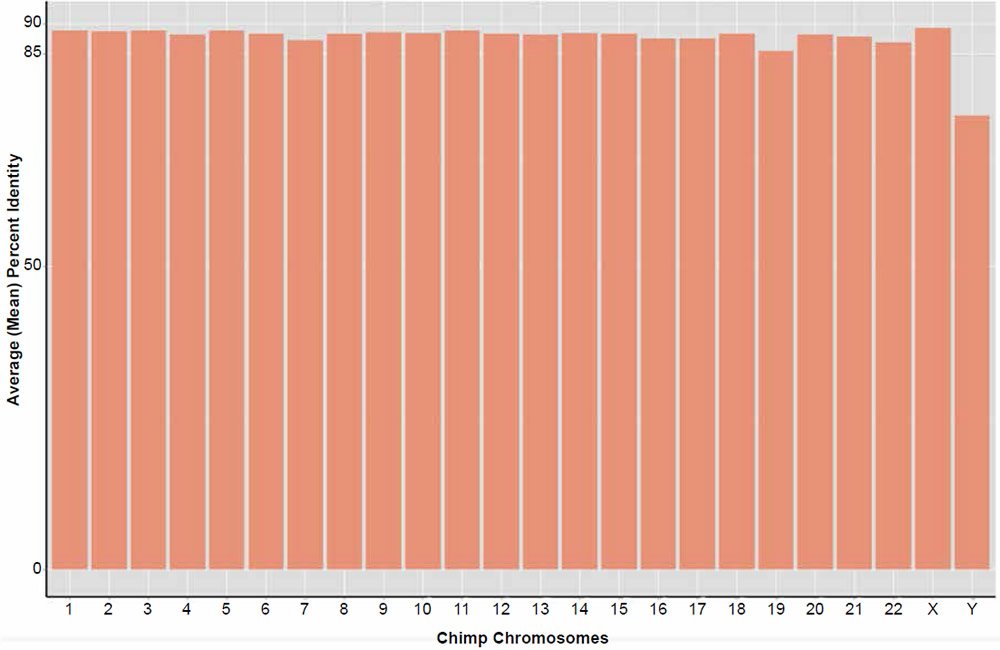
Fig. 5. Reanalysis of the Tomkins (2013) chimpanzee chromosome similarity study using the BLASTN v2.2.25+ algorithm and sequence slices of 300 bases. Bars represent the percent of the total amount of DNA aligned per chromosome queried against their human homolog.
To validate the ability of the BLASTN v2.2.25+ algorithm in returning hits at lower levels of identity (<95%), in contrast to the other version of the algorithm tested as discussed previously, an additional experiment was performed. Ten 300 base sequences from human chr22 of 300 bases in length were selected (at random) and then randomly mutated at 2% levels (incrementally) down to 74% identity using a Perl script written by this author. Sequence identity of each mutated sequence compared to the original, was evaluated after each 2% mutation iteration. The v2.2.25+ algorithm did in fact return all hits down to the lowest level tested (74%), indicating that it worked as expected and was not afflicted with the same anomaly as later BLASTN releases that omitted sequence at non-similar levels below ~98% identity.
Nucmer Algorithm Analysis
In addition to repeating the 2013 study with an intact version of BLASTN, two other algorithms were also employed to compare the chimpanzee genome to human chromosome-by-chromosome. The first alternative used was nucmer, an algorithm that is part of the MUMmer package (Kurtz et al. 2004). Nucmer is a Perl script pipeline that begins by finding maximal exact matches of a given length which it then clusters to form larger alignments, and eventually, it extends these outwards to join the clusters into a single high scoring pairwise alignment. In contrast, the BLAST algorithm involves a single seed match and then extension from both ends until the statistical threshold set is exceeded, then the alignment stops. Therefore, BLASTN is easily parallelized while nucmer is not, and takes much longer to run as a single threaded process. Nucmer is also exceptionally memory intensive and typically only two chimpanzee chromosomes could be aligned at a time with the 384 Gb of RAM available on each of the two servers used in this study (see materials and methods).
Because of the nature of the nucmer algorithm which automatically performs multiple alignments over the entire chromosome sequence, no slicing of the chimpanzee query chromosomes was required. Additionally, in contrast to default recommendations for comparing chimpanzee to human that typically omit sequences less than 95% identity, nucmer parameters were set to allow matching of regions as low as 50% identity. Sequence masking was also omitted to allow for analysis of the entire genome, despite the fact that computational resources were greatly increased.
Resulting data for the returned nucmer identities and length of alignments is given in Tables 4 and 5, respectively. Individual alignments within chromosomes varied in their percent identity between a low of 57% and a high of 100%. The average percent identity across chromosome was 88%. Alignment lengths varied markedly between 20 and 263,000 bases across the entire genome. The average alignment length across chromosomes was 835 bases. For a distribution of average alignment lengths across chromosomes see the plot depicted in Fig. 6. It should be noted that no significant correlation between percent identity and alignment length was detected.
| Chrom | Min | Max | 1st_Qu | 3rd_Qu | SD | Median | Mean |
|---|---|---|---|---|---|---|---|
| 1 | 68.0 | 100.0 | 86.1 | 90.0 | 2.8 | 88.0 | 88.1 |
| 2A | 63.1 | 100.0 | 86.3 | 90.5 | 3.1 | 88.3 | 88.5 |
| 2B | 59.2 | 100.0 | 86.4 | 90.6 | 3.1 | 88.4 | 88.6 |
| 4 | 63.0 | 100.0 | 86.7 | 91.3 | 3.3 | 88.9 | 89.1 |
| 5 | 64.2 | 100.0 | 86.6 | 91.0 | 3.2 | 88.8 | 88.9 |
| 6 | 57.7 | 100.0 | 86.4 | 90.6 | 3.1 | 88.4 | 88.6 |
| 8 | 58.8 | 100.0 | 86.4 | 90.9 | 3.2 | 88.5 | 88.7 |
| 9 | 66.0 | 100.0 | 86.3 | 90.3 | 3.0 | 88.3 | 88.4 |
| 10 | 65.1 | 100.0 | 86.1 | 90.1 | 3.0 | 88.0 | 88.2 |
| 11 | 63.1 | 100.0 | 86.4 | 90.6 | 3.1 | 88.4 | 88.6 |
| 12 | 62.5 | 100.0 | 86.2 | 90.3 | 3.0 | 88.2 | 88.4 |
| 13 | 65.7 | 100.0 | 86.6 | 90.9 | 3.1 | 88.7 | 88.9 |
| 14 | 67.1 | 100.0 | 86.2 | 90.2 | 3.0 | 88.1 | 88.3 |
| 15 | 63.2 | 100.0 | 86.1 | 90.0 | 2.8 | 88.0 | 88.1 |
| 16 | 63.0 | 100.0 | 85.7 | 89.6 | 2.8 | 87.6 | 87.7 |
| 17 | 64.6 | 100.0 | 85.9 | 89.5 | 2.6 | 87.6 | 87.7 |
| 18 | 62.3 | 100.0 | 86.6 | 90.8 | 3.1 | 88.7 | 88.8 |
| 19 | 62.0 | 100.0 | 85.8 | 89.5 | 2.7 | 87.6 | 87.6 |
| 20 | 61.6 | 100.0 | 85.9 | 89.8 | 2.9 | 87.7 | 87.9 |
| 21 | 68.4 | 100.0 | 86.5 | 90.5 | 2.9 | 88.6 | 88.6 |
| 22 | 65.3 | 100.0 | 86.0 | 89.6 | 2.6 | 87.8 | 87.8 |
| X | 56.7 | 100.0 | 86.8 | 91.7 | 3.4 | 89.0 | 89.3 |
| Y | 74.4 | 100.0 | 86.9 | 91.6 | 3.4 | 89.4 | 89.3 |
| Chrom | Min | Max | 1st_Qu | 3rd_Qu | SD | Median | Mean |
|---|---|---|---|---|---|---|---|
| 1 | 58 | 56,920 | 280 | 301 | 339 | 292 | 331 |
| 2A | 25 | 263,000 | 282 | 306 | 644 | 294 | 426 |
| 2B | 54 | 171,800 | 282 | 309 | 720 | 295 | 466 |
| 4 | 54 | 196,900 | 286 | 611 | 921 | 301 | 629 |
| 5 | 54 | 259,300 | 285 | 430 | 856 | 298 | 555 |
| 6 | 20 | 206,100 | 283 | 313 | 778 | 296 | 496 |
| 8 | 54 | 190,800 | 284 | 354 | 884 | 297 | 537 |
| 9 | 54 | 248,200 | 282 | 305 | 694 | 294 | 414 |
| 10 | 54 | 203,000 | 281 | 304 | 698 | 293 | 407 |
| 11 | 56 | 202,000 | 283 | 310 | 785 | 296 | 483 |
| 12 | 20 | 173,000 | 282 | 304 | 659 | 294 | 411 |
| 13 | 54 | 201,700 | 284 | 311 | 896 | 297 | 465 |
| 14 | 54 | 197,400 | 282 | 305 | 768 | 294 | 425 |
| 15 | 54 | 210,000 | 281 | 301 | 668 | 292 | 360 |
| 16 | 53 | 249,200 | 279 | 300 | 547 | 291 | 323 |
| 17 | 56 | 146,800 | 279 | 299 | 337 | 291 | 298 |
| 18 | 55 | 144,800 | 283 | 307 | 933 | 295 | 435 |
| 19 | 54 | 165,600 | 279 | 299 | 292 | 291 | 301 |
| 20 | 55 | 152,600 | 280 | 300 | 686 | 292 | 338 |
| 21 | 55 | 251,700 | 280 | 303 | 1341 | 293 | 370 |
| 22 | 54 | 231,800 | 279 | 299 | 484 | 291 | 301 |
| X | 54 | 221,900 | 287 | 726 | 823 | 305 | 654 |
| Y | 61 | 142,600 | 467 | 1877 | 1961 | 909 | 1468 |
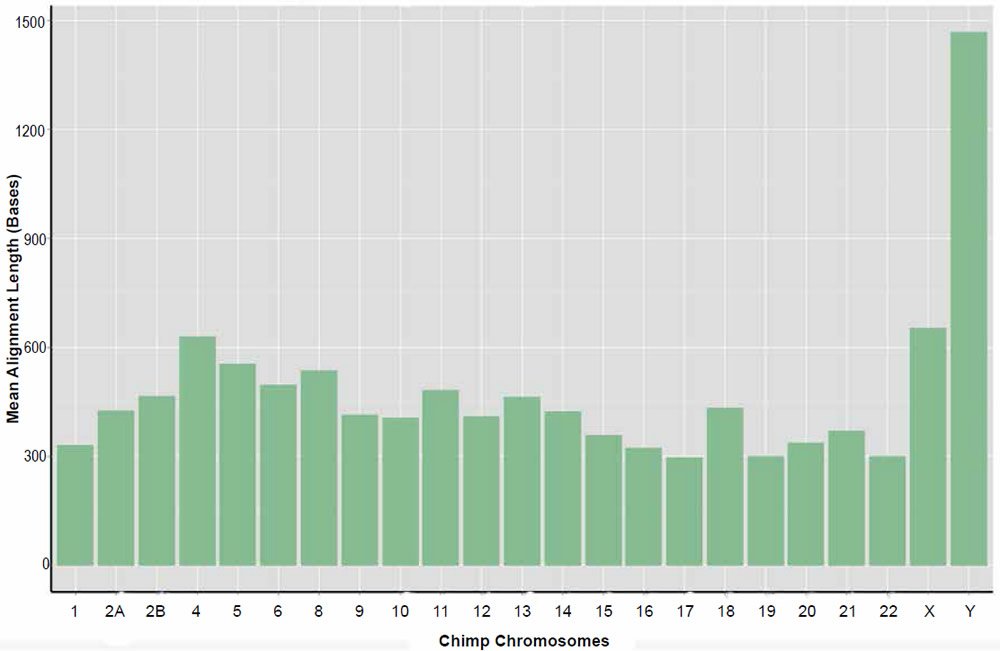
Fig. 6. Average alignment length of the sets of returned aligned sequences for the nucmer algorithm per chimpanzee chromosome queried against their human homolog.
LASTZ Algorithm Analysis
As a third test of genome similarity, the LASTZ algorithm was utilized to compare the entire chimpanzee genome to human, also chromosome-by-chromosome. Like the nucmer algorithm, the LASTZ algorithm goes beyond finding a single defined local alignment and then breaking off. Instead, the LASTZ algorithm uses a process called iterative homology mapping where alignment breakpoints are iteratively mapped through regions of pairwise alignments that eventually also allows the joining of larger alignment clusters. Like nucmer, LASTZ also only runs as a single thread because of this approach and is much slower than BLASTN, although less memory intensive than nucmer.
Based on preliminary studies, it became apparent that sequence slicing of the chimpanzee chromosomes was necessary with LASTZ. Therefore, each chimpanzee chromosome was sliced into 10,000 base fragments to produce sets of query sequences that were each aligned onto the corresponding human chromosome. As with nucmer, parameters were used that allowed the return of DNA identities as low as 50% along with the matching of repetitive sequence.
Resulting data for the returned LASTZ identities and length of alignments is given in Tables 6 and 7, respectively. The returned identities of the LASTZ algorithm were rather surprising and much lower than those returned by BLASTN v2.2.25+ and nucmer. The overall chromosomal average was only 73%, with average chromosomal identity varying between 68 and 78%. Individual alignment identity across the whole genome varied between 51 and 100%. In contrast to nucmer, which produced more aligned sequence than total chromosome length due to multiple overlapping alignments, the statistics of LASTZ represent unique alignments although the lower average identity is surprising. These results indicate that perhaps more research in the optimization of sequence slicing and algorithm parameters needs to be employed for LASTZ.
| Chrom | Min | Max | 1st_Qu | 3rd_Qu | Median | Mean |
|---|---|---|---|---|---|---|
| 1.0 | 55.0 | 99.4 | 64.2 | 68.6 | 66.1 | 67.5 |
| 2.0 | 56.5 | 99.4 | 67.9 | 85.6 | 71.2 | 76.1 |
| 3.0 | 59.5 | 99.5 | 72.3 | 88.9 | 84.3 | 82.0 |
| 4.0 | 57.7 | 99.5 | 72.5 | 87.0 | 78.7 | 79.6 |
| 5.0 | 56.4 | 99.5 | 71.0 | 87.9 | 82.4 | 80.4 |
| 6.0 | 57.1 | 99.5 | 65.3 | 73.8 | 67.7 | 71.9 |
| 7.0 | 56.8 | 99.1 | 66.3 | 69.8 | 68.0 | 68.9 |
| 8.0 | 56.2 | 99.5 | 64.7 | 78.5 | 68.3 | 71.8 |
| 9.0 | 55.8 | 99.4 | 65.6 | 78.9 | 69.3 | 73.0 |
| 10.0 | 57.5 | 99.4 | 66.9 | 80.1 | 70.9 | 74.5 |
| 11.0 | 56.7 | 99.4 | 67.6 | 86.5 | 72.4 | 76.7 |
| 12.0 | 56.4 | 100.0 | 66.0 | 71.6 | 68.5 | 70.9 |
| 13.0 | 56.7 | 99.6 | 65.7 | 74.4 | 69.1 | 72.3 |
| 14.0 | 57.1 | 99.6 | 67.4 | 87.4 | 74.8 | 77.6 |
| 15.0 | 56.6 | 99.5 | 65.6 | 72.7 | 68.5 | 70.3 |
| 16.0 | 56.2 | 99.3 | 65.1 | 72.6 | 67.9 | 69.4 |
| 17.0 | 56.9 | 99.4 | 66.2 | 70.3 | 68.2 | 68.7 |
| 18.0 | 57.4 | 99.5 | 66.9 | 82.4 | 72.4 | 75.1 |
| 19.0 | 55.9 | 99.1 | 66.2 | 70.0 | 68.1 | 68.3 |
| 20.0 | 54.4 | 99.5 | 68.1 | 78.8 | 73.3 | 74.4 |
| 21.0 | 57.2 | 99.5 | 64.5 | 81.4 | 67.3 | 73.8 |
| 22.0 | 56.4 | 100.0 | 66.0 | 73.2 | 69.0 | 70.2 |
| X | 50.9 | 100.0 | 64.4 | 74.3 | 67.9 | 70.2 |
| Y | 53.6 | 98.9 | 69.7 | 74.6 | 71.9 | 73.0 |
| Chrom | Min | Max | 1st_Qu | 3rd_Qu | Median | Mean |
|---|---|---|---|---|---|---|
| 1 | 42 | 9999 | 764 | 1193 | 904 | 1284 |
| 2 | 53 | 10000 | 461 | 5414 | 4255 | 3272 |
| 3 | 109 | 10000 | 4875 | 5890 | 5267 | 5407 |
| 4 | 56 | 10000 | 403 | 5627 | 4696 | 3633 |
| 5 | 67 | 10000 | 4690 | 5827 | 5153 | 4953 |
| 6 | 38 | 10000 | 724 | 4866 | 789 | 2481 |
| 7 | 68 | 9998 | 1080 | 4716 | 4244 | 3517 |
| 8 | 43 | 10000 | 509 | 1629 | 1034 | 1888 |
| 9 | 40 | 10000 | 707 | 4886 | 962 | 2414 |
| 10 | 48 | 10000 | 401 | 4150 | 875 | 2262 |
| 11 | 135 | 10000 | 691 | 5475 | 4664 | 3648 |
| 12 | 36 | 10000 | 650 | 4131 | 754 | 2172 |
| 13 | 38 | 10000 | 618 | 4875 | 867 | 2410 |
| 14 | 46 | 10000 | 3330 | 5674 | 4947 | 4445 |
| 15 | 43 | 10000 | 534 | 992 | 626 | 1172 |
| 16 | 56 | 10000 | 674 | 1714 | 1033 | 1412 |
| 17 | 49 | 9997 | 756 | 3125 | 1207 | 1963 |
| 18 | 42 | 10000 | 472 | 4592 | 842 | 2245 |
| 19 | 36 | 9997 | 1354 | 3753 | 2563 | 2644 |
| 20 | 36 | 10000 | 408 | 4815 | 2306 | 2961 |
| 21 | 45 | 10000 | 798 | 5239 | 1063 | 3255 |
| 22 | 40 | 10000 | 476 | 1215 | 687 | 1278 |
| X | 35 | 10000 | 443 | 1102 | 765 | 965 |
| Y | 38 | 10000 | 4981 | 7989 | 6039 | 6125 |
Summary
A bug or anomaly in the BLASTN algorithm clearly exists in versions 2.2.26+ through 2.2.30+ (five consecutive releases) that omits significant portions of non-similar query sequence under the conditions employed in this study. It should be noted that perhaps this type of behavior is only invoked when attempting to return the top hit—a feature only accessed via a local installation of the algorithm. A typical default BLASTN search when using the NCBI web interface or not invoking the return of only the top hit on a local installation, does not appear to produce this type of behavior because many hits are returned (default = 100 for web interface at http://blast.ncbi.nlm.nih.gov) if any part of the query sequence string has a match in the target database. Nevertheless, this unexpected anomaly largely explains the results obtained in 2013 by this author due to the fact that about 30% of the non-similar sequence queries were not being returned (Fig. 2).
Given that the only apparently intact version of the BLASTN algorithm tested was 2.2.25+, the entire 2013 study previously published by this author was repeated with this version using a fragment slice of 300 bases for each chromosome producing an average overall genome similarity of about 88% identity. Interestingly, this result was within the range of alignment identities (86 to 89%) achieved in a preliminary study done by this author using 40,000 random chimpanzee trace reads that were queried against six different versions of the human genome also using version BLASTN version 2.2.25+ (Tomkins 2011a). However, it should be noted that these are not identical sets of code since software updates have been performed to BLASTN v2.2.25 compared to the version used by this author in 2011.
It should also be noted that sequence slicing the genome into 300 base fragments is a less than ideal method of determining overall identities for large contiguous regions due to the fact that roughly half the mammalian genome contains highly repetitive sequence and a large amount of transposable element content. In fact, transposable element content between humans and chimpanzees differs markedly (Mills et al. 2006). Thus, varying amounts of transposable elements, many of which are about 300 bases long on average, such as alu elements (Mills et al. 2006; Singer 1982), can cause a one-to-one correspondence discrepancy between query and target.
To provide two additional measures of analysis and comparison, both the nucmer (part of the MUMmer package) and LASTZ algorithms were employed in whole chromosome comparisons between chimpanzee and human. However, a close evolutionary relationship between humans and chimpanzees was not assumed in these genome comparison experiments and algorithm parameters allowing matches between genomic regions with similarities as low as 50% sequence identity was allowed (see Materials and Methods for details). Because generous computational resources/assets were available, the matching of repetitive sequence was also employed by omitting sequencing masking.
In the final summary of data, the nucmer results paralleled the reanalysis using BLASTN v2.2.25+, coming in at an overall genome similarity of about 88% identity. However, these results also involved a greater amount of aligned sequence than there was actual chromosome length due to the fact that the results contained a great deal of overlapping alignment amongst the individual returned alignments.
And surprisingly, the LASTZ results which contained only unique alignments, produced an average overall genome similarity of only about 73% sequence identity. However, the LASTZ alignments also did not represent a comprehensive genome alignment survey due to the fact that the query sequences were sliced into 10,000 base fragments and a significant portion of unaligned sequence was not returned. Would the additional returned alignments have raised the overall genome similarity? Perhaps additional work using even smaller sequence slices with LASTZ combined with the investigation of alternative algorithm parameters should be employed.
In summary, it can be fairly well stated that the chimpanzee genome is not 98 to 99% similar to human, but at most no more than about 88% similar overall. However, there are several caveats that must be considered. First, the chimpanzee genomic sequence used in this study was assembled onto the human genome as a framework and thus does not stand on its own merits (Tomkins 2011b). And second, the majority of flow cytometry studies of chimpanzee nuclei along with the cytogenetic analysis of chromosomes indicate a genome size difference of about 8%, with the chimpanzee genome having a significantly larger amount of heterochromatic DNA compared to human (Formenti et al. 1983; Pellicciari et al. 1982, 1988, 1990a, 1990b; Seuanez et al. 1977). Thus, the actual genome similarity with human, even using the high end estimate of 88% for just the alignable regions, is realistically only about 80% or less when the cytogenetic data is taken into account.
References
Bergman, J., and J. Tomkins. 2012. “Is the Human Genome Nearly Identical to Chimpanzee?—A Reassessment of the Literature.” Journal of Creation 26 (1): 54–60.
Buggs, R. 2008. “Chimpanzee?” Reformatorisch Dagblad. http://www.refdag.nl/.chimpanzee_1_282611.
Camacho, C., G. Coulouris, V. Avagyan, N. Ma, J. Papadopoulos, K. Bealer, and T. L. Madden. 2009. “BLAST+: Architecture and Applications.” BMC Bioinformatics 10:421. doi: 10.1186/1471-2105-10-421.
Cosmo, P. 2012. “An Automatic Comparison of the Human and Chimpanzee Genomes.” Progetto Cosmo. http://progettocosmo.altervista.org/index.php?option=content&task=view&id=130.
Ebersberger, I., D. Metzler, C. Schwarz, and S. Pääbo. 2002. “Genomewide Comparison of DNA Sequences Between Humans and Chimpanzees.” American Journal of Human Genetics 70 (6): 1490–07. doi: 10.1086/340787.
Formenti, D., S. Garagna, G. F. De Stefano, and C. Pellicciari. 1983. “Variazioni del Contenuto Nucleare in DNA Negli Hominoidea.” Antropologia Contemporanea 6: 219–24.
Harris, R. S. 2007. “Improved Pairwise Alignment of Genomic DNA.” Ph.D. Thesis. Center for Comparative Genomics and Bioinformatics: The Pennsylvania State University.
Kurtz, S., A. Phillippy, A. L. Delcher, M. Smoot, M. Shumway, C. Antonescu, and S. L. Salzberg. 2004. “Versatile and Open Software for Comparing Large Genomes.” Genome Biology 5 (2): R12. doi: 10.1186/gb-2004-5-2-r12.
Mills, R. E., E. A. Bennett, R. C. Iskow, C. T. Luttig, C. Tsui, W. S. Pittard, and S. E. Devine. 2006. “Recently Mobilized Transposons in the Human and Chimpanzee Genomes.” American Journal of Human Genetics 78 (4): 671–79. doi: 10.1086/501028.
Pellicciari, C., D. Formenti, C. A. Redi, and M. G. Manfredi Romanini. 1982. “DNA Content Variability in Primates.” Journal of Human Evolution 11 (2): 131–41.
Pellicciari, C., D. Formenti, M. Zuccotti, R. Stanyon, and M. G. Manfredi Romanini. 1988. “Genome Size and Constitutive Heterochromatin in Hylobates muelleri and Symphalangus syndactylus and in their Viable Hybrid.” Cytogenetics Cell Genetics 47 (1–2): 1–4.
Pellicciari, C., E. Ronchetti, D. Formenti, R. Stanyon, and M. G. Manfredi Romanini. 1990a. “Genome Size and «C-heterochromatic DNA» in Man and the African Great Apes.” Human Evolution 5 (3): 261–67.
Pellicciari, C., E. Ronchetti, R. Tori, D. Formenti, and M. G. Manfredi Romanini. 1990b. “Cytochemical Evaluation of C-Heterochromatic-DNA in Metaphase Chromosomes.” Basic and Applied Histochemistry 34 (1): 79–85.
Preuss, T. M. 2012. “Human Brain Evolution: From Gene Discovery to Phenotype Discovery.” Proceedings of the National Academy of Sciences USA 109 Supplement 1: 10709–16. doi: 10.1073/pnas.1201894109.
Seuanez, H. N., A. D. Carothers, D. E. Martin, and R. V. Short. 1977. “Morphological Abnormalities in Spermatozoa of Man and Great Apes.” Nature 270 (5635): 345–47. doi:10.1038/270345a0.
Singer, M. F. 1982. “SINEs and LINEs: Highly Repeated Short and Long Interspersed Sequences in Mammalian Genomes.” Cell 28 (3): 433–34.
The Chimpanzee Sequencing Analysis Consortium. 2005. “Initial Sequence of the Chimpanzee Genome and Comparison with the Human Genome.” Nature 437 (7055): 69–87. doi: 10.1038/nature04072.
Tomkins, J. 2011a. “Genome-Wide DNA Alignment Similarity (Identity) for 40,000 Chimpanzee DNA Sequences Queried Against the Human Genome is 86—89%.” Answers Research Journal 4: 233–41. https://answersingenesis.org/genetics/dna-similarities/genome-wide-dna-alignment-similarity-identity-for-40000-chimpanzees/.
Tomkins, J. 2011b. “How Genomes are Sequenced and Why It Matters: Implications for Studies in Comparative Genomics of Humans and Chimpanzees.” Answers Research Journal 4: 81–88. https://answersingenesis.org/genetics/dna-similarities/how-genomes-are-sequenced-and-why-it-matters/.
Tomkins, J. 2013. “Comprehensive Analysis of Chimpanzee and Human Chromosomes Reveals Average DNA Similarity of 70%.” Answers Research Journal 6: 63–69. https://answersingenesis.org/answers/research-journal/v6/comprehensive-analysis-of-chimpanzee-and-human-chromosomes/.
Tomkins, J. P. 2014. “Comparison of the Transcribed Intergenic Regions of the Human Genome to Chimpanzee.” Creation Research Society Quarterly 50 (4): 212–21.
Tomkins, J., and J. Bergman. 2012. “Genomic Monkey Business—Estimates of Nearly Identical Human-Chimp DNA Similarity Re-evaluated Using Omitted Data.” Journal of Creation 26 (1): 94–100.


