The views expressed in this paper are those of the writer(s) and are not necessarily those of the ARJ Editor or Answers in Genesis.
Abstract
Radiocarbon dating of ancient human remains has been used to expand the perceived timescale for human existence in Eurasia to over 40,000 years based on the uniformitarian assumption that atmospheric carbon 14 (C-14) concentration is unchanged relative to modern times. Stated as scientific facts with no discussion of the assumptions involved, these excessive ages challenge the record of world history recorded in the Bible and lend support to the notion that man has evolved from apes. Such reasoning is unacceptable by those who believe that the Bible is God’s Word which cannot be overturned by any so-called “scientific” arguments. Rather, it is science in general, and radiocarbon dating in particular, which must be interpreted in a manner consistent with the true history of the world. Radiocarbon dating must be calibrated to fit a biblical timescale. The finding of C-14 in fossil fuels, which were derived from plants buried in the Flood, suggests a starting point for the correct calibration of radiocarbon dating by providing an ancient carbon of known age in which the C-14 content can be measured. The low content of C-14 in fossil fuels implies that the atmospheric C-14 level in the pre-Flood world was less than 1% of today’s level, in dramatic contrast to the uniformitarian assumption of stable atmospheric C-14 levels. The process that has caused the increase in atmospheric C-14 since then is not known, but the increase was very rapid in the first centuries after the Flood. Based on C-14 measurements from two ancient carbons with biblical dates, the Flood at 2500 B.C. and the Joseph famine at 1875 B.C., and from tree rings from 1000 B.C., a radiocarbon dating curve is constructed to connect the Flood to 1000 B.C., the time of King David. Given the many assumptions and difficulties involved with C-14 measurements radiocarbon dating on a biblical timescale can only provide an approximate date for ancient carbons and cannot supplant absolute dating based on reliable historical records.
Introduction
The Radiocarbon Revolution began in 1946 when Willard Frank Libby found a method of dating ancient biological carbons by their carbon 14 (C-14) content (Arnold and Libby 1949). For this invention, he received the Nobel Prize in 1960 (American Chemical Society 2023). Since then, archaeologists have had a powerful tool for the absolute dating of ancient carbons. Although the method of radiocarbon dating involves many assumptions and is fraught with pitfalls of misinterpretation, archaeological science has been greatly advanced by radiocarbon dating (Steinmeyer 2022).
But there has also been a big downside to this revolution because radiocarbon dates are often accepted as scientific facts without any consideration of the assumptions required to get the dates. A major assumption is that the atmospheric C-14 concentration varies around a steady state level, so its concentration was not radically different in ancient times. This uniformitarian assumption is particularly problematic because evolutionists have used radiocarbon dating of ancient human remains and artifacts to greatly expand the perceived timescale of human history to the limits imposed by the C-14 decay rate, which is up to 55,000 years based on current measurement techniques. Once the biblical timescale has been denied by their C-14 assumptions it is a simple matter for them to promote the notion of human evolution from ape ancestors over millions of alleged years. For example, Neanderthal remains have been radiocarbon dated to over 40,000 years of age and Neanderthals have been portrayed as primitive men left behind as modern men rapidly evolved (Habermehl 2010; Hajdinjak et al. 2018; Pääbo 2022). These ancient radiocarbon ages are presented as unchallengeable scientific facts, which cause many Christians to doubt the accuracy of the Genesis record. While radiocarbon dating is accurate back to about 1000 B.C., the expansive radiocarbon timescale, going back tens of thousands of years, is incompatible with the biblical record (Carter 2022). The assumptions behind radiocarbon dating which give rise to these extreme ages are rarely discussed in the secular literature, nor are they understood by the general public. They are simply accepted as true on the solid foundation of radiocarbon dating. But that foundation is not nearly as secure as most think.
One major crack in the foundation of radiocarbon dating is the existence of C-14 in fossil carbons thought to be millions of years old. It has been known since the 1950s that coal, gas, and oil deposits contain C-14 (Riddle 2019; Whitelaw 1970), a fact firmly established by the findings of the RATE team from the Institute for Creation Research (ICR) that, “every portion of the Phanerozoic record show detectable amounts of C-14” (Baumgardner et al. 2003; Snelling 2008). This Phanerozoic record also includes dinosaur bones and other fossils which contain C-14 (Thomas and Nelson 2015). The secular world has had a hard time accepting these facts because they think coal and fossils are millions of years old. The coal seams of the world are dated by the secular timescale from the Carboniferous Period, 358.9 million years ago, to the Eocene epoch, up to 33 million years ago. So, coal should be “carbon 14 dead,” meaning coal should have no C-14 because of its short half-life of about 5,700 years. Thirty-three million years span 5,789 C-14 half-lives, but if the whole earth were made of C-14, there would not be a single atom of C-14 left after 168 half-lives, less than 1 million years (Carter 2022). The fact that coal, gas, oil, and fossil deposits contain measurable amounts of C-14 means that the plants and animals that formed these ancient carbons died only a few thousand years ago. Coal is not millions of years old, and neither are dinosaur bones.
How can the cracked foundation of secular radiocarbon dating be repaired, correcting the notion that humans have been around for over 50,000 years? One way would be to recalibrate the secular radiocarbon dating curve to become a biblical radiocarbon dating curve. This can be done simply by assuming that coal, gas, and oil are from plants buried in the global Flood, which occurred about 4,500 years ago, and that the amount of C-14 remaining in these fossil fuels today provides a way to estimate the atmospheric concentration of C-14 at the time of the Flood. A calculation based on these biblical assumptions may seem simple, but it is quite complicated, as will be shown below.
Calibration of radiocarbon dating
Radiocarbon dating is based on the clock-like principle that the amount of C-14 remaining in a carbon sample decreases with age due to radioactive decay (American Chemical Society 2023). The clock begins ticking when the animal or plant dies. To compute the time since the thing died, the starting amount of C-14 must be known or assumed. Therefore, the method must be calibrated according to the atmospheric C-14 concentration that prevailed while the plant or animal lived. Since the atmospheric C-14 concentration fluctuates, this calibration is by no means straightforward, as will become evident in what follows.
Carbon-14 is produced from nitrogen 14 in the atmosphere when energetic neutrons strike a nitrogen nucleus, knocking out a proton. These fast neutrons may be generated by cosmic rays and gamma rays striking the stratosphere, or by aboveground nuclear weapons testing, which has been banned since the 1960s (Hua, Barbetti, and Rakowski 2013). The C-14 rapidly combines with oxygen to make carbon dioxide which then is distributed, at different rates, into the world’s carbon reservoirs, the atmosphere, oceans, biosphere, and soils. In the absence of aboveground nuclear testing (Kanu et al. 2016), the concentration of C-14 in the atmosphere is influenced by the cosmic ray and gamma ray flux, which is variable, and by the burning of fossil fuels that release carbon dioxide greatly depleted in C-14 relative to the atmospheric concentration. So, one cannot say that the concentration of C-14 in the atmosphere is at a steady state (Riddle 2019, 82). For this reason, radiocarbon dating must be calibrated by measuring the C-14 content of carbons of known age to make a calibration curve for dating ancient carbons of unknown age.
Tree rings are thought to provide a source of carbons of known age. If each tree ring represents one year, they can be counted back in time and the C-14 measured in samples from the tree rings can be used to make a calibration curve. Theoretically, the tree ring series can be extended in time by a tree ring pattern matching with nearby dead trees and wooden beams from old buildings. The science of dendrochronology (tree ring dating) has advanced so that the most recent radiocarbon calibration curve, IntCal20, is based on tree rings back to 14,000 years before the present (B.P.) on the conventional timescale. The calibration is extended even further back to 55,000 years using C-14 measurements in speleothems, corals, and lacustrine sediments (Reimer et al. 2020). But this timescale is suspect due to several problems and assumptions involved with the method.
One major difficulty involves the tree ring pattern matching needed to allow a tree ring series to be extended back in time. A careful investigation of how tree ring series are constructed reveals that the C-14 content of the tree rings is used as an aid in pattern matching, especially for the more ancient sections of the tree ring series. The C-14 content of the tree rings is used to date the tree rings, and then the tree rings give the C-14 content at various dates (Bayliss et al. 2020). So, radiocarbon calibration is at least partly based on a circular process which does not lend credence to the method (Hebert, Snelling, and Clarey 2016). Mismatching of tree rings so that overlapping patterns are construed as consecutive would greatly expand the timescale with false “years.” This difficulty of pattern matching suggests that dendrochronology cannot reliably provide carbons of known age for radiocarbon calibration.
Another fundamental problem is the assumption that the tree rings are formed annually, which has been demonstrated to be often wrong. Tree rings are formed by the differential growth of the tree’s cambium layer under the various weather conditions encountered throughout the growing season. In temperate climates, the cambium layer typically grows rapidly in the spring, more slowly in the summer, and not at all in the winter. This will produce an annual ring pattern. However, under drought conditions, several tree rings may be produced in the growing season due to occasional episodes of rain (Ricker et al. 2020). The notion that most tree rings represent yearly growth patterns was dispelled by a study lasting over 20 years in which the tree rings of 25 species of trees were sampled throughout multiple growing seasons. They found that out of a total of 919 tree-growth-years sampled, 63% had multiple growth rings per year (Glock, Studhalter, and Agerter 1960, 121). Multiple tree rings per year may be the rule, not the exception, especially for some tree genera, such as the pines. Other trees, such as oaks, are less likely to form multiple rings per year, although this may be due to milder weather conditions in their habitat. No one knows how the formation of tree rings was affected by severe weather conditions during the Ice Age. So, the science of dendrochronology has more problems the further back in time one goes since the weather patterns were different then. Diseases may also affect tree ring formation. Defoliation by insects may produce several rings in one growing season, and periodic infestations may produce repetitive tree ring patterns difficult to match to make a tree ring series (Friedrich et al. 2004). Because multiple tree rings can occur in a year, absolute dates cannot be known merely by counting tree rings. A tree ring chronology is only a tree ring history with no definite attachment to any calendar. (Hebert, Snelling, and Clarey 2016). These calibration problems cast a shadow over the method of radiocarbon dating. But there is another source of ancient carbon that may be used to calibrate radiocarbon dating for older samples: the carbon from plants buried in the global Flood.
The finding that coal contains C-14 is a huge problem for those who want coal to be from plants that lived millions of years ago. Attempts to shrug off this inconvenient fact as mere contamination (Taylor, Southon, and Santos 2018) from inevitable sample handling in the lab have failed along with the ad hoc explanation that the C-14 is due to radioactive decay of uranium in the rock layers near the coal seams (Cupps 2017; Rupe and Sanford 2017, 264). However, the low amount of C-14 in coal also presents a challenge for the creationist who believes that coal is derived from plants buried 4,500 years ago in the Flood. If the C-14 concentration in the atmosphere at the time of the Flood were the same as it is today, then one would expect the C-14 content of coal to be more than 50% of today’s concentration. This is because less than one half-life of C-14 has expired since the Flood. But coal has less than ½ of 1% of the current C-14 concentration. The obvious answer to this enigma is that the C-14 content of the atmosphere at the time of the Flood was less than 1% of the current atmospheric content. The less C-14 in the ancient carbon, the older the carbon seems to be given an assumed starting amount of C-14. This explains the extreme ages assigned to the carbons of Neanderthals who probably lived within a few generations of the Flood. The C-14 concentration in the atmosphere was much less back then, and much less in the foods Neanderthals ate, and therefore much less in their bones. Neanderthal remains have been radiocarbon dated to between 44,690- and 37,800-years B.P. (Hajdinjak et al. 2018) based on the low C-14 content of their teeth and bones. The amount of C-14 found in these Neanderthals is indeed very low, but it is twice the amount found in coal, as will be detailed in this paper. Because the amount of C-14 in Neanderthals is greater than the amount found in coal, the Neanderthals seem to have lived after the Flood. So, the radiocarbon ages assigned to these Neanderthals by Hajdinjak et al. (2018) is far too old because they assume the atmospheric C-14 level is unchanged. One can propose several explanations for why atmospheric C-14 was very low in the pre-Flood world (Baumgardner et al. 2003). But the key point is that the C-14 measured today in plants buried in the Flood provides a starting point to recalibrate the radiocarbon curve to a biblical timescale.
A model of post-Flood atmospheric C-14
If the C-14 concentration in the atmosphere was less than that of today at the time of the Flood, then clearly the C-14 concentration has increased during the several thousand years since then. This increase may have been gradual or sudden, or at a variable rate. To simplify the math, a gradual increase will be assumed such that the C-14 concentration of the atmosphere begins to increase after the Flood and eventually reaches a hypothetical steady state approximating today’s level. The change in atmospheric C-14 concentration over time can then be modeled by equation 1.
C(t) is the concentration of C-14 in the atmosphere at time t after the Flood. dC(t)/dt is the rate of change in atmospheric C-14 concentration. R(in) is the rate of C-14 entering the atmosphere from some process, such as cosmic rays generating C-14 in the stratosphere. R(out) is the rate of loss of C-14 from the atmosphere, which is due to nuclear decay, a time-dependent variable. R(out) will increase as the amount of C-14 in the atmosphere increases during the years after the Flood. For simplicity, the R(in) is assumed to be a constant rate. Because nuclear decay of C-14 follows first-order kinetics, R(out) equals C(t)e-kt where k is the radiocarbon decay constant. Substituting gives equation 2.
A simplification of the solution to this differential equation has the form of equation 3.
Equation 3 is the curve that will be fitted to recalibrate the secular radiocarbon curve, allowing the radiocarbon dates to be adjusted to the changing concentration of C-14 in the atmosphere and forming the basis of a biblical radiocarbon dating scale. The curve will apply for time, t, in the range of 0 to 1,500 years post-Flood. By equation 3, C(t) increases rapidly at first from C(0), the concentration of C-14 at the time of the Flood, and then levels off to approach S, a presumed steady-state level of C-14 in the atmosphere.
Methods
Recalibration of the C-14 curve from a secular to a biblical timescale was done by fitting equation (3) to three data points. Each data point was a measured C-14 value from ancient carbon of a specific date. The C-14 values are expressed as percent modern carbon (pMC), which is 100 times the ratio of C-14 to C-12 in the sample divided by the same ratio prevailing in the atmosphere in modern times. Here, “modern times” requires some explanation. The age of zero for radiocarbon is arbitrarily set to A.D. 1950 but the C-14 content of the atmosphere in A.D. 1950 is assumed to be the value found in wood that grew in A.D. 1890, before human activity, specifically the burning of fossil fuels in the industrial age, had diluted the C-14 concentration in the atmosphere (Stenström et al. 2011). So, by convention the data points used for radiocarbon calibration have ages defined as years before A.D. 1950.
The first data point chosen was the date of the global Flood. A Flood date of 2500 B.C. (range 2715 B.C. to 2285 B.C.) was selected according to Jeanson (2019). The C-14 pMC for organisms buried in the Flood was set to 0.292 (± 0.162), the average for 40 phanerozoic biological carbon samples measured by the ICR RATE team (Baumgardner et al. 2003).
The second data point was taken from the IntCal20 radiocarbon curve. On August 28, 2023, the IntCal20 northern hemisphere radiocarbon age calibration curve was downloaded from the IntCal20 website (https://www.intcal.org/curves.html) (Reimer et al. 2020). This calibration curve was constructed from tree ring data back to 14,000 years B.P. and from speleothems, lacustrine, and marine sediments, and corals back to 55,000 years B.P. By convention, the measured C-14 levels were converted to radiocarbon ages using equation 4. Here “t” is the age of the sample, “pMC” is the ratio of C-14 to C-12 expressed as the percent modern carbon in the sample, and 5,568 is the half-life of C-14 as estimated in the 1940s when Libby did his work. Equation 4 is derived from equation 5, which gives the amount of C-14 remaining in the sample (pMC) after time t if the half-life of C-14 is 5,568 years.
The IntCal20 file was augmented with a column for pMC based on equation 5 using the listed conventional C-14 age as t. A plot was made of the conventional C-14 age versus the tree-ring calibrated age (calBP) from this data file (fig. 1). This plot showed correspondence between the C-14 age and the calBP from the present, which by convention is A.D. 1950, until around 3,000 years B.P., whereupon the two lines separate (fig. 2). Since 3000 B.P. is approximately 1000 B.C., this date was chosen as the late data point for the curve fit to the biblical timescale. On the IntCal20 calibration curve, 70.3 pMC was the C-14 value for 1000 B.C. which is 2,950 years B.P. This was the second data point, the most recent one, for the curve fit.
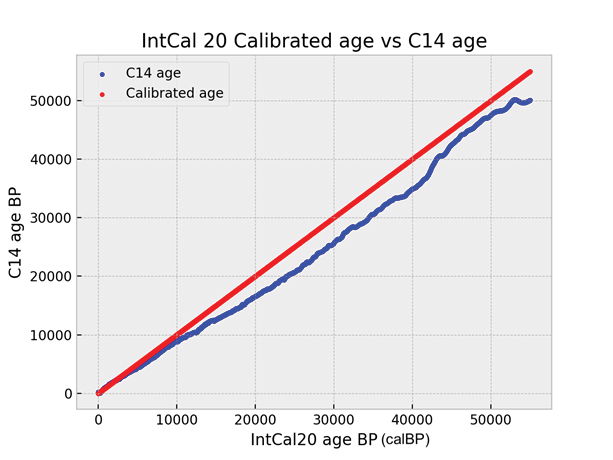
Fig. 1. A plot of C-14 age versus calibrated age (calBP) spanning 55,000 secular years from the IntCal20 northern hemisphere radiocarbon age calibration curve. 0 B.P. is 1950, by convention. The C-14 age B.P. in IntCal20 is based on equation 4, t = -5,568 log2(pMC/100), where t is the C-14 age in years and pmc is the measured C-14 given as the percent modern carbon.
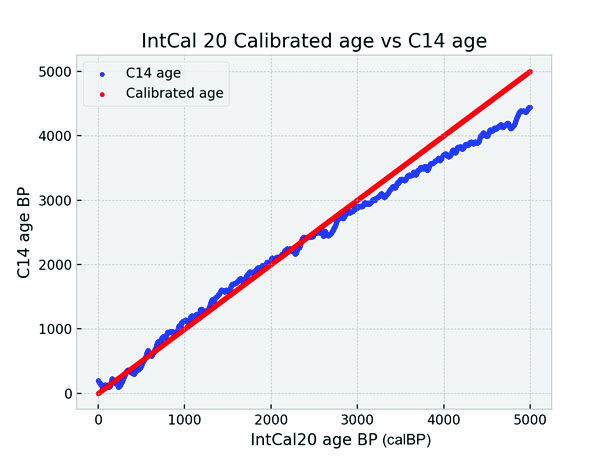
Fig. 2. A plot of C-14 age versus calibrated age (calBP) spanning 5,000 years from the IntCal20 northern hemisphere radiocarbon age calibration curve. 0 B.P. is 1950, by convention. The C-14 age B.P. in IntCal20 is based on equation 4, t = -5,568 log2(pMC/100), where t is the C-14 age in years and pmc is the measured C-14 given as the percent modern carbon.
Perhaps some justification is required here for this choice of 1000 B.C. as the upper end of the biblical timescale recalibration curve. The Intcal20 data shows a sudden change at 1000 B.C., namely the separation of the C-14 ages from the tree ring counts. From the present back to 1000 B.C. there was good correspondence between the two. So, what caused the separation to suddenly begin at 1000 B.C.? Among the several possible explanations is that the separation is due to the convention of using Libby’s original C-14 half-life estimate, 5,568 years, rather than the commonly accepted C-14 half-life of 5,730 years. But, if the C-14 ages of Intcal20 are recalculated using a half-life of 5,730, the pattern of line separation seen in figs. 1 and 2 is unchanged. A better explanation, in my opinion, is that the Intcal20 curve is accurately calibrated back to 1000 B.C. so that it will give valid radiocarbon ages for C-14 measurements of carbons younger than 1000 B.C. How this accuracy was achieved is a mystery hidden in the methods used to extend the dendrochronology by tree ring pattern matching, discussed below. As a quality control measure, maybe the Intcal20 curve was validated, and adjustments made to the dendrochronology, by dating artifacts of known age back to 1000 B.C. But no artifacts of known age could be obtained for older dates. This is certainly one possible explanation since carbons of known age become exceedingly rare in the second millennium B.C. (Tyler 1978).
A third C-14 value between the first two was chosen for the curve fit by correlating the Neolithic Decline, a population collapse, with the Joseph famine of Genesis 41. According to the secular timescale, the Neolithic Decline occurred around 5,400 years B.P. The Joseph famine was in full swing in 1875 B.C., 625 years after the Flood, when Jacob and his children entered Egypt (Whitcomb 1993). Therefore, the third C-14 value would be the pMC of human remains from the Neolithic Decline and this would be set to a date of 1875 B.C. The C-14 pMC for human remains from the Neolithic Decline was obtained as follows. The file “v52.2_1240K_public.txt” containing metadata of 12,650 samples of human remains was downloaded from the Allen Ancient DNA Resource (AADR) (https://reich.hms.harvard.edu/allen-ancient-dna-resource-aadr-downloadable-genotypes-present-day-and-ancient-dna-data) on August 16, 2022. This will be called the “Allen dataset.” A histogram was made of the Allen dataset samples from Western Eurasia whose radiocarbon ages placed them between 7,000 and 3,000 years calBP. Western Eurasia was defined as latitudes north of 30° and longitudes between –10 and 60°. These coordinates included all of Europe, North Africa, the Middle East, and Asia west of the Urals. There was a sharp decrease in the number of samples just after 5,400 years B.P. consistent with the time of the Neolithic Decline on the secular timescale. Thirty-four samples in the Allen dataset had death dates between 5,400 to 5,300 B.P. The average date for these 34 was 5,390 ± 10.9 years calBP. From the IntCal20 curve, 5,390 calBP has a C-14 age of 4670 B.P. Using t = 4,670 in equation 5 gives the average value of C-14 as 55.9 pMC for people who died in 1875 B.C. This was the third data point for the curve fit. The recalibration curve of the form given in equation 3 was then fitted using a Python script to produce equation 6. This equation applies for 1,500 years, from 2500 B.C. to 1000 B.C., that is from the Flood to the time of King David.
This recalibration curve (equation 6) can be solved for the number of years post-Flood (t), giving equation 7.
The process of converting secular ages given in the Allen dataset to biblical ages is as follows. For each sample in the dataset, both the calibrated age (calB.P.) and the C-14 age are listed. The C-14 age is used for t in equation 5 to calculate the C-14 content (pMC). This pMC is used in equation 7 to compute the years post-Flood, which is t in equation 7. The post-Flood years are subtracted from 2500 B.C. to get the calendar date.
Carbon-14 ages of male samples from the Allen dataset were converted to the biblical timescale according to the above method and those in Y chromosome haplogroups G, IJ, and R were plotted to show the settlement of Western Eurasia between the Flood and 1000 B.C. Western Eurasia is defined as latitudes north of 30° and longitudes –10° to 60°, which includes countries of Europe, North Africa, the Middle East, and Asia west of the Urals.
The biblical radiocarbon curve derived from the IntCal20 curve is in the file “IntCal20_pmc_biblical_date_age.txt” which is available online in a repository at Zenodo (https://zenodo.org/deposit/8351904). A Python script, “Biblical_date_from_radiocarbon.py”, was made using equation 6 so that secular dates older than 1000 B.C. can be converted to biblical dates. This Python script is also available in the Zenodo repository. An online application for converting C-14 ages and calibrated radiocarbon ages (calBP) to the biblical timescale is at this URL: https://biblical-radiocarbon.shinyapps.io/biblical_c14py/.
Radiocarbon ages for Egyptian Pharaohs were downloaded from The Egyptian Radiocarbon Database of the Oxford Radiocarbon Accelerator Unit on January 21, 2023. A file was made from this database by averaging the radiocarbon samples for each listed Egyptian Pharaoh and adding a column for the C-14 content (pMC) based on equation 5, and columns for the recalibrated biblical age and date based on equation 6. This file, “Pharaoh_radiocarbon_recalibrated_ages.txt”, is also available in the Zenodo repository.
Results
Figs. 1 and 2 are plots of C-14 age versus calibrated age (calBP) from the IntCal20 radiocarbon calibration curve. The timespan of fig. 1 is from the present (A.D. 1950) to 55000 B.P. and the timespan of fig. 2 is from the present to 5000 B.P. according to the secular timescale. The red line is the secular calibrated age (calBP), and the blue line is the conventional C-14 age, both taken directly from the IntCal20 file. While the C-14 age and the calibrated age agree from the present back to 3000 B.P., thereafter the two lines diverge. This failure occurs around 1000 B.C., suggesting that the assumption of constant atmospheric C-14 content begins to “go off the rails” at 1000 B.C. so all older dates are wrong. For this reason, 1000 B.C. was chosen as a data point for the recalibration and the IntCal20 C-14 value for 1000 B.C. was used as the late endpoint on the fitted curve (equation 6).
The Neolithic Decline was identified in the Allen dataset histogram by the sharp drop in samples dated just after 5400 B.P. on the conventional timescale (fig. 3). This notch is indicated with the black line. The 34 samples dated between 5,300 and 5,400 calBP, representing those who died in the decline, are listed in Table 1 along with their calBP and C-14 ages, their sex, and their country. All but 1 of the 34 died at the onset of the notch, between 5,375 and 5,400 calBP.
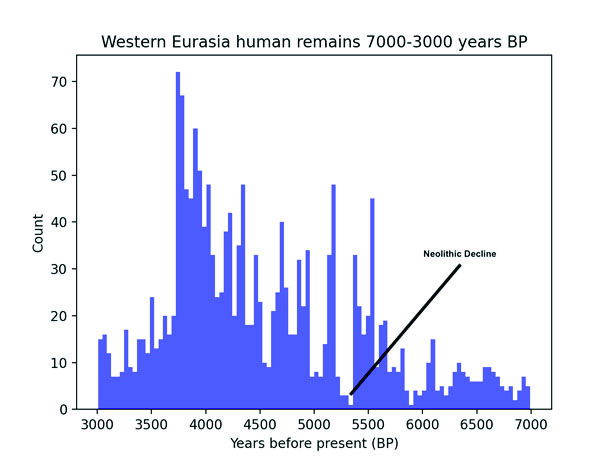
Fig. 3. A histogram of samples from the Allen Ancient DNA Resource of human remains found in Western Eurasia of people who died between 7,000 and 3,000 years B.P. on the IntCal20 radiocarbon timescale (calBP). The Neolithic decline is indicated by the black line, where the population collapsed just after 5,400 years B.P.
Table 1. AADR samples from Western Eurasia of people who died during the Neolithic Decline, 5400–5300 B.P. From “v52.2_1240K_public.txt.” “Index” is the Allen dataset index. “ID” is the sample identification. “Country” is the location of the sample find. “calBP” is the secular radiocarbon age according to IntCal20 calibration. “C14_ageBP” is the conventional C-14 age according to IntCal20 calibration, which is based on Equation 4. “U” is unknown sex. “UK” is United Kingdom.
| Index | ID | Country | Sex | calBP | C14_age BP |
|---|---|---|---|---|---|
| 1717 | I17310 | Czech | M | 5397 | 4670 ± 30 |
| 2128 | I15648 | Czech | M | 5397 | 4690 ± 25 |
| 2130 | I16092 | Czech | M | 5385 | 4615 ± 25 |
| 2147 | I7950 | Czech | F | 5398 | 4655 ± 25 |
| 2935 | I2605 | UK | F | 5397 | 4658 ± 31 |
| 3464 | PSS4693 | France | F | 5396 | 4650 ± 45 |
| 3486 | ROUQCC | France | M | 5346 | 4595 ± 20 |
| 3494 | I18426 | France | U | 5396 | 4650 ± 35 |
| 5331 | prs008/009 | Ireland | M | 5398 | 4630 ± 22 |
| 5354 | PB186 | Ireland | M | 5393 | 4638 ± 36 |
| 5360 | PB754 | Ireland | F | 5375 | 4622 ± 41 |
| 5365 | PN12 | Ireland | M | 5383 | 4629 ± 41 |
| 5806 | R24 | Italy | F | 5396 | 4700 ± 20 |
| 8584 | GB | Romania | F | 5389 | 4621 ± 28 |
| 8744 | I6266 | Russia | M | 5385 | 4615 ± 25 |
| 9130 | SA6001 | Russia | F | 5397 | 4673 ± 28 |
| 9134 | AY2001 | Russia | F | 5397 | 4636 ± 27 |
| 9373 | I2636 | UK | F | 5397 | 4651 ± 33 |
| 9374 | I2637 | UK | M | 5375 | 4697 ± 33 |
| 9375 | I2650 | UK | M | 5380 | 4754 ± 36 |
| 9388 | I2988 | UK | F | 5397 | 4645 ± 29 |
| 9392 | I3136 | UK | F | 5397 | 4665 ± 30 |
| 9410 | I2660 | UK | M | 5394 | 4631 ± 29 |
| 9802 | ATP3 | Spain | M | 5397 | 4650 ± 30 |
| 9995 | I7594 | Spain | F | 5396 | 4670 ± 22 |
| 10012 | I8568 | Spain | F | 5387 | 4615 ± 20 |
| 10013 | I7595 | Spain | F | 5396 | 4670 ± 23 |
| 10351 | ans005 | Sweden | F | 5367 | 4640 ± 70 |
| 10968 | ART019 | Turkey | M | 5393 | 4623 ± 24 |
| 10978 | ART024 | Turkey | M | 5384 | 4614 ± 24 |
| 11042 | IKI016 | Turkey | F | 5396 | 4671 ± 22 |
| 11047 | IKI030 | Turkey | F | 5397 | 4635 ± 26 |
| 11048 | IKI034 | Turkey | F | 5392 | 4623 ± 26 |
| 11221 | I4110 | Ukraine | F | 5394 | 4625 ± 25 |
Fig. 4 is a plot of biblical age derived from equation 6 (y-axis) versus secular radiocarbon age (calBP) from the IntCal20 curve (x-axis). The blue-shaded area represents Flood date uncertainty, which at the time of the Flood was ±215 years (Jeanson 2019). Because the data point from the IntCal20 curve at 1000 B.C. is where biblical and secular scales merge, the uncertainty is diminished proportionally over time from the Flood to 1000 B.C. An instructive aspect of this plot is how 45,000 years of alleged Stone Age history collapses into the 300 years post-Flood. This means the Neanderthals of the Pleistocene lived just a few generations after the Flood and the Stone Age only lasted a few centuries.
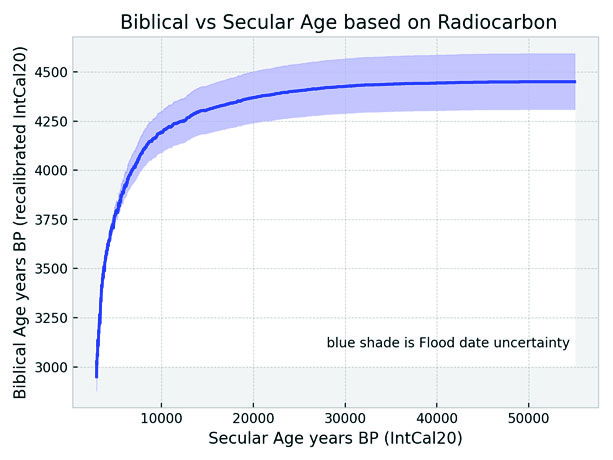
Fig. 4. A plot of the biblical age versus the secular age (calBP) where the biblical age is derived from the IntCal20 C-14 age using equation 5 to get the C-14 pMC and equation 7 to get the years post-Flood. The biblical age is calculated by subtracting the years post-Flood from the Flood date of 2500 B.C. and then adding 1,950 years to it. The blue shaded area is Flood date uncertainty which is ± 215 years around 2500 B.C. Note that 2500 B.C. is 4,450 years B.P. since the present is 1950 by convention.
Fig. 5 is a plot of C-14 content, in pMC, versus post-Flood calendar dates based on the radiocarbon recalibration curve (equation 6). Again, the blue-shaded area is due to Flood date uncertainty. According to the recalibration curve, the C-14 content is what should be measured today in ancient carbon from living things that died after the Flood. The only data in fig. 5 is that of the three data points used to make equation 6. It is noteworthy that the C-14 content of living things in the pre-Flood world was so low compared to today, that the curve is very steep on the left, at the Flood and soon after. This means large differences in C-14 will make small differences in the post-Flood calendar date. For example, the Allen dataset lists the Mezmaiskaya 2 Neanderthal as having lived 39,700 ± 1,100 years calBP, which corresponds to a C-14 value in the range 0.62 to 0.82 pMC, more than double the C-14 found in plants buried by the Flood. According to equation 6, this Neanderthal lived four years after the Flood. This cannot be true unless this Neanderthal was one of Noah’s sons! So, ancient carbons with C-14 values less than 10 pMC cannot be accurately dated relative to the Flood date using equation 6 due to the rapidly changing atmospheric C-14 level indicated by the steepness of the curve close to the Flood date.
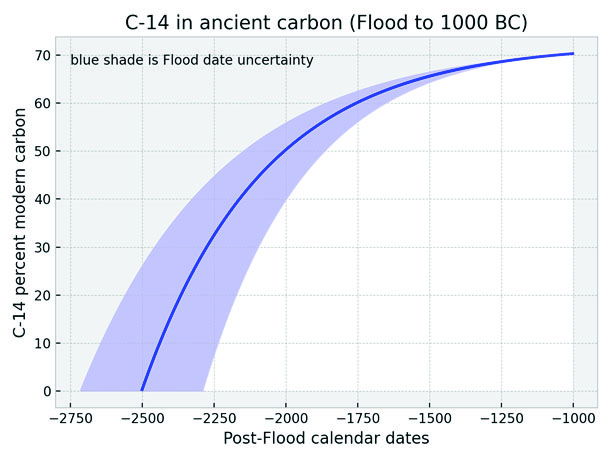
Fig. 5. A plot of the amount of C-14 measured today in ancient carbon versus the post-Flood calendar date of death of that ancient carbon. The C-14 pMC is from equation 5 using as t the C-14 date from the IntCal20 radiocarbon calibration curve. The post-Flood calendar date is calculated using C-14 pMC in equation 7 to get the years post-Flood which is then subtracted from the Flood date of 2500 B.C. B.C. dates are given as negative numbers. The blue shaded area is Flood date uncertainty which is ± 215 years around 2500 B.C.
The Allen dataset gives C-14 ages of human remains alleged to span over 25,000 years of pre-history. When the biblical radiocarbon timescale is applied to these C-14 ages the people are found to have lived after the Flood. Fig. 6 is a histogram of recalibrated C-14 ages based on the biblical radiocarbon timescale for Allen dataset Y chromosome samples showing the settlement of Western Eurasia between the Flood and 1000 B.C. Only haplogroups G, IJ, and R are represented since most samples were in these haplogroups. The x-axis is post-Flood B.C. calendar dates. The first men to arrive in Western Eurasia were in the IJ haplogroup. Between 2200 and 1700 B.C., many men in the G haplogroup migrated to Western Eurasia. The famous “Ötzi” the iceman is in the G haplogroup (Keller et al. 2012). His calibrated age in the Allen dataset is 5199 cal B.P. (3249 B.C.) and his conventional C-14 age is 4555 B.P., which converts to a C-14 value of 56.7 pMC, giving a post-Flood date of 1854 B.C. for Ötzi’s death using equation 7. So, by this C-14 recalibration, Ötzi appears to have lived in the population rebound a generation after the Joseph famine. Although there were R men in Western Eurasia by 100 years after the Flood, large numbers of men of the R haplogroup are seen to have arrived in Western Eurasia after 1800 B.C. R men dominate the Western Eurasian population throughout the Bronze Age, and they continue to dominate Western Europe today. According to this histogram, eight men in the IJ haplogroup arrived within a few years of the Flood. Clearly, their remains have been misdated, possibly due to the rapidly increasing atmospheric C-14 level which renders radiocarbon dating unreliable within the first decades after the Flood. The average C-14 value for these eight men is 4.91 pMC. When the atmospheric concentration of C-14 is rapidly increasing, as it was after the Flood, samples with C-14 less than 10 pMC cannot be reliably dated.
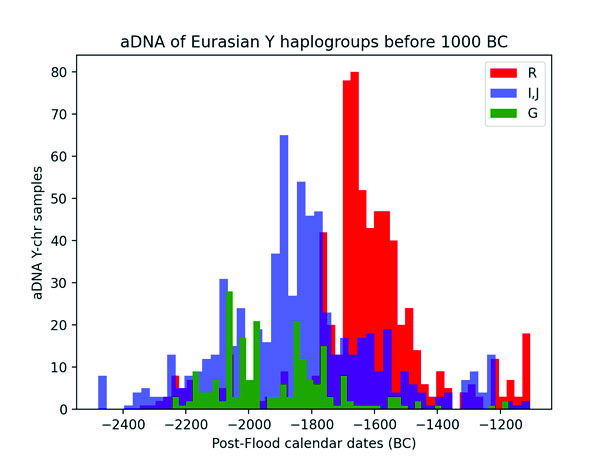
Fig. 6. A histogram of Western Eurasian male samples in Y chromosome haplogroups G, IJ, and R from the Allen Ancient DNA Resource with calBP ages over 3,000 years B.P. Their C-14 ages have been recalibrated to the biblical timescale using equations 4 and 5. Western Eurasia is here defined as latitudes north of 30° and longitudes –10° to 60°, which includes Europe, North Africa, the Middle East, and Asia west of the Urals.
The secular radiocarbon ages of Egyptian Pharaohs and the recalibrated biblical radiocarbon ages are listed in table 2. There is disagreement between the conventional reign dates and the radiocarbon dates inherent to the original dataset (Dee et al. 2012). For example, Akhenaten is the father of Tutankhamun whose C-14 age makes him older than his father. This disagreement is reflected in the “trueage” (sixth column) and “truedate” (seventh column) which were calculated using equation 6, showing that recalibration to the biblical timescale does not change the relative order of radiocarbon dates. The recalibration just moves the Pharaoh’s radiocarbon age forward in time. So, according to the recalibration, Pharaoh Djoser died in 1705 B.C., which was 906 years younger than the end of his conventional reign. It should be noted, however, that the variation in the 47 separate C-14 measurements associated with Djoser in Dee’s database is very large, 4.398 pMC, indicating a range of death dates from 1847 to 1490 B.C. The samples were from museum collections of textiles, wood artifacts, and plant materials which may have been contaminated with more recent carbons. Accurate radiocarbon dates require careful collection by on-site archaeologists. But if the recalibrated radiocarbon age is true, this presents quite a surprise. Remarkably, this suggests there were no great pyramids in Egypt when Jacob and his family arrived during the Joseph famine since Djoser built the first great pyramid, the step pyramid. This result suggests that slave labor became available to build the great pyramids after the people in Egypt sold themselves to Pharaoh toward the end of the Joseph famine as described in Genesis 47:13–26 (Habermehl 2015).
Table 2. Radiocarbon ages of Egyptian Pharaohs who reigned before 1000 B.C. with recalibrated biblical ages and dates. From Dee et al. 2012. “c14_age” is the average c14 age of samples for that Pharaoh. “ave_pmc” is from pMC = 100 (2 –c14_age/5568) and the ± range is 1 standard deviation in the C-14 samples. “± 0” means there was only one sample. “trueage” is the biblical recalibration according to t = (–1/.002361) ln (1 – (pmc – 292)/72.112359) where t is years post-Flood, with Flood age = 4450 B.P. B.P. is years before 1950. “truedate” is the recalibrated biblical date = trueage–1950.
| Pharaoh | reign_BC | ave_c14_age | c14_date_BC | ave_pmc | trueage | truedate |
|---|---|---|---|---|---|---|
| Djoser | 2630–2611 | 3942 ± 523 | 1992 | 61.354 ± 4.398 | 3655 B.P. | 1705 B.C. |
| Sneferu | 2575–2551 | 4195 ± 266 | 2245 | 59.352 ± 1.925 | 3726 | 1776 |
| Khufu | 2551–2528 | 4550 ± 0 | 2600 | 56.755 ± 0.0 | 3802 | 1852 |
| Djedefre | 2528–2520 | 4085 ± 0 | 2135 | 60.138 ± 0.0 | 3699 | 1749 |
| Shepseskaf | 2472–2467 | 4086 ± 0 | 2136 | 60.13 ± 0.0 | 3700 | 1750 |
| Sahure | 2458–2446 | 4397 ± 0 | 2447 | 57.847 ± 0.0 | 3772 | 1822 |
| Neferirkare | 2446–2438 | 3950 ± 0 | 2000 | 61.157 ± 0.0 | 3663 | 1713 |
| Niuserre | 2420–2389 | 3892 ± 0 | 1942 | 61.6 ± 0.0 | 3645 | 1695 |
| Teti | 2323–2291 | 3924 ± 132 | 1974 | 61.361 ± 1.009 | 3655 | 1705 |
| Mentuhotep I | 2124–2120 | 3711 ± 8 | 1761 | 63.0 ± 0.067 | 3587 | 1637 |
| Mentuhotep II | 2051–2030 | 3325 ± 695 | 1375 | 66.368 ± 6.227 | 3399 | 1449 |
| Mentuhotep II | 2030–2000 | 3325 ± 695 | 1375 | 66.368 ± 6.227 | 3399 | 1449 |
| Mentuhotep III | 2000–1988 | 3670 ± 0 | 1720 | 63.326 ± 0.0 | 3572 | 1622 |
| Amenemhet I | 1981–1952 | 3448 ± 192 | 1498 | 65.119 ± 1.56 | 3479 | 1529 |
| Senusret I | 1961–1917 | 3651 ± 1 | 1701 | 63.476 ± 0.008 | 3565 | 1615 |
| Senusret II | 1887–1878 | 3531 ± 23 | 1581 | 64.431 ± 0.186 | 3517 | 1567 |
| Senusret III | 1878–1840 | 3528 ± 124 | 1578 | 64.457 ± 1.006 | 3515 | 1565 |
| Amenemhet III | 1859–1813 | 3560 ± 69 | 1610 | 64.196 ± 0.548 | 3529 | 1579 |
| Thutmose I | 1504–1492 | 3236 ± 8 | 1286 | 66.842 ± 0.067 | 3364 | 1414 |
| Hatshepsut | 1479–1473 | 2988 ± 839 | 1038 | 69.352 ± 8.512 | 3110 | 1160 |
| Hatshepsut | 1473–1458 | 2988 ± 839 | 1038 | 69.352 ± 8.512 | 3110 | 1160 |
| Amenhotep II | 1427–1400 | 3165 ± 0 | 1215 | 67.435 ± 0.0 | 3317 | 1367 |
| Thutmose IV | 1400–1390 | 3084 ± 0 | 1134 | 68.119 ± 0.0 | 3254 | 1304 |
| Akhenaten | 1349–1336 | 3032 ± 84 | 1082 | 68.56 ± 0.727 | 3208 | 1258 |
| Tutankhamun | 1336–1327 | 3137 ± 128 | 1187 | 67.677 ± 1.074 | 3295 | 1345 |
| Seti I | 1294–1279 | 2863 ± 493 | 913 | 70.147 ± 4.451 | 2982 | 1032 |
| Ramesses II | 1279–1213 | 2951 ± 161 | 1001 | 69.27 ± 1.404 | 3121 | 1171 |
| Merneptah | 1213–1203 | 3113 ± 0 | 1163 | 67.873 ± 0.0 | 3277 | 1327 |
| Ramesses IV | 1153–1147 | 2995 ± 19 | 1045 | 68.872 ± 0.168 | 3172 | 1222 |
| Ramesses IX | 1126–1108 | 2858 ± 87 | 908 | 70.062 ± 0.763 | 2998 | 1048 |
| Smendes | 1070–1044 | 2768 ± 0 | 818 | 70.852 ± 0.0 | 2824 | 874 |
| Amenemnisu | 1044–1040 | 2910 ± 80 | 960 | 69.61 ± 0.687 | 3073 | 1123 |
| Psusennes I | 1040–992 | 2987 ± 0 | 1037 | 68.946 ± 0.0 | 3163 | 1213 |
| Siamun | 978–959 | 2805 ± 0 | 855 | 70.526 ± 0.0 | 2904 | 954 |
The secular and biblical timescales are compared in fig. 7, where several noteworthy people, events, and groups are indicated. The secular timescale extends billions of years back in supposed time, but the biblical timescale extends back to about 4000 B.C., a commonly accepted date of Creation according to Ussher’s chronology. The people groups Neanderthals and Neolithic Farmers on the secular timescale, along with the Pleistocene epoch and the Stone Age, collapse into just 500 to 600 years after the Flood on the biblical timescale. Pharaoh Djoser, the builder of the first great pyramid, is seen to have lived after Israel entered Egypt in the Joseph Famine (Habermehl 2018).
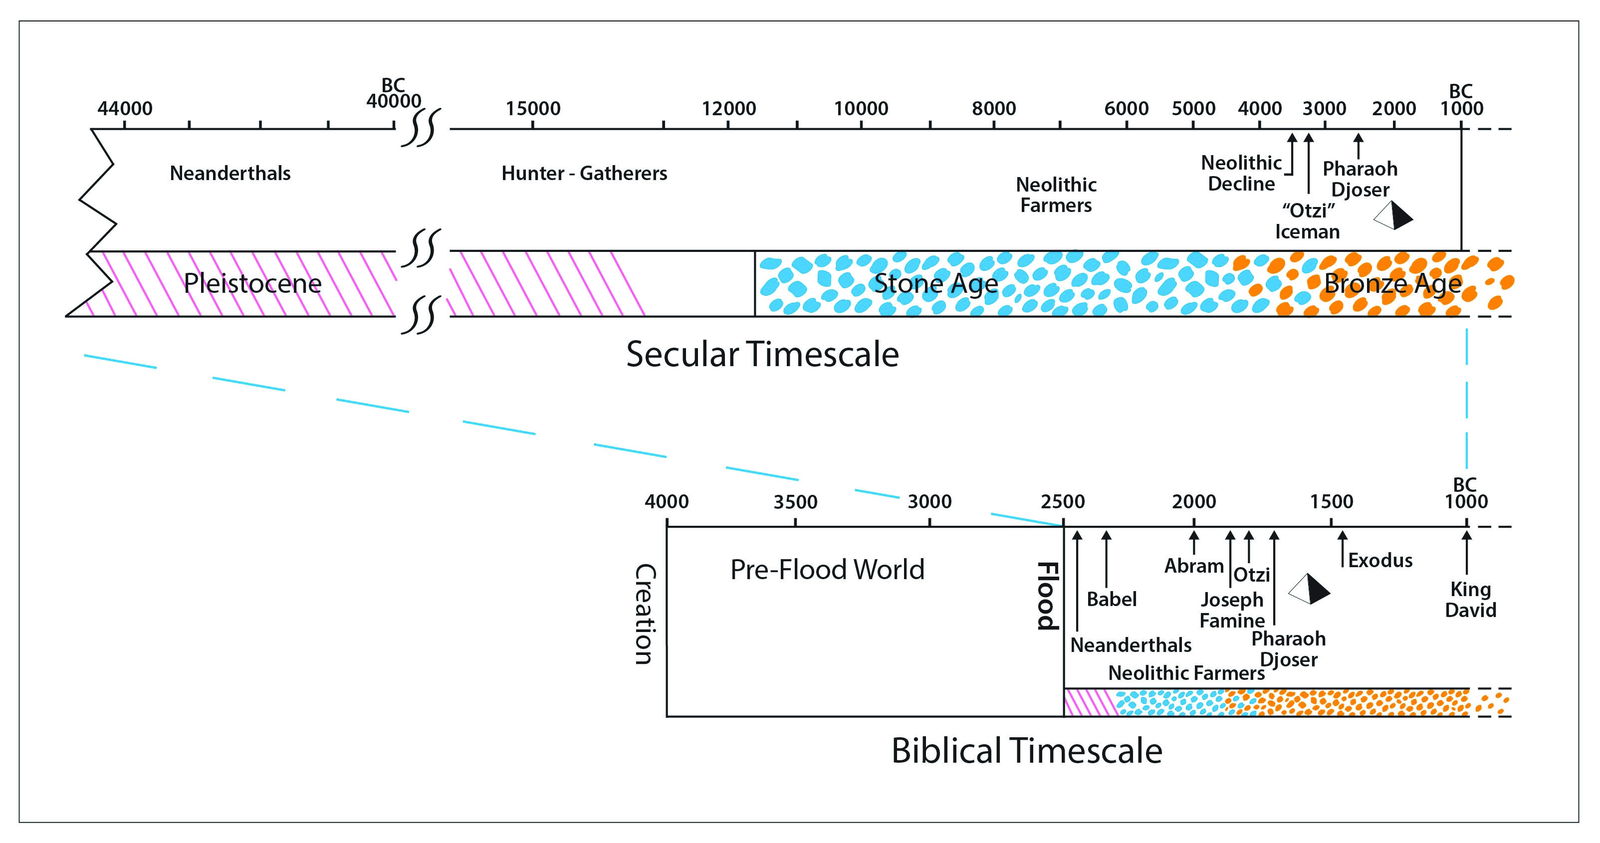
Fig. 7. The secular and biblical timescales are compared. The Neanderthals and Neolithic Farmers of the Pleistocene and Stone Age are shown to collapse into a few centuries post-Flood.
Discussion
To determine the accuracy and usefulness of the biblical radiocarbon dating model presented above, consideration must be given to the uncertainties of radiocarbon dating, the assumptions used to make the biblical recalibration of the IntCal20 radiocarbon curve, and the possible causes of the dramatic increase in atmospheric C-14 after the Flood. The following discussion will show that this model provides only a rough estimate of the true ages of ancient carbons for dates between the time of the Flood and the reign of King David. The major contribution of this recalibration will be to substitute biblical age estimates for conventional ages when the conventional age is older than 1000 B.C.
Uncertainties of radiocarbon dating
The following are the uniformitarian assumptions used in conventional radiocarbon dating (Hebert, Snelling, and Clarey 2016).
- The rate of C-14 production has not varied in the past.
- The global radiocarbon system is in a “steady state.”
- C-14 is always uniformly distributed in each reservoir (atmosphere, oceans, biosphere) although concentrations may differ between reservoirs.
- The amounts of stable carbon isotopes C-12 and C-13 are always constant.
That these assumptions do not apply can easily be demonstrated by measuring the C-14 content of artifacts of known age. Even before the advent of the accelerator mass spectrometer, when C-14 content was measured by counting decay events, it was known that C-14 ages were too old for carbons of known age based on accurate historical records. Tyler (1978) showed that the C-14 activity (the rate of decay events) of archaeological samples has decreased by about 10% when going back from modern times to 600 B.C. Going further back in time, he showed that the C-14 activity of Egyptian archaeological samples fell dramatically so that the C-14 age of samples would theoretically approach infinity at 5,000 years B.P. (compare Tyler’s figs. 1 and 4 with my fig. 5). Scientists who developed radiocarbon dating have acknowledged this “non-equilibrium” aspect of C-14 activity. Hence, a need for a calibration curve like IntCal20. Everyone agrees that radiocarbon dating must be calibrated due to lower atmospheric C-14 levels in ancient times.
The authors of the Intcal20 calibration understand that atmospheric C-14 is not at a steady state and fig. 2 gives evidence that their calibration is accurate back to 1000 B.C. despite the changing C-14 levels. But for older dates their dendrochronology fails, as seen in figs. 1 and 2, and they assume far too much atmospheric C-14. A strict uniformitarian assumption is used when a C-14 age is determined based on a pMC value using equation 4. The C-14 ages of the Intacal20 curve are calculated from equation 4. Equation 4 is a uniformitarian expression because the true C-14 age should be calculated using the percent of original C-14 remaining in the animal or plant from when it died, not the percent of modern C-14 remaining. This is the source of the greatest uncertainty in radiocarbon dating: the fraction of the original amount of C-14 remaining in the sample when it died is not known.
There is also great uncertainty in matching tree ring patterns. The IntCal20 curve is calibrated by tree rings back to 14,000 years B.P. by assuming one tree ring represents one year, which is not always the case. These uncertainties are adding up. Given the uncertainty in tree ring counts, the uncertainty in lab measurements, and the annual fluctuations in atmospheric C-14 concentration, the IntCal20 curve uses a Bayesian statistical method to give a probability distribution of the likely radiocarbon age (Höflmayer 2014; Ramsey 2009; Reimer et al. 2020). As you can see, the archaeologist must deal with a lot of uncertainty. However, the archaeologist would have an easy life if the above caveats were the only difficulties that must be overcome to get an accurate absolute date based on radiocarbon. Alas, the above is just the beginning of his difficulties.
Consider the steps that the archaeologist must take to get the proper carbon sample. Once the tomb of a long-lost Egyptian Pharaoh is opened and the archaeologist wants a radiocarbon date for the Pharaoh’s death, what ancient carbon should he select for C-14 measurements? The mummy itself may have been treated with petroleum-based ointments made from plants buried by the Flood several thousand years earlier. The mummies’ flesh or wrappings would be contaminated with these oils and so not give an appropriate C-14 value. Wood from the beams of the tomb may have been from trees felled hundreds of years before the tomb was constructed. The archaeologist must search for flowers left at the Pharaoh’s funeral service, stores of grain left to feed him in the afterlife, or olive pits expectorated by workers who closed the tomb. Short-lived plant remains such as these would give the most accurate radiocarbon dates for the Pharaoh’s death. Once the Pharaoh’s bones are dated by C-14, the archaeologist must consider whether he was a vegetarian, or whether he ate a lot of seafood, since diet affects C-14 levels. This is called “the dietary reservoir effect.” These difficulties illustrate some of the uncertainties of interpreting C-14 measurements (Dee et al. 2012).
Appreciating these numerous complicating factors and assumptions, one must conclude that radiocarbon dating will never replace accurate historical records for absolute dating of archaeological sites. Rather, radiocarbon dating is only one of several ancillary techniques that may be used in support of detailed stratigraphy and the study of historical records. Still, if the radiocarbon date is grossly in error due to wrong assumptions and no historical records are available to reveal the error, then the radiocarbon date assigned may be very misleading. This is the case with radiocarbon dating of the oldest human remains from Eurasia, the Neanderthals, which have assigned radiocarbon ages above 40,000 years B.P. But in this case, there is an accurate historical record to overturn the erroneous radiocarbon dates. The historical record of Genesis states that all men have descended from Noah’s family who survived the Flood. Because Neanderthal remains are found buried in graves and cave deposits and are not fossils in the rock record, Neanderthals appear to be post-Flood men. Assuming the Flood was only 4,500 years ago, their conventional radiocarbon ages must be wrong.
Assumptions of conventional and biblical radiocarbon dating
Radiocarbon calibration involves measuring the C-14 content of biological carbons of known age. When dendrochronology is used, one might quite innocently assume that tree rings of a series of dead trees have been counted back for thousands of years and each ring’s C-14 content determined to make the calibration curve. But this is not the case for the more ancient portions of the tree ring series. The further back in time, the more uncertainty in tree ring counting. Errors begin to add up so that the “floating” tree ring series cannot be anchored to a specific date. Then measured C-14 values are used “to match ring patterns that are not unique” in order to extend the series back in time (Hebert, Snelling, and Clarey 2016, 349). This is circular reasoning because the tree ring is used to get the C-14 measurement for a certain age, but the tree ring’s age is assigned according to the C-14 measurement of the tree ring. Nonetheless, this paper assumes that the IntCal20 curve based on tree ring calibration is accurate back to 1000 B.C. because there is correspondence between the C-14 age and the calBP age back to 1000 B.C. (see figs. 1 and 2). For older ages, the discordance in the IntCal20 curve between C-14 age and calBP suggests that the constant atmospheric C-14 assumption is wrong. Because the IntCal20 curve has a timescale of 55,000 years, and only the first 3,000 years show the correspondence between the C-14 age and the calBP age, 95% of the curve appears to be wrong based on this faulty uniformitarian assumption. So, the biblical correction involves collapsing 52,000 years of the conventional Stone Age into 1500 years from the Flood to 1000 B.C., the time of King David.
The biblical recalibration of the IntCal20 radiocarbon curve presented here is based solely on empirical data, namely, the C-14 measured in fossil fuels, the C-14 measured in the remains of people who died in the Neolithic Decline, and the C-14 measured in the tree rings from 1000 B.C. from the Intcal20 curve. A major assumption of this recalibration is that these three data points should be connected by a smooth sigmoid curve between the low C-14 level at the time of the Flood to a steady state level at 1000 B.C. There are several obvious problems with this choice of a curve. For one, atmospheric C-14 has increased since 1000 B.C. and is not currently at a steady state (Tyler 1978; Zhang et al. 2022). This may be due to the weakening of the earth’s magnetic field which promotes greater cosmic ray pressure on the upper atmosphere (Humphreys 2011). Another problem is that the recalibration curve is smooth. It is not jagged like the IntCal20 curve, which purports to display yearly atmospheric C-14 variation. But because atmospheric C-14 values vary due to climate and latitude as well as solar activity, discussed below, a smooth radiocarbon calibration curve is artificial and cannot be expected to give an accurate C-14 age down to the level of a few decades. Thus, the biblical recalibration curve is only able to give a “ballpark” estimate, and that only for C-14 values several hundred years post-Flood when atmospheric C-14 is above, say, 10 pMC (to propose an arbitrary cutoff level).
Several more assumptions were made in this biblical recalibration of radiocarbon dating. The midpoint of the curve-fit for equation 6 assumes that the Neolithic Decline is due to the Joseph famine and that this occurred around 1875 B.C. Three times in the account of the Joseph famine in Genesis 41 the statement is made that the famine afflicted the whole earth (Genesis 41: 54, 56, 57), providing a credible explanation for the Neolithic Decline. Thus, this ancient carbon data point seems to be justified. An additional assumption is that the remains of people who died in the Joseph Famine are in the Allen dataset with secular dates of death between 5375 and 5400 B.P. Finally, it should be noted that the sigmoid recalibration curve used in the model would be inappropriate to model atmospheric C-14 changes if they were due to several episodes of increased solar activity in the first few decades post-Flood. However, since the cause of the increased atmospheric C-14 is not known, a sigmoid curve seems to be a reasonable assumption (Humphreys 2023).
Verification of the biblical timescale for radiocarbon calibration
Much time and treasure have been devoted to an attempt to find a consensus between the standard Egyptian chronology and radiocarbon dating (Höflmayer 2014). In one major effort from the University of Oxford, using short-lived plant remains associated with museum collections of artifacts from dynastic Egypt, a radiocarbon chronology has been constructed spanning the second and third millennia B.C. (Ramsey et al. 2010). There are several notable flaws in this chronology, for example, the dates of the Old Kingdom extend back beyond the estimated dates for Noah’s Flood. But our purpose here is not to dive into the vortex and try to resolve the biblical and secular chronologies of Egypt. Instead, we will use a specific inconsistency derived from this secular radiocarbon chronology to show the usefulness of the biblical radiocarbon recalibration. The inconsistency involves radiocarbon dates on short-lived plant remains from the archaeological excavations of tell El-Daba in the Nile Delta. This site, also known as Avaris (or asserted to be Avaris by some), is thought by many bible scholars to be in the land of Goshen, where the Children of Israel settled under Joseph around 1875 B.C. (Halley 2022). According to dating based on archaeology, the site was abandoned about 1530 B.C. toward the end of the reign of Pharaoh Ahmose, the first king of the eighteenth dynasty of the New Kingdom age (Kutschera et al. 2012). The stratigraphic evidence of the abandonment is clear, but radiocarbon dates from that layer are 120 years too old to fit the secular date of 1530 B.C. This discordance is an enigma to the archaeologists because they believe the standard Egyptian chronology has been verified by radiocarbon dating, yet radiocarbon dates from the abandonment layer are too old (Kutschera et al. 2012). However, the enigma can be resolved to the satisfaction of some biblical chronologists by recalibrating the C-14 age according to the biblical timescale curve presented in this paper. The C-14 age of plant seeds from the abandonment layer was 3314 ± 36 years B.P. By equation 5 this corresponds to a C-14 value of 66.196 pMC, which gives an abandonment date of 1461 ± 22 years B.C. using equation 7 with a Flood date of 2500 B.C. Within this range of 1483 B.C. to 1439 B.C. falls the date of the Exodus of Israel from Egypt, which is held to be 1445 to 1446 B.C. by most conservative biblical scholars. Thus, radiocarbon dating based on the biblical timescale suggests that Avaris was abandoned at the time of the Exodus, around 1446 B.C.
A further verification of the proposed recalibration can be seen in the C-14 age derived from the burn layer of Jericho. The first city conquered when Israel entered the land of Canaan under Joshua was Jericho. According to the book of Joshua, “They burned the city with fire, and all that was in it” (Joshua 5:24). Given the specific details of the destruction of Jericho recorded in the Bible, one would think that when archaeologists found, in the ruins, that the city wall was collapsed and the city burned with fire, everyone would agree that the biblical record had been substantiated. But this was not the case. Using stratigraphy and seriation, archaeologist Kathleen Kenyon dated the destruction of Jericho to between 1580 and 1500 B.C. This date was confirmed by radiocarbon dating of charred cereal grains which “probably date to the last harvest preceding the destruction and conflagration of the tell” according to the study from Ben-Gurion University (Bruins and Van Der Plight 1995). That paper reported an uncalibrated C-14 age of 3306 ± 7 years B.P., which corresponds to a C-14 value of 66.262 from equation 5 and a date of 1457 B.C. by equation 7. Based on the Exodus at 1446 B.C., the Israelites would have destroyed Jericho in around 1406 B.C., so the biblical timescale radiocarbon date based on my recalibration curve is too old by 51 years. Still, the uncertainty displayed on the recalibration curve of fig. 5 is about 100 years, so this recalibrated date is consistent with the biblical record within the uncertainty of the recalibration curve. Given the above-noted uncertainties of radiocarbon dating due to yearly atmospheric C-14 activity changes, dietary reservoir effects, and other less well-characterized variables, this result is a verification of the proposed model. Radiocarbon dating of the Jericho ruins using a biblical timescale puts the burning of Jericho in the time of Israel’s invasion under Joshua.
Causes of the post-Flood increase in C-14
The amount of C-14 in the antediluvian atmosphere is not known, but the levels of C-14 measured in coal, gas, and oil (all of which are derived from plants buried in the Flood) imply that atmospheric C-14 before the Flood was far lower than today. In the immediate post-Flood atmosphere, the C-14 level might have been even lower than that which prevailed before the Flood because a large amount of carbon dioxide depleted in C-14 could have been released into the atmosphere when “the fountains of the great deep” broke open (Genesis 7:11). Volcanism during and following the Flood could also have depressed atmospheric C-14 for the same reason. These very low levels render the biblical radiocarbon curve unreliable in the first century or two after the Flood. However, it is undeniable that atmospheric C-14 has increased dramatically since then and current rates of C-14 production are inadequate to explain the increase. Therefore, the cosmic rays or gamma rays that generate C-14 in the upper atmosphere must have increased dramatically during or soon after the Flood (Humphreys 2023).
The IntCal20 curve provides evidence for past events that greatly increased the tree ring C-14 content in A.D. 774 and A.D. 993. These so-called “Miyake Events” (Miyake, Masuda, and Nakamura 2013) are illustrated in fig. 8. For each Miyake Event, there was a sudden decrease in the C-14 age of tree rings from one year to the next due to a dramatic increase in the C-14 content of the tree rings. Further spikes in tree ring C-14 have been found in 600 B.C., 5259 B.C., 5410 B.C., and 7176 B.C. on the conventional timescale (Zhang et al. 2022). Presumably, these tree ring C-14 spikes were caused by increased atmospheric C-14, which in turn was due to sudden increases in cosmic rays striking the atmosphere. Proposed causes of these C-14 spikes include sudden weakening of the earth’s magnetic field, a gamma-ray burst, or increased solar output of high-energy protons. Let’s examine these three possibilities.
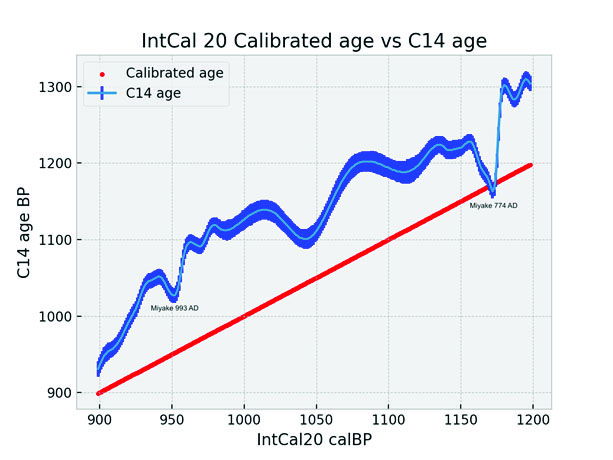
Fig. 8. “Miyake Events” of A.D. 774 and A.D. 993 are illustrated on a portion of the IntCal20 northern hemisphere radiocarbon age calibration curve for 1200 to 900 years calBP (A.D. 750—A.D. 1050). The calBP (red line) and C-14 age (blue line) are taken directly from the IntCal20 curve. C-14 values are plotted with dark blue error bars of ± 1 standard deviation. Time advances from right to left on the x-axis. The Miyake events are characterized by a sudden drop in the C-14 age due to a sudden increase in C-14 in the tree rings.
Cosmic rays can be deflected by the earth’s magnetic field, so weakening of the field could cause increased C-14 production in the atmosphere. Magnetic field reversals have been documented in the fossil layers of the world which were laid down during the Flood (Humphreys 1986, 2011). In a reversal, the field strength passes through zero, tempting one to speculate that the cosmic rays striking the atmosphere increased with each reversal, causing increased atmospheric C-14 during and after the Flood. But today, the cosmic rays of solar origin are of too low an energy to change nitrogen into C-14, and the more energetic cosmic rays of extrasolar origin, which are not much deflected by the magnetic field, are too few to cause atmospheric C-14 to reach today’s concentration in less than 14,000 years (Humphreys 2023). Magnetic field reversals cannot explain the post-Flood increase in C-14.
Gamma-ray bursts from supernovas might provide enough ionizing radiation, producing high-energy protons, to generate C-14 from nitrogen in the upper atmosphere (Ackermann et al. 2013). But the lack of nearby supernova remnants in our galaxy suggests that this was not the cause of the increased C-14 production. Furthermore, the supernova observed in A.D. 1054, which produced the Crab Nebula, did not produce a Miyake Event on the IntCal20 curve or in the Japanese cedar dendrochronology (Miyake, Masuda, and Nakamura 2013). The supernova star, in this case, is estimated to be about 6,500 light-years distant, relatively close to the Earth as far as intergalactic distances go. Because this supernova did not cause a Miyake Event, nearby supernova explosions producing high-energy gamma rays do not appear to explain the increased C-14.
One remaining possibility is increased solar cosmic rays. Although solar activity is known to sometimes increase dramatically, the Carrington Event of 1859, an observed coronal mass ejection, did not cause a spike in tree ring C-14 on the IntCal20 curve. The six documented Miyake Events were likely caused by increased cosmic rays, but no adequate explanation of their origin has been offered. Whatever the cause, the occurrence of three Miyake Events between 7176 and 5259 B.C. on the conventional timescale, which corresponds to between 2209 and 2078 B.C. on the biblical timescale, a period of just 131 years, suggests that there may have been many similar spikes in atmospheric C-14 in the first few centuries after the Flood.
Recently, another possibility has been proposed for increased solar cosmic rays (Humphreys 2023). Accelerated nuclear decay in the core of the sun may have caused the post-Flood atmospheric C-14 to increase. If the Sun experienced accelerated nuclear decay during and after the Genesis Flood, then this could have caused a great increase in high-energy protons of solar origin striking the atmosphere and producing C-14. Accelerated nuclear decay has already been proposed as an explanation for the high levels of helium retained in zircons that contain uranium inclusions. Accelerated nuclear decay may also explain why the earth’s rocks, which according to the Bible are only about 6,000 years old, contain an abundance of daughter atoms near their radioactive parent atoms, indicating a much larger amount of radioactive decay than one would expect in just 6,000 years (DeYoung 2021, 132). The post-Flood increase in atmospheric C-14 seems to corroborate the hypothesis that a period of accelerated nuclear decay occurred during and after the Flood on Earth and in the sun.
The practical usefulness of the biblical radiocarbon curve
The uncertainties attending the construction of the biblical radiocarbon curve and the fluctuating atmospheric C-14 levels limit the usefulness of this recalibration. The secular radiocarbon ages in the Egyptian Radiocarbon database have two standard deviations of error averaging ± 132 years. Recalibration of the data to a biblical timescale will not alter these error estimates. Furthermore, the biblical radiocarbon curve will not change the relative ages of ancient carbons and so it will not by itself solve the conundrum of ancient Egyptian chronology (Höflmayer 2014). Perhaps the most practical use will be to translate the inflated conventional radiocarbon dates older than 3,000 years B.P. to post-Flood dates. To facilitate this translation, a Python script, Biblical_date_from_radiocarbon.py (available in the Zenodo repository), was made to convert conventional calibrated radiocarbon dates and measurements of C-14 content to the biblical timescale proposed in this paper.
Avenues of further work to advance radiocarbon dating
A better biblical timescale radiocarbon curve will likely be devised when more ancient post-Flood carbons of known age become available. At the recent meeting of the International Conference on Creationism, Douglas Petrovich (2023) presented several second millennium B.C. synchronisms between archaeology and the biblical record which provide carbons of known age that might be used to refine the biblical timescale radiocarbon calibration curve. The more data points, the better the curve. So, the recalibration presented here in my paper is likely soon to be revised.
The curve presented in this paper is a rough start, using only three data points. The accuracy and precision of this curve are thought to be poor for dates in the third millennium B.C. for two main reasons. First, the cause of the post-Flood increase in atmospheric C-14 is unknown. The sigmoid curve used to model atmospheric increase in C-14 is an assumption likely to be a poor fit to the actual C-14 accumulation if it is due to sudden solar or cosmic ray events. This problem will cause a greater disruption at the left end of the curve because atmospheric C-14 is rapidly increasing soon after the Flood. A better curve may be devised when the cause of the post-Flood C-14 increase is understood. The second reason the accuracy and precision of the curve is poor in the third millennium B.C. is uncertainty in the Flood date. A more accurate and precise Flood date is needed. One path forward to better define the Flood date involves a careful exegesis of the biblical record, as found in the Masoretic and Septuagint manuscripts (Thomas 2017). Along this path, progress might be made by the understanding of Y chromosome inheritance patterns based on the Table of Nations in Genesis 10. What is needed is much cooperation between creation scientists skilled in physics, genetics, geology, archaeology, and biblical exegesis. Indeed, this is a fine time to be a biblical creationist studying archaeology because scientific progress is to be expected as the radiocarbon revolution is reformed in the light of God’s Word.
Conclusions
Based on the uniformitarian assumption of constant atmospheric C-14 content, secular radiocarbon dating of the most ancient human remains assigns them an age of over 40,000 years, an age incompatible with the biblical timescale. However, the existence of C-14 in coal, gas, and oil deposits has provided a time point for recalibration of radiocarbon dating to a biblical timescale because fossil fuels are derived from plants that were buried in the Flood around 2500 B.C. The recalibration is done by constructing a radiocarbon curve connecting the C-14 content of fossil fuels from the Flood (2500 B.C.), through the C-14 content of people who died in the Joseph famine of Genesis 41 (1875 B.C.) and ending with the C-14 content of tree rings from the time of King David (1000 B.C.). Based on this biblical radiocarbon calibration curve, the migration of men into Western Eurasia after the Flood is pictured using recalibrated C-14 ages of human remains listed in the Allen Ancient DNA Resource. Also, the list of Egyptian Pharaoh ages based on radiocarbon is collapsed into the biblical timescale. The potential causes of a dramatic rise in atmospheric C-14 content after the Flood are discussed. The difficulties attending radiocarbon dating, even with a biblical timescale, will limit the usefulness of the biblical radiocarbon curve to providing approximate dates between the Flood and the time of King David. Furthermore, radiocarbon dating with a biblical timescale will assist the assignment of absolute dates based on historical records and the science of archaeology. The Bible is the only perfectly reliable historical record and radiocarbon dating must be calibrated so that assigned dates are consistent with the biblical record.
Acknowledgments
Thanks to Craig McCluskey, Ph.D. who helped with the derivation and fitting of the recalibration curve.
References
Ackermann, M., M. Ajello, A. Allafort, L. Baldini, J. Ballet, G. Barbiellini, M. G. Baring, et al. 2013. “Detection of the Characteristic Pion-Decay Signature in Supernova Remnants.” Science 339, no. 6121 (15 February): 807–811.
Allen Ancient DNA Resource. David Reich Lab. https://reich.hms.harvard.edu/allen-ancient-dna-resource-aadr-downloadable-genotypes-present-day-and-ancient-dna-data.
American Chemical Society National Historic Chemical Landmarks. “Willard Libby and Radiocarbon Dating: A National Historic Chemical Landmark.” http://www.acs.org/content/acs/en/education/whatischemistry/landmarks/radiocarbon-dating.html.
Arnold, J. R., and W. F. Libby. 1949. “Age Determinations By Radiocarbon Content: Checks With Samples of Known Age.” Science 110, no. 2869 (23 December): 678–680.
Baumgardner, John, D. Russell Humphreys, Andrew A. Snelling, and Steven A. Austin. 2003. “Measurable 14C in Fossilized Organic Materials: Confirming the Young Earth Creation-Flood Model.” In Proceedings of the Fifth International Conference on Creationism. Edited by Robert L. Ivey, Jr., 127–142. Pittsburg, Pennsylvania: Creation Science Fellowship.
Bayliss, Alex, Peter Marshall, Michael W. Dee, Michael Friedrich, Timothy Heaton, and Lukas Wacker. 2020. “IntCal20 Tree Rings: An Archaeological Swot Analysis.” Radiocarbon 62, no. 4 (4 September): 1045–1078.
Bruins, Hendrik J. and Johannes Van Der Plicht. 1995. “Tell Es-Sultan (Jericho): Radiocarbon Results of Short-Lived Cereal and Multiyear Charcoal Samples From the End of the Middle Bronze Age.” Radiocarbon 37, no. 2: 213–220.
Carter, Robert W. 2022. “How Carbon Dating Works.” 12 April. https://creation.com/how-carbon-dating-works.
Cupps, Vernon R. 2017. “Radiocarbon Dating Can’t Prove an Old Earth”. Acts & Facts, 46, no. 4 (March 31).
Dee, M. W., J. M. Rowland, T. F. G. Higham, A. J. Shortland, F. Brock, S. A. Harris, and C. Bronk Ramsey. 2012. “Synchronizing Radiocarbon Dating and the Egyptian Historical Chronology By Improved Sample Selection.” Antiquity 86, no. 333 (September): 868–883.
DeYoung, Don. 2021. Thousands . . . Not Billions: Challenging an Icon of Evolution. Questioning the Age of the Earth. Green Forest, Arkansas: Master Books.
Friedrich, Michael, Sabine Remmele, Bernd Kromer, Jutta Hofmann, Marco Spurk, Klaus Felix Kaiser, Christian Orcel, and Manfred Küppers. 2004. “The 12,460-year Hohenheim Oak and Pine Tree-Ring Chronology From Central Europe—A Unique Annual Record of Radiocarbon Calibration and Paleoenvironment Reconstructions.” Radiocarbon 46, no. 3 (November): 1111–1122.
Glock, Waldo S., R. A. Studhalter, and Sharlene R. Agerter. 1960. “Classification and Multiplicity of Growth Layers in the Branches of Trees At the Extreme Lower Forest Border.” Smithsonian Miscellaneous Collections 140, no. 1 (June 17): 1–292.
Habermehl, Anne. 2010. “Those Enigmatic Neanderthals: What Are They Saying? Are We Listening?” Answers Research Journal 3 (January 13): 1–21. https://answersresearchjournal.org/those-enigmatic-neanderthals/.
Habermehl, Anne. 2015. “Dating Prehistoric Musical Instruments: The Two Timelines.” In Archaeoacoustics II: The Archaeology of Sound. Edited by Linda C. Eneix, 61–68. Myakka City, Florida: The OTS Foundation.
Habermehl, Anne. 2018. “A Creationist View of Göbekli Tepe: Timeline and Other Considerations.” In Proceedings of the Eighth International Conference on Creationism. Edited by J. H. Whitmore, 7–13. Pittsburgh, Pennsylvania: Creation Science Fellowship.
Hajdinjak, Mateja, Qiaomei Fu, Alexander Hübner, Martin Petr, Fabrizio Mafessoni, Steffi Grote, Pontus Skoglund, et al. 2018. “Reconstructing the Genetic History of Late Neanderthals.” Nature 555, no. 7698 (29 March): 652–656.
Halley, Keaton. 2022. “Exodus Evidence Revisited.” CMI web feedback archive June 18.
Hebert, Jake, Andrew A. Snelling, and Timothy Clarey. 2016. “Do Varves, Tree-Rings, and Radiocarbon Measurements Prove an Old Earth? Refuting a Popular Argument by Old-Earth Geologists Gregg Davidson and Ken Wolgemuth.” Answers Research Journal 9 (7 December): 330–361. https://answersresearchjournal.org/varves-trees-radiocarbon-old-earth/.
Höflmayer, Felix. 2014. “Radiocarbon Dating and Egyptian Chronology—From the ‘Curve of the Knowns’ to Bayesian Modeling.” In The Oxford Handbook of Topics in Archaeology. Oxford, United Kingdom: Oxford University Press.
Hua, Quan, Mike Barbetti, and Andrzej Z. Rakowski. 2013. “Atmospheric Radiocarbon For the Period 1950–2010.” Radiocarbon 55 no. 4 (9 February): 2059–2072.
Humphreys, D. Russell. 1986. “Reversals of the Earth’s Magnetic Field During the Genesis Flood”. In Proceedings of the First International Conference on Creationism. Vol 2. Edited by R. E. Walsh, C. L. Brooks, and R. S. Crowell, 113–126. Pittsburgh, Pennsylvania: Creation Society Fellowship.
Humphreys, D. Russell. 2011. “Earth’s Magnetic Field is Decaying Steadily—With a Little Rhythm.” Creation Research Society Quarterly 47 no.3: 193–201.
Humphreys, D. Russell. 2023. “Cause of Large Post-Flood Jump in Earth’s Carbon 14.” In Proceedings of the Ninth International Conference on Creationism. Vol. 9. Edited by J. H. Whitmore, Article 16. Cedarville, Ohio: Cedarville University International Conference on Creationism.
Jeanson, Nathaniel. 2019. “Testing the Predictions of the Young-Earth Y Chromosome Molecular Clock: Population Growth Curves Confirm the Recent Origin of Human Y Chromosome Differences.” Answers Research Journal 12 (December 4): 405–423. https://answersresearchjournal.org/human-y-chromosome-molecular-clock/.
Kanu, A. M., L. L. Comfort, T. P. Guilderson, P. J. Cameron-Smith, D. J. Bergmann, E. L. Atlas, S. Schauffler, and K. A. Boering. 2016. “Measurements and Modeling of Contemporary Radiocarbon In the Stratosphere.” Geophysical Research Letters 43, no. 3 (16 February): 1399–1406.
Keller, A., A. Graefen, M. Ball, M. Matzas, V. Boisguerin, F. Maixner, P. Leidinger et al. 2012. “New Insights Into the Tyrolean Iceman’s Origin and Phenotype as Inferred By Whole-Genome Sequencing.” Nature Communications 3, no. 698 (28 February 2012). https://www.nature.com/articles/ncomms1701.
Kutschera, Walter, Manfred Bietak, Eva Maria Wild, Christopher Bronk Ramsey, Michael Dee, Robin Golser, Karin Kopetzky, Peter Stadler, Peter Steier, Ursula Thanheiser, and Franz Weningeer. 2012. “The Chronology of Tell El-Daba: A Crucial Meeting Point of 14C Dating, Archaeology, and Egyptology In the 2nd Millennium BC.” Radiocarbon 54 (3–4) (January): 407–422.
Miyake, Fusa, Kimiaki Masuda, and Toshio Nakamura. 2013. “Another Rapid Event in the Carbon-14 Content Of Tree Rings.” Nature Communications 4: Article 1748. https://www.nature.com/articles/ncomms2783.
Oxford Radiocarbon Accelerator Unit. https://c14.arch.ox.ac.uk/calibration.html#conventions_reporting.
Pääbo, Svante. 2022. “The Neandertal Genome and the Evolution of Modern Humans.” Nobel Prize Lecture. https://www.nobelprize.org/prizes/medicine/2022/paabo/lecture/.
Petrovich, Douglas N. 2023. “The Place of Radiometric Dating in a Young Earth Framework.” In Proceedings of the Ninth International Conference on Creationism. Edited by J. H. Whitmore, Article 35. Cedarville, Ohio: Cedarville University International Conference on Creationism.
Ramsey, Christopher Bronk, Michael W. Dee, Joanne M. Rowland, Thomas F. G. Higham, Stephen A. Harris, Fiona Bronk, Anita Quiles, Eva M. Wild, Ezra S. Marcus, and Andrew J. Shortland. 2010. “Radiocarbon-Based Chronology for Dynastic Egypt.” Science 328, no. 5985 (18 June): 1554–1557.
Ramsey, Christopher Bronk. 2009. “Bayesian Analysis of Radiocarbon Dates.” Radiocarbon 51, no. 1 (January): 337–306.
Reimer, Paula J., William E. N. Austin, Edouard Bard, Alex Bayliss, Paul G. Blackwell, Christopher Bronk Ramsey, Martin Butzin, et al. 2020. “The IntCal20 Northern Hemisphere Radiocarbon Age Calibration Curve (0–55 cal kBP).” Radiocarbon 62, no. 4 (August): 725–757.
Ricker, Martin, Genaro Gutiérrez-García, David Juárez-Guerrero, and Margaret E. K. Evans. 2020. “Statistical Age Determination of Tree Rings.” PLoS One 15 no. 9 (September 22). https://doi.org/10.1371/journal.pone.0239052.
Riddle, M. 2019. “Doesn’t Carbon-14 Dating Disprove the Bible?” The New Answers Book 1, Chapter 7. Green Forest, Arkansas: Master Books.
Rupe, Christopher, and John Sanford. 2017. Contested Bones. Canandaigua, New York: FMS Publications.
Snelling, Andrew A. 2008. “Radiocarbon Ages for Fossil Ammonites and Wood in Cretaceous Strata near Redding, California.” Answers Research Journal 1 (10 December): 123–144. "https://answersresearchjournal.org/radiocarbon-ages-fossil-ammonites-wood/.
Steinmeyer, Nathan. 2022. “What is Radiocarbon Dating?” Bible History Daily, May 6. https://www.biblicalarchaeology.org/daily/archaeology-today/radiocarbon-dating/.
Stenström, Kristina Eriksson, Göran Skog, Elisavet Gerogiadou, Johan Genberg, and Anette Johansson. 2011. “A Guide to Radiocarbon Units and Calculations.” Lund University, Department of Physics, Division of Nuclear Physics Internal Report. https://www.hic.ch.ntu.edu.tw/AMS/A%20guide%20to%20radiocarbon%20units%20and%20calculations.pdf.
Taylor, R. E., John R. Southon, and Guaciara M. Santos. 2018. “Misunderstandings Concerning the Significance of AMS Background 14C Measurements.” Radiocarbon 60, no. 3 (June): 727–749.
Thomas, Brian. 2017. “Two Date Range Options for Noah’s Flood.” Journal of Creation 31, no. 1 (April): 120–127.
Thomas, Brian, and Vance Nelson. 2015. “Radiocarbon in Dinosaur and Other Fossils.” Creation Research Society Quarterly 51, no. 4 (Spring): 299–311.
Tyler, David J. 1978. “Radiocarbon Calibration—Revised.” Creation Research Society Quarterly 15, no. 1 (June): 16–23.
Whitcomb, J. 1993. Study-Graph. 5th ed. Winona Lake, Indiana: BMH Books.
Whitelaw, R. 1970. “Time, Life, and History in the Light of 15,000 Radiocarbon Dates.” Creation Research Society Quarterly 7, no. 1 (June): 56–71.
Zhang, Qingyuan, Utkarsh Sharma, Jordan A. Dennis, Andrea Scifo, Margot Kuitems, Ulf Büntgen, Mathew J. Owens, Michael W. Dee, and Benjamin J. S. Pope. 2022. “Modelling Cosmic Radiation Events in the Tree-Ring Radiocarbon Record.” Proceedings of the Royal Society A 478, no. 2266 (October): 1–21.


