The views expressed in this paper are those of the writer(s) and are not necessarily those of the ARJ Editor or Answers in Genesis.
Abstract
To take advantage of innovations in statistical baraminology methods, we re-evaluated the baraminology of hominins using two character sets from Berger et al. (2010) and from Dembo et al. (2016) as modified by Wood (2020a). Traditional distance correlation methods and cluster analysis by medoid partitioning and fuzzy analysis were applied to each character set. Our results revealed a robust cluster of putatively human taxa that was observed in almost every analysis. This cluster included the contentious taxa Homo naledi and Australopithecus sediba, but the status of Homo floresiensis was unresolved. Our results reinforce previous studies using only baraminic distance correlation and multidimensional scaling.
Keywords: baraminology, paleoanthropology, hominins, cluster analysis
Introduction
Recently, Reeves (2021a, 2021b) argued that statistical baraminology would benefit from using standard clustering algorithms instead of the untested baraminic distance correlation method. He also recommended using alternative distance metrics, such as the Jaccard distance, rather than relying exclusively on the baraminic distance. Wood’s (2021a) subsequent re-analysis of 82 Cenozoic mammal character sets using Reeves’s recommendations revealed a striking correspondence between taxonomic partitions generated by medoid partitioning, fuzzy analysis, and distance correlations (baraminic or simple matching distances only). Consequently, (Wood 2021a) recommended that multiple methods (including distance correlation) should be used to cluster taxa into putative baraminic groups in all future baraminology studies. Agreement between different methods gives greater confidence that putative clustering and discontinuities are robust, and disagreement between different methods warns the researcher to be less certain of any particular clustering partition.
Reeves (2021a) also implied that hominin baraminology results, particularly those regarding the classification of Australopithecus sediba, were especially problematic and deserving of more skepticism and scrutiny. To review, Wood’s ongoing studies of hominin baraminology have consistently placed Au. sediba in a cluster with other humans, prompting Wood’s conclusion that Au. sediba is likely a member of the human holobaramin (Wood 2010, 2016a, 2017). Other creationists have disagreed, insisting instead that Au. sediba was either not human (Line 2010; Menton, Habermehl, and De Witt 2010; O’Micks 2016a; Thomas 2011) or a mix of human and nonhuman remains (Rupe and Sanford 2017, 173–175). Despite his statistical baraminology results, Wood (2013) has also entertained the possibility that Au. sediba might not have been human.
Similar disagreement occurred over the status of Homo naledi. Wood (2016a, 2017), Wise (2016), Line (2016), McLain (2017), and Rupe and Sanford (2017) claimed these fossils were human, while Clarey (2015) suggested they were a mix of human and ape fossils. In an extensive blog article, Nalin (2015) refrained from classifying H. naledi as anything, instead claiming, “The reality is that we just don’t know.” In a series of articles, O’Micks (2016a, 2016b, 2017a, 2017b, 2017c) argued that Homo naledi was not human. O’Micks (2017a) also suggested that Homo floresiensis might not have been human, in contrast to other creationists who have argued that it was (e.g, Line 2006; Wise 2005). Wood’s (2010) statistical baraminology study did not resolve the status of H. floresiensis, but he nevertheless sided with Wise in placing H. floresiensis provisionally in the human holobaramin (Wood 2016a). For a summary of these disagreements, see table 1.
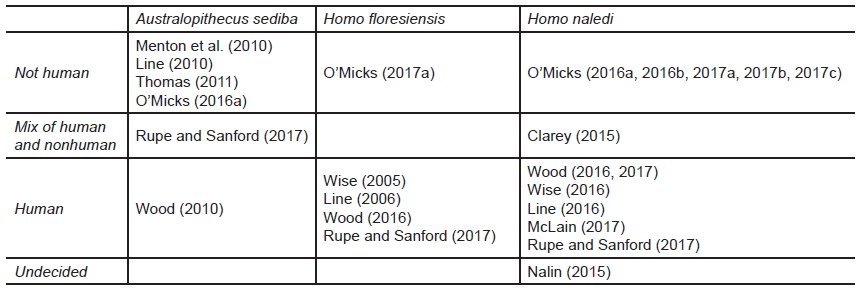
Table 1. Creationist opinion on the status of Australopithecus sediba, Homo floresiensis, and Homo naledi.
It might seem that creationist disagreement over the status of hominin fossils is unlikely to be resolved with the present evidence, but Reeves’s recommendation of Jaccard distances, medoid partitioning, and fuzzy analysis brings alternative analytical tools to baraminology that have not been applied before. How might these methods alter our conclusions about hominin baraminology based on analysis of discrete character sets? Specifically, if we applied the full range of methods used by Wood (2021a) to the original character set used by Wood (2010) to place Au. sediba in the human holobaramin, would the results be different? Might these methods justify placing Au. sediba in an ape holobaramin? Could there be a similar change in the baraminic status of H. floresiensis or H. naledi with these additional methods?
Here we evaluate two hominin character sets using distance correlation, medoid partitioning, and fuzzy analysis. The first character set is based on Berger et al.’s (2010) original description of Au. sediba and is the same character set that Wood (2010) used in his initial placement of Au. sediba in the human holobaramin. The second character set is Wood’s (2020a) updated version of Dembo et al.’s (2016) character set, which includes Au. sediba, H. floresiensis, and H. naledi. Using these character sets and the expanded methodology recommended by Wood (2021a) and Reeves (2021a, 2021b), we attempt to clarify the baraminic status of these contentious hominin fossils.
Methods
Character sets. We selected two character sets for our analysis. The first was derived from the original description of Au. sediba by Berger et al. (2010) and was used by Wood (2010) in his first hominin baraminology study. The set contained 69 craniodental characters scored for 12 taxa. The taxa included all three species of Paranthropus, four species of Homo, four species of Australopithecus, and the chimpanzee (Pan troglodytes) as the outgroup. For this analysis, all character states were recoded so that state zero (0) always represented the absence of a character state, because this is necessary for valid Jaccard distance calculations and it will not alter the simple matching baraminic distance.
The second character set was an updated version of a supermatrix compiled by Dembo et al. (2016). The updated matrix included additional character states describing Ardipithecus ramidus from Mongle, Strait, and Grine (2019), Au. anamensis from Haile-Selassie et al. (2019), H. antecessor from Trafí et al. (2018), and H. floresiensis from Argue et al. (2017). An additional 55 H. floresiensis character states were scored from published descriptions and photographs of the original fossils. The updated matrix contains 391 characters scored for 24 taxa and is available through Dryad (Wood 2021b). The taxa include Ardipithecus ramidus, Kenyanthropus platyops, Sahelanthropus tchadensis, five species of Australopithecus, three species of Paranthropus, 11 species of Homo, and the outgroups chimpanzee and gorilla. As with the Berger et al. (2010) character set, all character states were recoded so that state zero (0) always represented the absence of a character state.
Distance metrics. Baraminic distances based on the simple matching coefficient have been used in statistical baraminology since its inception, but Reeves (2021a) recommended that other metrics be considered as well. Following his example (Reeves 2021b), we chose the Jaccard distance as an alternative to baraminic distances. For discrete presence/absence character states, the Jaccard distance discounts matches where both taxa lack the character state. See Reeves (2021a, 2021b) and Kaufman and Rousseeuw (1990) for more details. To implement this, we recoded both character sets to make character state zero (0) only refer to the absence of a character, as noted previously. We used BARCLAY (Wood 2020b) to calculate both baraminic and Jaccard distances.
Clustering. Following the recommendations of Wood (2021a), we performed distance correlation analyses using both baraminic and Jaccard distances with Pearson and Spearman correlation coefficients. Following the recommendations of Reeves (2021a, 2021b), we performed cluster analyses using medoid partition and fuzzy analysis with both types of distances. Medoid partitioning classifies the taxa of a distance matrix into k clusters based on k representative taxa, where each representative taxon is that taxon that minimizes the distances to all other taxa in the same cluster. Fuzzy analysis generates cluster membership coefficients for each taxon, the largest of which can be used to create a hard partition for that taxon. Both medoid partitioning and fuzzy analysis require the number of clusters k to be specified in advance.
Comparison of cluster partitions can be accomplished by use of silhouette widths and average silhouette widths. The silhouette width for taxon i is related to the ratio of the average distance from i to all other taxa in the same cluster to the average distance from i to its nearest neighbor cluster (the other cluster that it is closest to). Silhouette widths range from -1 to 1, where negative values indicate that a taxon is closer to its nearest neighbor cluster than it is to the taxa in the cluster to which i has been assigned. The average silhouette width is the mean of silhouette widths for all taxa in the distance matrix. Kaufman and Rousseeuw (1990, 88) recommend what they call a “subjective interpretation” of the average silhouette width for all taxa. Accordingly, anything above 0.5 is considered “reasonable” or “strong” clustering, while values from 0.26 to 0.5 are said to be “weak” or possibly “artificial” clustering. Average silhouette widths below 0.25 are considered to have no “substantial structure.”
For all of our analyses, we used all the characters present in the character set as well as characters filtered at a ≥ 75% character relevance, which we call here “high relevance” characters. Use of “high relevance” characters is consistent with previous conventions in statistical baraminology, while the use of all characters follows the suggestion of Reeves (2021a, 2021b). All clustering calculations were done using BARCLAY (Wood 2020b). Additional analyses were performed in R 3.3.1 (https://r-project.org).
Results
For the Berger et al. (2010) character set we calculated distances using all 69 characters as well as the 59 “high relevance” characters that had character relevance a ≥ 75%. For both Jaccard and baraminic distances using all characters and high relevance characters, distances were highly similar (fig. 1). Our clustering results produced a single taxon partition despite the differing clustering conditions and methods (table 2). This partition consists of three clusters with average silhouette widths ranging from 0.58 to 0.59 (table 2, fig. 2). The first cluster consists of members of the genus Homo together with Au. sediba. The second cluster consists of chimpanzee and the remaining members of the genus Australopithecus. The third cluster contains all three species of the genus Paranthropus.
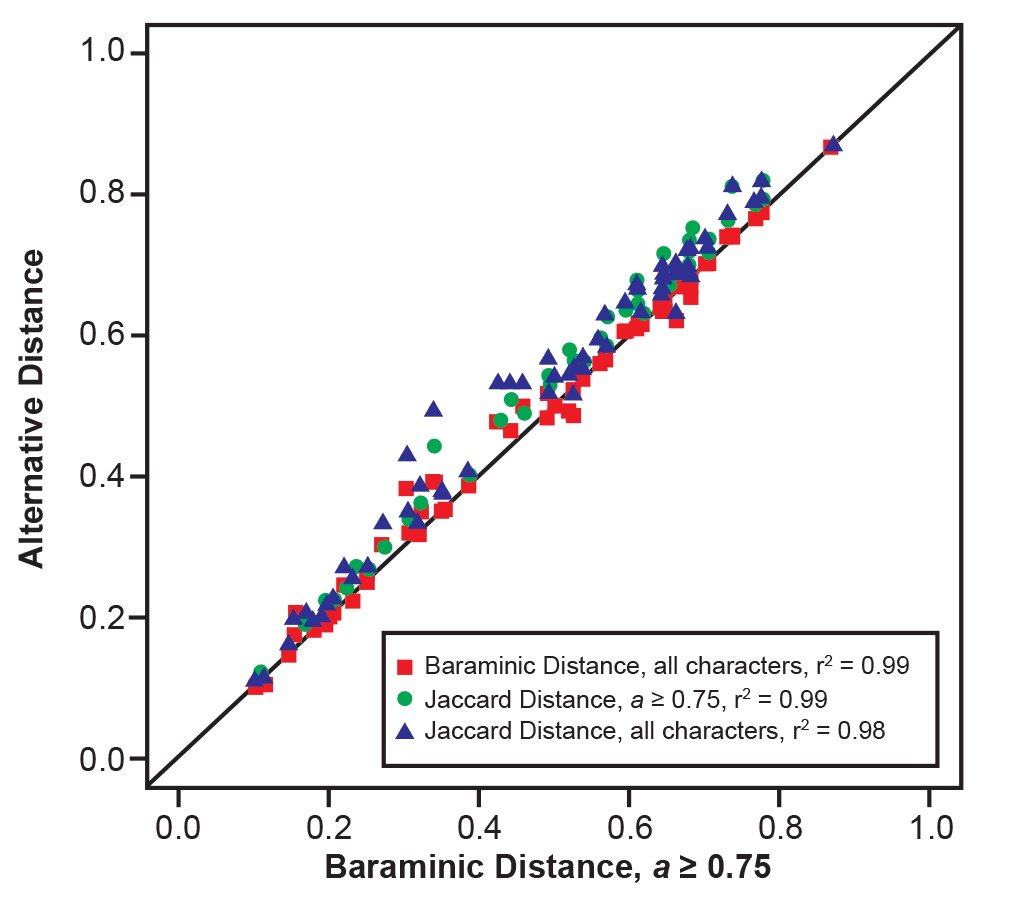
Fig. 1. Comparison of baraminic distances calculated from the “high relevance” (a ≥ 75%) character set of Berger et al. (2010) to baraminic distances for all characters (red squares), Jaccard distances for “high relevance” characters (green circles), and Jaccard distances for all characters (blue triangles), all calculated from the same character set of Berger et al. (2010).
Table 2. Taxonomic partitions and average silhouette widths based on clustering methods shown for the character set of Berger et al. (2010). Clusters are indicated by number and by color, with putative humans in shades of green and putative nonhumans in shades of blue.
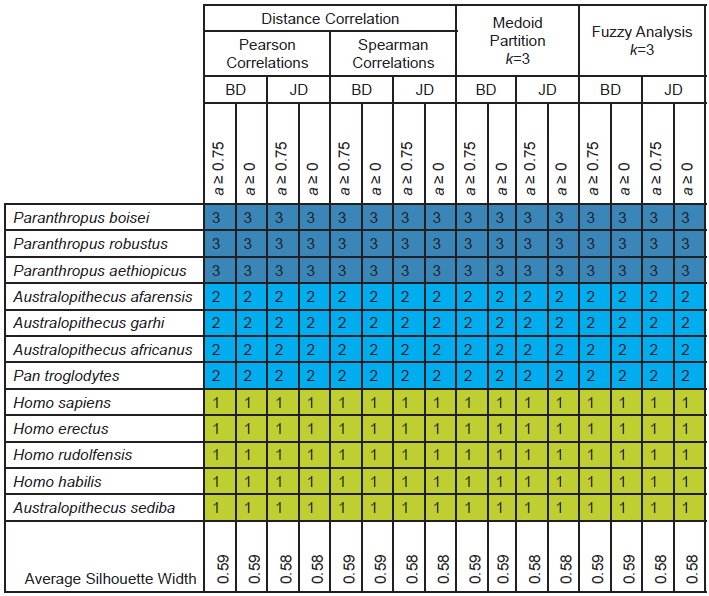
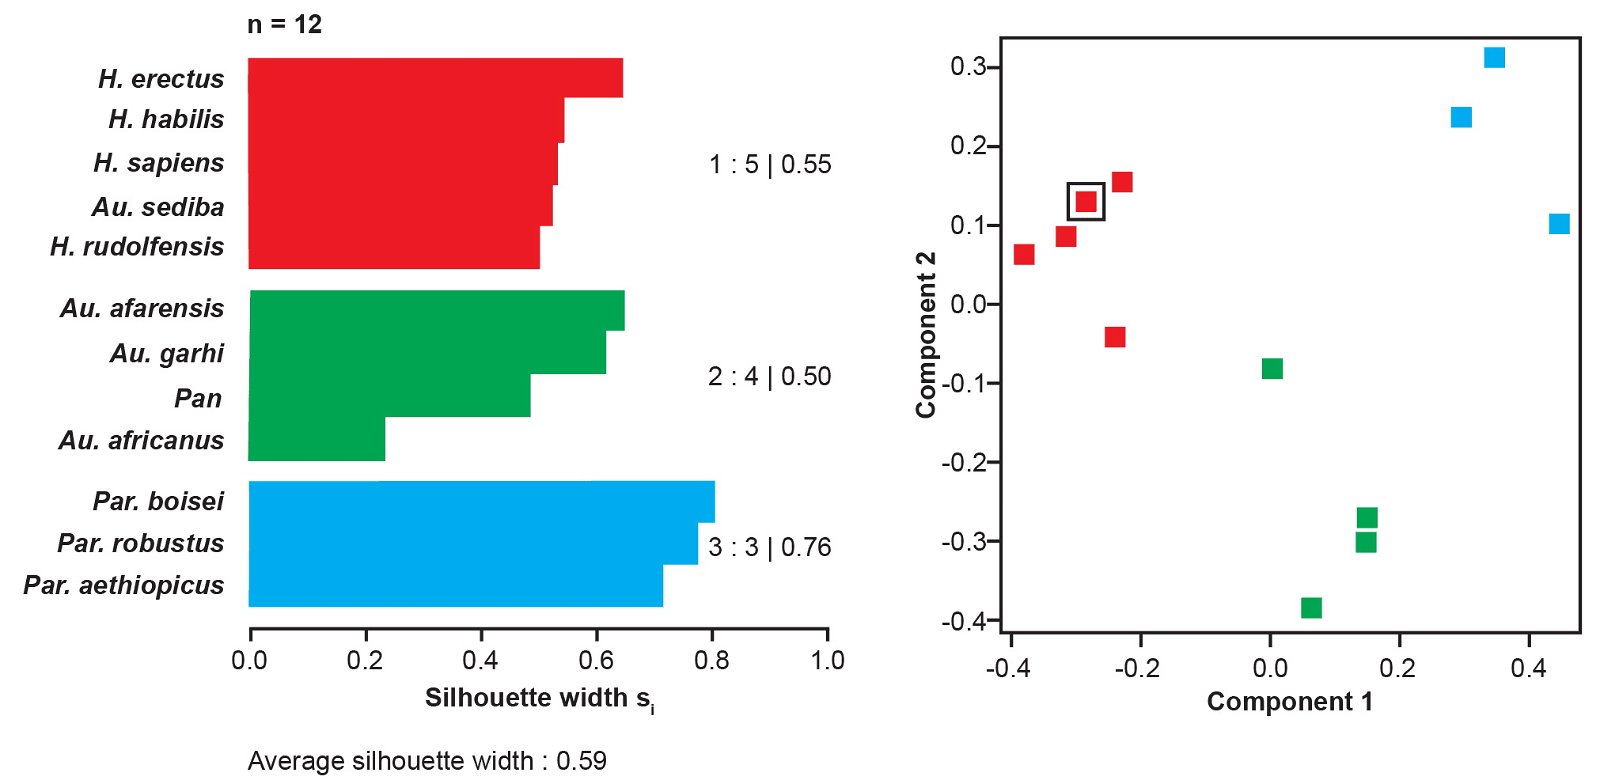
Fig. 2. Taxon partition based on Pearson BDC using “high relevance” (a ≥ 75%) characters from Berger et al.’s (2010) character set shown as a silhouette plot (left) and multidimensional scaling (right). This partition is the same for all combination of characters and methods indicated in table 2. In the MDS plot, Au. sediba is outlined by a black square.
In all eight distance correlation analyses of the Berger et al. (2010) character set (fig. 3), all taxon pairs within the first cluster (Homo sensu lato) and within the third cluster (Paranthropus) shared significant, positive distance correlation. Within the second cluster, Au. africanus shows significant, positive distance correlation with Au. garhi in seven of the eight analyses. When Spearman correlations were calculated using baraminic distances from “high relevance” characters (a ≥ 75%), Au. africanus exhibited significant, positive distance correlation with Au. garhi and Au. afarensis. Significant, negative distance correlation was frequently observed between group 1 (Homo sensu lato) and group 3 (Paranthropus) in all distance correlation clustering. Significant, negative distance correlation was not consistently observed between cluster 1 (Homo sensu lato) and cluster 2 (Pan and australopithecines excluding Au. sediba).
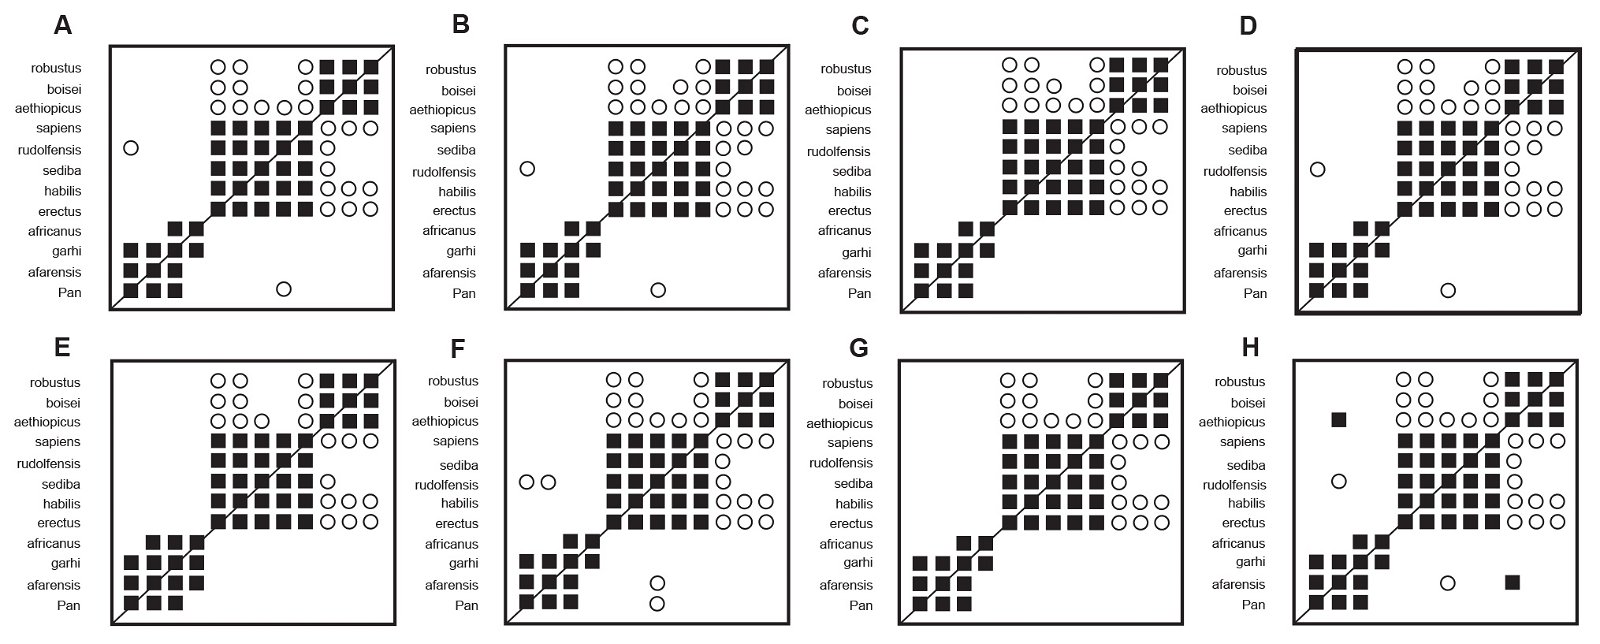
Fig. 3. All possible distance correlation results for the Berger et al. (2010) character set. Filled squares represented significant, positive correlation. Open circles indicate significant, negative correlation. A. Baraminic distances, “high relevance” (a ≥ 75%) characters, Pearson correlations. B. Baraminic distances, all characters, Pearson correlations. C. Jaccard distances, “high relevance” (a ≥ 75%) characters, Pearson correlations. D. Jaccard distances, all characters, Pearson correlations. E. Baraminic distances, “high relevance” (a ≥ 75%) characters, Spearman correlations. F. Baraminic distances, all characters, Spearman correlations. G. Jaccard distances, “high relevance” (a ≥ 75%) characters, Spearman correlations. H. Jaccard distances, all characters, Spearman correlations.
In all cluster analyses of the Berger et al. (2010) character set (distance correlation, medoid partition and fuzzy analysis), Au. sediba consistently clusters with species of the genus Homo. To further test the cluster membership of Au. sediba, we calculated silhouette plots for partitions that manually placed Au. sediba in one of the other two clusters. For Jaccard and baraminic distances calculated with all characters and high relevance characters, moving Au. sediba into a different cluster always resulted in a substantial reduction of silhouette width, both for Au. sediba individually and for the average partition silhouette width (fig. 4). In fact, placing Au. sediba in one of the nonhuman clusters resulted in a strongly negative silhouette width (-0.611 for placing it in the Paranthropus cluster, -0.525 for placing it in the other australopith cluster using “high relevance” baraminic distances), indicating that Au. sediba should be placed in the Homo cluster, where its silhouette width is strongly positive (0.525). Similarly, moving Au. sediba to its own singleton cluster causes the average silhouette width to drop to 0.37 using “high relevance” baraminic distances.
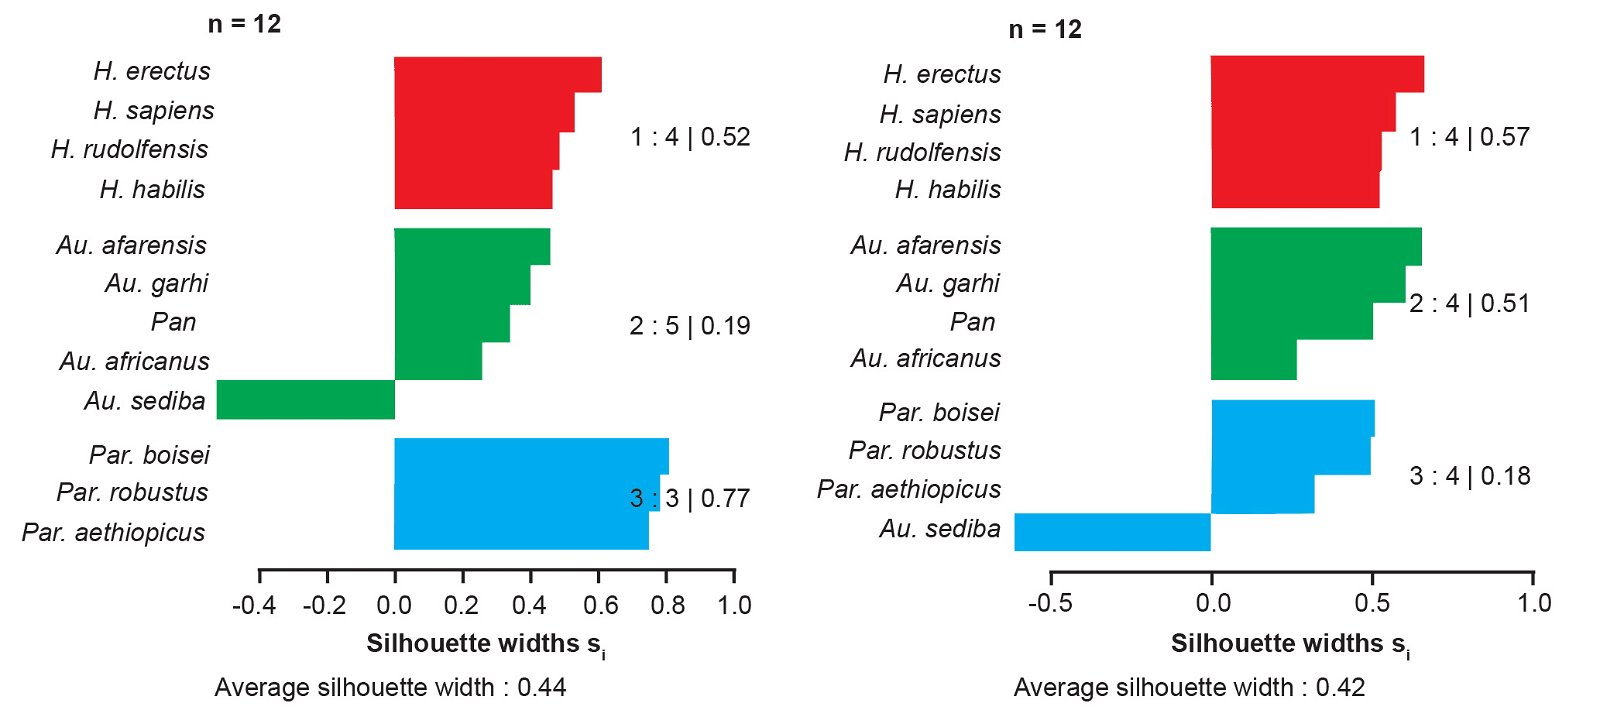
Fig. 4. Silhouette plots for hypothetical partitions created by moving Au. sediba into a different cluster. Silhouette widths were calculated from baraminic distances using “high relevance” (a ≥ 75%) characters from the Berger et al. (2010) character set.
For the Wood (2020a) character set, we calculated distances using all 391 characters as well as the 128 “high relevance” characters that had character relevance a ≥ 75%. We removed the Paranthropus taxa from the character set because they consistently formed a distant cluster, and there is no controversy over the conclusion that these taxa are not human. Rather, we were particularly interested in the relationship of Homo and Australopithecus. All taxa with taxic relevance less than 20% (H. antecessor, S. tchadensis, Au. garhi, and K. platyops) were also removed. The final character set used here contains seventeen taxa, consisting of ten Homo taxa, four Australopithecus taxa, Ardipithecus, and chimpanzee and gorilla. For both Jaccard and baraminic distances using all characters and “high relevance” characters (a ≥ 75%), distances were highly similar once again (fig. 5).
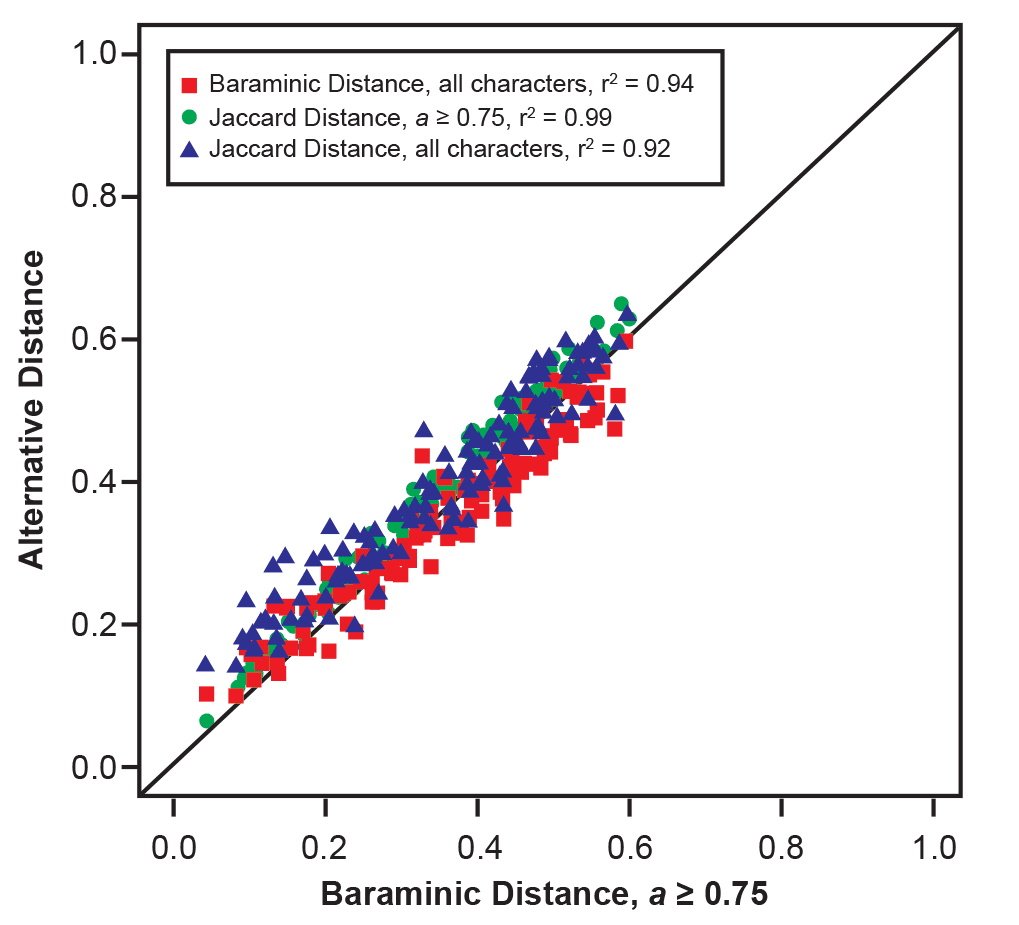
Fig. 5. Comparison of baraminic distances calculated from the “high relevance” (a ≥ 75%) character set of Wood (2020a) to baraminic distances for all characters (red squares), Jaccard distances for “high relevance” characters (green circles), and Jaccard distances for all characters (blue triangles), all calculated from the same character set of Wood (2020a).
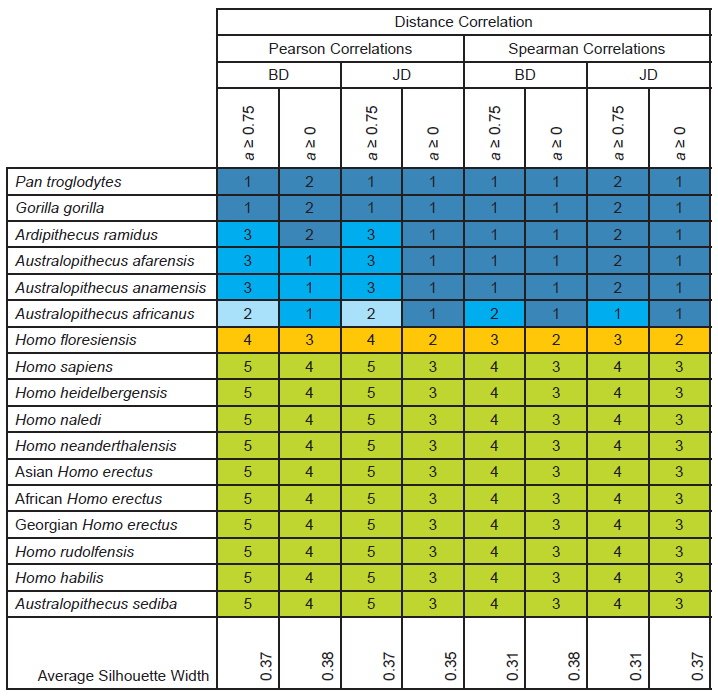
For baraminic distance correlation using Pearson or Spearman correlations and all characters or “high relevance” (a ≥ 75%) characters, the number of clusters evident in the results varied from three to five. Three to five clusters were also evident in the Jaccard distance correlation results. Across all eight distance correlation results, two clusters were seen in every condition: a singleton containing H. floresiensis, and a cluster of the remaining nine Homo taxa together with Au. sediba. The remaining taxa were divided into two or three clusters or placed in a single cluster (table 3).
Table 3. Taxonomic partitions and average silhouette widths based on distance correlation for the character set of Dembo et al. (2016) as updated by Wood (2020a). Clusters are indicated by number and by color, with putative humans in shades of green and putative nonhumans in shades of blue. Uncertain taxa are shown in orange.
For medoid partitioning (k = 3) using baraminic or Jaccard distances and using all characters or “high relevance” (a ≥ 75%) characters, one three-cluster partition was observed (table 4). The first cluster consisted of all Homo taxa together with Au. sediba. The second cluster contained the extant apes and Ar. ramidus. The third cluster contained the remaining three australopiths. Fuzzy analysis (k = 3) of baraminic distances placed H. floresiensis in a cluster with the undisputed nonhuman apes and divided the Homo taxa into two separate clusters. Fuzzy analysis (k = 3) of Jaccard distances placed the undisputed nonhuman apes into a single cluster and divided humans and H. floresiensis into two separate clusters (table 4).
Table 4. Taxonomic partitions and average silhouette widths based on cluster analysis for the character set of Dembo et al. (2016) as updated by Wood (2020a). Clusters are indicated by number and by color, with putative humans in shades of green and putative nonhumans in shades of blue.
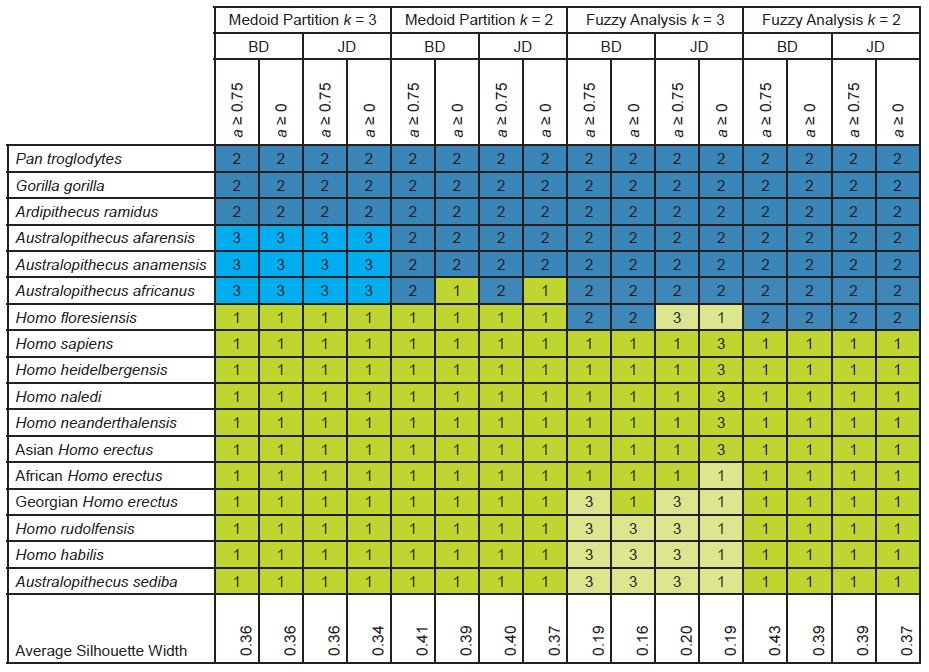
Medoid partitioning for two clusters revealed two different partitions that differed only by the placement of Au. africanus. For the “high relevance” characters, medoid partitioning (k = 2) of baraminic and Jaccard distances placed Au. africanus with the outgroup ape taxa and H. floresiensis, H. naledi, and Au. sediba with H. sapiens in the Homo sensu lato cluster. Using all the characters, medoid partitioning (k = 2) of baraminic and Jaccard distances placed Au. africanus in the same cluster as Homo sapiens, although the individual silhouette width for Au. africanus was negative for baraminic distances (-0.05) and Jaccard distances (-0.09). In contrast, two-cluster fuzzy analysis produced a single partition with an average silhouette widths ranging from 0.37 to 0.43. In this partition, H. floresiensis is placed with the outgroup ape taxa, but this results in individual silhouette widths for H. floresiensis ranging from -0.02 to -0.09.
Comparing all cluster partitions of the Wood (2020a) character set only by average silhouette width, we find the highest values for two-cluster medoid partitioning using baraminic distances calculated from “high relevance” characters (0.41) and for two-cluster fuzzy analysis using baraminic distances calculated from “high relevance” characters (0.43). Ironically, these two partitions differ in their placement of Homo floresiensis, placing it with the putative human cluster in the medoid partition and with the putative nonhuman cluster in the fuzzy analysis. The medoid partition that includes all Homo taxa and Au. sediba in the same cluster yields an individual silhouette width of 0.07 for Homo floresiensis, but the fuzzy partition that places H. floresiensis with the nonhuman apes yields an individual silhouette width of -0.07 for H. floresiensis. Thus, while the fuzzy partition has a slightly higher average silhouette width, it also gives a negative silhouette width to H. floresiensis.
We also calculated the average silhouette width for a partition consisting of one cluster of all Homo taxa together with Au. sediba and a second cluster containing the remaining taxa. This cluster had an average silhouette width of 0.41 using the “high relevance” baraminic distances (fig. 6). For this two-cluster partition, Au. sediba had an individual silhouette width of 0.40, and H. naledi had a silhouette width of 0.49. We tested the placement of Au. sediba and H. naledi by manually moving them to the other cluster in this two-cluster partition. This resulted in substantially worse average silhouette widths both for Au. sediba (-0.40) and H. naledi (-0.49) individually, and for the average of all taxa (fig. 7). Moving Au. sediba to its own singleton cluster causes the average silhouette width to drop to 0.22, and moving H. naledi to its own singleton cluster causes the average silhouette width to drop to 0.16.
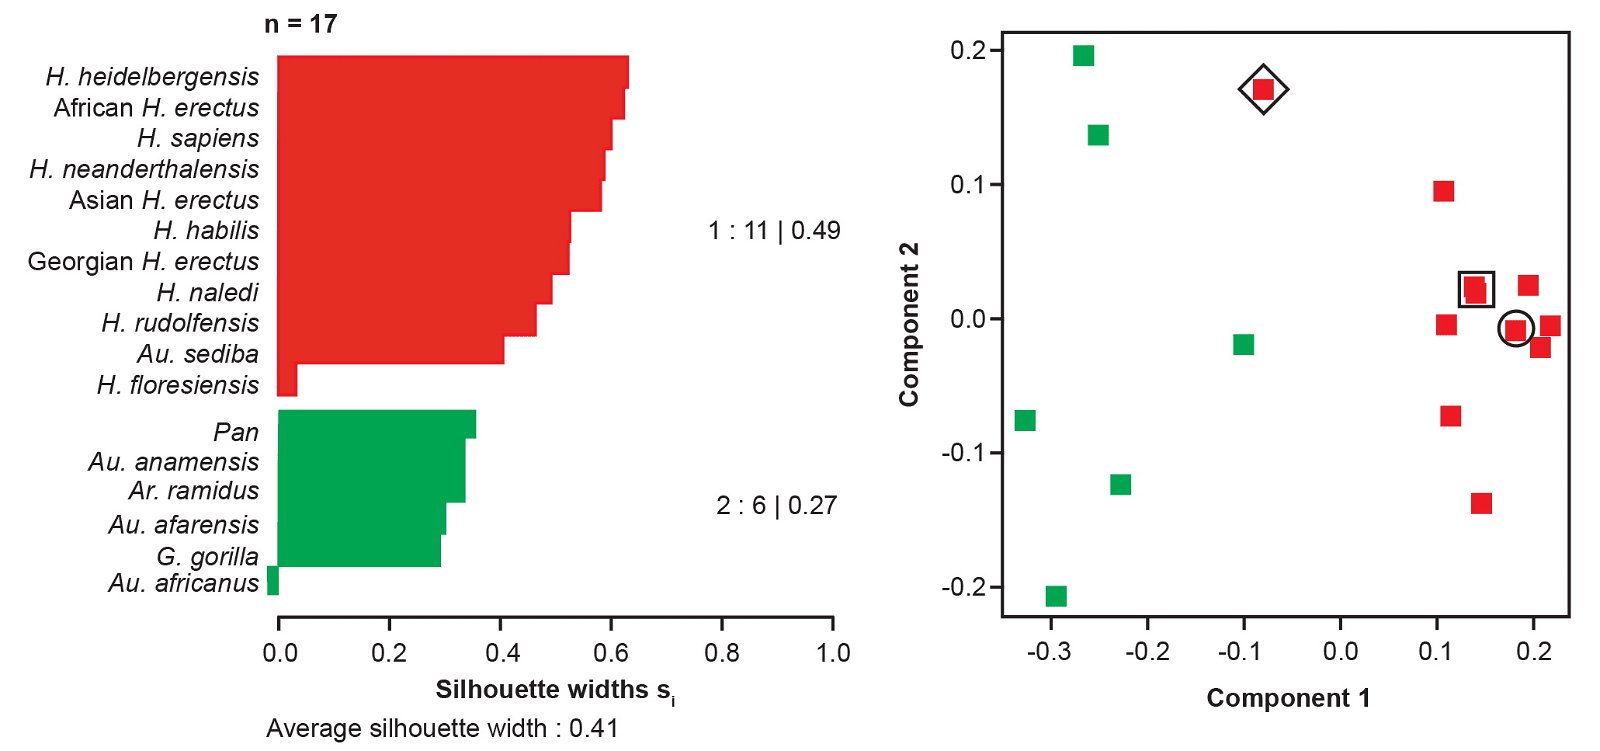
Fig. 6. Taxon partition for two clusters of “humans” vs. “nonhumans” based on Pearson BDC using “high relevance” (a ≥ 75%) characters from Wood’s (2020a) character set shown as a silhouette plot (left) and multidimensional scaling (right). In the MDS plot, Au. sediba is outlined by a black square, H. naledi by a black circle, and H. floresiensis by a black diamond.
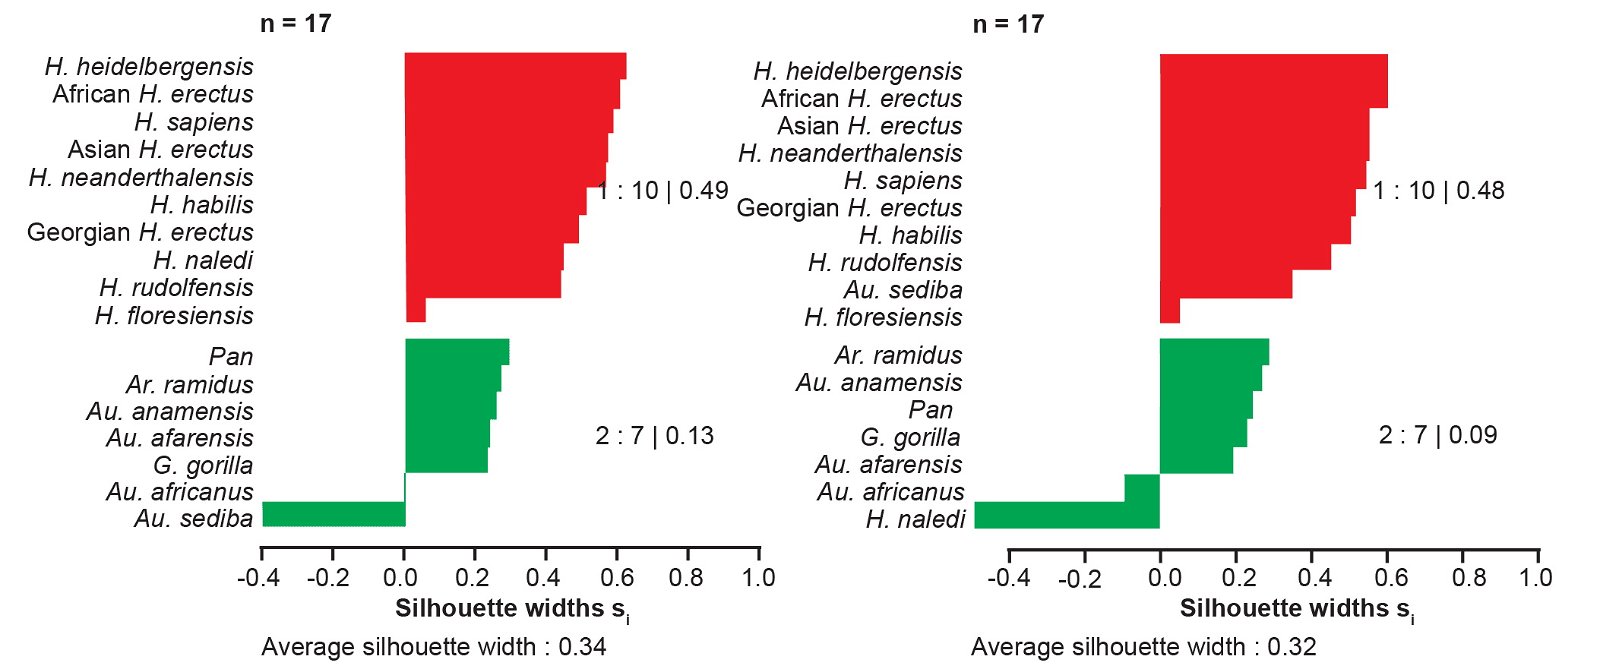
Fig. 7. Silhouette plots for hypothetical partitions created by moving Au. sediba (left) or H. naledi (right) into a different cluster. Silhouette widths were calculated from baraminic distances using “high relevance” (a ≥ 75%) characters from the Wood (2020a) character set.
For all distance correlation analyses (fig. 8) using the Wood (2020a) character set, all taxon pairs of the Homo sensu lato cluster share significant, positive distance correlation. In addition, significant, negative distance correlation is regularly observed between members of Homo sensu lato and the undisputed nonhuman apes. In all analyses H. floresiensis shares no significant distance correlation, positive or negative, with any of the other taxa, human or nonhuman.
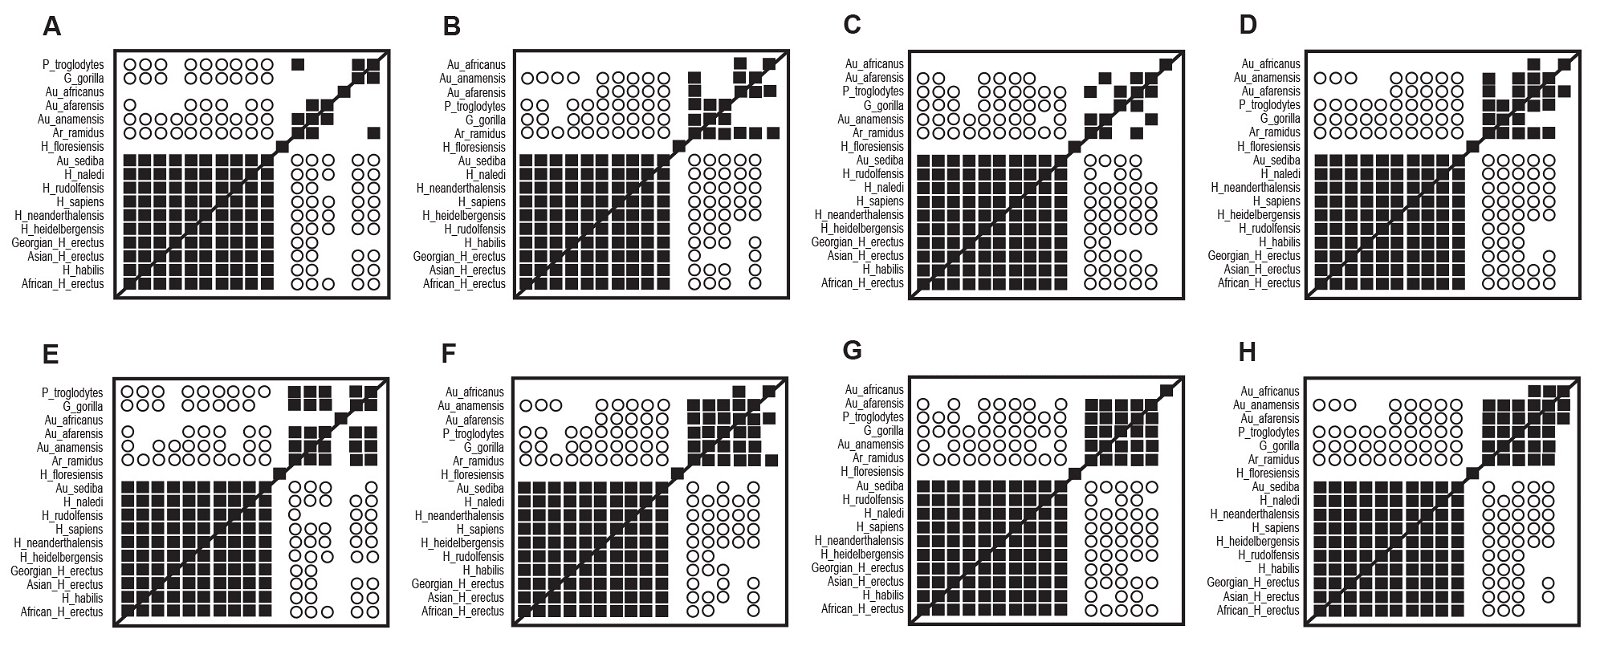
Fig. 8. All possible distance correlation results for the Dembo et al. (2016) character set as modified by Wood (2020a). Filled squares represented significant, positive correlation. Open circles indicate significant, negative correlation. A. Baraminic distances, “high relevance” (a ≥ 75%) characters, Pearson correlations. B. Baraminic distances, all characters, Pearson correlations. C. Jaccard distances, “high relevance” (a ≥ 75%) characters, Pearson correlations. D. Jaccard distances, all characters, Pearson correlations. E. Baraminic distances, “high relevance” (a ≥ 75%) characters, Spearman correlations. F. Baraminic distances, all characters, Spearman correlations. G. Jaccard distances, “high relevance” (a ≥ 75%) characters, Spearman correlations. H. Jaccard distances, all characters, Spearman correlations.
Discussion
Previous hominin baraminology studies have generated resistance from some creationists, most recently in Reeves’s (2021a, 2021b) general critique of statistical baraminology procedures. In particular, the status of Au. sediba, H. naledi, and even H. floresiensis have been disputed. Here we have reassessed earlier attempts at hominin baraminology using alternative clustering methods and craniodental characters. Our intention is to test whether Reeves’s recommended methods would have yielded a different conclusion about the human holobaramin had they been used over the past decade. Our intention is not to render a final judgment on the human holobaramin.
Using the original characters of Berger et al. (2010) we found no reason to alter previous conclusions about the membership of the human holobaramin. Instead, the results of previous studies were reinforced with the expanded toolkit recommended by Reeves (2021a, 2021b) and Wood (2021a). We found here that Au. sediba consistently clusters with members of genus Homo, even when using alternative distances and cluster analysis methods. We consequently conclude that if Wood (2010) had used these alternate clustering methods in his previous baraminology study, his judgment would have been the same: Au. sediba is a member of the human holobaramin.
Using the most recent character set developed by Dembo et al. (2016) and updated by Wood (2020a), the partitions are less clear but they still support placing H. naledi and Au. sediba in the same taxonomic cluster as H. sapiens, H. neanderthalensis, and H. erectus. Using these more recent characters, we also found frequent instances of significant, negative distance correlation between Homo sensu lato and extant apes, much more frequently than has been observed in previous studies. This widespread significant, negative distance correlation thus supports the inference of a discontinuity between the human holobaramin and nonhuman apes to a greater extent than in previous research. Our attempts to move Au. sediba and H. naledi into nonhuman clusters resulted in a much poorer taxonomic partition (as judged by silhouette widths) thus reaffirming their inclusion in the Homo cluster. We again conclude that the Wood (2020a) characters and the clustering methods used in this study support the inclusion of H. naledi and Au. sediba in the human holobaramin.
Given the results of our analysis of Berger et al.’s (2010) and Dembo et al.’s (2016) updated characters sets, we conclude that these additional methods do not substantially alter previous conclusions: the human holobaramin consists of the well-characterized human forms of H. sapiens, Neandertals, and H. erectus and probably includes the more fragmentary H. heidelbergensis, H. habilis, H. rudolfensis, H. naledi, and Au. sediba. Unsurprisingly, even with the added character states from Haile-Selassie et al. (2019) and Mongle, Strait, and Grine (2019), Au. anamensis and Ar. ramidus never cluster with any putatively human taxa and likely do not belong to the human holobaramin. Altogether then, these new results do not modify our previous baraminological findings.
Despite this new study, questions remain. In particular, the status of H. floresiensis remains uncertain based on the character set of Wood (2020a). Distance correlation placed H. floresiensis in its own singleton cluster rather than in a human or nonhuman cluster. Three-cluster and two-cluster medoid partitioning placed H. floresiensis in the human cluster, but fuzzy analysis did not. Three-cluster fuzzy analysis divided the human cluster, sometimes placing H. floresiensis in a cluster with humans and sometimes with undisputed nonhuman apes. Two-cluster fuzzy analysis uniformly placed H. floresiensis in a cluster with nonhuman apes. Given the lack of consistency, we cannot make a firm conclusion regarding the status of H. floresiensis.
The placement of Au. africanus seems much more certain, but questions remain. In Wood’s (2010) original analysis, three of the character sets he examined yielded significant, positive distance correlation between Au. africanus and other members of Homo, but the bootstrap values were low. Subsequent studies have not supported this connection (Wood 2016a, 2017), but here, we found two two-cluster medoid partitions using all characters for baraminic and Jaccard distances that also placed Au. africanus in the same cluster as Homo species (table 4). This is very much a minority position, but we note this as yet another example of inconsistency generated from the most recent character matrix generated by Dembo et al. (2016) and updated by Wood (2020a).
This lack of consensus might cause us to question the utility of the Wood (2020a) character matrix. This skepticism could be justified by the lower average silhouette widths from partitions calculated from this character set, which fall in the upper range of what Kaufman and Rousseeuw (1990) subjectively judged to be “weak” clustering. Still, the general results from these characters seem quite clear. Au. sediba and H. naledi consistently group with indisputably human taxa (H. sapiens, Neandertals). Undisputed nonhuman apes, such as chimpanzees, gorillas, Ardipithecus ramidus, and Australopithecus afarensis, never cluster with undisputed humans. Only three-cluster fuzzy analysis separates the putatively human cluster into two groups, resulting in substantially lower average silhouette widths (0.19–0.20, which therefore justifies our skepticism of that outcome. Otherwise, the primary question seems to be the placement of Homo floresiensis, which in distance correlation falls into a singleton, in medoid partitioning clusters with other Homo species, and in two-cluster fuzzy analysis groups with the nonhuman outgroup taxa. Further study of these taxa with additional characters or additional character states may provide a clearer picture of the clustering of Homo floresiensis.
Finally, O’Micks (2016a) has asserted that postcranial characters ought to be included in baraminological evaluations. He is unquestionably correct on this point. Several baraminological studies have attempted to utilize postcranial characters in their distance correlation (O’Micks 2016a, 2017b; Wood 2013), but these studies were hampered by the rarity of published information on such postcranial characters. Several hominin species have very little or no known postcranial material, thus excluding them from such analyses. As a consequence, Wood (2013, 2016b) found that the reduced taxon sample size eliminated observed distance correlations, even when using a larger set of exclusively craniodental characters. The recent publication of newly discovered postcranial material and descriptions of older postcranial material (e.g., Clarke 2019; Hawks et al. 2017; Haile-Selassie and Su 2016; Richmond et al. 2020; Zipfel, Richmond, and Ward 2020) may assist future baraminological studies. We look forward to future discoveries that may enable a more holistic approach to human baraminological evaluation.
This baraminological study has corroborated the results of Wood’s (2010) study and therefore suggests that his conclusions, rather than being an artifact of methodology, represent a robust inference from different hominin character sets. The consistency that has been noted despite the variety of methods that have been utilized gives hope for the future of baraminology. The procedures used in this paper (with multiple clustering methods to evaluate previous results) give us a tool with which to test other anomalous or disputed results. General consistency between differing methods gives evidence of the reality of these holobaramins and increased confidence concerning their membership. Further research and refinement of character sampling may eventually give us more confidence in assigning H. floresiensis to a holobaramin. In addition, the inclusion of postcranial characters in hominin baraminology studies will be necessary to ensure a more holistic classification of hominin species and may be important for resolving the relationship of H. floresiensis. Despite the limitations of the present study, our results provide a good confirmation of the existence and membership of the human holobaramin as determined in previous baraminological analyses.
References
Argue, Debbie, Colin P. Groves, Michael S. Y. Lee, and William L. Jungers. 2017. “The Affinities of Homo floresiensis Based on Phylogenetic Analyses of Cranial, Dental, and Postcranial Characters.” Journal of Human Evolution 107 (June): 107–133.
Berger, Lee R., Darryl J. de Ruiter, Steven E. Churchill, Peter Schmid, Kristian J. Carlson, Paul H. G. M. Dirks, and Job M. Kibii. 2010. “Australopithecus sediba: A New Species of Homo-Like Australopith from South Africa.” Science 328, no. 5975 (April 9): 195–204.
Clarey, Tim. 2015. “Homo naledi: Claims of a Missing Link.” Acts & Facts 44, no. 12 (December): 17.
Clarke, Ronald J. 2019. “Excavation, Reconstruction and Taphonomy of the StW 573 Australopithecus prometheus Skeleton From Sterkfontein Caves, South Africa.” Journal of Human Evolution 127, no. 2 (February): 41–53.
Dembo, Mana, Davorka Radovčić, Heather M. Garvin, Myra F. Laird, Lauren Schroeder, Jill E. Scott, Juliet Brophy et al. 2016. “The Evolutionary Relationships and Age of Homo naledi: An Assessment Using Dated Bayesian Phylogenetic Methods.” Journal of Human Evolution 97 (August): 17–26.
Haile-Selassie, Yohannes, and Denise F. Su, eds. 2016. The Postcranial Anatomy of Australopithecus afarensis: New Insights from KSD-VP-1/1. New York, New York: Springer.
Haile-Selassie, Yohannes, Stephanie M. Melillo, Antonino Vazzana, Stefano Benazzi, and Timothy M. Ryan. 2019. “A 3.8-Million-Year-Old Hominin Cranium from Woranso- Mille, Ethiopia.” Nature 573, no. 7773 (12 September): 214–219.
Hawks, John, Marina Elliott, Peter Schmid, Steven E. Churchill, Darryl J. de Ruiter, Eric M. Roberts, Hannah Hilbert-Wolf et al. 2017. “New Fossil Remains of Homo naledi From the Lesedi Chamber, South Africa.” eLife 6 (9 May): e24232.
Kaufman, Leonard, and Peter J. Rousseeuw. 1990. Finding Groups in Data: An Introduction to Cluster Analysis. New York, New York: John Wiley & Sons.
Line, Peter. 2006. “The Mysterious Hobbit.” Journal of Creation 20, no. 3 (December): 17–24.
Line, Peter. 2010. “Australopithecus sediba—No Human Ancestor.” Journal of Creation 24, no. 2 (August): 9–11.
Line, Peter. 2016. “The Mysterious Rising Star Fossils.” Journal of Creation 30, no. 3 (December): 88–96.
McLain, Matthew. 2017. “Reply to O’Micks Concerning the Geology and Taphonomy of the Homo naledi Site.” Answers Research Journal 10 (15 February): 55–56.
Menton, David N., Anne Habermehl, and David A. DeWitt. 2010. “Baraminological Analysis Places Homo habilis, Homo rudolfensis, and Australopithecus sediba in the Human Holobaramin: Discussion.” Answers Research Journal 3 (25 August): 153–158.
Mongle, Carrie S., David S. Strait, and Frederick E. Grine. 2019. “Expanded Character Sampling Underscores Phylogenetic Stability of Ardipithecus ramidus as a Basal Hominin.” Journal of Human Evolution 131 (June): 28–39.
Nalin, Ronny. 2015. “Is Homo naledi Your ‘Relative,’ ‘Ancestor,’ or ‘Part of the Human Family Tree’?” Geoscience Research Institute. 1 October. https://www.grisda.org/is-homo-naledi-your-relative-ancestor-or-part-of-the-human-family-tree-1.
O’Micks, Jean. 2016a. “Homo naledi Probably Not Part of the Human Holobaramin Based on Baraminic Re-Analysis Including Postcranial Evidence.” Answers Research Journal 9 (26 October): 263–272. https://assets.answersresearchjournal.org/doc/v9/homo-naledi.pdf.
O’Micks, Jean. 2016b. “Reply to ‘Taxon Sample in Hominin Baraminology: A Response to O’Micks.’” Answers Research Journal 9 (28 December): 373–375. https://assets.answersresearchjournal.org/doc/v9/taxon_hominin_baraminology_reply.pdf.
O’Micks, Jean. 2017a. “Rebuttal to ‘Reply to O’Micks Concerning the Geology and Taphonomy of the Homo naledi Site’ and ‘Identifying Humans in the Fossil Record: A Further Response to O’Micks.’” Answers Research Journal 10 (15 February): 63–70. https://assets.answersresearchjournal.org/doc/v10/homo_naledi_rebuttal.pdf.
O’Micks, Jean. 2017b. “Further Evidence That Homo naledi Is Not a Member of the Human Holobaramin Based on Measurements of Vertebrae and Ribs.” Answers Research Journal 10 (21 June): 103–113. https://answersresearchjournal.org/homo-naledi-not-human-holobaramin/.
O’Micks, Jean. 2017c. “Likely Discontinuity Between Humans and Non-Human Hominins Based on Endocranial Volume and Body Mass with a Special Focus on Homo naledi—A Short Analysis.” Answers Research Journal 10 (11 October): 241–243. https://assets.answersresearchjournal.org/doc/v10/humans_non-human_hominins_homo_naledi.pdf.
Reeves, Colin R. 2021a. “A Critical Evaluation of Statistical Baraminology: Part 1—Statistical Principles.” Answers Research Journal 14 (14 July): 261–269. https://assets.answersresearchjournal.org/doc/v14/statistical_baraminology_statistical_principles.pdf.
Reeves, Colin R. 2021b. “A Critical Evaluation of Statistical Baraminology: Part 2—Alternatives and Conceptual and Practical Issues.” Answers Research Journal 14 (14 July): 271–282.
Richmond, B. G., D. J. Green, M. R. Lague, H. Chirchir, A. K. Behrensmeyer, R. Bobe, M. K. Bamford, et al. 2020. “The Upper Limb of Paranthropus boisei from Ileret, Kenya.” Journal of Human Evolution 141 (April): 102727.
Rupe, Christopher and John Sanford. 2017. Contested Bones. New York, New York: FMS Publications.
Thomas, Brian. 2011. “Evolutionary ‘game changer’ doesn’t change anything.” Acts & Facts 40, no. 12 (December): 16– 17.
Trafí, Francesc Ribot, Mario García Bartual, and Qian Wang. 2018. “The Affinities of Homo antecessor—a Review of Craniofacial Features and Their Taxonomic Validity.” Anthropological Review 81, no. 3 (August 31): 225–251.
Wise, Kurt P. 2005. “The Flores Skeleton and Human Baraminology.” Occasional Papers of the BSG 6, no. 6 (2 November): 1–13.
Wise, K. P. 2016. “Paleontological Note on Homo naledi.” Journal of Creation Theology and Science Series B: Life Sciences 6 (9 May): 9–13.
Wood, Todd Charles. 2010. “Baraminological Analysis Places Homo habilis, Homo rudolfensis, and Australopithecus sediba in the Human Holobaramin.” Answers Research Journal 3 (5 May): 71–90. https://assets.answersresearchjournal.org/doc/v3/hominid-baraminology.pdf.
Wood, Todd Charles. 2013. “Australopithecus sediba, Statistical Baraminology, and Challenges to Identifying the Human Holobaramin.” In Proceedings of the Seventh International Conference on Creationism, edited by Mark Horstemeyer. Pittsburgh, Pennsylvania: Creation Science Fellowship.
Wood, Todd Charles. 2016a. “An Evaluation of Homo naledi and “Early” Homo from a Young-Age Creationist Perspective.” Journal of Creation Theology and Science Series B: Life Sciences 6 (9 May): 14–30.
Wood, Todd Charles. 2016b. “Taxon Sample Size in Hominin Baraminology: A Response to O’Micks.” Answers Research Journal 9 (28 December): 369–372. https://assets.answersresearchjournal.org/doc/v9/taxon_hominin_baraminology_response.pdf.
Wood, Todd Charles. 2017. “Identifying Humans in the Fossil Record: A Further Response to O’Micks.” Answers Research Journal 10 (15 February): 57–62. https://assets.answersresearchjournal.org/doc/v10/homo_naledi_response.pdf.
Wood, Todd. 2020a. “An Expanded Character Set for Evaluating the Phylogenetic Position of Homo floresiensis.” In Program of the 89th Annual Meeting of the American Association of Physical Anthropologists April 15–18, 2020, edited by Steven R. Leigh, 312. Los Angeles, California: American Association of Physical Anthropologists.
Wood, Todd Charles. 2020b. “Expanding the Toolkit of Statistical Baraminology with BARCLAY: Baraminology and Cluster Analysis.” Journal of Creation Theology and Science Series B: Life Sciences 10 (22 July): 7.
Wood, Todd Charles. 2021a. “Baraminology by Cluster Analysis: A Response to Reeves.” Answers Research Journal 14 (14 July): 283–302.
Wood, Todd Charles 2021b. “An Expanded Character Set for Evaluating the Phylogenetic Position of Homo floresiensis.” https://doi.org/10.5061/dryad.905qfttm7.
Zipfel, Bernhard, Brian G. Richmond, and Carol V. Ward, eds. 2020. Hominin Postcranial Remains from Sterkfontein, South Africa, 1936–1995. New York, New York: Oxford University Press.


