The views expressed in this paper are those of the writer(s) and are not necessarily those of the ARJ Editor or Answers in Genesis.
Abstract
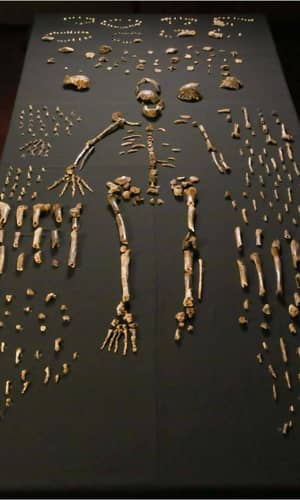
A recent debate within creationist circles has reached a new point about the baraminic status of Homo naledi, a new primate species discovered in South Africa. Initial studies based on craniodental characters suggested that H. naledi is probably a member of the human holobaramin. However, subsequent analyses of the post-cranium have cast this original statement into doubt. Analyses of the thorax, upper limb, thigh, and foot of H. naledi suggest that this species shows continuity with australopiths, and discontinuity with the human holobaramin. The present study analyzes five characters of the atlas and axis, as well as 22 characters of the antepenultimate and the penultimate thoracic vertebrae. The results show statistically significant continuity between two members of the human holobaramin as well as continuity between Homo naledi and three Australopithecus species as well as Paranthropus robustus. Analysis of the 22 characters with weights reinforces already existing baraminic relationships. More importantly, statistically significant discontinuity is shown to exist between members of the human holobaramin and the Australopithecine baramin. Fresh evolutionary dates assigned to H. naledi of 236–335 ka, which are three times younger than predicted previously, strongly contradicting the evolutionary narrative that H. naledi was a species basal to the genus Homo. This study provides further evidence that Homo naledi is indeed not a member of the human holobaramin, but related rather to australopiths.
Keywords: Homo naledi, human, Australopithecus, baraminology, holobaramin, vertebra, rib
Introduction
In the wake of a detailed discussion within creationist circles about the baraminic status of Homo naledi (McLain 2017; O’Micks 2016a, b, c 2017; Wood 2016a, b 2017), more evidence has accumulated that H. naledi indeed is a member of the Australopithecus baramin, and is not human. These previous analyses of measurements on H. naledi’s cranium (Berger et al. 2015; Laird et al. 2017), foot (Harcourt-Smith et al. 2015), hand (Kivell et al. 2015), upper limb (Feuerriegel et al. 2017), and thigh (Marchi et al. 2017) show that H. naledi either shows continuity with members of the Australopithecus baramin, or that it is not continuous with members of the human holobaramin. Despite the initial conclusion that H. naledi was likely to be a member of the human holobaramin based on craniodental characteristics alone (O’Micks 2016a; Wood 2016a), the addition of post-cranial characters cast this conclusion into doubt (O’Micks 2016b).
The vertebral column is a major characteristic of vertebrates in general, and especially in hominoid primates. It is responsible for upright posture and bipedal locomotion. Non-human primates are stiff-backed, whereas hominoid primates have a more mobile lower back, adapted to lordosis and erect posture, required for bipedalism (Williams et al. 2016). African great apes have funnel-shaped thoraces, which are narrow at the top, and are wide or flaring at the bottom, with a relatively short lumbar column. On the other hand, humans have a barrel-shaped thorax with a wider upper ribcage, with a narrow waist, atop a relatively longer lumbar vertebral column. The ribcage of H. naledi is distally wide, like what we see in Australopithecus species (Berger 2015). Humans also have elongated hind limbs, which make bipedalism possible (Williams et al. 2017). In humans, the first seven ribs are true ribs, ribs eight to ten are false ribs, and eleven and twelve are floating ribs. The number of lumbar vertebrae also vary in primates between four and nine (Gebo 2014).
Most primates have a pre-sacral vertebrae formula of 7C:13T:6L/7C:12T:7L (“C” stands for cervical, “T” for thoracic, and “L” for lumbar), along with a sacrum of three fused vertebrae. However, the number of vertebrae in the spinal column of hominins has been known to vary (Williams and Russo 2015). Some researchers have found 12–13 thoracic vertebrae, and six lumbar vertebrae in Australopithecus and Homo (McCollum et al. 2010). The number of thoracic vertebrae is presumed to be the same in Australopithecus as in Homo (Williams et al. 2013).
The first two vertebrae in the vertebral column, the atlas (C1) and the axis (C2) are responsible for articulating with the skull and rotating it. Movement of the head is accomplished by the way the axis articulates via a bony process called the dens into the atlas. In quadruped primates, the dens is oriented dorsally, since the animal is facing forward. In humans, however, the dens points upwards in the upward vertebral column (Gebo 2014).
The bodies of the antepenultimate (T10) and penultimate (T11) vertebrae are proportionally similar to Homo, yet the neural canals of the vertebrae are proportionally larger than modern humans, Neandertals, and H. erectus (Berger 2015). Facets for the tenth rib are posteriorly positioned in H. naledi, almost entirely on the pedicle, as opposed to humans (Hawks et al. 2017). The penultimate thoracic vertebra is a transitional vertebra between the thoracic and lumbar sections of the spinal column. This is the vertebra at which locomotor adaptation takes place between thoracic and lumbar type vertebral facets (Hauesler, Schiess, and Boeni 2011). Fig. 1 shows the T10 and T11 vertebrae in several Australopithecus species as well as H. naledi, human and Neandertal. We can see quite well that the vertebral bodies of the vertebra of human and Neandertal are quite different in size compared to australopiths and H. naledi.
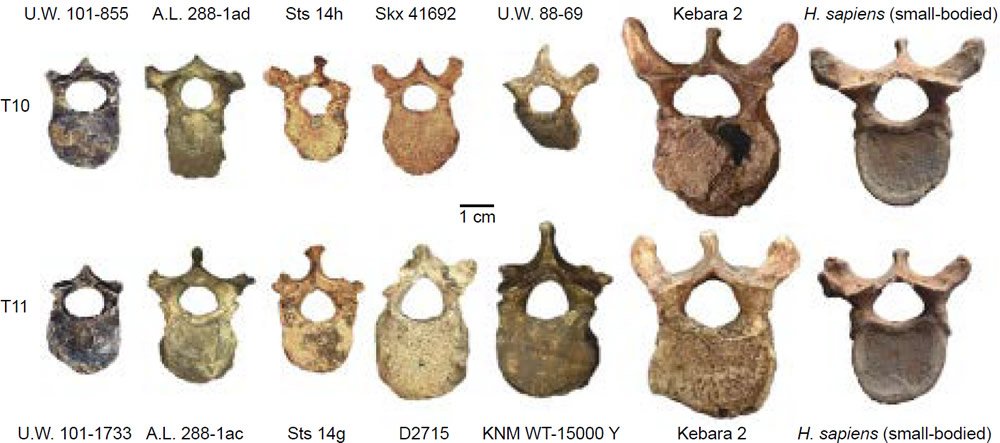
Fig. 1. Dorsal view of the antepenultimate (T10, top row) and penultimate (T11, bottom row) vertebrae from several Australopithecus and Homo species. Top row, from left to right: H. naledi (U.W. 101-855), A. afarensis (A. L. 288-1ad), A. africanus (Sts 14h), P. robustus (SKX 41692), A. sediba MH1 (U.W. 88-69), H. neanderthalensis (Kebara 2), small-bodied H. sapiens. Bottom row, from left to right: H. naledi (U.W. 101-1733), A. afarensis (A. L. 288-1ac), A. africanus (Sts 14g), H. erectus (Dmanisi D2715), H. erectus (KNM WT-15000 Y, juvenile), H. neanderthalensis (Kebara 2), small-bodied H. sapiens. Image courtesy of Scott A. Williams, and taken from Williams et al. 2017 with permission.
Besides measurements of the foot, hand, thigh, and upper limb of H. naledi, a recent paper has been published presenting measurements of the vertebra and ribs, comparing it to a dozen other primate species (Williams et al. 2017). Therefore, in this paper we will analyze the data sets presented by Williams et al. (2017) to see what kind of baraminological conclusions we can make from them.
Materials and Methods
This paper analyzes 22 morphological characteristics separately in two of the thoracic vertebrae of 15 species which had measurements in Tables 1 and 2 of Williams et al. (2017). These measurements were made on different anatomical parts of the antepenultimate (T10) and penultimate (T11) thoracic vertebrae. Five characteristics were analyzed for four species for the atlas (C1) and axis (C2), from Table 1 in Williams (2017). These measurements are explained in Williams (2017).
| A. afarensis A.L. 288 1AD | A. afarensis A.L. 333X 12 | A. africanus Sts 14 | A. sediba MH1 | H. naledi 101 855 | Modern humans | Modern humans (small bodied) | Neandertal Kebara 2 | P. robustus SKX 41692 | Pan troglodytes | |
|---|---|---|---|---|---|---|---|---|---|---|
| A. afarensis A.L. 288 1AD | 0 | 0.5 | 0.545 | 0.591 | 0.545 | 0.864 | 0.682 | 0.818 | 0.545 | 0.773 |
| A. afarensis A.L. 333X 12 | 0 | 0.591 | 0.409 | 0.5 | 0.955 | 0.682 | 0.955 | 0.409 | 0.727 | |
| A. africanus Sts 14 | 0 | 0.409 | 0.182 | 1 | 0.909 | 1 | 0.273 | 0.864 | ||
| A. sediba MH1 | 0 | 0.318 | 1 | 0.864 | 0.955 | 0.364 | 0.955 | |||
| H. naledi 101 855 | 0 | 1 | 0.955 | 1 | 0.091 | 0.864 | ||||
| Modern humans | 0 | 0.545 | 0.227 | 1 | 0.591 | |||||
| Modern humans (small bodied) | 0 | 0.727 | 0.909 | 0.5 | ||||||
| Neandertal Kebara 2 | 0 | 1 | 0.727 | |||||||
| P. robustus SKX 41692 | 0 | 0.773 | ||||||||
| Pan troglodytes | 0 |
| A. afarensis A.L. 288 1AD | A. afarensis A.L. 333X 12 | A. africanus Sts 14 | A. sediba MH1 | H. naledi 101 855 | Modern humans | Modern humans (small bodied) | Neandertal Kebara 2 | P. robustus SKX 41692 | Pan troglodytes | |
|---|---|---|---|---|---|---|---|---|---|---|
| A. afarensis A.L. 288 1AD | 1 | 0.54 | 0.471 | 0.446 | 0.456 | -0.618 | -0.251 | -0.537 | 0.462 | -0.393 |
| A. afarensis A.L. 333X 12 | 1 | 0.54 | 0.732 | 0.616 | -0.812 | -0.304 | -0.785 | 0.689 | -0.353 | |
| A. africanus Sts 14 | 1 | 0.816 | 0.961 | -0.859 | -0.713 | -0.797 | 0.923 | -0.6 | ||
| A. sediba MH1 | 1 | 0.867 | -0.864 | -0.649 | -0.77 | 0.849 | -0.708 | |||
| H. naledi 101 855 | 1 | -0.874 | -0.755 | -0.803 | 0.984 | -0.61 | ||||
| Modern humans | 1 | 0.507 | 0.934 | -0.894 | 0.437 | |||||
| Modern humans (small bodied) | 1 | 0.307 | -0.713 | 0.607 | ||||||
| Neandertal Kebara 2 | 1 | -0.836 | 0.253 | |||||||
| P. robustus SKX 41692 | 1 | -0.531 | ||||||||
| Pan troglodytes | 1 |
The species studied in the first analysis are H. naledi, Australopithecus afarensis A. L. 288-1AD, A. afarensis A. L. 333X-12, A. africanus Sts14, A. sediba MH1, Paranthropus robustus SKX-41692, H. erectus KNM-WT 15000 (“Turkana Boy”, a juvenile), H. sapiens neanderthalensis Kebara 2, H. sapiens (measurements were averages of 33–46 individuals), H. sapiens (small bodied; measurements were an average of four individuals), and Pan troglodytes (measurements were averages of 16–19 animals). H. erectus KNM-WT 15000 was excluded from the analysis, because 40% of its characteristics were not available. The data for this study came from Table 2 of Williams et al. 2017, which had data for the T10 vertebra.
Baraminic distances and correlations were also calculated using the weighted version of the BDIST algorithm. The weights can be seen in Table 3 for the 22 characters used in the matrix. The rationale for applying these weights is that it is redundant to measure the same morphological character (e.g. the pedicle) multiple times. Characters only add taxonomic information if they are independent of other characters (Lieberman 1999). For example, that is why in Table 3 the three pedicle characters were each given a weight of 0.33.
| Character | Weight |
|---|---|
| Body superior transverse diameter | 0.5 |
| Body superior dorsoventral diameter | 0.5 |
| Body inferior transverse diameter | 0.5 |
| Body inferior dorsoventral diameter | 0.5 |
| Body ventral height | 0.5 |
| Body dorsal height | 0.5 |
| Max. inter-SAF distance | 0.5 |
| Min. inter-SAF distance | 0.5 |
| Max. inter-IAF distance | 0.5 |
| Min. inter-IAF distance | 0.5 |
| Superoinferior inter-AF height | 1.0 |
| Canal dorsoventral diameter | 0.5 |
| Canal transverse diameter | 0.5 |
| SAF superoinferior diameter | 0.5 |
| SAF transverse diameter | 0.5 |
| IAF superoinferior diameter | 0.5 |
| IAF transverse diameter | 0.5 |
| Pedicle superoinferior height | 0.33 |
| Pedicle transverse breadth | 0.33 |
| Pedicle dorsoventral length | 0.33 |
| Lamina superoinferior height | 0.5 |
| Lamina transverse width | 0.5 |
Since the species in Table 2 which had data for the T11 vertebra were different than those in Table 1, a separate analysis was performed with this data. The species studied in this analysis were H. naledi, Australopithecus afarensis A. L. 288-1AC, A. africanus Sts 14, A. africanus StW 41, A. sediba MH2, H. erectus Dmanisi, H. erectus KNM-WT 15000, H. sapiens neanderthalensis Kebara 2, H. sapiens (measurements were averages of 34–47 individuals), H. sapiens (small bodied; measurements were averages of four individuals), and Pan troglodytes (measurements were averages of 19 animals). A. sediba MH2 and A. africanus StW 41 were excluded, because they were missing 59% and 73% of their data points, respectively.
The measurements from Williams 2017 were transformed according to equation 1 from O’Micks 2016a, except that the scaling factor was 2.999, and not 3.999. The character matrix was analyzed by the BDIST software at http://www.coresci.org/bdist.html (Robinson and Cavanaugh 1998; Wood 2005, 2008). The data points were calculated in three-dimensional character space using multidimensional scaling (MDS), also available in the online program package by Wood (2008), and visualized using Kinemage software (available at http://kinemage.biochem.duke. edu/software/mage.php).
The baraminic character matrix along with the BDIST output are available as Supplementary Data for both analyses.
Results
Analysis of the T10 vertebra
Fig. 2 shows the baraminic distance correlations between the ten species studied in the first analysis. For a character relevance cutoff of 0.75, all 22 characters for the ten species were significant, and no species had a taxic relevance of less than 0.66. As we can see, there are two main groups, with three singleton species. The five members of the first group are A. afarensis A. L. 333X-12, A. africanus Sts 14, A. sediba MH1, P. robustus SKX-41692, and H. naledi. The two members of the second group are H. sapiens and Neandertal Kebara 2.
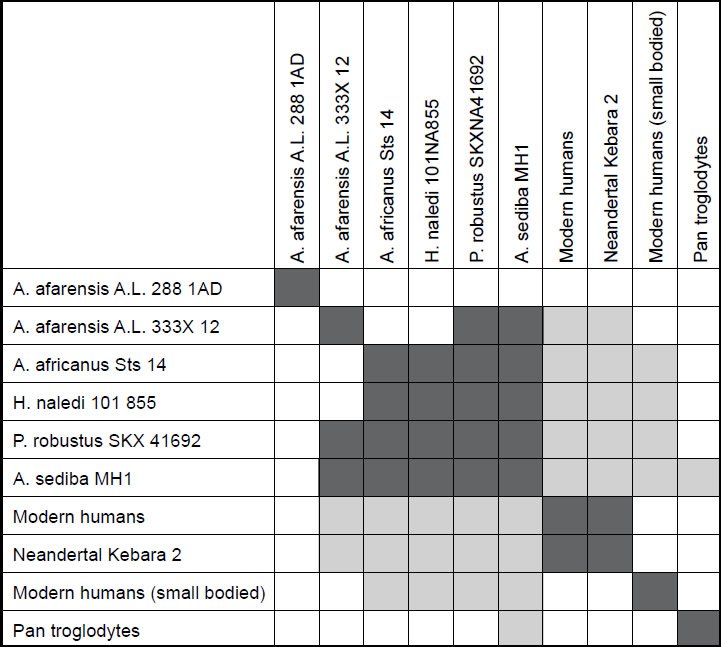
Fig. 2. Baraminic distance correlation matrix for four Australopithecus species, one Paranthropus species, three human species (including Neandertal), chimpanzee, and H. naledi. Dark gray boxes show that two species are significantly correlated. Light gray boxes show that two species are significantly negatively correlated.
What we can see in the first group quite well is that H. naledi correlates very well with several Australopithecus species: A. africanus and A. sediba, as well as with P. robustus. The correlation values for these three species pairs is 0.961, 0.816 and 0.984 respectively. The baraminic distances are also low: 0.182, 0.318, and 0.091, respectively. The bootstrap values for these three species relationships are 100+, 97+, and 100+, respectively. With this, we can state that H. naledi shows significant positive baraminic relationships between two members of the Australopithecus baramin as well as P. robustus. This also means that H. naledi shows baraminic continuity with these species. A. africanus, A. sediba, and P. robustus also have baraminic distances ranging from 0.279–0.409, baraminc correlations between 0.816 and 0.923, as well as positive bootstrap values between 90+ and 100+, all showing that these are members of a well-defined baramin, with high baraminic continuity between one another.
Between H. sapiens and Neandertal there is a baraminic distance of 0.227, which is the third lowest distance value, as well as a baraminic correlation value of 0.934, which is the third highest correlation value in the correlation matrix. A bootstrap value of 100+ makes this a very significant positive baraminic correlation. Neandertals have long been considered to be part of the human holobaramin according to the creationist literature.
Besides the strong positive baraminic correlations between the individual species of the two main groups denoting continuity between them, there is also significant discontinuity between the members of the first group and the second group. Both H. sapiens and Neandertal have a baraminic distance between 0.955 and 1.0 between themselves and all five members of the first group. The baraminic correlation between members of the first and second group range from −0.894 to −0.77. Most of the bootstrap values show significant discontinuity with a value of 100o, except for a value of 88o between Neandertal and A. sediba MH1. Also, the bootstrap values between both H. sapiens and Neandertal and A. afarensis A. L. 333X-12 are < 90.
When analyzing the character matrix using the weighting scheme, 20 out of 24 positive baraminic correlations increased, and only four decreased (average increase 0.05 ± 0.08). The correlation between A. afarensis A.L. 333X 12 and P. robustus increased from 0.689 to 0.708, which is a relatively strong statistical correlation. Also, 16 out of 21 negative baraminic correlations decreased, and only five increased (average decrease −0.04 ± 0.06).
In the 3D MDS plot we can see that H. sapiens and Neandertal are close to each other, however, small bodied humans stand a bit farther away, halfway between the two main groups. P. troglodytes, an outlier species, doesn’t belong to either group; its spinal process is longer than that of human, and its superior articular facet forms an acute angle with the sagittal plane compared to an obtuse angle in humans. The absolute vertebral size in P. troglodytes is also larger than that of A. sediba (Meyer et al. 2017). The five members of the first group (three Australopithecus species as well as H. naledi and P. robustus) cluster closely together, with A. afarensis A.L. 288-1AD nearby (Fig. 3). 3D stress was at 0.101, which is rather good (Fig. 4). There was a minimum stress value of 0.031 at k = 5 dimensions.
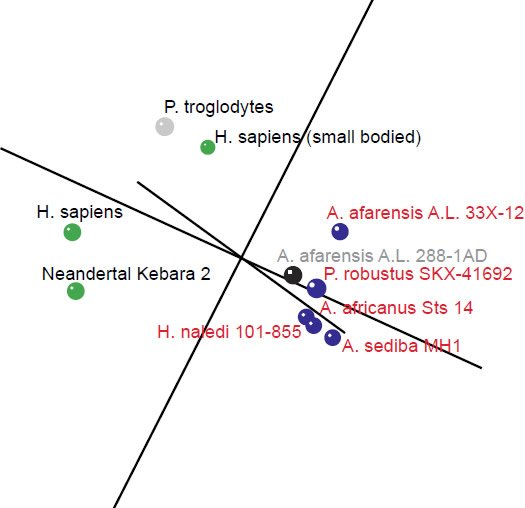
Fig. 3. 3D MDS coordinates for the Australopithecus, Homo, Paranthropus and Pan species. The coloring of the dots represents the different groups determined by the BDC results. Green: H. sapiens, H. sapiens (small bodied), and Neandertal Kebara 2. Blue: A. afarensis A. L. 33X-12, A. africanus Sts 14, A. sediba MH1, P. robustus SKX-41692, H. naledi. Black: A. afarensis A. L. 288-1AD. Gray: P. troglodytes.
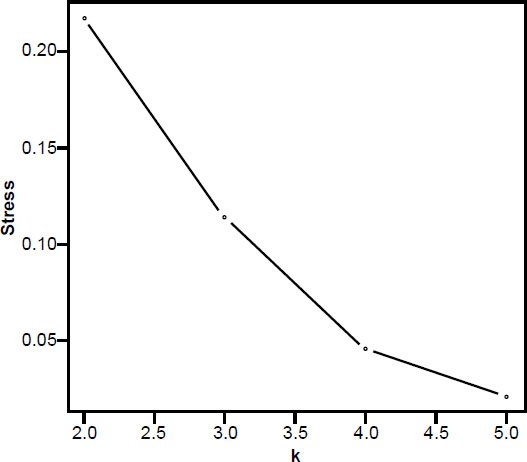
Fig. 4. Stress graph showing stress values at different dimensions for the MDS analysis in Fig. 2. The minimum stress value is at five dimensions, suggesting there is distortion in this 3D depiction of the data.
The Baraminic Distance Matrix and the Baraminic Correlation Matrix can be seen in Tables 1 and 2 for the first analysis.
Analysis of the T11 vertebra
The second study, however, was less conclusive. For a character relevance cutoff of 0.75, all 22 characters for the nine species were significant, and no species had a taxic relevance of less than 0.66. Only two species pairs showed continuity with one another: H. naledi and A. africanus Sts 14, and H. sapiens and Neandertal (see Fig. 5). For the first pair, the baraminic distance was 0.286, the baraminic correlation was 0.863, with a bootstrap value of 85+. Human and Neandertal had a baraminic distance of 0.048, a baraminic correlation of 0.997, and a bootstrap value of 100+.
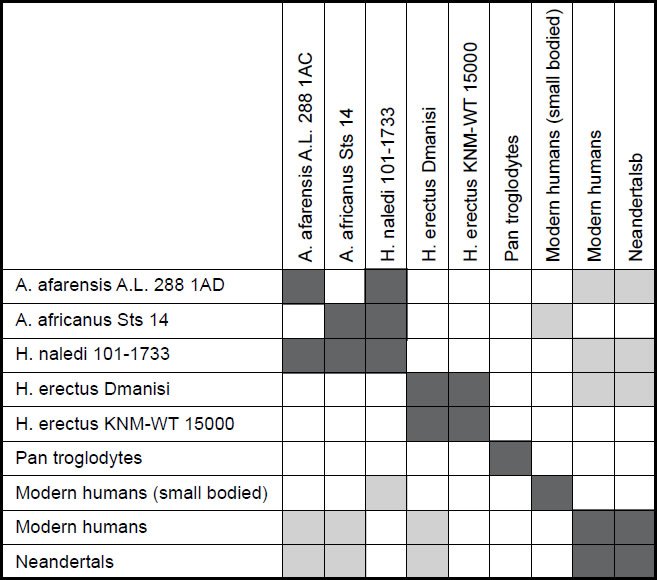
Fig. 5. Baraminic distance correlation matrix for two Australopithecus species, five human species (including two H. erectuses and Neandertal), chimpanzee, and H. naledi. Dark gray boxes show that two species are significantly correlated. Light gray boxes show that two species are significantly negatively correlated.
However, H. naledi again showed significant discontinuity with human and Neandertal. With human, H. naledi showed a baraminic distance of 0.952 and a baraminic correlation of −0.754, with a bootstrap value of 88o. With Neandertal, H. naledi showed a baraminic distance of 0.952 and a baraminic correlation of − 0.745, with a bootstrap value of 84o.
Six other species pairs had significant baraminic correlation and somewhat significant baraminic distance between each other, but their bootstrap values were all well below 90. H. naledi and A. afarensis A. L. 288-1AC had a baraminic distance of 0.381 and a baraminic correlation of 0.721. H. erectus Dmanisi and H. erectus KNM-WT 15000 had a baraminic distance of 0.333 and a baraminic correlation of 0.722. H. sapiens and A. afarensis A. L. 288-1AC had a baraminic distance of 0.864 and a baraminic correlation of −0.764. H. sapiens and H. erectus Dmanisi had a baraminic distance of 0.909 and a baraminic correlation of −0.737. Neandertal and A. afarensis A. L. 288-1AC had a baraminic distance of 0.864 and a baraminic correlation of −0.753. Neandertal and H. erectus Dmanisi had a baraminic distance of 0.909 and a baraminic correlation of -0.739.
When analyzing the character matrix using the weighting scheme, 13 out of 17 positive baraminic correlations increased, and only four decreased (average increase 0.04 ± 0.18). Also, 15 out of 19 negative baraminic correlations decreased, and only five increased (average decrease −0.06 ± 0.14).
The 3D MDS plot shows Neandertal and H. sapiens grouped closely together, with small bodied humans farther off. A. africanus Sts 14, A. afarensis A. L. 288-1AC and H. naledi also group fairly closely together. H. erectus Dmanisi and KNM-WT 15000 also group closely together (Fig. 6). 3D stress was at 0.079, which is excellent, and a minimum stress of 0.057 at k=4 dimensions (Fig. 7).
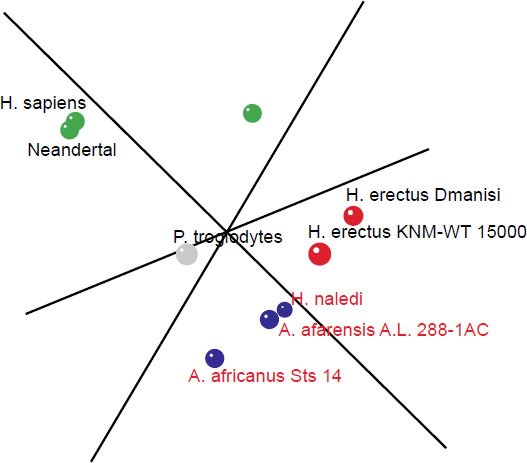
Fig. 6. 3D MDS coordinates for the Australopithecus, Homo, Paranthropus, and Pan species. The coloring of the dots represents the different groups determined by the BDC results. Green: H. sapiens, H. sapiens (small bodied), and Neandertal. Blue: A. afarensis A. L. 288-1AC, A. africanus Sts 14, H. naledi. Red: H. erectus Dmanisi, H. erectus KNM-WT 15000. Gray: P. troglodytes.
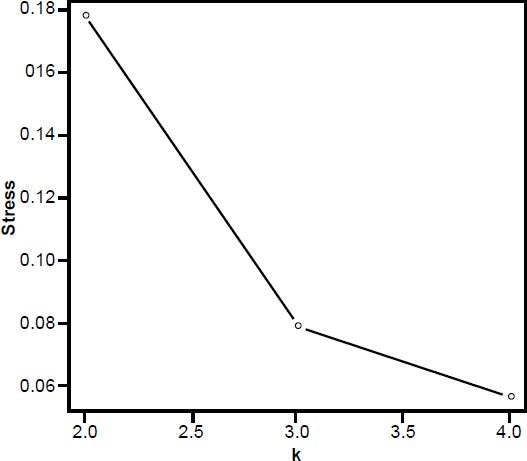
Fig. 7. Stress graph showing stress values at different dimensions for the MDS analysis in Fig. 2. The minimum stress value is at four dimensions, suggesting there is distortion in this 3D depiction of the data.
The Baraminic Distance Matrix and the Baraminic Correlation Matrix can be seen in Tables 4 and 5 for the second analysis.
| A. afarensis A.L. 288 1AC | A. afarensis Sts 14 | H. erectus Dmanisi | H. erectus KNM-WT 15000 | H. naledi 101-1733 | Modern humans | Modern humans (small bodied) | Neandertalsb | Pan troglodytes | |
|---|---|---|---|---|---|---|---|---|---|
| A. afarensis A.L. 288 1AC | 0 | 0.455 | 0.545 | 0.389 | 0.381 | 0.864 | 0.773 | 0.864 | 0.682 |
| A. afarensis Sts 14 | 0 | 0.682 | 0.778 | 0.286 | 0.909 | 0.864 | 0.909 | 0.682 | |
| H. erectus Dmanisi | 0 | 0.333 | 0.524 | 0.909 | 0.545 | 0.909 | 0.636 | ||
| H. erectus KNM-WT 15000 | 0 | 0.722 | 0.889 | 0.5 | 0.889 | 0.333 | |||
| H. naledi 101-1733 | 0 | 0.952 | 0.857 | 0.952 | 0.857 | ||||
| Modern humans | 0 | 0.591 | 0.045 | 0.636 | |||||
| Modern humans (small bodied) | 0 | 0.636 | 0.545 | ||||||
| Neandertalsb | 0 | 0.636 | |||||||
| Pan troglodytes | 0 |
| A. afarensis A.L. 288 1AC | A. afarensis Sts 14 | H. erectus Dmanisi | H. erectus KNM-WT 15000 | H. naledi 101-1733 | Modern humans | Modern humans (small bodied) | Neandertalsb | Pan troglodytes | |
|---|---|---|---|---|---|---|---|---|---|
| A. afarensis A.L. 288 1AC | 1 | 0.604 | 0.425 | 0.442 | 0.721 | -0.764 | -0.479 | -0.753 | -0.218 |
| A. afarensis Sts 14 | 1 | 0.101 | -0.135 | 0.865 | -0.663 | -0.675 | -0.652 | -0.353 | |
| H. erectus Dmanisi | 1 | 0.722 | 0.347 | -0.737 | 0.151 | -0.739 | 0.04 | ||
| H. erectus KNM-WT 15000 | 1 | -0.023 | -0.586 | 0.306 | -0.588 | 0.562 | |||
| H. naledi 101-1733 | 1 | -0.754 | -0.629 | -0.745 | -0.55 | ||||
| Modern humans | 1 | 0.211 | 0.977 | 0.035 | |||||
| Modern humans (small bodied) | 1 | 0.175 | 0.364 | ||||||
| Neandertalsb | 1 | 0.364 | |||||||
| Pan troglodytes | 1 |
Analysis of atlas and axis
Nine species had measurements for five characteristics for the C1 and C2 vertebrae (the axis and the atlas). Of these, five species had measurements for only two or three characters, whereas H. naledi, H. sapiens, Neandertal and P. troglodytes had measurements for all five characters. This amount of data is not enough for a baraminology analysis, however, the root mean square (RMS) values for all six species pairs from the aforementioned four species were calculated, and can be seen in Table 6. As we can see, the two lowest values were between H. sapiens and Neandertal (1.73) and H. naledi and P. troglodytes (2.36). The RMS value between H. naledi and human is 5.88, and between H. naledi and Neandertal this value is 7.47, indicating that H. naledi does not belong to the human holobaramin based on C1 and C2 measurements. If we assume that H. naledi, H. sapiens, and Neandertal all belong to the same holobaramin with P. troglodytes as an outlier, the p-value for intrabaraminic RMS values versus interbaraminic RMS values is 0.621, which is highly insignificant.
| H. naledi | H. sapiens | Neanderthal | P. troglodytes | |
|---|---|---|---|---|
| H. naledi | 0 | 5.88 | 7.47 | 2.36 |
| H. sapiens | 0 | 1.73 | 4.00 | |
| Neanderthal | 0 | 5.59 | ||
| P. troglodytes | 0 |
Discussion
With these results, we can clearly say that based on measurements of the T10 vertebra, australopiths, including H. naledi, show discontinuity with humans and also continuity within their respective groups. If we look at Figure 10 of Williams et al. (2017), we can see that H. naledi falls outside of the range of modern humans, Neandertal and H. erectus for three measurements of the T10 and T11 vertebrae (these are the vertebra geometric mean, the superior surface area, and the spinal canal area). Furthermore, H. naledi, along with the two A. afarensis species, P. robustus and A. africanus Sts 14h fall outside of the range of humans when plotting the square root of the spinal canal area versus the square root of the superior vertebral body area. Furthermore, the penultimate rib centroid size of H. naledi (52.3) is well below the range of H. erectus (80.8, 93.6), Neandertal (13.0, 131.6), and H. sapiens (101.6, 124.7) (Williams et al. 2017). The results from the C1 and C2 vertebrae also suggest a differentiation between H. naledi and humans. The two lowest RSM values are between human and Neandertal and between H. naledi and chimpanzee. The highest RSM values are between H. naledi and human and H. naledi and Neandertal.
The analysis revealed an interesting relationship between normal-sized humans and small-sized humans. The analysis of the T10 vertebra showed they had a baraminic distance of 0.507, and a baraminic correlation of 0.135, with a bootstrap value of 72. In the analysis of the T11 vertebra, they had a baraminic distance of 0.591, and a baraminic correlation of 0.211, with a bootstrap value of 90. Altogether, these values are inconclusive, and neither suggest continuity nor discontinuity between normalsized humans and small-sized humans. However, the question remains, why this inconclusiveness despite the fact that these individuals are known to be humans? The answer could possibly be that the smaller dimensions of the thoracic vertebrae correlate with the non-human species, which also happen to be smaller in size. However, small-sized humans have a baraminic distance of 0.955 with H. naledi, and a baraminic correlation of − 0.755, with a bootstrap value of 87o, suggesting that despite their small size, these humans show discontinuity with H. naledi.
Looking back on the ongoing debate about H. naledi in the creationist literature, we have come a long way. Initial studies based on statistical analysis using only unweighted characters, and solely on craniodental data, suggested that H. naledi was possibly human (O’Micks 2016a). Wood’s (2016a) initial work came to this same conclusion, but did not take into account subsequent measurements on several postcranial characteristics. This is important, because postcranial data (which make up the great majority of the skeleton) are more informative than craniodental data, which can sometimes be misleading, at least in phylogenetic studies. For example, behavior-induced morphogenesis also occur many times in the human cranium (such as cradling of the skull in infants) and dentition (Byers 2002; Collard and Moon 2000). Forty-four percent of the teeth of H. naledi also display some form of chipping (65% showing at least medium wear), which is far higher than other fossil hominin species (Towle 2017). Also, up to 34% of skull characteristics display significant intercorrelation in living hominoids. Character pairs which display such intercorrelation include the glabella-prosthion, the nasion-rhinion, orbital height, orbital breadth, post-orbital constriction and maximal biparietal width in Pongo pygmaeus (Miller 2000). If characters influence each other in such a manner, it makes it harder to make taxonomic inferences based on osteological characters as individual units. Therefore, initial disagreement on the baraminic status of H. naledi within creationist circles cannot be construed to mean that H. naledi has a mixture of both modern and plesiomorphic traits, especially when only craniodental characteristics had been studied at first in baraminological analyses.
More evidence and the results of several analyses of independent postcranial measurements has allowed the taxonomic status of H. naledi to become more refined and more precise. With greater confidence, we can say that H. naledi is not a part of the human holobaramin. The first analysis by O’Micks (2016b) of 62 craniodental characters and 32 postcranial characters including measurements of the hands, feet, and thorax, initially suggested H. naledi was discontinuous with the human holobaramin. Later analysis on 14 tibial characters demonstrated that H. naledi showed continuity with Australopithecines (O’Micks 2017). The present study however, presents evidence based on the study of cervical and thoracic vertebrae that further support continuity between apes and H. naledi. This study also affirms the discontinuous relationship between H. naledi and the human holobaramin.
A recent dating of the H. naledi fossils, flowstones, and sediments from the DiNaledi chamber have put the depositional evolutionary age of H. naledi at between 236–335 ka. This age is younger than the age of 1.5 Ma for H. erectus (Zaim et al. 2011), and even younger than an age estimated by analysis of phylogenetic tress of 912 ka by Dembo et al. (2016), and almost even overlaps with the supposed age of human populations that have been stable until today (Berger 2017a). Such a young date for H. naledi obviously contradicts the overarching evolutionary narrative that H. naledi is basal to the genus Homo, preceding all other species from within that genus. Berger and Hawks (2017b) write: “This scenario suggested that over time, our ancestors’ brains, posture, and teeth evolved in tandem with each other. The place of any fossil on this line of development should reflect its geological age. The older it is, the more like an ape the fossil would be” (emphasis added).
This is explained by some evolutionists, ad hoc, that H. naledi survived into the later Pleistocene (against the general assumption of paleoanthropologists and archeologists), parallel with other species of Homo, indicating a much younger age than what had been previously hypothesized based on H. naledi’s morphology (Berger et al. 2017a; Dirks et al. 2017). This would only be true, if H. naledi lived in an isolated part of the world, such as H. floresiensis, which became extinct due to direct competition with modern humans. However, H. naledi supposedly lived on the open plains of Africa, and would have been exposed to interaction with more advanced species from the genus Homo. The question remains, how a primitive member of the genus Homo could have survived competition from more developed Homo species for over a million years, if evolution were true.
A new review of the geological reports of the Rising Star Cave suggests that the bone-bearing sediments could have been deposited simultaneously, and that the H. naledi remains could have been deposited in multiple, closely spaced flooding events (Clarey 2017). Flooding is not excluded by even those who discovered the remains (Berger 2017b), and the discovery of an additional 131 H. naledi bones at another site in the Lesedi Chamber close to the DiNaledi Chamber supports this. The fact that the bones were buried neither in an extended posture, nor lying on their side (which are characteristic of human burial) (Byers 2002) also suggest that H. naledi was not human.
In any case, according to evolution, it still cannot be certain as to whether H. naledi is on the direct line of descent from australopiths to humans. Only those members of the genus Homo are members of the human holobaramin, which have a world-wide geographical extent, such as modern humans, H. erectus, and H. neanderthalensis. In contrast, H. naledi to date has been localized to only a single site in South Africa. Overall, the analysis in this study provides more evidence that H. naledi is indeed not part of the human holobaramin, but is most likely an ape of some kind, probably a member of the Australopithecine holobaramin. It is much more likely that H. naledi was a species of ape, existing alongside humans, not in competition with them.
Acknowledgments
The author would like to thank Scott A. Williams for providing the image files for Fig. 1 comparing the T10 and T11 thoracic vertebrae between several primate species.
References
Berger, L. R., J. Hawks, D. J. de Ruiter, S. E. Churchill, P. Schmid, L. K. Delezene, T. L. Kivell, et al. 2015. “Homo naledi, a New Species of the Genus Homo from the Dinaledi Chamber, South Africa.” eLife 4: e09560.
Berger, L. R., J. Hawks, P. H. G. M. Dirks, M. Elliott, and E. M. Roberts. 2017a. “Homo naledi and Pleistocene Hominin Evolution in Subequatorial Africa.” eLife 6. pii: e24234.
Berger, L. R., and J. Hawks. 2017b. Almost Human: The Astonishing Tale of Homo naledi and the Discovery That Changed Our Human Story. National Geographic: Washington, DC.
Byers, S. M. 2002. Introduction to Forensic Anthropology. Pearson Education, Inc. University of New Mexico–Valencia.
Clarey, T. L. 2017. “Disposal of Homo naledi in a Possible Deathtrap or Mass Mortality Scenario.” Journal of Creation 31 (2): 61–70.
Collard M., and B. Wood. 2000. “How Reliable are Human Phylogenetic Hypotheses?” Proceedings of the National Academy of Sciences USA 97 (9): 5003–5006.
Dembo, M., D. Radovčić, H. M. Garvin, M. F. Laird, L. Schroeder, J. E. Scott, J. Brophy, et al. 2016. “The Evolutionary Relationships and Age of Homo naledi: An Assessment Using Dated Bayesian Phylogenetic Methods.” Journal of Human Evolution 97: 17–26.
Dirks, P. H. G. M., E. M. Roberts, H. Hilbert-Wolf, J. D. Kramers, J. Hawks, A. Dosseto, M. Duval, et al. 2017. “The Age of Homo naledi and Associated Sediments in the Rising Star Cave, South Africa.” eLife: e24231.
Feuerriegel, E. M., D. J. Green, C. S. Walker, P. Schmid, J. Hawks, L. R. Berger, and S. E. Churchill. 2017. “The Upper Limb of Homo naledi.” Journal of Human Evolution 104: 155–173.
Gebo, D. L. 2014. Primate Comparative Anatomy. Baltimore, Maryland: Johns Hopkins University Press.
Harcourt-Smith, W. E. H., Z. Throckmorton, K. A. Congdon, B. Zipfel, A. S. Deane, M. S. M. Drapeau, S. E. Churchill, L. R. Berger, and J. M. DeSilva. 2015. “The Foot of Homo naledi.” Nature Communications 6: 8432.
Hauesler, M., R. Schiess, and T. Boeni. 2011. “New Vertebral and Rib Material Point to Modern Bauplan of the Nariokotome Homo erectus Skeleton.” Journal of Human Evolution 61 (5): 575–582.
Hawks, J., M. Elliott, P. Schmid, S. E. Churchill, D. J. de Ruiter, E. M. Roberts, H. Hilbert-Wolf, et al. 2017. “New Fossil Remains of Homo naledi From the Lesedi Chamber, South Africa.” eLife 6: e24232.
Kivell, T. L., A. S. Deane, M. W. Tocheri, C. M. Orr, P. Schmid, J. Hawks, L. R. Berger, and S. E. Churchill. 2015. “The Hand of Homo naledi.” Nature Communications 6: 8431.
Laird, M. F., L. Schroeder, H. M. Garvin, J. E. Scott, M. Dembo, D. Radovčić, C. M. Musiba, et al. 2017. “The Skull of Homo naledi.” Journal of Human Evolution 104: 100–123.
Lieberman, D. E. 1999. “Homology and Hominid Phylogeny: Problems and Potential Solutions.” Evolutionary Anthropology 7 (4): 142–151.
Marchi, D., C. S. Walker, P. Wei, T. W. Holliday, S. E. Churchill, L. R. Berger, and J. M. DeSilva. 2017. “The Thigh and Leg of Homo naledi.” Journal of Human Evolution 104: 174–204.
McCollum, M. A., B. A. Rosenman, G. Suwa, R. S. Meindl, and C. O. Lovejoy. 2010. “The Vertebral Formula of the Last Common Ancestor of African Apes and Humans.” Journal of Experimental Zoology Part B: Molecular and Developmental Evolution 314 (2):123–134.
McLain, M. 2017. “Reply to O’Micks Concerning the Geology and Taphonomy of the Homo naledi Site.” Answers Research Journal 10: 55–56.
Meyer, M. R, S. A. Williams, P. Schmid, S. E. Churchill, and L. R. Berger. 2017. “The Cervical Spine of Australopithecus sediba.” Journal of Human Evolution 104: 32–49
Miller, J. M. 2000. “Craniofacial Variation in Homo habilis: An Analysis of the Evidence for Multiple Species.” American Journal of Physical Anthropology 112 (1): 103–128.
O’Micks, J. 2016a. “Preliminary Baraminological Analysis of Homo naledi and Its Place Within the Human Baramin.” Journal of Creation Theology and Science Series B: Life Sciences 6: 31–39.
O’Micks, J. 2016b. “Homo naledi Probably Not Part of the Human Holobaramin Based on Baraminic Re-Analysis Including Postcranial Evidence.” Answers Research Journal 9: 263–272.
O’Micks, J. 2016c. “Reply to “Taxon Sample in Hominin Baraminology: A Response to O’Micks”.” Answers Research Journal 9: 373–375.
O’Micks, J. 2017. “Rebuttal to “Reply to O’Micks Concerning the Geology and Taphonomy of the Homo naledi Site” and “Identifying Humans in the Fossil Record: A Further Response to O’Micks”.” Answers Research Journal 10: 63–70.
Robinson, D. A., and D. P. Cavanaugh. 1998. “A Quantitative Approach to Baraminology with Examples From the Catarrhine Primates.” Creation Research Society Quarterly 34 (4): 196–208.
Towle, I., J. D. Irish, and I. De Groote. 2017. “Behavioral Inferences from the High Levels of Dental Chipping in Homo naledi.” American Journal of Physical Anthropology doi: 10.1002/ajpa.23250.
Williams, S. A., K. R. Ostrofsky, N. Frater, S. E. Churchill, P. Schmid, and L. R. Berger. 2013. “The Vertebral Column of Australopithecus sediba.” Science. 340 (6129): 1232996.
Williams, S. A, and G. A. Russo. 2015. “Evolution of the Hominoid Vertebral Column: The Long and the Short of it.” Evolutionary Anthropology 24 (1):15–32.
Williams, S. A., E. R. Middleton, C. I. Villamil, and M. R. Shattuck. 2016. “Vertebral Numbers and Human Evolution.” American Journal of Physical Anthropology 159 (Suppl 61): S19–36.
Williams, S. A., D. García-Martínez, M. Bastir, M. R. Meyer, S. Nalla, J. Hawks, P. Schmid, S. E. Churchill, and L. R. Berger. 2017. “The Vertebrae and Ribs of Homo naledi.” Journal of Human Evolution 104: 136–154.
Wood, T. C. 2005. “Visualizing Baraminic Distances Using Classical Multidimensional Scaling.” Origins (GRI) 57: 9–29.
Wood, T. C. 2008. BDISTMDS software, v. 2.0. Dayton, Tennessee: Center for Origins Research, Bryan College.
Wood, T. C. 2016a. “An Evaluation of Homo naledi and ‘Early’ Homo From a Young-Age Creationist Perspective.” Journal of Creation Theology and Science Series B: Life Sciences 6: 14–30.
Wood, T. C. 2016b. “Taxon Sample Size in Hominin Baraminology: A Response to O’Micks.” Answers Research Journal 9: 369–372.
Wood, T. C. 2017. “Identifying Humans in the Fossil Record: A Further Response to O’Micks.” Answers Research Journal 10: 57–62.
Zaim, Y., R. L. Ciochon, J. M. Polanski, F. E. Grine, E. A. Bettis III, Y. Rizal, R. G. Franciscus, et al. 2011. “New 1.5 Million- Year-Old Homo erectus Maxilla from Sangiran (Central Java, Indonesia).” Journal of Human Evolution 61 (4): 363–376.
Supplementary File
Supplementary File showing result of BDIST analysis for T10 and T11 vetrebrae


