
The views expressed in this paper are those of the writer(s) and are not necessarily those of the ARJ Editor or Answers in Genesis.
Abstract
I evaluate 23 astronomical arguments for recent origin for the sun, stars, and galaxies that biblical creationists have used. Some of the arguments are found to be wanting, and I thus recommend discontinuing their use. Other arguments for young age appear to be strong. Further work on even the good young-age indicators is desirable, along with development of new arguments for recent creation.
Introduction
In a previous paper (Faulkner 2019) I evaluated 25 arguments for recent origin for the solar system. Here I evaluate 23 arguments for recent origin for the sun, stars, and galaxies. Thus, between the two papers I discuss 48 arguments for young age from astronomy that recent creationists have used. As in the first paper, I have combined some arguments into a single argument for purposes of discussion. It is my desire that others will do similar evaluations for geological, biological, and biblical arguments for young age.
The Solar Corona’s High Temperature
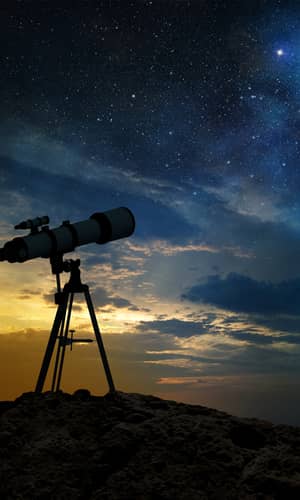
This is an example of an argument of recent origin that does not appear in the creation literature. However, it has been mentioned in oral presentations in the past, so it is worthy of at least brief discussion here. The solar corona is the outermost layer of the sun’s atmosphere, extending out a few solar radii. The corona is best seen during a total solar eclipse (see fig. 1). The corona’s temperature is 1–2 million K. However, due to its extremely low density, there is not much heat in the corona. The coronal temperature is much higher than lower layers of the sun’s atmosphere (less than 10,000 K). The particles in the corona radiate, so with time they ought to cool. Therefore, why is the coronal temperature so high? The most obvious answer is that it is heated by some mechanism. However, the corona cannot be heated by the normal modes of energy transfer, conduction, convection, or radiation, because the other portions of the sun in thermal contact with it via these mechanisms are far cooler. Therefore, some creationists have used the solar corona’s high temperature as an argument for recent origin, arguing that God initially created the corona at high temperature and it hasn’t had sufficient time to cool.
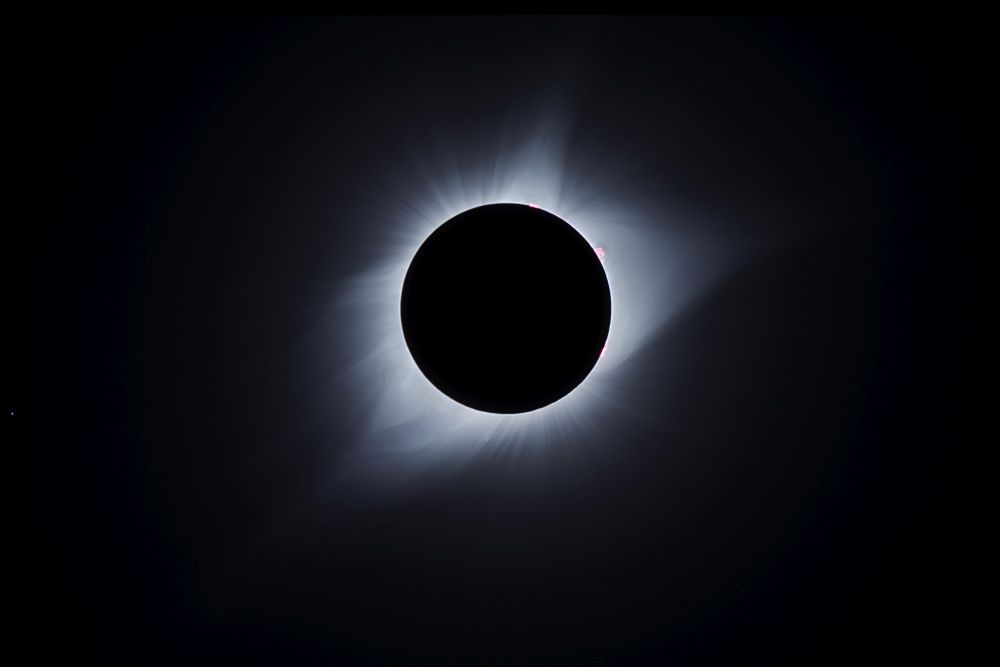
Fig. 1. The solar corona, the outermost part of the sun’s atmosphere. The red feature between the noon and four o’clock portions of the sun’s limb (edge) are prominences. Photo courtesy of Jim Bonser.
There are at least two problems with this argument. First, it is not accompanied by a calculation of the current cooling rate of the corona. What if the cooling time for the corona is far less than a few thousand years? If so, then even in the recent creation model there is a solar coronal heating problem. Second, even though there is no generally agreed upon explanation of the source of the corona’s high temperature, it does not mean that there is not one. There have been many proposed sources, but there are only two strong candidates: acoustic wave heating and magnetic reconnection. At this time, neither of these proposed mechanisms can achieve the high coronal temperature (Zirker and Engvold 2017). Given these two problems, the corona’s high temperature is not a good argument for recent origin.
Shrinking Sun
Each second, the sun radiates 3.828 × 1026 J of energy. By the conservation of energy (first law of thermodynamics), the sun must generate this much energy each second. What energy source does the sun tap to produce its luminosity? The first scientific explanation was that of Herman von Helmholtz and Lord Kelvin in the 19th century. This source, now called the Kelvin-Helmholtz mechanism, suggested that the sun shines by liberating gravitational potential energy. This mechanism is robust, for even today astronomers think that the Kelvin-Helmholtz mechanism powered the sun during its formation and plays a similar role in other stars and during brief phases of stellar evolution. However, the Kelvin- Helmholtz mechanism yields a maximum lifetime of about 30 million years for the sun. By the end of the 19th century, scientists largely had abandoned the Kelvin-Helmholtz mechanism as the source of the sun’s power, because the assumption of biological and geological evolution required vastly more time than the Kelvin-Helmholtz mechanism could provide. It was decades before astronomers found an alternate source for the sun’s power—nuclear fusion of hydrogen into helium in the solar core. Nuclear fusion could power the sun for nearly ten billion years, about twice the supposed 4.6-billion-year age of the solar system. If nuclear fusion powers the sun, then the sun ought to gradually swell, albeit on a very long timescale. This would not be observable over thousands of years, but it becomes significant over billions of years. This leads to the faint young sun paradox, a subject discussed later. On the other hand, the Kelvin-Helmholtz mechanism requires that the sun shrink on a much shorter timescale, and it may be detectable over centuries.
In 1979, John Eddy and Aram Boornazian gave a presentation at the 154th meeting of the American Astronomical Society in which they presented evidence that the sun may be shrinking (Eddy and Boornazian 1979). Their study was based upon more than a century of transit measurements of the sun made every clear day at the Royal Observatory in Greenwich. The purpose of the daily measurements was to determine precisely the time of local noon. Local noon is defined as the instant the center of the solar disk passes the celestial meridian, an imaginary line passing north-south and directly overhead (a point called the zenith). Measurement of local noon is done with a transit instrument, a telescope that is constrained to move only along the meridian. The telescope has an appropriate solar filter, and the eyepiece is fitted with a reticle with a vertical line precisely aligned with the celestial meridian. One could directly measure when local noon occurs by noting the time when the center of the solar disk crosses the meridian. However, it is more accurate to measure the instant that the sun’s western limb (edge) and eastern limb pass the meridian and average the two times. But the difference in the two times provides a measurement of the angular diameter of the sun. Apparently, before Eddy and Boornazian, no one had done this, at least for all the data spanning more than a century. Eddy and Boornazian found a monotonic decrease in the sun’s angular diameter at the rate of about 0.1%/century. They commented that this rate of contraction is far greater than that predicted by the Kelvin-Helmholtz mechanism. However, this could be explained by most of the contraction being in the outer layers of the sun.
Understandably, creationists quickly took note of this report, and used it to argue that the sun may be powered by Kelvin-Helmholtz contraction rather than nuclear fusion. (Ackerman 1986, 55–64; Ackridge 1980; Hinderliter 1980a, 1980b, 1983; Morris 1985, 169–170; Rybka 1993, 58–61). Hanson (1981) went further, suggesting that not only is the sun shrinking but that additional energy from meteoritic bombardment and simple incandescence from an initially hot sun played major roles in powering the sun. Clearly, if the sun is deriving its power from gravitational contraction, it could not have been doing so for billions of years. Therefore, many creationists viewed the shrinking sun as a sort of silver bullet that would falsify the evolutionary timescale. Not surprisingly, most astronomers rejected the possibility of a shrinking sun. Soon several papers were published refuting the shrinking sun with additional historical data. Very telling is that the initial presentation of Eddy and Boornazian was a preliminary work, but neither one of them ever addressed that work again. The most exhaustive treatment of the shrinking sun in the creation literature is that of DeYoung and Rush (1989), who discussed much of the refutation of Eddy and Boornazian and the lack of response by the original authors. DeYoung and Rush concluded that the evidence was ambiguous enough that one could not be certain whether the sun is powered by gravitational contraction, nuclear fusion, or a combination of both, and hence the sun is not a good age indicator on this front.
Solar Neutrino Problem
Related to the shrinking sun was the solar neutrino problem. If we could directly test whether the sun is sustaining nuclear reactions in its core, that would lay to rest any question as to the reality of a shrinking sun. Any nuclear reactions in the sun are in its core. Lying between the core and the photosphere (the solar surface) is the envelope. The envelope is about 400,000 miles thick, encompassing most the solar interior. Much of the envelope is opaque, leading to much absorption and reemission of radiation as energy transports from the core to the photosphere. Consequently, energy generated in the core takes many thousands of years to reach the photosphere. With countless absorption and reemission during transit time, any signature of nuclear reactions in the radiation that we receive is completely lost.
However, all is not lost, as nuclear reactions within the solar core ought to produce neutrinos. Neutrinos are very elusive particles, first deduced to exist in the early 1930s, but not detected until 25 years later. Neutrinos hardly ever interact with matter, so most neutrinos generated in the sun’s core easily pass through the envelope, arriving at the earth only eight minutes after their generation. Therefore, measuring solar neutrinos would provide a direct measurement of nuclear reactions within the sun. However, neutrinos’ lack of interaction with matter that makes them so useful for testing solar nuclear reactions also makes solar neutrinos difficult to detect. Neutrinos have various energies, and neutrinos of a certain energy are more likely to interact with particular isotopes. Neutrino detectors stack the deck by consisting of large collections of matter that are much more prone for neutrino interactions. The first measurements of neutrinos coming from the nuclear reactions powering the sun were in the late 1960s. The early measurements showed at best about one-third the predicted solar neutrino flux on the earth. The first solar neutrino experiments were non-directional, so it was not clear if any of the measured flux was indeed coming from the sun. It was conceivable that the measured neutrino flux was coming from other astronomical sources so that the sun was not producing any neutrinos. This deficit of solar neutrinos became known as the solar neutrino problem, because it was difficult to reconcile with a sun that is billions of years old and obtaining its power from nuclear reactions. However, this is what one might expect if the sun were only thousands of years old and tapping gravitational potential energy instead of nuclear reactions. Consequently, creationists were keen to cite solar neutrino problem as evidence of recent creation (Ackerman 1986, 57- 59; Armstrong 1973, 1985; Davies 1996; Morris 1985, 169–170; Rybka 1993, 58–61; Steidl 1979, 92–94, 1980, 1981).
There were many ways that one might resolve the solar neutrino problem. One possibility was that the sun cycled between full nuclear reactions and reduced reactions, similarly to how heating and air conditioning systems usually cycle on and off as needed. If this were true, we just happen to be living at a time when the sun’s nuclear reactions were lessoned. Another possibility was that we did not have a proper understanding of all the reactions occurring in the sun. There is a primary fusion reaction going on in the sun, but early measurements did not sample neutrinos from them. Instead, early experiments detected neutrinos coming from side reactions that accounted for a small fraction of the sun’s energy. The choice to sample the side reactions was dictated by the economics of constructing neutrino detectors, because the isotopes required for the more significant reactions expected were rare, and hence very expensive. Eventually, experiments designed to detect neutrinos from the major nuclear reactions expected in the sun went on line. However, their results only deepened the solar neutrino problem, for they showed a similar deficit from predictions of about one-third (Snelling 1997b, 1998). Some of the later experiments were directional, which indicated that the neutrinos detected were indeed coming from the sun, but the flux was about one-third of predicted.
Another possibility heavily favored by astronomers was that our understanding of neutrino physics was in error. The theory of neutrinos most popular with particle physicists was that neutrinos are massless and hence traveled at the speed of light. Most particle physicists opposed an alternate theory that neutrinos had tiny mass and consequently traveled nearly, but not quite, at the speed of light. This theory had an even more significant consequence. There are three types of neutrinos: the electron neutrino, the tau neutrino, and muon neutrino (the names come from the particles associated with the creation of each type). The sun produces electron neutrinos, so solar neutrino detectors were designed to detect only that type. The alternate theory of neutrinos requires that the three types of neutrinos oscillate between the three types. If this theory were true, then the electron neutrinos produced by the sun would immediately begin oscillating so that by the time the neutrinos reached the earth eight minutes later, they would be evenly distributed between the three types, leading to only one-third being detected. I must emphasize that particle physicists overwhelmingly opposed this solution to the solar neutrino problem, believing instead that astronomers were wrong about the structure and energy source of the sun. All of this quickly changed in 2001 when particle physicists obtained experimental results that confirmed the alternate model of neutrinos (Newton 2002). This result implies that the predicted solar neutrino flux must be reduced by a factor of three, bringing the predicted and measured neutrino flux into concordance. Hence, the solar neutrino problem is solved. Since the nuclear source for the sun’s energy is confirmed, the sun cannot be powered by gravitational contraction, so there is no significant shrinkage occurring in the sun.
Related to the supposed shrinking sun and the solar neutrino problem is the insistence by some creationists that helioseismology, the study of acoustic waves in the sun, invalidates the standard solar model (Davies 1996; Henry 2003). The primary evidence for this is the supposed 160-minute oscillation in the sun. This oscillation is not compatible with a sun that is centrally condensed with a high core temperature (more than 15 million K). If the sun were homogeneous and much cooler in its core, then nuclear reactions could not be sustained. Early helioseismology studies discovered the 160-minute oscillation, though it was suspicious in that 160 minutes is exactly one-ninth of a day, suggesting that it is a harmonic, an artifact of the daily observing cycle. Indeed, later studies by GONG (Global Oscillations Network Group), BiSON (Birmingham Solar Oscillations Network), and SOHO (SOlar and Heliospheric Observatory) have permitted uninterrupted observations of the sun, and the 160-minute oscillation does not show up in their data. Indeed, helioseismology confirms the standard solar model with temperature in the core sufficient to sustain nuclear reactions. One may complain that the standard solar model is based upon assumption of the evolutionary timescale, as Henry (2004) said in a response to his paper on solar oscillations (Faulkner and Samec 2004). However, this is not entirely accurate—for one can believe in a recent creation and the standard solar model. The standard solar model can sustain the sun for billions of years, but that does not mean that the sun necessarily is billions of years old. The standard solar model results in a very stable sun, more stable than a homogeneous, low temperature-core sun. Hence, the standard solar model could be interpreted as a design feature of special creation. Furthermore, as DeYoung and Rush (1989) and Faulkner and Samec (2004) have shown, one may use physics to demonstrate that the core temperature of the sun must be on the order of 15 million K, which is more than sufficient to support nuclear reactions. Hence, we know that the sun is centrally condensed, and would not be stable if it were not.
Unfortunately, despite these considerations, some creationists continue to kick up dust about the standard solar model, the stability of the sun’s size, and the solar neutrino problem. However, there is no clear data that show the sun is shrinking or that the standard solar model is wrong. Instead, there is abundant evidence that the standard solar model is correct and that the sun is powered by nuclear fusion in its core. Therefore, neither the solar neutrino problem nor the notion that the sun is shrinking are good evidences for recent origin.
Some may ask why God created the sun with an energy source that could power it for billions of years, if the sun is only thousands of years old. The answer is simple: stability. If the sun derived its energy from some other source, such as the Kelvin- Helmholtz mechanism, changes in the sun would occur over the thousands of years that the sun has existed. This would have devastating effects upon the earth’s climate and living things on earth. Therefore, while the sun’s nuclear energy source does not prove the sun is very young, it does work well as a design argument.
The Faint Young Sun Paradox
While we have confidence that the standard solar model is correct, that does not mean the sun is billions of years old. If the sun were billions of years old, then the standard solar model implies that the sun gradually has brightened throughout its history. This is caused by changing composition of the solar core as the sun fuses hydrogen into helium. With time, hydrogen in the core is depleted while helium is enriched. This changes the mean molecular weight of the core. A better way to look at this is to consider the number of particles involved. The net fusion reaction in the sun is to transmute four hydrogen nuclei into one helium nucleus (see fig. 2 for an illustration of the steps in the major fusion reaction in the sun). The solar core is so hot (approximately 15 million K) that all the matter there is completely ionized, so we must also count the electrons freed from their atoms. Hence, the four inputted hydrogen atoms represent eight particles, but the outputted helium atom represents three particles (two of the original electrons are annihilated by collisions with positrons, or anti-electrons, produced in the nuclear reactions). Therefore, there is an 8:3 reduction in the number of particles in the core. There probably were some helium nuclei present in the core initially, so the actual reduction in particles in the core probably is a little less than 8:3.
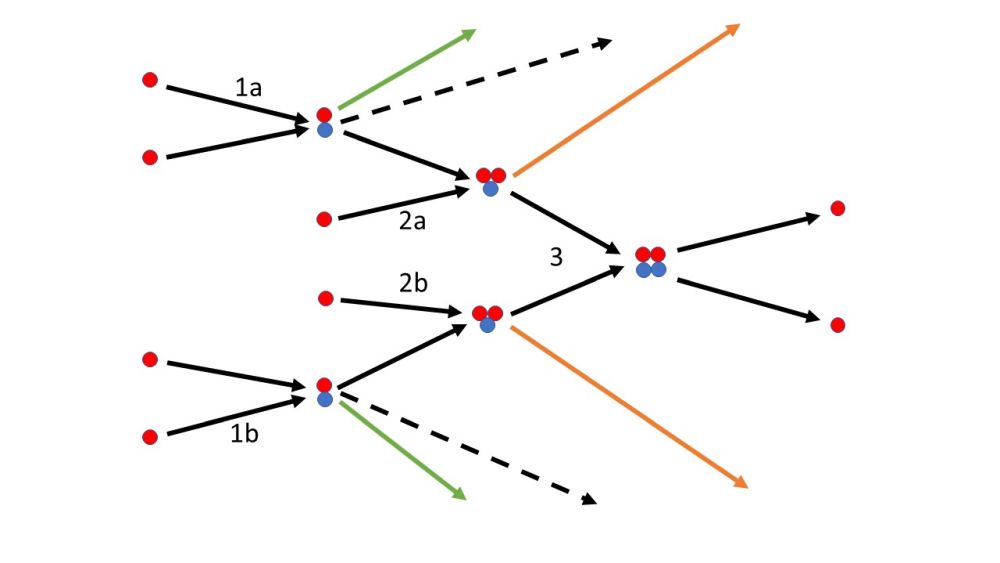
Fig. 2. The proton-proton chain, the main reaction thought to be responsible for most of the sun’s energy, is a three-step process. First, two hydrogen nuclei (protons, here illustrated with red spheres) fuse to form H2, or a deuterium nucleus, an isotope of hydrogen consisting of a proton and a neutron (a neutron is illustrated by a blue sphere). In this process, a positron (the antiparticle of the electron) and a neutrino are emitted. The positron emission is illustrated by a green arrow, and the neutrino emission is illustrated by a dashed arrow. Either positron will annihilate with an electron, releasing the equivalent mass energy of both into the sun’s core, but the neutrino likely will escape the sun altogether. Notice that this first step occurs twice, indicated by 1a and 1b. In the second step, an additional proton fuses with a deuteron to form a He3, an isotope of helium called tritium. This process is accompanied by emission of a gamma-ray (indicated by an orange arrow), a high energy photon. The gamma ray is absorbed and reemitted by the gas in the solar core. Notice that this step occurs twice, indicated by 2a and 2b. Finally, the third reaction is the fusion of the two tritium nuclei into a single He4 nucleus, accompanied by the emission of two protons. Notice that this reaction requires the input of six protons, with a helium nucleus and two protons as the output. Thus, the net reaction is four protons resulting in one helium nucleus.
For the conditions in the solar core, the ideal gas law works very well:
PV = nRT,
where P is the pressure, V is the volume, n is the number of moles, R is the ideal gas constant, and T is the temperature. As n decreases in the ratio of 8:3, the state variables adjust their values. More specifically, T and P increase while V decreases. That is, the core gradually contracts and heats under increasing pressure. Most notably, the fusion reactions that power the sun are very temperature sensitive. Even a small increase in temperature drives up the rate of fusion, releasing more energy. Therefore, as the sun ages, its energy output must gradually increase. The increased energy production transports outward from the core to the photosphere. The additional heat introduced into the solar envelope expands the envelope. The net result is that the sun slowly expands and brightens, but only on a timescale of billions of years.
Conversely, when the sun was younger, it was fainter than it is today. A fainter young sun means that early earth received far less heat than it does today. How much fainter was the sun in the past? Computation shows that if the sun formed 4.5 billion years ago, it was about 40% fainter then. And the sun was about 25% fainter 3.5 billion years ago, when life supposedly first developed on earth. A change in 25% in the sun’s luminosity translates to a 17°C change in the earth’s average temperature. The average temperature of the earth today is 15C, so the expected average temperature 3.5 billion years ago would have been –2C. No one believes the earth was that cool 3.5 billion years. Instead, most scientists think that the earth has maintained roughly the same average temperature for 3.5 billion years, with some fluctuations around that mean. But the situation is even worse. Had the earth been this cold in the past, it would have substantially iced over. The increased ice cover would have increased the earth’s reflectivity, decreasing the amount of incoming sunlight absorbed. Therefore, even as the sun’s brightness increased, the earth would not have warmed. This disparity is called the faint young sun paradox. Clearly, this is not a problem if the earth is only thousands of years old, so recent creationists have made use of the young faint paradox as evidence of the sun’s youth (Brown 2008, 28–29; Faulkner, 1998, 2001).
As one might expect, those committed to billions of years have taken notice of the faint young sun paradox, so several different mechanisms have been proposed to solve this problem. How much input solar heat is retained by the earth critically depends upon the composition of the earth’s atmosphere. Therefore, most resolutions to the young faint sun paradox have focused on possible changes in the earth’s atmosphere over time. If the early atmosphere had significantly more greenhouse gases than today’s atmosphere, then that would have permitted retention of more heat, thus significantly warming the planet over what ordinarily we would expect. And presumably the amount of greenhouse gases in the earth’s atmosphere would have diminished as the sun slowly increased in brightness. At the outset, this appears problematic, because maintaining a nearly constant average temperature on the earth would have required a delicate balance as both the sun’s luminosity and the earth’s atmosphere evolved. If greenhouse gas levels dropped too quickly or remained high too long, the earth could have rapidly departed from equilibrium toward either overheating or overcooling from which it might not have ever recovered. This balance must have remained in place for billions of years, without reliance on any feedback mechanism.
As Oard (2011) has pointed out, because water vapor provides 95% of greenhouse gases today, it is the most obvious choice for an increased greenhouse gas in the past. However, more water vapor translates into more clouds, which reflect more sunlight, thus diminishing the amount of arriving heat. Other suggested greenhouse gases that were overabundant in the past are carbon dioxide, methane, and ammonia. However, each of the proposed solutions are fraught with problems, as is evidenced by the many new proposals. If past proposals worked, then why invoke new ones? It appears that there is no consensus among evolutionary scientists how to solve this problem. See Coppedge (2013) and Oard (2011) for more detailed discussion of some of the proposed solutions to the faint young sun paradox in the creation literature.
It appears that the faint young sun paradox is a good argument for recent origin.
Lithium and Beryllium Abundance of the Sun
Davies (1996) has pointed out that lithium has been depleted in the sun, but that that beryllium has not been depleted. Both elements are consumed by nuclear reactions, but with different temperature regimes. Reactions that deplete lithium set in around 3 million K temperature, but reactions that deplete beryllium begin at a temperature of 4 million K. Davies reasoned that this limits the central temperature of the sun to greater than 3 million K, but less than 4 million K. The equilibrium core temperature of the sun is far greater, in excess of 15 million K. But this equilibrium temperature takes considerable time to achieve, so Davies concluded that the sun must be very young.
The problem with this argument is that it assumes that the sun’s core and photospheric compositions are the same. The upper part of the sun’s envelope is fully convective, thoroughly mixing the contents of the upper envelope and photosphere (fig. 3). However, the sun’s lower core is radiative, meaning that energy is transported upward via radiation rather than convection. Therefore, there is not much mixing in the radiative zone. This prevents mixing of the products of the core with layers above. Therefore, the compositions of the core and photosphere do not exactly match (though probably those elements unaffected by nuclear reactions probably do match). The convective zone of the photosphere extends down to the region where the temperature is at least 3 million K so that lithium throughout the sun is depleted. However, the convective zone does not extend down to the region where the temperature is 4 million K. Hence, while lithium is depleted in the sun’s photosphere, beryllium is not. See Ahrens, Stix, and Thorn (1992) for more details. This is not a good argument for the sun’s recent origin.
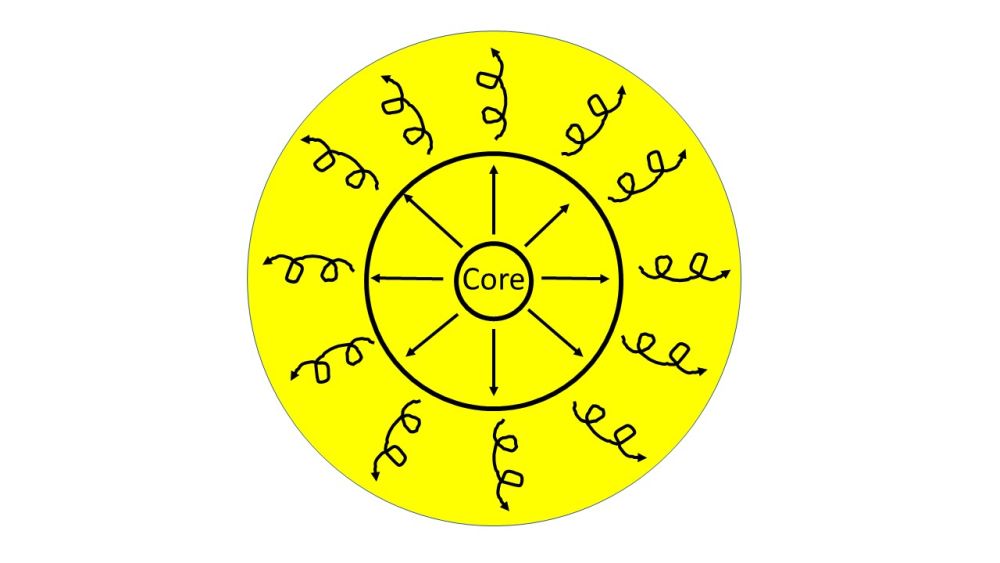
Fig. 3. The structure of the sun. The dominant method of energy transport in the core and the lower part of the envelope in contact with the core is radiation, indicated by straight arrows. The upper part of the envelope and the photosphere are convective, indicated by curly arrows.
Differential Solar Rotation
The sun rotates differentially, meaning that different parts of the sun rotate at different rates. The rotation period at the sun’s equator is about 25 days, but near the poles, the rotation rate is more than a month. This is counterintuitive, because the sun’s equator has the greatest distance to travel to complete a rotation, while the polar regions have the shortest distance to travel. Boardman, Koontz, and Morris (1973, 148–149) and Rybka (1993, 62) suggested that this situation is unstable, for viscous forces would lead to the entire sun spinning at a single rate, implying that the sun is young.
However, this overlooks several things. For instance, what is the timescale of this simplistic analysis? It could be far less than even thousands of years, so this would pose a problem even the recent creation model. Furthermore, the sun’s internal workings are very complicated, something that solar astronomers still have much to learn about. Most of the sun is an ionized gas and is threaded with a magnetic field, so it is a plasma. Therefore, electromagnetic forces play an important role in what might appear at first a simple dynamic process. But, more importantly, the sun’s differential rotation most likely due to convection in the sun combined with the Coriolis effect. This probably is not a good argument for recent creation.
Interstellar Grain Formation
There is dust, micron-sized solid particles, in the interstellar medium (Draine 2011, 1). Much of the dust is amorphous silicate or carbonaceous material, with graphite and polycyclic aromatic hydrocarbons added to the silicate (Draine 2011, 279–280). Slusher (1980a, 17–19) performed a calculation (the results were repeated in Slusher 1980b, 68–69) that the formation time for grains was at least three billion years. He judged this grain formation rate to be far too slow, especially when destruction processes are included. Presumably, Slusher thought that recent creation of the grains much in their current condition was a more viable alternative.
However, Slusher’s calculation probably is too pessimistic. Spitzer (1978, 205–212) gave a more thorough discussion of grain formation and destruction, yielding a time required for grain formation shorter than Slusher’s (a billion years or less). Furthermore, it is a recognized problem that initial grain formation does not occur appreciably fast in the interstellar medium (Spitzer 1978, 205). Rather, significant dust production is expected in the atmospheres of cool giant stars (Lafèvre 1986). The conditions in these atmospheres (density, composition, shocks) are conducive to grain formation, and observations reveal shells of dust apparently expanding from many cool giants. It appears that interstellar grain formation is not a good argument for recent origin.
The Red Sirius Anomaly
Sirius is the brightest-appearing star in the night sky, a result of Sirius being relatively bright intrinsically and being among the nearest stars (8.6 light years away). Sirius is a binary star, with one component, Sirius A, accounting for almost all the light from the system. Its companion, Sirius B, is a white dwarf that orbits with a 50-year period. Sirius A is nearly 10,000 times brighter than Sirius B. Sirius A has a surface temperature of about 10,000 K, which makes it appear white. However, in his second century AD work, The Almagest, Claudius Ptolemy described Sirius as “reddish,” as do a few other ancient sources. By the middle ages, Arab astronomers described Sirius as white. Taking these color descriptions at face value, it seems that Sirius drastically changed color within 1,000 years. Current theories of stellar evolution allow for such changes in color, but not on a timescale nearly this short, so it is difficult for astronomers to explain this anomaly. Therefore, some creationists have used the recorded color change of Sirius as evidence that changes in stars take place much more quickly than generally thought, and hence the evolutionary timescale of very gradual changes is wrong (Ackerman 1986, 67; DeYoung 2010, 55; DeYoung and Lisle 2009, 192; Rybka 1993, 23–124). In a backhanded sort of way, this is an argument for recent origin, though it does not provide any quantified estimate for age.
How might Sirius have changed color? For more than a half century, astronomers have thought that red giant stars are the progenitors of white dwarfs. Therefore, many creationists concentrate on Sirius B, the white dwarf in the system now, suggesting that it was a red giant only 2,000 years ago, but since then it rapidly became a white dwarf. The transformation from a red giant to a white dwarf ought to take far longer than 1,000 years, which is the heart of this argument for recent origin. There are several problems with this suggestion. First, it tacitly accepts an idea of stellar evolution, something that creationists generally are loathe to do. We ought not to selectively choose which parts of stellar evolution theory we wish to accept. And if we are going to accept this portion of stellar evolution sans the time element involved, we ought to give physical reasons why the time to make this transformation is so short (astronomers give physical reasons why they expect it to take so long). Second, the physical mechanism whereby a red giant is thought to transform into a white dwarf is through strong stellar winds that lift large amounts of gas from the red giant’s surface, eventually exposing the stellar core, the white dwarf left behind. The gas ejected in this manner manifests itself as a planetary nebula surrounding the newly produced white dwarf. There is no planetary nebula around Sirius. Indeed, there is no cloud of gas surrounding Sirius, so where did the gas go? Furthermore, newly produced white dwarfs are extremely hot (typically in excess of 100,000 K), and they exponentially cool. This cooling process is well-understood physically. Sirius B is far too cool (25,000 K) to be a white dwarf that is merely 2,000 years old. One could hypothesize that red giants transform into white dwarfs via some other mechanism, but without some discussion of what that mechanism might be, it would be difficult to take such a proposal seriously.
Alternately, one could concentrate on Sirius A, suggesting that it had gone through a rapid change in color. There are a few stars that have undergone dramatic color changes over just a few decades. The best examples of this are FG Sagittae, V4334 Sagittarii, and V605 Aquilae (I shall briefly discuss these stars in a later section). The odd names of these stars indicate that they are variables, meaning that their brightness changes. Neither Sirius A nor Sirius B are variable stars. More importantly, all three of these variable stars are at the centers of planetary nebulae. Astronomers think that these stars are in the very final stages of making the transition from a red giant to a white dwarf. Sirius A appears to be an otherwise stable star. Therefore, contending that it is going through some process like these three variable stars probably will not be fruitful.
How do astronomers explain the ancient observations of Sirius? Ceragioli (1995) conducted a thorough review of the history of the red Sirius anomaly. The debate over Sirius began in 1760 when Thomas Barker raised the question of whether stars could change. Up to this point, the Aristotelian concept of the immutability of the heavens had been widely accepted. However, Barker gave several examples of stars that were known to have changed in brightness. For instance, astronomers at that time were just beginning to realize the existence of variable stars. Barker noted out that a nova in 1604 not only had changed brightness, but it also had changed color as it faded. This prompted Barker to suggest that other stars might change color as well, and he pointed out Ptolemy’s mention that Sirius had been red. Apparently, Ptolemy’s odd observation had attracted little attention, though medieval Arab astronomers commented that Sirius was white. However, Barker misinterpreted other ancient writers on the color of Sirius. When properly understood, many of the supposed other quotes do not support the notion that Sirius once was red.
Barker’s work attracted scant attention from astronomers. That began to change in 1839, when Sir John Herschel (the son of the famous astronomer William Herschel) opined on the nature of the variability of the star η Carinae, which he had observed. Herschel proposed that η Carinae varied irregularly as clouds of obscuring matter in space passed between the star and us. He further suggested that a similar explanation might explain the change of Sirius’ color from red, as reported by Ptolemy, to white. Today we know much more about the nature of extinction (the term that astronomers use to describe obscuration) by interstellar matter (dust). Whittet (1999) has examined this possibility and has shown that it does not work to explain Ptolemy’s odd mention of Sirius being red. Over the next few decades after Herschel, acceptance of Sirius being red in ancient times grew in popularity among astronomers. However, by the 1870s, astronomers began to develop rudimentary theories of stellar structure and evolution. A debate ensued as to whether red stars were very old or very young. Eventually, most astronomers favored the interpretation that red stars were very old. Within this view, it was not possible for Sirius to have aged from a youthful, white star to an old, red star so quickly, let alone further age back into a white star. Consequently, for several decades astronomers dismissed ancient references to Sirius being red and attempted to scrutinize ancient texts to determine if they really did refer to Sirius as being red.
The story that Sirius was once red probably would have disappeared from memory if it were not for Thomas Jefferson Jackson See (1866–1962) (often referred to simply as T. J. J. See). See was an American astronomer who showed great promise as a young man, but who managed to squander his talents in arrogance, pettiness, and mediocrity. See’s good accomplishments were overshadowed by his plagiarism and publication of bogus results. He had quarrels with many other astronomers, was fired from two observatory positions, and was banished to a lonely outpost by the U.S. Naval Observatory. By all accounts, he was consumed by desire that his work be recognized. His 1913 biography, which he obviously penned himself, was entitled Brief Biography and Popular Account of the Unparalleled Discoveries of T. J. J. See. Between 1892 and 1926, See published six papers on Sirius being red in antiquity. He ignored ancient records that reported that Sirius was white or blue, and he caustically attacked all who disagreed with him, including the respected astronomers G. V. Schiaparelli and Simon Newcomb. By the late 1920s, this idea that Sirius was red in antiquity had disappeared.
In his 1959 book, Close Binary Systems, Zdenĕk Kopal unwittingly unleashed the red Sirius story on the world once again. The modern theory of stellar evolution was developed in the late 1950s. Being a white dwarf, we would say that Sirius B is more evolved than Sirius A, a main sequence star. Presumably, both stars in the Sirius system are the same age. Sirius A has a little more than twice the mass of the sun, while Sirius B has a little less than one solar mass. But according to stellar evolution theory, the more massive star ought to evolve first, so how can this be? The answer is that Sirius B initially was more massive, but as it evolved beyond being a red giant, it lost considerable mass, leaving behind a white dwarf with less mass than Sirius A. Kopal commented that when Sirius B was a red giant, its much greater luminosity would have dominated the light of the system, much as Sirius A now dominates its light. Thus, Sirius would have appeared red and much brighter than it does now. For some reason, Kopal commented “that the majority—if not all—astronomical authorities of the ancient world described Sirius as a ‘red’ star . . .,”1 obviously relying upon See as his source. There has been some discussion of this problem among astronomers since but it has largely lacked significant attention.
In a second paper, Ceragioli (1996) addressed solutions to the red Sirius anomaly. First, most ancient sources that describe the color of Sirius do not say that it was red. Indeed, some ancient sources comment that it was white or blue, much as we see it today. This misrepresentation largely is due to See. Second, Sirius is well south of the celestial equator (current declination is nearly –17°), causing Sirius to be low in the sky from many locations in the Northern Hemisphere. Stars low in the sky are much more prone to scintillation (twinkling) due to atmospheric turbulence than are stars high in the sky. Scintillation causes rapid and drastic color changes in stars. However, our color sensitive cones require much light to be stimulated, so these color changes are not as noticeable on less-bright stars. Furthermore, Sirius’ white color provides the perfect background for our eyes to notice these rapid color changes. A yellow or red star cannot do this. Some of the ancient sources claimed to indicate that Sirius once was red are descriptions of the red flashes that Sirius exhibited, something readily seen today. Again, See and others misinterpreted these statements from ancient sources. Ptolemy’s statement is not modified in this way, so what do we make of it? There is much evidence that Ptolemy did not report much of his own observations, but instead transmitted the work of others. It is likely that Ptolemy did not faithfully reflect the entire context of earlier reports of the red color of Sirius.
From this discussion, it is not at all clear that Sirius was truly red in ancient times. If it was not, then there is no red Sirius anomaly to explain. To anyone familiar with the work of See, his involvement probably taints the entire discussion. Therefore, this does not appear to be a good argument for recent origin.
The Algol Paradox and Pre-Main Sequence Binaries
A binary star is a system of two stars orbiting a common center of mass under the influence of the stars’ mutual gravity. There are examples of multiple star systems, such as a close binary star orbited by third star at considerably more distance than the separation of the close binary. Sometimes the third star is a binary as well. Or consider Castor, the second brightest star in the constellation Gemini, and the 24th brightest appearing star (excluding the sun). Through the telescope, one can see that Castor consists of a binary star orbited by a third star. However, all three stars in turn are binary stars in much smaller orbits around one another, bringing the total to six stars.
It appears that most stars are members of binary star systems. There is no satisfactory naturalistic explanation for this. The probability of stars randomly coming together to form a binary is vanishingly small, so presumably most binary stars formed this way. But why stars have a proclivity to form in binaries is unknown. Binary stars are very valuable in deducing stellar properties, because they allow us to determine fundamental stellar properties that we cannot measure any other way. Because binary stars orbit via their mutual gravity, and gravity depends upon mass (Newton’s law of universal gravity), study of binary star orbits allow astronomers to measure the masses of stars. A class of binary stars, eclipsing binaries, offer the only direct method of measuring stellar sizes (diameters). Both mass and size are important quantities in testing our theories of stellar structure. Why did God make so many binary stars? It could be that He did so to make it possible for man to plumb the depths of creation more fully. If so, then design can account for why there are so many binary stars.
We have a good understanding of the physical structure of stars. We also understand that stars derive their energy from thermonuclear reactions in their cores. The byproducts of these thermonuclear reactions cause changes in the physical structure of stars. The changes in physical structure in turn gives rise to changes in the gross properties of stars, such as stellar radius and surface temperature. These processes take considerable time, but, given enough time, the gross properties of stars must change (Faulkner and DeYoung 1991). Astronomers refer to these changes in stellar properties as stellar evolution. Hence, the theory of stellar evolution may be tested by studying binary stars. The modern theory of stellar structure and evolution were developed in the late 1950s. A key tool in studying stellar structure and evolution is the Hertzsprung-Russell (H-R) diagram (fig. 4). The H-R diagram is a plot of some measure of stellar brightness versus a measure of stellar temperature (while brightness increases vertically, for historical reasons, temperature increases to the left on the H-R diagram). Most stars fall along a roughly diagonal band from upper left to lower right, a feature that astronomers call the main sequence). Giant stars are to the upper right, while white dwarf stars are to the lower left. The main sequence is believed to be where a star originally is situated on the H-R diagram after it forms. The main sequence represents a time of stability, where a star spends most of its lifetime deriving the energy necessary to power the star through thermonuclear fusion of hydrogen into helium in its core.
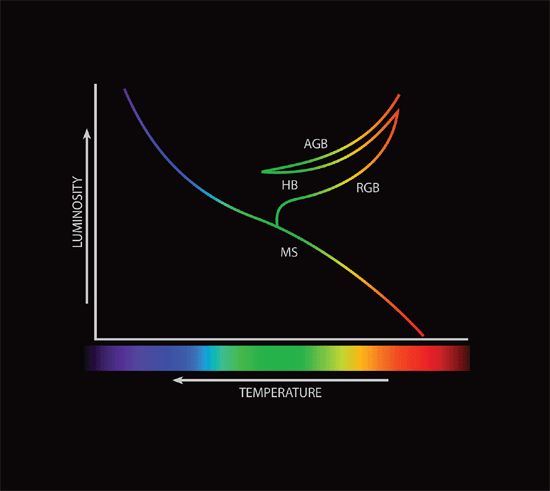
Fig. 4. The Hertzsprung-Russell (H-R) diagram is a plot ofstellar luminosity versus temperature, with luminosity increasing upward and temperature increasing to the left. Most stars fall on the roughly diagonal band called the main sequence (MS). The paths above the MS indicate the theoretical evolution of the sun from the MS through the red giant branch (RGB), the horizontal branch (HB), and asymptotic giant branch (AGB).
However, a star eventually will consume all the hydrogen fuel in its core. Assuming that there is sufficient time to exhaust the hydrogen fuel in its core, a star will evolve off the main sequence to become a giant. There are different pathways a giant star can take, with one eventually ending as a white dwarf. However, these details are of no concern to the present discussion. The theory requires that more massive stars evolve more quickly than less massive stars. And therein modern stellar evolution theory met a challenge at its beginning in the 1950s. Algol, the second brightest star in the constellation Perseus, was the first discovered eclipsing binary star. It consists of a main sequence star that is has 3.5 times the mass of the sun and a subgiant with 0.80 the mass of the sun. The subgiant is a star that has evolved off the main sequence, leaving its main sequence companion behind, even though it has less than one-quarter the mass of the unevolved star. Since the stars likely are the same age, how can this be? When this problem was realized, it became known as the Algol paradox. Nor was Algol alone, for there are other binary star systems with an evolved, lower mass companion, and an unevolved higher mass companion. This is so common that Algol has leant its name to a subclass of eclipsing binary stars, Algol-type stars.
Resolution of the Algol paradox was not long in coming. The stars in an Algol system orbit so closely to one another that as one star evolves off the main sequence, tidal forces raised on it by its main sequence companion pulls matter off the evolving star. Conservation of angular momentum prevents the matter from falling directly onto the main sequence star. Rather, the matter forms an orbiting accretion disk around the main sequence star. Viscous losses in the accretion disk permits material gradually to fall onto the main sequence companion. Therefore, over time there is significant mass transfer between the stars so that the star that originally was more massive is now less massive. Lest anyone think that this is mere speculation, there is abundant evidence that this is the case (Kaitchuck 1992). For instance, astronomers can detect the presence of the accretion disk by its spectral emission lines during the eclipse of the main sequence star (out of eclipse, the much stronger absorption spectrum of the main sequence prevent this). In fact, I once participated in a program of simultaneous spectroscopy and photometry investigating the accretion disk around the primary star of U Cephei, an Algol-type eclipsing binary (Kaitchuck, Honeycutt, and Faulkner 1989). The Algol paradox has not been discussed in the creation literature, but some creationists have mentioned it in presentations, suggesting either that it was a problem for evolutionary thinking in astronomy (it isn’t) or that it somehow indicates recent origin (it doesn’t). While he did not use the term “Algol paradox,” West (1981) described the Algol paradox. He acknowledged that mass transfer was the resolution of the Algol paradox, but went on to suggest an alternative scenario. West proposed that the giant companions of Algol systems were not post-main sequence stars at all, but instead were stars that were still forming. That is, they were young stars. West acknowledged that the timescale of their evolution (or development) was longer than that of the recent creation model, but that it was far shorter than the evolutionary timescale, thus suggesting that this might be a possible recent creation indicator. Rybka (1993, 177) briefly discussed this, relying heavily upon West. However, this does not appear to be a good indicator of recent origin.
Related to the Algol paradox, Boardman, Koontz, and Morris (1973, 147) identified what they thought was a problem for the evolutionary theory of stars, and hence amounted to a back-handed indicator of youth. They noted that some binary stars generally are assumed to be the same age, yet sometimes contain an old, evolved star and a young star. They gave the example of Sirius, which contains a white dwarf and a bright, blue young star. They asked how this could be, if the two stars in this system must be the same age. What they apparently were unaware of was that astronomers think that stars evolve at different rates depending upon their masses. Hence, there is no contradiction here, and the Algol paradox is not a good argument for recent origin.
Rapidly Changing Stars
As previously mentioned, the stars FG Sagittae (FG Sge), V4334 Sagittarii (V4334 Sgr), and V605 Aquilae (V605 Aql) have undergone dramatic and rapid color changes in recent decades. In 1955, astronomers determined that FG Sge’s spectral type was B. In 1991, only 36 years later, its spectral type was G, but eventually it became a K-type star. This is a drastic change in color from blue, to yellow, to orange, with a corresponding large change in surface temperature. Within the theory of stellar evolution, stars generally do not change this quickly; hence, some biblical creationists use the case of FG Sge to argue that there is something wrong with that theory (Anonymous 1991; Bartz 1992). Some creationists have suggested that these changes demonstrate that stars change very quickly, not over vast periods of time.2 However, this puts creationists in the peculiar situation of saying that stellar evolution does not happen, but when it does, it happens very quickly! Over the years, astronomers have learned much more about FG Sge, and they have found other stars that resemble it. Most notable are the stars V 4334 Sgr, also known as Sakurai’s object, and V605 Aql. All three of these stars are central stars of planetary nebulae. Astronomers believe that these stars are on their way to becoming white dwarfs, but that they have not reached that status quite yet. The immediate precursors of white dwarf stars probably are asymptotic giant branch stars. Astronomers expect that these stars undergo thermal pulses, episodic occurrences of thermonuclear reactions in the layers surrounding their cores. Astronomers think that very late thermal pulses briefly can rejuvenate a dying star before it finally becomes a white dwarf. These three stars are thought to be undergoing late thermal pulses.
Since there is a plausible explanation for rapid changes in these stars, this probably is not a good argument for recent origin.
Dust Around Hot Stars
Slusher (1980a, 64) and Rybka (1993, 114) briefly discussed dust clouds around hot stars (fig. 5). The argument is that the Poynting-Robertson effect increases with increasing stellar luminosity. Since hot, blue main sequence stars can be many thousands of times brighter than the sun, the Poynting- Robertson effect must be thousands of times more efficient around those stars, effectively removing all dust close to them. Both Slusher and Rybka then argued that since many hot stars are observed to be surrounded by dust clouds, those stars must be very young.
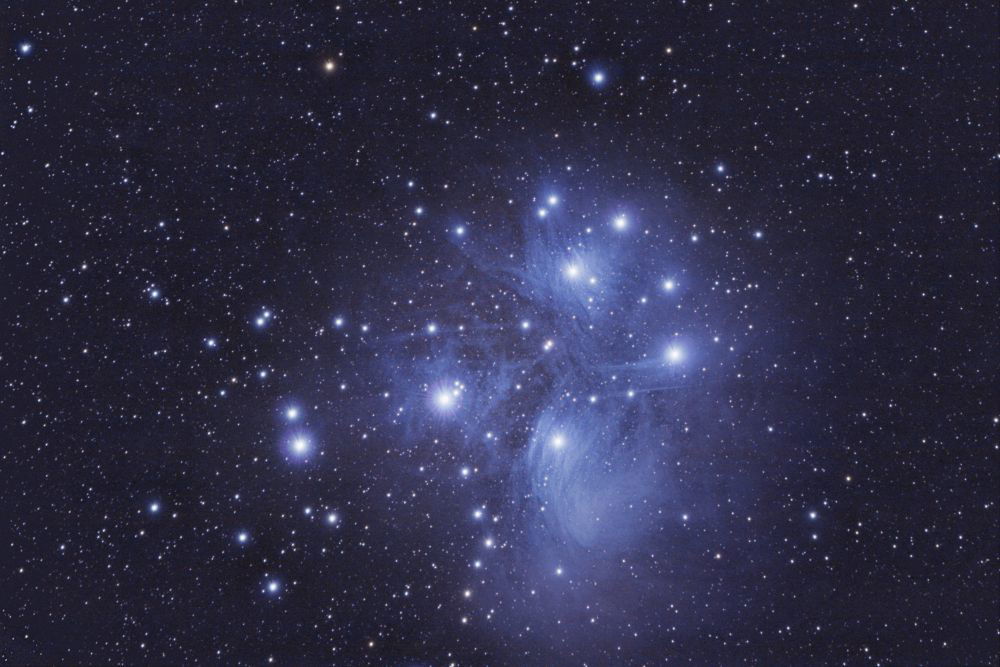
Fig. 5. The Pleiades star cluster is an excellent example of hot, blue stars surrounded by dust. Scattering of light from the stars in the Pleiades produces the blue nebulosity visible in this photo. Photo courtesy of Jim Bonser.
It is true that hot stars frequently are surrounded by dust clouds, but how far are those dust clouds from the stars? Slusher did not say, but Rybka did a simple calculation for the sweep-up time for dust within 30 astronomical units (AU) from a hot star. The problem is that the dust clouds surrounding hot stars extend much farther out than this. For instance, many bright, hot stars have visible reflection nebulae around them. At the distance of these stars, to be visible as reflection nebulae, the dust clouds must be many thousands of AU from the stars, where the Poynting-Robertson effect is nil. Therefore, this is not a good argument for recent origin.
Stars Containing Technetium
Thermal pulses in asymptotic giant branch stars have been invoked to explain unusual characteristics of some red giants. Carbon stars are red giants that have an overabundance of carbon. Normally, oxygen is more abundant than carbon in stars, but the situation is reversed in carbon stars. Astronomers think that carbon was produced in thermal pulses in these stars, followed by convection that dredged the carbon up to the stars’ photospheres. Metal stars, stars with unusually high abundances of metals with atomic numbers greater than iron, such as zirconium, yttrium, strontium, barium, and lanthanum, are similarly explained. The theory is that these metals recently were synthesized in thermal pulses and dredged up to the photospheres of these stars. Some metal stars have absorption lines of technetium in their spectra. There are no stable isotopes of technetium, and none of its isotopes have half-lives more than a few million years. Some biblical creationists have pointed out that the presence of technetium in these stars shows that the stars are not billions of years old.3 However, no one suggests that the technetium has been present in these stars for nearly that long. Instead, the technetium was recently introduced and eventually will decay away. Therefore, the presence of technetium in a few stars is not a good argument for recent origin.
Recurrent Novae
Recurrent novae are a subgroup of cataclysmic variables. Cataclysmic variables are stars that irregularly rapidly increase in brightness by a large amount. The rapid increase in brightness is followed by a more gradual decline, after which there is quiescence until the next outburst. All cataclysmic variables are interacting binary stars in which one member is a white dwarf. The other star is on or near the main sequence. An interacting binary star is a binary system where the two stars orbit closely enough for matter to stream from one star to the other. In the case of cataclysmic variables, the white dwarf is the recipient of mass transfer from its companion star. The strong gravity of the white dwarf tidally distorts its companion and lifts matter from the near side of its companion, pulling the matter toward the white dwarf. Angular momentum conservation prevents the matter from falling directly onto the white dwarf. Instead, the matter settles into an accretion disk around the white dwarf. Within the accretion disk, viscous forces rob the matter of orbital energy, causing the matter gradually to rain down onto the white dwarf’s surface. The infalling matter is rich in hydrogen, an element that white dwarfs are deficient in.
The best-known cataclysmic variables are the classical novae, which brighten by 9–15 magnitudes.4 The cause of the eruption of classical novae is thermonuclear detonation of hydrogen on the surface of the white dwarf. The eruption ejects some matter from the white dwarf into interstellar space. Between eruptions, hydrogen builds up on the surface of the white dwarf. As the hydrogen accumulates, the pressure and temperature at the bottom of the hydrogen layer increases. An eruption occurs when the pressure and temperature are sufficient for fusion of the hydrogen into helium, resulting in a thermonuclear runaway. When nearly all the hydrogen is consumed, the eruption subsides, and the process begins anew. It is not clear how much time passes between eruptions, but it likely is thousands of years.
The mechanism responsible for outbursts in recurrent novae probably is the same as the classical novae. The outbursts are slightly less energetic, but with some overlap with classical novae. The time between outbursts is shorter too, typically a century or less. However, this may be the result of observational bias (we have been studying them for about a century) rather than some physical difference. Our understanding of classical and recurrent novae is still in development, so changes in our understanding of them are almost certain. Currently, there are ten recognized recurrent novae. Schaefer (2010) has assembled an incredible amount of photometric data on all ten.
Rybka (1993, 110–111) discussed recurrent novae as evidence of recent origin. He listed five recurrent novae, but two of them, WZ Sagittae (a dwarf nova) and T Sagittae (a long period variable),5 are not recurrent novae. In fairness to Rybka, he relied upon sources from 1970 and 1971, a time when our understanding of cataclysmic variables was just beginning. WZ Sagittae and T Sagittae may have been classed as recurrent novae then, but they have since been reclassified. Rybka noted that recurrent novae outbursts are fainter than they had been in the past. For instance, he stated that recent outbursts of T Coronae Borealis and RS Ophiuchi were about a magnitude fainter than earlier outbursts. Rybka reasoned that if recurrent novae are becoming less energetic over time, then there must be a maximum time over which they had been active. To quantify this, Rybka took information that T Sagittae was 0.21 magnitude fainter in its 1946 outburst than at it was in its 1913 outburst to estimate a maximum age of T Sagittae as 2,360 years.
There are several things wrong with this approach. First, from the photometry that Schaefer published, there is no clear trend of decreasing brightness of outbursts. If anything, the outbursts of recurrent novae appear to be remarkably similar from one outburst to the next. It is likely that the old information that Rybka used was based upon incomplete photometry. Second, the calculation that Rybka performed was using data from what we now understand to be a long period variable, not a recurrent nova. Third, our understanding of novae of all types is much better now. Within our model of recurrent novae, there is no expectation that there is a gradual fading in eruptions over time. Eruptions may continue until the white dwarf exceeds the Chandrasekhar limit, at which a type Ia supernova occurs, ending the cycle of recurring eruptions. Or the donor star may cease transferring matter to the white dwarf, thus ending the cycle. Therefore, recurrent novae do not provide a limit on the age of the cosmos.
Fast Binaries
Brown (2008, 90) suggested that the existence of binary stars with very short periods indicate that theories of stellar evolution must be wrong. In a back-handed sort of way, this amounts to an argument for recent creation. More specifically, Brown used the example of 4U 1820-30, a binary star with one of the shortest known orbital periods. 4U 1820-30 is a low- mass X-ray binary consisting of a neutron star and a very low-mass white dwarf (Rappaport et al. 1987). The orbital period is only 11 minutes, suggesting a separation of about 130,000 kilometers between the two stars. This is far less than the radius of the sun or the radii of most other stars. Since astronomers think neutron stars and white dwarfs evolve from main sequence stars after they have passed through the giant phase (stars much larger than main sequence stars), Brown suggested that the two stars could not have orbited each other prior to becoming the stars they are now, because the stars would have collided. Though he did not explicitly state it, Brown apparently concluded that this system was created much as it now exists.
However, Brown does not realize that he has stumbled onto a scenario that can explain these stars within conventional theories of stellar evolution (Kalogera and Webbink 1998; Tauris and van den Heuvel 2006). Many X-ray binaries are explained in terms of common envelope evolution. We define a star’s envelope as all the star outside of its core. When two stars orbit very closely, they can share a common envelope. Examples of these are contact binaries, such as W Ursae Majoris systems. A common envelope can alter the way that stars normally evolve if they were single. In some binary systems, it is possible for one star to orbit within the envelope of its companion. After one star evolves into a white dwarf or compact object (neutron star or black hole), and the second star begins to swell as it evolves, the orbital motion of the already evolved star may be through the envelope of its companion. This produces drag, resulting in a decreased orbital size. Additionally, the presence of the evolved star orbiting within its companion star’s envelope can lead to extreme mass loss of the companion, resulting in the companion having far less mass than normally possible. This likely is the situation of 4U 1820-30, where the white dwarf has far less mass than white dwarfs normally have. Another scenario posits an asymmetrical eruption of the supernova that created the compact object, producing a natal kick on the compact object, reducing the orbital size. A third possibility is the capture of an evolving star by a neutron star to form a close binary. This is a possibility in 4U 1820-30, because it is located near the center of the globular cluster NGC 6624. The central regions of globular clusters have high stellar density, with relatively high probability of such capture events.
Since the discovery of 4U 1820-30, astronomers have found at least two other binary stars with even shorter periods. V407 Vulpeculae (RX J1914.4+2456) has an orbital period of 9.5 minutes, while HM Cancri (RX J0806.3+1527) has an orbital period of only 5.4 minutes (at the time of this writing, this is the shortest period binary star known). These two systems are classified as AM Canum Venaticorum (AM CVn) stars, a subclass of cataclysmic variables. AM CVn stars consist of two white dwarfs in a close orbit. Scenarios similar to the ones briefly described above have been invoked to explain the origin of these close binary stars. The orbit of V407 Vulpeculae (V407 Vul) continues to decrease due to gravitational radiation (Strohmayer 2004).
With a plausible explanation for the origin of quickly orbiting binary stars, their use as a criticism of stellar evolutionary theory or as a young-age indicator is not advisable.
Supernova Remnants
Davies (1994, 2007) proposed that the lack of old supernova remnants, particularly third stage supernova remnants, presents evidence of recent creation. However, Faulkner (2017a) has called this into question by identifying old supernova remnants and several such remnants believed to be in the third stage (see this paper for a discussion of our understanding of the development of supernova remnants, along with the three stages). Therefore, supernova remnants probably do not offer a good argument for recent origin.
Break-up of Star Clusters
Many stars exist in star clusters. There are two types of star clusters, open clusters (fig. 5) and globular clusters (fig. 6). As the name suggests, globular clusters appear as globes, or spheres, of stars. Hence, globular clusters have radial symmetry. Globular clusters are very rich, typically containing tens of thousands of stars up to a half million stars. There is central condensation, with the density of stars generally decreasing from the cores of globular clusters outward. Open star clusters are very different from globular clusters. Open clusters have irregular shapes, and hence they have no symmetry. Open clusters contain far fewer stars than globular clusters—typically thousands of stars.
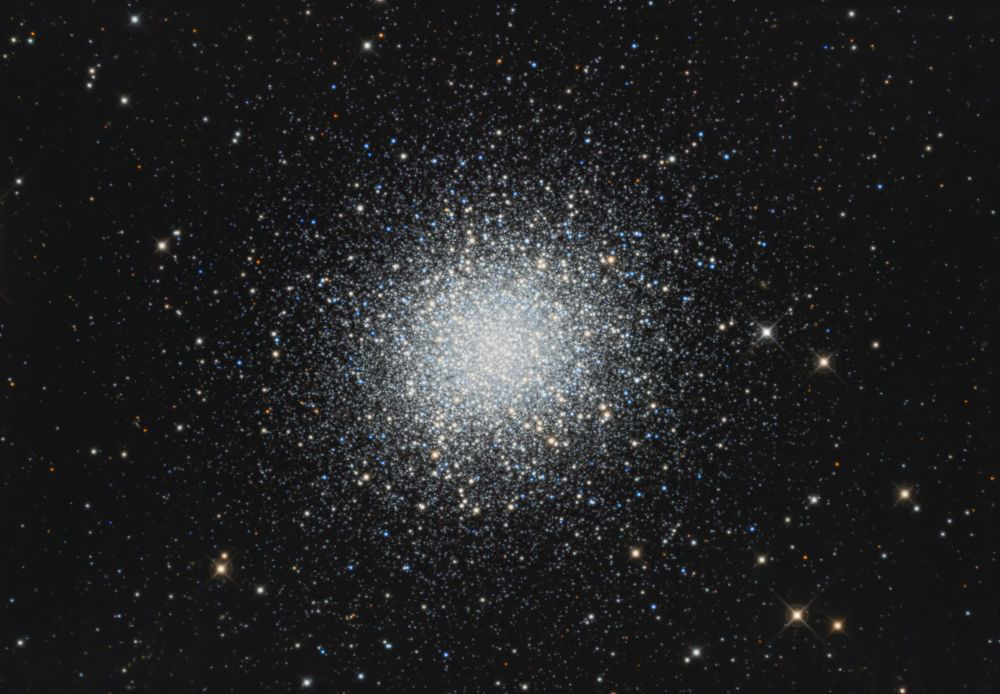
Fig. 6. The globular cluster M3. Photo courtesy of Glen Fountain.
Star clusters appear to be gravitationally bound, with individual members orbiting around a common center of mass. This makes them very dynamic systems, and astronomers have spent considerable time studying the long-term stability of such systems. Most clusters eventually will disrupt, so the study of the disrupting processes can lead to an estimate of the maximum dynamic age that star clusters can have. There are several mechanisms that cause disruption of clusters of stars. Gravitational interactions between individual members can result in expulsion of some members. However, this has the result of more tightly binding remaining members. Interaction with binary stars within the clusters increases the complexity of these processes. Via interactions with other members, the orbits of binary stars within the cluster can shrink, releasing additional orbital energy to the cluster, causing members of the cluster to be less gravitationally bound to the cluster. On the other hand, the converse reaction is possible too, with binary orbits increasing in size and absorbing orbital energy from the cluster. This results in member stars being more tightly bound to the cluster. More significant are tides raised by the mass of the center of the galaxy. This tidal interaction further shortens the time that a star cluster may remain intact. And potentially more significant are tides raised by large gas clouds as they pass close to a cluster.
Creationists have cited the break-up time of open star clusters as evidence of recent origin (Slusher, 1974; Slusher 1980a, 16; Slusher 1980b, 59). Rybka (1993, 102) did a simple calculation showing that the break-up time was on the order of millions of years, referring to the work of V.A. Ambartsumian. However, it appears that the intended work of Ambartsumian was about very loose groupings of stars called associations. Associations have far fewer members than star clusters do (typically less than a few score stars). More specifically, Ambartsumian’s work was about associations similar to the Trapezium, an association of stars at the core of the Orion Nebula (fig. 7). The maximum age of Trapezium-type associations is tens of millions of years. However, Trapezium-type associations consist of very hot, massive stars that have maximum ages of approximately 50 million years (Abt and Corbally 2000). Therefore, there is no conflict between the dynamic age and evolutionary age of such systems.
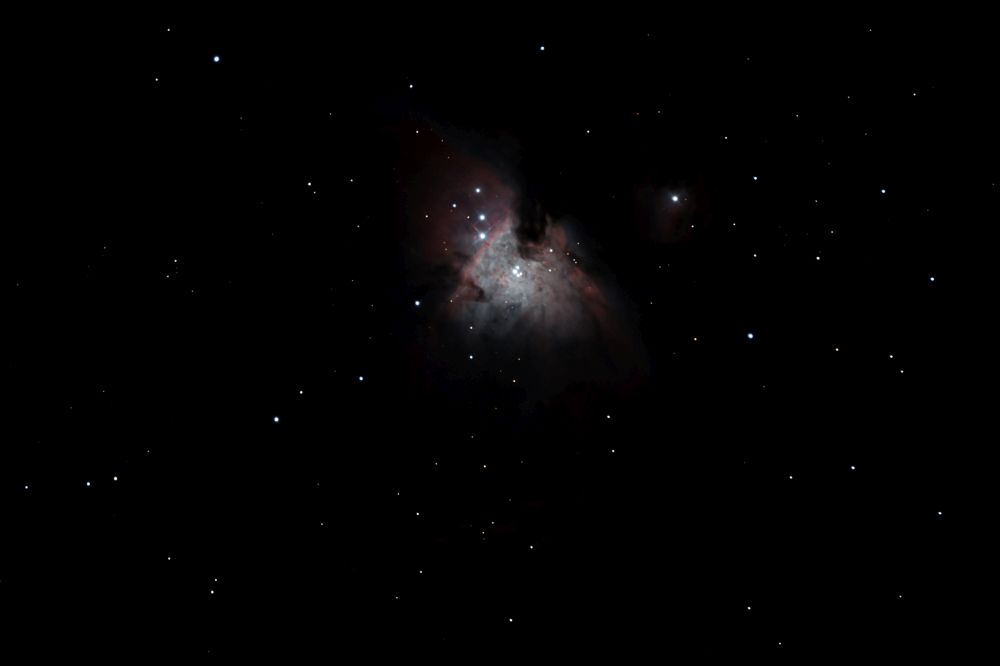
Fig. 7. The Orion Nebula (M42). The Trapezium is the four stars at the center of M42. Photo courtesy of Jim Bonser.
Open star clusters have longer dynamic ages. Consider the Pleiades, the best example of an open cluster (fig. 5). Converse and Stahler (2010) have modeled the dynamics of the Pleiades and found that it will dissipate in approximately one billion years. However, they did not include tides raised by gas clouds. The addition of this effect undoubtedly would reduce the time further. However, the estimated evolutionary age of the Pleiades is about 125 million years, so there is no conflict between the evolutionary age and this maximum dynamic age.
Most astronomers think that globular clusters are very old, forming shortly after the big bang. Gnedin and Ostriker (1997) found that globular clusters disrupt in time approximately that of the big bang age of the universe. From this, they concluded that a significant number of globular clusters already have disrupted. Once again, there does not appear to be a conflict between the dynamic ages of globular clusters and their evolutionary ages.
For all types of clusters and associations, it appears that there is no conflict between their evolutionary ages and their dynamic ages. Perhaps some early work on this subject in the creation literature did not fully address the issues involved. However, Steidl (1979, 169) correctly pointed out that the disruption times of open clusters did not conflict with their evolutionary ages. In his discussion of globular clusters (Steidl 1979, 170–171) suggested that the maximum ages of some globular clusters might exceed their evolutionary ages, though he indicated that this work was in its infancy at the time that we wrote. Much work since that has shown that globular cluster dynamics do not indicate a conflict between maximum dynamic ages and evolutionary ages of cluster. At any rate, the break-up time of star clusters does not appear to be a good evidence for recent creation.
Collapse of Elliptical Galaxies
Rybka (1993, 115–116) did a simple calculation of how long it would take an elliptical galaxy to form, and he found it to be 220 million years. Assuming that elliptical galaxies are primordial, Rybka equated this with the age of the universe. However, his calculation was very simple, and actual theories of galaxy formation are far more sophisticated that what Rybka did. However, Rybka’s calculation probably is well within an order of magnitude of what most astronomers would accept. The problem is that Rybka has misinterpreted what it means to be primordial (which is what astronomers believe to be the case for elliptical galaxies). The conventional theory today is that all the gas in elliptical galaxies rapidly formed stars in the early universe, leaving no gas for later star formation. Consequently, elliptical galaxies have not evolved much since then, so they are very old galaxies today, not young, recently formed galaxies.6 Therefore, this is not a good argument for recent origin. To be fair to Rybka, he did advise caution in using this argument.
Break-up of Clusters of Galaxies
As stars often occur in clusters within galaxies, galaxies in turn usually clump together into clusters. Clusters typically contain a thousand galaxies or more. The closest galaxy cluster to us is the Virgo Cluster (fig. 8), centered about 54 million light years away and containing at least 1,300 galaxies. Our collection of a few dozen galaxies, but only three, including the Milky Way, are of any appreciable size. The Local Group probably is a distant outlier of the Virgo Cluster.
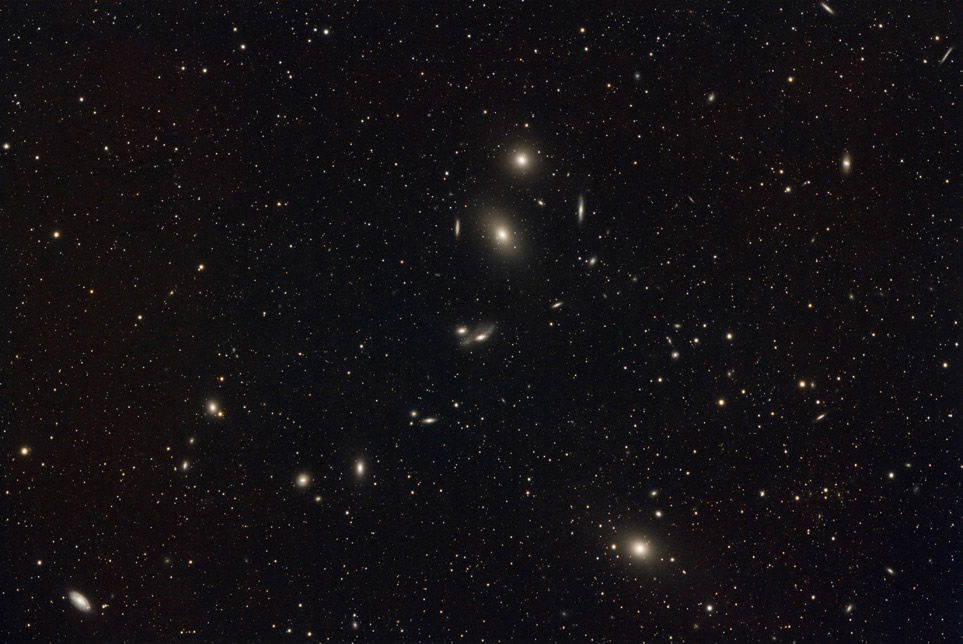
Fig. 8. The central region of the Virgo Cluster. Photo credit: Wikimedia Commons: Kees Scherer.
As with stars in a star cluster, the individual galaxies within a cluster of galaxies appear to be gravitationally bound and orbit a common center of mass. The radial velocity of each galaxy is a combination of orbital motion and the cosmological redshift of the cluster. Therefore, we would expect the average of the radial velocities of the galaxies within a cluster to be the velocity of recession of the cluster due to cosmic expansion. The deviation of the velocity of each galaxy from the average velocity represents the orbital motion of the galaxy. However, this measured orbital motion is reduced from the actual orbital motion because of the inclination of each galaxy’s orbit to our line of sight and the orientation of the orbit. By using a large sample size, we can treat the average deviation statistically to overcome this difficulty. This corrected average orbital velocity allows us to measure the mass of a galaxy cluster. We call the mass determined this way the dynamic mass, because it is based upon the orbital motion of member galaxies. Fritz Zwicky was the first to do this with the Coma Cluster in the 1930s.
Zwicky also computed the lighted mass, the mass indicated by the amount of light emanating from the cluster. The reasoning behind the lighted mass is that more mass usually translates into more stars, which in turn more stars will produce more light. Astronomers can determine the mass-to-light ratio by doing censuses of stars within our own Milky Way galaxy. Zwicky measured the light of all the galaxies in the Coma Cluster, which he multiplied by the mass-to-light ratio to find the lighted mass. He found that the dynamic mass greatly exceeded the lighted mass of the Coma Cluster. Soon, Zwicky studied other systems and found similar results. In general, the dynamic mass was 5–10 times greater than the lighted mass.
There are three ways to resolve this issue (Steidl 1979, 183–185). One possibility is to take the results at face value and conclude that clusters of galaxies are not gravitationally bound, but instead are rapidly breaking up. How rapidly would this break-up occur? Calculation reveals that clusters would disperse within a few hundred million years (Rybka 1993, 104–106). This is but a few percent of the supposed ten-billion-year age of galaxies within clusters. Clearly, this would indicate a recent origin, so this has been the favored interpretation of many creationists (Ackerman 1986, 68–70; Slusher 1980a, 7–14; Slusher 1980b, 52, 59–66). A second possibility, that much unseen matter exists in clusters of galaxies, can make up the difference between the dynamic and lighted matter. For a long time, this unseen matter was referred to as “missing mass,” and astronomers generally viewed it as an oddity and consequently ignored it. This situation began to change as rotation curves of galaxies obtained in the 1970s clearly showed a second line of evidence for this missing mass, now termed dark matter. Another line of evidence, in the form of gravitational lensing, soon followed. For a discussion of the argument for dark matter in the creation literature, see Faulkner (2017b). The third possibility is that our understanding of gravity on galactic scales is incorrect. Some people have suggested that MOdified Newtonian Dynamics (MOND) is the solution to this problem.
Astronomers and most of the physics community favor dark matter. However, many creationists have been suspicious of dark matter and favor MOND instead. It appears that at least some of the early opposition to dark matter among recent creationists was an attempt to continue using the dispersion velocities of clusters of galaxies as an argument for recent origin. However, many recent creationists have lost sight of this earlier motivation as they have embraced MOND. If either dark matter or MOND is the solution to the discrepancy between the different measures of mass, the argument for recent creation from the apparent break-up of clusters of galaxies is lost. Until this matter is better resolved, it is not advisable that creationists use this argument. At the very least, any discussion of this evidence for recent creation ought to be accompanied by discussion of dark matter or MOND.
Luminous Bridges Between Galaxies and Quasars
This evidence for recent origin is not well known among creationists, but it is in the creation literature, so it is worthy of discussion here. Slusher (1980a, 15; 1980b, 52–53) and later Rybka (1993, 107–108) mentioned that some pairs of galaxies appear to have luminous bridges connecting them. This undoubtedly flows from the work of the late astronomer Halton Arp. Arp pursued some controversial ideas in astronomy. The first quasar was identified in 1963. Based upon their large redshifts, most astronomers concluded that quasars were some of the most distant objects in the universe. However, Arp rejected this standard interpretation in favor of quasars being relatively nearby. He believed that the high redshifts of quasars were due to some mechanism other than cosmic expansion. Arp pursued various avenues to support his contention. His 1966 Atlas of Peculiar Galaxies (Arp 1966) is a classic that is still widely used. Many of his peculiar galaxies appear to have companion objects, some of which turned out to be quasars or quasar-like objects. However, the quasars had much greater redshifts than the galaxies they appeared next too. The standard interpretation is that the quasars and galaxies are chance alignments, with the quasars being much farther away, but Arp rejected this. To further support his contention, Arp identified what he thought were luminous bridges between a few of the galaxies and their companions. If there indeed was a luminous bridge connecting them, then the pairs of objects must be near one another, and hence the quasars could not be much more distant objects, calling into question the cosmological interpretation of redshifts. Arp also found what he thought were luminous bridges connecting galaxies with discordant redshifts. Arp eventually published his work in two popular-level books (Arp 1987, 1998). While Arp accepted the luminous bridges between galaxies and quasars or galaxies and other galaxies of different redshifts, most other astronomers did not. Instead, they argued, the luminous bridges were artifacts of long exposures with light bleeding between two images. That is, Arp accepted the reality of luminous bridges but rejected the cosmological interpretation of the redshifts involved, while most other astronomers rejected the luminous bridges but accepted the cosmological interpretation of the redshifts.
The best example of Arp’s galaxy/quasar connection is NGC 4319 and Markarian 205 (DeYoung 1983, 54–57; Snelling 1997a). Slusher and Rybka seem to have adopted a position close to Arp’s. Slusher and Rybka accepted the reality of luminous bridges, but believe the redshifts are due to the Doppler effect rather than being cosmological. They reasoned that if the galaxies are physically connected but have such large difference in motion through space, then they must be very young. However, more recent photos of NGC 4319 and Markarian 205 with the Hubble Space Telescope (fig. 9) call into question the reality of the luminous bridge (Faulkner 2018). Given the questionable status of the luminous bridges connecting galaxies and quasars, this probably is not a good argument for recent origin. At best, it might be used to argue that a few select objects are young.
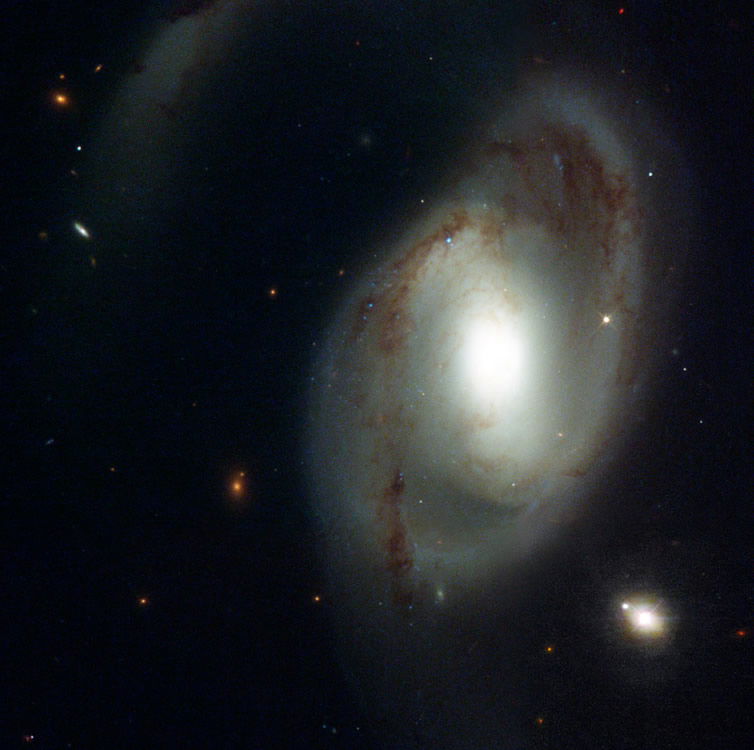
Fig. 9. NGC 4319 and Markarian 205 (lower right). Notice that there is no clear evidence of a luminous bridge between the two. Photo credit: NASA/ESA and The Hubble Heritage Team (STScI/AURA).
Persistence of Spiral Arms
There are two basic types of galaxies: ellipticals and spirals. As the name suggests, elliptical galaxies appear elliptical. Other than a central condensation, elliptical galaxies generally have no internal structure. On the other hand, spiral galaxies (fig. 10) have spiral arms that are connected either to a spherical nucleus (unbarred spirals) or a bar passing through a spherical nucleus (barred spirals). Spiral arms are an enhancement in the interstellar medium, with large clouds of gas and dust. Additionally, there are many bright, hot O and B spectral type stars along spiral arms. While spiral arms are obvious in many photographs, there is less to the spiral arms than the photographs suggest. Many early photographic emulsions were blue-sensitive with little red response. The blue sensitivity accentuated the O and B type stars in the spiral arms. However, red-sensitive emulsions eventually were developed, and in photographs taken with those emulsions, the spiral arms nearly disappear. Instead, spiral galaxies in red-sensitive photographs show the full disks of the galaxies. This is because the bulk of the stars in galaxies are faint, red, lower main sequence stars, and they are not concentrated along the spiral arms. Therefore, contrary to the impression one may get from most photographs of spiral galaxies, the density of stars between the spiral arms is about the same as the density of stars within the spiral arms.
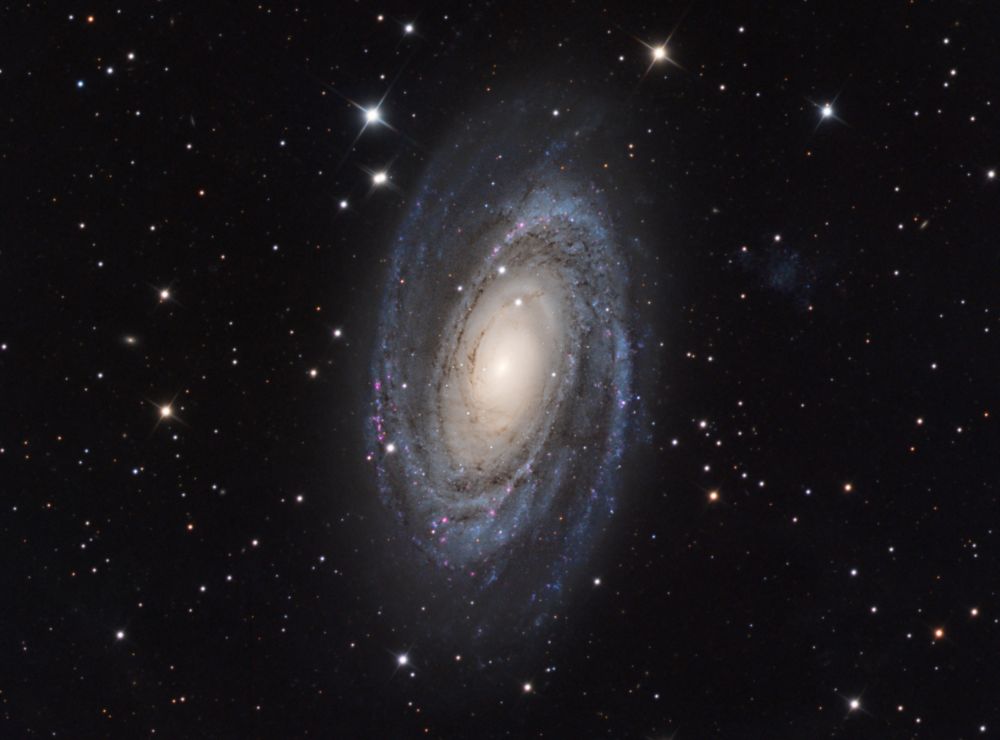
Fig. 10. The spiral galaxy M81. Photo courtesy of Glen Fountain.
A galaxy is a vast system of stars orbiting around a common center of mass. Both orbital speed and the distance to complete one orbit varies with distance from the center of a galaxy. Therefore, outside the central region, the orbital period varies with distance, with the period generally increasing with increasing distance from the center. Since the objects within spiral arms orbit with different periods, after a few orbits the spiral arms ought to spread around, effectively smearing the arms until they are no longer recognizable. Thus, spiral arms suggest that galaxies are not billions of years old (Slusher 1980a, 15–16; Slusher 1980b, 53–57). The sun would take approximately 250 million years to orbit the galaxy, so in the supposed ten-billion-year history of the Galaxy, objects in the solar neighborhood would have orbited 40 times. Clearly, spiral arms could not have persisted for nearly this long. Rybka (1993, 98–101) estimated the maximum age for spiral galaxies to be a billion years, though the actual age could be far younger.
In the 1920s, Bertil Lindblad was the first to draw attention to this winding dilemma in a universe that is billions of years old. The most popular solution to the winding dilemma is density wave theory (Lin and Shu 1964). Density wave theory proposes that a wave in the interstellar medium rotates more slowly than material objects, such as stars and galaxies. When gas in the interstellar medium encounters the wave, the gas is compressed, leading to star formation. Some of the stars formed are O and B stars that have short lifetimes. Consequently, these stars do not travel very far before they exhaust their fuel and cease to exist, at least as bright stars. Therefore, we observe them near the places of their birth, along the spiral arms. In this view, spiral arms persist, because, like any wave, they are not subject to gravity and hence propagate at their own speed. In what originally was a competing theory (Mueller and Arnett 1976), shock waves in the interstellar medium from stellar winds and supernova explosions drive star formation. However, many elements of this theory are now combined with density wave theory.
Humphreys (2005) has said that density wave theory “has conceptual problems, [and] has to be arbitrarily and very finely tuned” to work. Furthermore, he cited a study (Zaritsy, Rix, and Rieke 1993) that called density wave theory into question. There have been other studies (e.g. Foyle et al. 2011) that have shown difficulties with density wave theory. There have been other suggested mechanisms to cause and/or maintain spiral structure in galaxies. For instance, Purcell et al. (2011) suggested that a periodic interaction between the Milky Way and a satellite galaxy may have produced our Galaxy’s spiral structure, and that other spiral galaxies have encountered similar processes. Dark matter probably will be increasingly invoked as a contributing factor in maintaining spiral structure in galaxies.
Density wave theory appears to have difficulties. This is despite widespread acceptance among astronomers, who are motivated by the need to explain the persistence of spiral structure in galaxies over billions of years. Therefore, the persistence of spiral structure probably is a good argument against the supposed long age of the universe. However, any discussion of spiral structure as an indication of recent origin ought to include at least a mention of the recognition of the winding dilemma by astronomers and their attempts to explain it. A thorough review of density wave theory would be very desirable in the creation literature.
Fast Burn Rate of Hot Stars
O and B type stars are very luminous, and so have relatively short lifetimes, mere millions of years. This is far less than the billions of years’ age supposed for the universe, so on its face, the existence of such stars would appear to be a contradiction (Slusher 1980b, 57–59; Rybka 1993, 109). Unfortunately, Slusher relied upon some out-of-date references. For instance, one reference was Struve (1955). This chapter was a reprint of an article that appeared in Scientific American in March, 1953. This was a few years prior to the development of modern ideas of stellar evolution in the late 1950s. No astronomer today thinks that O and B type stars are primordial. Rather, astronomers generally think that O and B stars formed very recently (they are classed as extreme population I stars). Faulkner (2011) and Lisle (2012) have discussed briefly O and B type stars, but within the context of critiquing ideas of star formation. It is essential that any treatment of O and B stars include discussion of the possibility of star formation by naturalistic means. Therefore, the existence of stars with very short lifetimes do not in themselves prove that the world is young.
Fast Burn Rate of Quasars
Rybka (1993, 109–110) followed his discussion of the burn rate of O and B stars with a similar treatment of quasars, applying much the same reasoning. However, he grossly underestimated the energy budget of a quasar, assuming that quasars are distant objects. For some time, the standard model for quasars has been that they are supermassive blackholes with a high rate of infalling matter to produce their tremendous power. This mechanism can power quasars for many millions, if not billions, of years. Astronomers consider quasars to be galaxies in their infancy, and, given that quasars are billions of light years away, the look-back time of their tremendous distances allow us to see quasars in their youth. Therefore, the luminosity of quasars indicate that quasars are young, but do not provide an argument for a recent origin for the universe. Therefore, this is not a good argument for recent origin.
Olbers’ Paradox
What most people call Olbers’ paradox generally is credited to Heinrich Wilhelm Olbers, who discussed it in 1823. However, there now is recognition that many other people described Olbers’ paradox prior to Oblers (Harrison 1990). Consequently, many people prefer to Olbers’ paradox the dark night-sky riddle. The first to discuss this problem was Thomas Digges in the 16th century. An early advocate of the heliocentric model, Digges went beyond Copernicus by postulating that instead of the stars being attached to a celestial sphere, stars were distributed at various distances in an infinite universe. A few decades later, Johannes Kepler took up discussion of the matter. In the 18th century, Edmund Halley and Jean-Phillipe de Chéseaus also formulated the problem. Olbers merely helped popularize this question in the 19th century. The first discussion of the proper solution of Olbers’s paradox apparently was that of Lord Kelvin in a little-noticed 1901 paper.
Olbers’ paradox stems from four basic assumptions (Faulkner 2010):
- Stars have some average size and brightness
- Stars are uniformly distributed throughout the universe
- The universe is infinite
- The universe is eternal
The first assumption, that stars have some average size and brightness is not true, but amazingly enough, with a large sample of stars, that does not matter. If the sample size is large, there will be some well-defined average. We simply can assume that average brightness and size, and the statistics work as if all stars are the same size and brightness. Nor is the second assumption, that stars are uniformly distributed in space, true, for stars are found in galaxies with vast voids between them. However, once again, if we expand the region of space that we are concerned with, the clumpiness of the universe averages out. With these two assumptions, if the universe is infinite, then everywhere we look, our view will be blocked by the surface of a star. More distant stars will appear smaller than nearer stars, but the greater volume encompassed by greater distance exactly compensates for diminishing apparent stellar diameter with more stars. Finally, if the universe is eternal, then starlight has had ample time to reach us from across the universe. Therefore, the night sky ought to be as bright as the sun. Obviously, the night sky is dark. Profoundly dark, compared to the expectation to the contrary, given the four assumptions.
General recognition of the proper resolution of Olbers’ paradox was embarrassingly late. Several solutions were proposed, such that the expansion of the universe decreased the brightness of distant stars, or that dust scattering light was responsible. However, neither of these solutions work (Faulkner 2004, 68–69). Shifting light to longer wavelengths probably does not work, because even though redshift removes energy from the visible part of the spectrum to the infrared, additional light is introduced from the ultraviolet into the visible.7 Dust scatters light into new directions, so light that is lost through scattering along the line of sight is compensated by scattered light from new directions. And even the energy it absorbs will warm the dust, so it begins to radiate, thus reintroducing the light. The accepted resolution of Olbers’ paradox lies in noting that the fourth assumption, that the universe is eternal, is false. Since the universe is not eternal, there is a limit to how far we can see. In the current big bang model, that limit is less than 14 billion light years.8 Thus, our view is not blocked by the surface of a star everywhere we look.
Why did it take so long for this resolution of Olbers’ paradox to become widely accepted? Belief in an eternal universe was the norm for a long time, going back at least to the ancient Greeks. This situation did not change until the big bang model became widely accepted in the late 1960s. The incorrect resolutions to Olbers’ paradox predate this and continued to be repeated long after belief in the big bang model, and hence a finite age to the universe, became popular (even now one occasionally encounters one of the incorrect resolutions). It is interesting that Lord Kelvin gave the first assessment of this answer more than a century ago, though it largely was ignored. Lord Kelvin was an opponent of Darwinism, and he argued against a great age for the earth demanded by evolutionists (both biological and geological) in his day. Because of his Christian faith and trust in the Bible, Lord Kelvin probably believed that the universe was not eternal, an unpopular position in his day, but the key, perhaps, in resolving Olbers’ paradox.
This widely accepted resolution to Olber’s paradox overlooks another possible resolution, questioning the third assumption. While many creationists think that the universe is finite, it is not at all clear within the big bang model whether the universe is finite or infinite. If the universe is finite, then the third assumption of Olber’s paradox is removed, and there is no paradox to resolve.
Olbers’ paradox has been mentioned a few times in the creation literature (Slusher 1974; Slusher 1980a, 21–23; Slusher 1980b, 20–22), where the argument has been that Olbers’ paradox indicates that the universe is young, as on a biblical creation timescale. However, as pointed out above, the successful resolution of Olbers’ paradox is that the universe is not eternal. Olbers’ paradox is not a problem in a non-eternal cosmology, such as the big bang model. Therefore, Olbers’ paradox is not evidence of recent origin.
Conclusion
Between this paper and my earlier paper (Faulkner 2019), I have evaluated 48 arguments for recent origin related to astronomy that biblical creationists have used. I discourage the use of those young-age indicators that do not survive scrutiny. Some young-age indicators appear to be strong, but biblical creationists must be vigilant to keep abreast of new developments that may affect even the good arguments. Other biblical creationists may disagree with some of my evaluations. I certainly encourage further discussion of the existing young-age arguments, as well as the development of new arguments for recent origin. Since many of the arguments for recent creation that I have evaluated have turned out to be poor arguments, it might cause some to despair. However, we must be vigilant to ensure that our arguments for recent creation are good. Furthermore, there remain good arguments for recent origin.
Though not directly related to the issue at hand, there is not yet a coherent creation model of astronomy. A creationary model of astronomy likely would facilitate development of new arguments for recent origin. One impediment to this development has been the question of how much of what we see in the universe today is attributable to the creation and how much may be due to physical processes since creation. Different views on this exist with the creation astronomy community. Hopeful development of a creation model of astronomy will clarify this situation.
It would be very good if similar discussions of geological, biological, and biblical arguments for recent origin were completed. Ideally, all these evaluations could be incorporated into a single volume.
References
Abt, Helmut A., and Christopher J. Corbally. 2000. “The Maximum Age Of Trapezium Systems.” Astrophysical Journal 541, no. 2 (October 1): 841–848.
Ackerman, Paul D. 1986. It’s a Young World After All: Exciting Evidences for Recent Creation. Grand Rapids, Michigan: Baker.
Ahrens, B., M. Stix, and M. Thorn. 1992. “On The Deletion Of Lithium In The Sun.” Astronomy and Astrophysics 264, no. 2: 673–678.
Akridge, Russell. 1980. “The Sun is Shrinking.” Acts & Facts 9, no. 4 (April 1).
Anonymous. 1991. “Speedy Star Sequence.” Creation Ex Nihilo 14, no. 1 (December): 7.
Armstrong, Harold. 1973. “Stellar Evolution and Missing Neutrinos.” Creation Research Society Quarterly 10, no. 2 (September): 121.
Armstrong, Harold L. 1985. “Questions Remain about the Sun’s Operation.” Creation Research Society Quarterly 22, no. 3 (December): 123.
Arp, Halton. 1966. Atlas of Peculiar Galaxies. Pasadena, California: California Institute of Technology.
Arp, H. 1987. Quasars, Redshifts and Controversies. Berkeley, California: Interstellar Media.
Arp, H. 1998. Seeing Red: Redshifts, Cosmology and Academic Science. Montreal, Quebec: Apeiron.
Bartz, Paul A. 1992. “Stars That Are Too Fast?” Letting God Create Your Day. Vol. 4, 113. St. Paul, Minnesota: Colorsong Productions.
Boardman, William W., Robert F. Koontz, and Henry M. Morris. 1973. Science and Creation. Creation-Science Research Center: San Diego, California.
Brown, Walt. 2008. In the Beginning: Compelling Evidence for Creation and the Flood. 8th ed. Phoenix, Arizona: Center for Scientific Creation.
Ceragioli, R.C. 1995. “The Debate Concerning ‘Red’ Sirius.” Journal for the History of Astronomy 26: 187–226.
Ceragioli, R.C. 1996. “Solving The Puzzle Of ‘Red’ Sirius.” Journal for the History of Astronomy 27: 93–128.
Converse, Joseph M., and Steven W. Stahler. 2010. “The Dynamical Evolution Of The Pleiades.” Monthly Notices of the Royal Astronomical Society. 405: 666–680.
Coppedge, David. 2013. “Faint Young Sun Paradox Solution Criticized.” Creation Matters 18, no. 1 (January/February): 8–9.
Davies, K. 1994. “Distribution Of Supernova Remnants In The Galaxy.” In Proceedings of the Third International Conference on Creationism. Edited by R. E. Walsh, 175–184. Pittsburgh, Pennsylvania: Creation Science Fellowship.
Davies, Keith. 1996. “Evidence For A Young Sun.” Acts & Facts 25, no. 6 (June 1).
Davies, Keith. 2007. “The Range Of Sizes Of Galactic Supernova Remnants.” Creation Research Society Quarterly 43, no. 4 (March): 242–250.
DeYoung, Donald B. 1983. “The Redshift Controversy.” In Design and Origins in Astronomy. Edited by George Mulfinger. Creation Research Society Monograph Series No. 2. Creation Research Society.
DeYoung, Donald B. 2010. Astronomy and the Bible: Questions and Answers. Winona Lake, Indiana: BMH Books.
DeYoung, Don B., and Jason Lisle. 2009. “Does Astronomy Confirm a Young Universe?” In The New Answers Book 3. Edited by Ken Ham. Green Forest, Arkansas: Master Books.
DeYoung, Don B. and David E. Rush. 1989. “Is the Sun an Age Indicator?” Creation Research Society Quarterly 26, no. 2 (September): 49–53.
Draine, Bruce T. 2011. Physics of the Interstellar and Intergalactic Medium. Princeton, New Jersey: Princeton University Press.
Eddy, J. A., and A. A. Boornazian. 1979. “Secular Decrease In The Solar Diameter, 1836–1953.” Bulletin of the American Astronomical Society 11: 437.
Faulkner, Danny. 1998. “The Young Faint Sun Paradox And The Age Of The Solar System.” Acts & Facts 27, no. 6.
Faulkner, Danny. 2001. “The Young Faint Sun Paradox And The Age Of The Solar System.” TJ 15, no. 2 (August): 3–3.
Faulkner, Danny. 2004. Universe by Design. Green Forest, Arkansas: Master Books.
Faulkner, Danny. 2010. “What Is Olbers’ Paradox?” Creation Matters 15, no. 1 (January/February): 10.
Faulkner, Danny R. 2011. “Blue Stars—Unexpected Brilliance.” Answers 6, no. 1 (January 1): 50–53. https://answersingenesis.org/astronomy/stars/blue-stars/.
Faulkner, Danny R. 2017a. “Are Old Supernova Remnants Really Missing? Re-Evaluating A Well-Known Young-Universe Argument.” Answers Research Journal 10 (October 25): 245– 258. https://answersingenesis.org/creationism/arguments-to-avoid/old-supernova-remnants-missing-argument/.
Faulkner, Danny R. 2017b. “The Case for Dark Matter.” Answers Research Journal 10 (March 22): 89–101. https://answersingenesis.org/astronomy/cosmology/case-for-dark-matter/.
Faulkner, Danny R. 2018. “The Case For Cosmological Redshifts.” Answers Research Journal 11 (March 14): 31–47. https://answersingenesis.org/astronomy/cosmology/case-cosmological-redshifts/.
Faulkner, Danny R. 2019. “An Evaluation Of Astronomical Young-Age Determination Methods I: The Solar System.” Answers Research Journal 12 (September 25): 255–274. https://answersingenesis.org/astronomy/age-of-the-universe/an-evaluation-of-astronomical-young-age-determination-methods-i-solar-system/.
Faulkner, Danny R., and Don B. DeYoung. 1991. “Toward A Creationist Astronomy.” Creation Research Society Quarterly 28, no. 3 (December): 87–92.
Faulkner, Danny R., and Ronald G. Samec. 2004. “Helioseismology—A Reply To Jonathan Henry.” Creation Research Society Quarterly 40, no. 4 (March): 210–212.
Foyle, K., H.-W. Rix, C.L. Dobbs, A.K. Leroy, and F. Walter. 2011. “Observational Evidence Against Long-Lived Spiral Arms In Galaxies.” Astrophysical Journal 735, no. 2 (July 10): 101–111.
Gnedin, Oleg Y., and Jeremiah P. Ostriker. 1997. “Destruction Of The Galactic Globular Cluster System.” Astrophysical Journal 474, no. 1: 223–255.
Hanson, James. 1981. “The Sun’s Luminosity And Age.” Creation Research Society Quarterly 18, no. 1 (June): 27–29.
Harrison, Edward. 1990. “The Dark Night-Sky Riddle, ‘Olbers’ Paradox.’” In The Galactic and Extragalactic Background Radiation. Edited by Stuart Bowyer and Christoph Leinert, 3–17. Dordrecht, Netherlands: Kluwer Academic Publishers.
Henry, Jonathan F. 2003. “Helioseismology: Implications For The Standard Model.” Creation Research Society Quarterly 40, no. 1 (June): 34–40.
Henry, Jonathan. 2004. “Reply To Questions On Helioseismology.” Creation Research Society Quarterly 40, no. 4 (March): 212–215.
Hinderliter, Hilton. 1980a. “The Inconsistent Sun: How Has It Been Behaving, And What Might It Do Next?” Creation Research Society Quarterly 17, no. 3 (December): 143–145.
Hinderliter, Hilton. 1980b. “The Shrinking Sun: A Creationist’s Prediction, Its Verification, And The Resulting Implications For Theories Of Origins.” Creation Research Society Quarterly 17, no. 1 (June): 57–59.
Hinderliter, H. 1983. “The Shrinking Sun.” In Design and Origins in Astronomy. Creation Research Society Monograph Series No. 2. Edited by George Mulfinger, 107–112. Creation Research Society.
Humphreys, D. Russell. 2005. “Evidence For A Young World.” Acts & Facts 34, no. 5 (June).
Kaitchuck, Ronald H. 1992. “How Does One Detect An Accretion Disk?” In Evolutionary Processes in Interacting Binary Stars. Edited by Y. Kondo, R.F. Sisteró, and R.S. Polidan 175–183. Dordrecht, Netherlands: Kluwer Academic Publishers.
Kaitchuck, Ronald H., R. Kent Honeycutt, and Danny R. Faulkner. 1989. “Spectroscopic And Photometric Observations of Transient Accretion Disks in U Cephei.” Astrophysical Journal 339 (April 1): 420–433.
Kalogera, Vassiliki, and Ronald F. Webbink. 1998. “Formation Of Low-Mass X-Ray Binaries. II. Common Envelope Evolution Of Primordial Binaries With Extreme Mass Ratios.” Astrophysical Journal 493, no. 1 (January): 351–367.
Kopal, Zdeněk. 1959. Close Binary Systems. New York: Wiley.
Lafèvre, Jean. 1986. “Circumstellar Shells, The Formation Of Grains, And Radiation Transfer.” In The M-Type Stars. Monograph Series on Nonthermal Phenomena in Stellar Atmospheres. Edited by Hollis R. Johnson and Francois R. Querci, 225–244. Washington, DC: NASA.
Lin, C.C., and Frank H. Shu. 1964. “On The Spiral Structure Of Disk Galaxies.” Astrophysical Journal 140 (August): 646–655.
Lisle, Jason. 2012. “Blue Stars Confirm Recent Creation.” Acts & Facts 41, no. 9 (September): 16.
Morris, Henry M. 1985. Scientific Creationism. 2nd ed. El Cajon, California: Master Books.
Mueller, M. W., and W. D. Arnett. 1976. “Propagating Star Formation And Irregular Structure In Spiral Galaxies.” Astrophysical Journal 210, part 1 (December 15): 670–678.
Newton, R. 2002. “‘Missing’ Neutrinos Found! No Longer an ‘Age’ Indicator.” TJ 16, no. 3 (December): 123–125.
Oard, Michael J. 2011. “Is The Faint Young Sun Paradox Solved?” Journal of Creation 25, no. 2 (August): 17–19.
Purcell, Chris W., James S. Bullick, Eric J. Tollerud, Miguel Rocha, and Sukanya Chakrabarti. 2011. “The Sagittarius Impact As An Architect Of Spirality And Outer Rings In The Milky Way.” Nature 477, no. 7364 (September 15): 301–303.
Rappaport, S., L. A. Nelson, C. P. Ma, and P. C. Joss. 1987. “The Evolutionary Status of 4U 1820–30.” Astrophysical Journal 322 (November 15): 842–851.
Rybka, Theodore Wesley. 1993. Geophysical and Astronomical Clocks. Irvine, California: American Writing and Publishing.
Schaefer, Bradley E. 2010. “Comprehensive Photometric Histories Of All Known Galactic Recurrent Novae.” Astrophysical Journal Supplement Series 187, no. 2 (April): 275–373.
Slusher, H. S. 1974. “Clues Regarding the Age of the Universe.” Impact 19.
Slusher, H.S. 1980a. Age of the Cosmos. ICR Technical Monograph 9. San Diego, California: Institute for Creation Research.
Slusher, H.S. 1980b. The Origin of the Universe: An Examination of the Big Bang and Steady State Cosmogonies. ICR Technical Monograph 8. Institute for Creation Research: San Diego, CA.
Snelling, Andrew A. 1997a. “Galaxy-Quasar ‘Connection’ Defies Explanation.” Creation Ex Nihilo Technical Journal 11, no. 3 (December): 254–255.
Snelling, Andrew A. 1997b. “Solar Neutrinos—The Critical Shortfall Still Elusive.” Creation Ex Nihilo Technical Journal 11, no. 3 (December): 253–254.
Snelling, Andrew A. 1998. “Another Neutrino Deficit Still a Challenge.” Creation Ex Nihilo Technical Journal 12, no. 1 (April): 11–12.
Spitzer, Lynam. 1978. Physical Processes in the Interstellar Medium. New York: John Wiley and Sons.
Steidl, Paul. M. 1979. The Earth, the Stars, and the Bible. Phillipsburg, New Jersey: Presbyterian and Reformed.
Steidl, Paul M. 1980. “Solar Neutrinos And A Young Sun.” Creation Research Society Quarterly 17, no. 1 (June): 60–64.
Steidl, Paul M. 1981. “Recent Developments About Solar Neutrinos.” Creation Research Society Quarterly 17, no. 4 (March): 233.
Strohmayer, Tod E. 2004. “Chandra Observations Of V407 Vulpeculae: Confirmation Of The Spin-Up.” Astrophysical Journal 610, no. 1 (July 20): 416–421.
Struve, O. 1955. “The Evolution of Stars.” In The New Astronomy. Edited by the editors of Scientific American, 119–126. New York: Simon and Shuster.
Tauris, T. M., and E. P. J. van den Heuvel. 2006. “Formation And Evolution Of Compact Stellar X–Ray Sources.” In Compact Stellar X-Ray Sources. Edited by Walter Lewin and Michael van der Klis. Cambridge, United Kingdom: Cambridge University Press.
West, Jon K. 1981. “A Pre-Main-Sequence Stellar Model Applied To Close Binary Star Systems.” Creation Research Society Quarterly 18, no. 1 (June): 15–21.
Whittet, D. C. B. 1999. “A Physical Interpretation Of The ‘Red Sirius’ Anomaly.” Monthly Notices of the Royal Astronomical Society 310, no. 2 (December): 355–359.
Zaritsky, Dennis, Hans-Walter Rix, and Marcia Rieke. 1993. “Inner Spiral Structure of the Galaxy M51.” Nature 364 (22 July): 313–315.
Zirker, Jack B., and Oddbjørn Engvold. 2017. “Why Is The Sun’s Corona So Hot? Why Are Prominences So Cool?” Physics Today 70, no. 8 (August): 36–43.


