
Research conducted by Answers in Genesis staff scientists or sponsored by Answers in Genesis is funded solely by supporters’ donations.
Abstract
The first evidence for dark matter came in the 1930s, yet it took astronomers four decades to come to accept the reality of dark matter. Geoffrey and Margaret Burbidge played a key role in slowing the acceptance of dark matter. Therein lies a cautionary tale for scientists, including recent creationists.
Keywords: galaxies, rotation curves, dark matter
In an earlier paper (Faulkner 2017), I described the history of our understanding of dark matter. The story began with Zwicky (1937) showing that the dynamical mass of the Coma Cluster exceeded its lighted mass by at least an order of magnitude. This was followed two years later by Babcock’s (1939) rotation curve (see fig. 1 for an example of a rotation curve) of the Andromeda Galaxy (M31) demonstrating surprisingly high orbital motion outside M31’s nuclear region, indicating that the mass distribution of M31 does not correspond to its light distribution. It was not until the 1970s that astronomers began to appreciate the anticorrelation of light and mass within galaxies, leading to the conclusion that dark matter dominates over lighted matter in the universe.
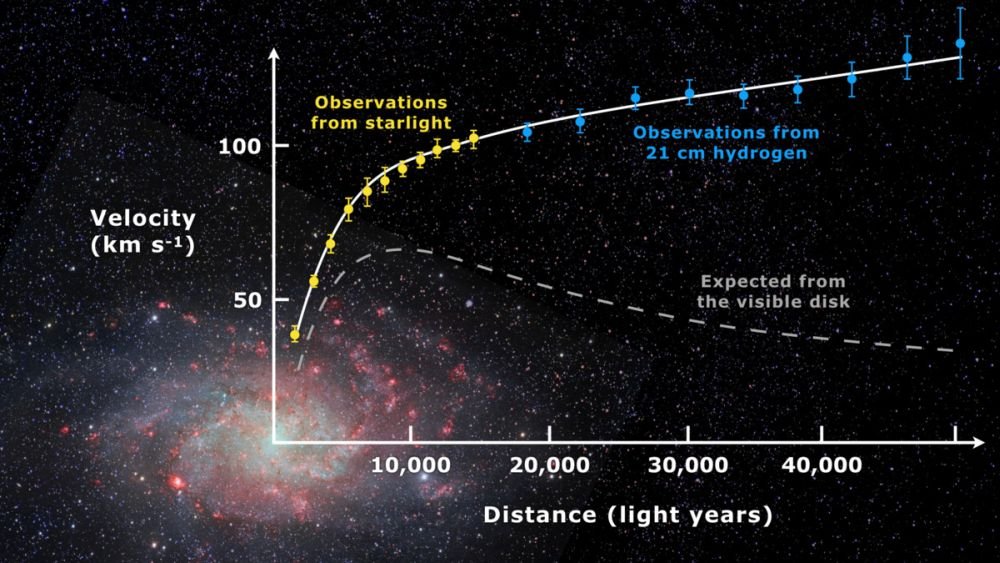
Fig. 1. A measured rotation curve of M33 superimposed upon an image of the galaxy. The origin of the rotation curve is at the galaxy’s center. The horizontal axis is distance from the galactic center, with radial velocity on the vertical axis. The dashed line is the rotation curve expected from the light distribution, assuming that light and mass are directly related. Much light is concentrated near the galactic center (the nucleus), suggesting that there is much mass in the nucleus. In the nucleus, Newtonian gravity would produce a linear relationship between velocity and distance from the center. The light rapidly decreases, indicating a steep decline in the matter distribution outside the nucleus. This distribution of matter would result in a decline in the rotation curve outside the nucleus, rapidly approaching Keplerian. Consequently, there ought to be a peak (the rollover point) in the rotation curve at the edge of the nucleus. The rollover point of the expected curve for M33 is around 9,000 light-years from the galaxy’s center. The coordinates of the rollover point allow measurement of the mass enclosed by the nucleus. However, the observed rotation curve has no turnover point. Instead, the observed velocities continue to rise outside the nucleus, though not as steeply as in the nucleus. Such curves are best explained by most of the galaxy’s mass residing far from the nucleus, where there is little light. Hence, most of the matter of the galaxy is dark. https://en.wikipedia.org/wiki/Galaxy_rotation_curve#/media/File:Rotation_curve_of_spiral_galaxy_Messier_33_(Triangulum).jpg.
In my earlier paper, I suggested several reasons why astronomers ignored the early work of Zwicky and Babcock for so long. One possibility was the intervention of the Second World War distracted attention. Another possibility was that the early work pressed the observational capabilities of the time to their limits. A third possibility was that these early results ran so contrary to expectations of the time that astronomers simply ignored them. A survey of the literature in the intervening years suggest that this third possibility probably was the most significant. It was the recent obituary of Margaret Burbidge (Ostriker and Freeman 2020), who died at age 100, that brought to my attention the key role that she and her husband Geoffrey played in the intervening years of the story of dark matter.
The Role of the Burbidges
Originally from England, Geoffrey and Margaret Burbidge immigrated to the United States in 1955 to work at Mount Wilson Observatory and Cal Tech, respectively. In 1958, the Burbidges went to The University of Chicago’s Yerkes Observatory (where Margaret had briefly worked a few years earlier) before departing to the University of California, San Diego in 1962, where they eventually retired. With Margaret as the observer and Geoffrey as the theoretician, they made quite a team.
When they arrived at Yerkes, the Burbidges immediately began collaboration with Kevin H. Prendergast, then an assistant professor at the University of Chicago, on the rotation curves of galaxies. Many of the rotation curves were measured from spectra obtained with the 82 in (2.1 m) Otto Struve Telescope of the McDonald Observatory in western Texas, which at the time was operated by the University of Chicago. Once the Burbidges moved back to California, most of their rotation curves were obtained by spectra using the 120 in (3.05 m) C. Donald Shane Telescope of Lick Observatory, run by the University of California. At the time, these were some of the largest optical telescopes in the world. Only the 200 in (5.1 m) Hale Telescope at Palomar Observatory and the 100 in (2.5 m) Hooker Telescope of Mount Wilson Observatory were larger. Through 1965, the Burbidges published a few dozen papers on the rotation curves of galaxies and their inferred masses. Thus, the Burbidges were the major force in determining the masses of galaxies between the first evidence for dark matter and the eventual acceptance of dark matter. Hence, they played a key role in slowing the acceptance of dark matter.
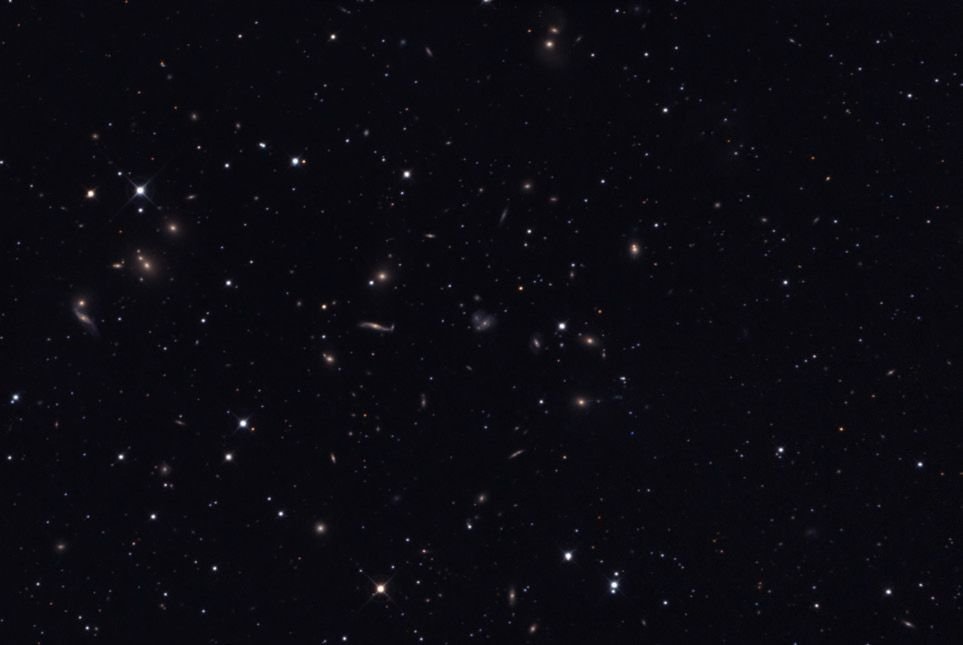
Fig. 2. The Hercules Cluster (Abell 2151). Photo courtesy of Glen Fountain.
As they began their collaboration with Prendergast, the Burbidges (Burbidge and Burbidge, 1959) first reconsidered Zwicky’s work with clusters of galaxies by studying the Hercules cluster (fig. 2). Measurements of the radial velocities of galaxies in the Hercules cluster indicated that, like the Coma cluster, the dynamic mass greatly exceeded the lighted mass. The Burbidges considered three possibilities:
- Average galactic mass is 1012 M☉
- Existence of much intergalactic matter
- The cluster is expanding
They rejected the first possibility, probably because they could not conceive average galaxy mass could be so great. They seemed to like the third possibility, perhaps because it fit well with their belief in the steady state model. With either possibility 2 or possibility 3, the Burbidges seemed to have been prepared to overlook the implication of dark matter within galaxies coming from their rotation curves. In the following section I will discuss individual galaxies that the Burbidges measured masses for over the period 1959–1965. I will do so in chronological order. I do not discuss all the relevant papers, for I have omitted ones involving elliptical galaxies and galaxies where the rotation curves were not well enough defined to determine their masses.
Masses of Individual Galaxies
The first galaxy the Burbidges determined a mass for was NGC 1068 (Burbidge, Burbidge, and Prendergast 1959a). NGC 1068 (M77) is a barred spiral Seyfert galaxy. Seyfert galaxies are spiral galaxies with bright, nearly stellar-appearing cores, with emission lines in the spectra of their cores. Seyfert galaxies are grouped with active galactic nuclei (AGN). The rotation curve in their paper had the range between 10″ and 25″.1 This avoided the innermost portion with emission lines and the fainter region outside the galaxy’s nucleus. They obtained a mass of 2.7 × 10¹⁰ M☉.2 But this mass encompasses only the innermost 25″, the nucleus of the galaxy, which extends out to perhaps 2,000 pc. The galaxy extends outward to a little more than 3.5′, or 210″. The team of the Burbidges and Prendergast assumed that the distribution of mass and light in the galaxy are correlated. Since most of the light of the galaxy emanates from its nucleus, then with this assumption it follows that most of the mass of a galaxy ought to be in the nucleus too. Therefore, the determination of the mass of the galaxy’s nucleus ought to match the galaxy’s overall mass well within a factor of two.
The Burbidges continued to make this assumption with other galaxies, though their data on some galaxies indicated that light and mass are not correlated, suggesting that the bulk of the masses of galaxies are outside of their cores. Furthermore, there already was evidence that the distributions of light and mass in galaxies are not correlated. That was the result of Babcock’s original work on the Andromeda Galaxy, M31 (fig. 3), in 1939. Three years later, Wyse and Mayall (1942) repeated and expanded upon Babcock’s research on M31, and they similarly studied the Triangulum Galaxy, M33 (fig. 4). They concluded that there is no mass concentration at the centers of either M31 or M33. Rather, for both galaxies they found an increasing mass-to-light ratio with increasing distance from the centers of galaxies. While this indicates significant dark matter outside of the nuclei of either galaxy, Wyse and Mayall did not comment on the possibility of dark matter. They did contrast their result for these two galaxies to the central concentration of matter in the Milky Way galaxy generally understood at the time and suggested that it might be in error. It is likely that the assumption that all galaxies have mass concentrated in their nuclei stemmed from this wrong conclusion about the Milky Way.
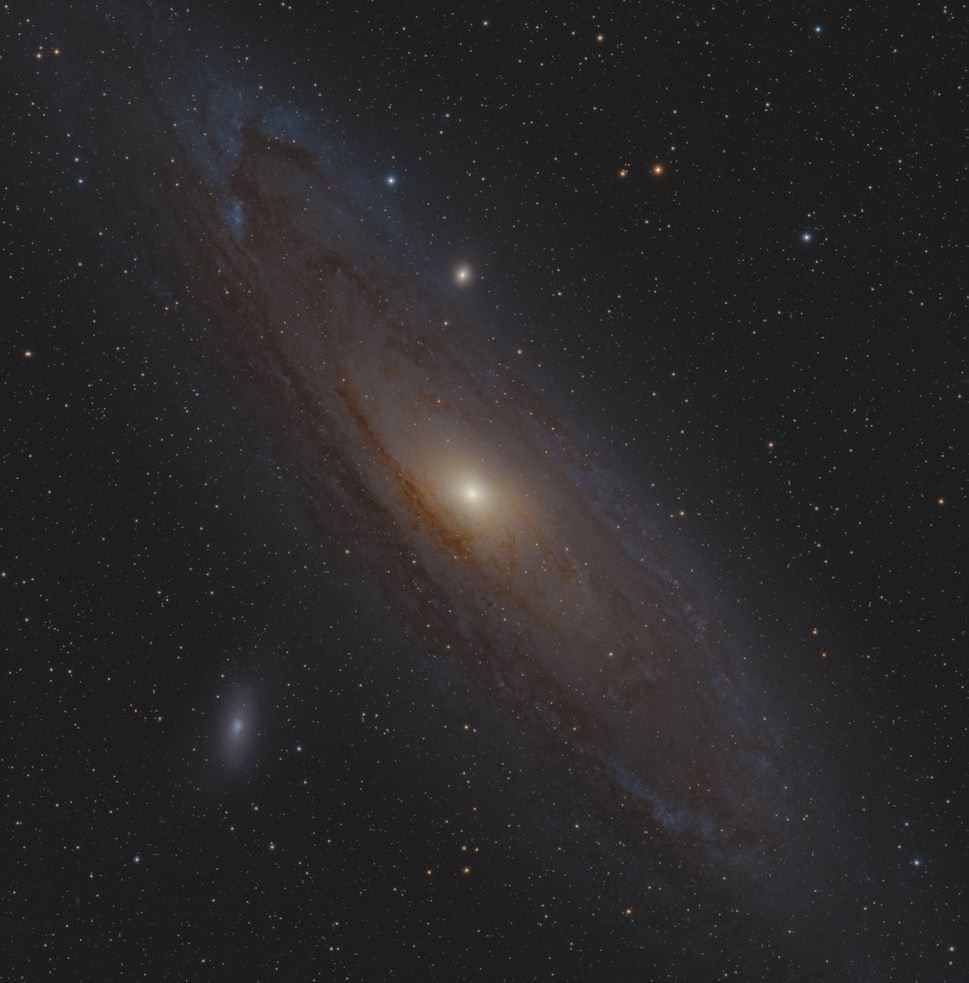
Fig. 3. M31. Photo courtesy of Jim Bonser.
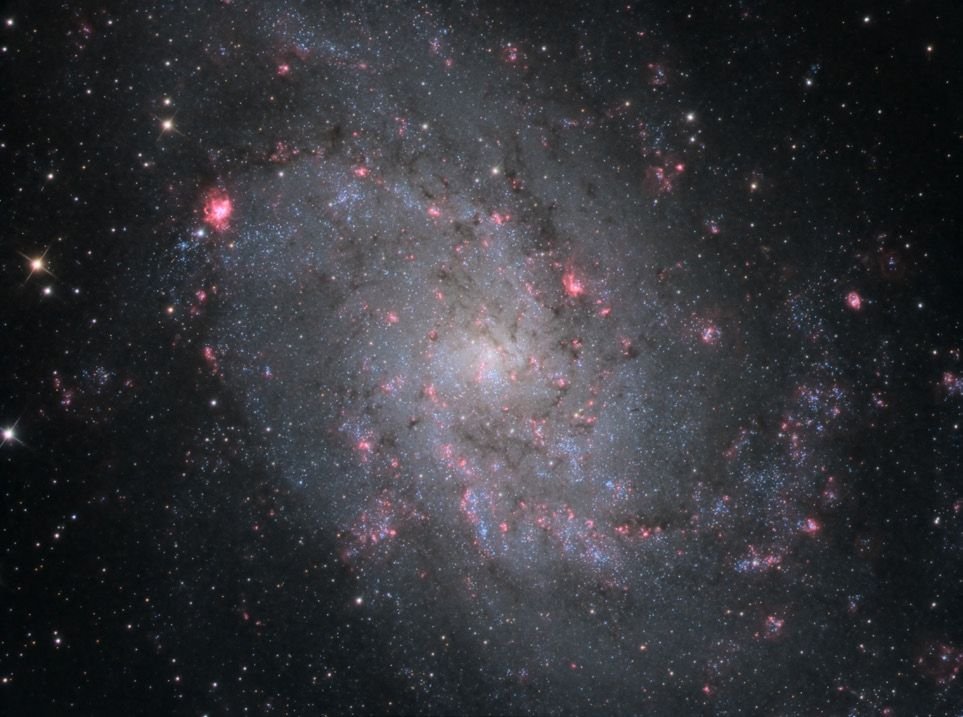
Fig. 4. M33. Photo courtesy of Glen Fountain.
The team followed up their research of NGC 1068 with a similar study of NGC 2146 (Burbidge, Burbidge, and Prendergast 1959b). NGC 2146 is a disturbed3 barred spiral galaxy. Their rotation curve extended out to 40″, a little beyond the nucleus. They wrote:
Within this radius it reaches a maximum and begins to turn over. This shows that the majority of the mass of the nebula4 is contained within this radius, i.e., the extensive spiral arms reaching a radial distance of about 150″ from the center must contribute very little mass.
It is axiomatic in physics that with a radially symmetrical distribution of matter, orbital motion is affected only by mass closer to the center than an orbiting body. Consequently, if most of the mass of a galaxy is closer to the center than orbiting bodies, then orbital motion ought to be roughly in inverse proportion to the square root of the distance. However, in the range where most of the mass is still farther from the center of motion, then orbital motion ought to increase with increasing distance. Thus, one would expect that a galaxy’s rotation curve would be linear with increasing orbital radius until reaching a turnover point, beyond which the rotation curve should approximate inverse proportionality to the square root of the distance. Hence, the turnover point ought to be the peak of a galaxy’s rotation curve. For a simple demonstration of this, see the Appendix. If a rotation curve follows this behavior beyond the turnover point, then that portion beyond the turnover point is said to be Keplerian.
Of course, in real situations rotation curves are more complicated. Nevertheless, the rotation curve of a galaxy can be modeled to act as a probe of mass density as a function of distance from the galaxy’s center. If a galaxy’s rotation curve approximates the ideal case, then the rotation curve out to the turnover point can be used to find a galaxy’s mass within a factor of two. For NGC 2146, the team assumed that the rotation curve was Keplerian beyond the turnover point, though they had no data farther out to test that assumption. They determined a mass of 1.8 × 10¹⁰ M☉.
The first rotation curve that the team obtained that should have caused them to question their assumption about most of the masses of galaxies being in their nuclei was that of NGC 5055 (Burbidge, Burbidge, and Prendergast 1960a). The computed mass of a galaxy from its rotation curve depends upon knowing the galaxy’s distance. This is because what is observed is radial velocity as a function of angular distance from the galaxy’s center, but that must be calibrated to a linear distance. Let d be the distance of a galaxy, let r be the linear distance of a point from the galaxy’s center, and let θ be the angular distance of the same point from the galaxy’s center. Using the small angle approximation, the relationship between the three variables is
where θ is expressed in radians, and r and d have the same units (usually pc). Unlike the previous two galaxies, the distance of NGC 5055 (M63) was less certain, so two masses were computed based upon two different distance estimates. For 10.3 Mpc distance, the inferred mass was 7.6 × 10¹⁰ M☉, but if the distance were 7.4 Mpc, the inferred mass was 5.5 × 10¹⁰ M☉. The paper stated that
The rotation-curve extends more than 3′ from the center and reaches well past the turnover point.
I noticed that in their adopted rotation curve (fig. 5 of Burbidge, Burbidge, and Prendergast 1960a) the portion beyond the turnover point doesn’t look Keplerian at all. What they call the turnover point is a peak with little decline past that point. Margaret Burbidge (1962, 96) produced a more extensive rotation curve for NGC 5055. That curve extends out to 210″. The curve clearly is not Keplerian beyond 90″ from the center. She made no comment about this. She (Burbidge 1962, 91) produced a rotation curve for M31 with combined optical and 21 cm observations. This curve hardly looks Keplerian beyond the turnover point either.
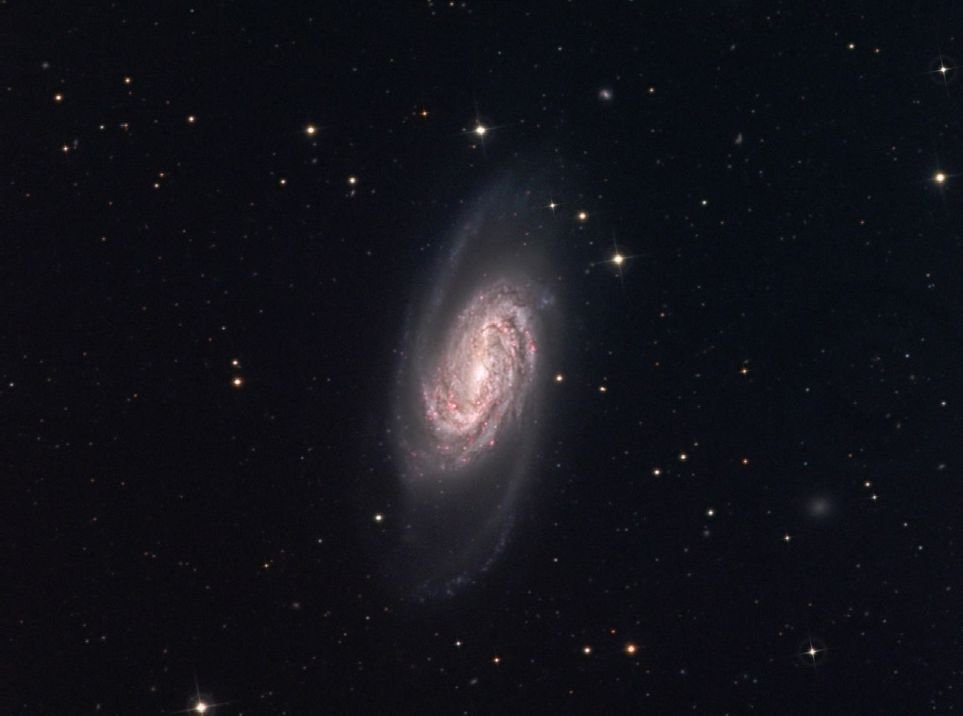
Fig. 5. NGC 2903. Photo courtesy of Glen Fountain.
Burbidge, Burbidge, and Prendergast (1960b) found that the mass of NGC 3556 (M108) is 1.1–1.7 × 10¹⁰ M☉. The uncertainty is due to scatter in the data. The rotation curve covers only the central region of NGC 108, so there was no indication whether the rotation curve is Keplerian outside the nucleus.
Because of uncertainty in its distance, Burbidge, Burbidge, and Prendergast (1960c) found two masses for NGC 2903 (fig. 5). If the distance were 6 Mpc, then the mass is 3.7 × 10¹⁰ M☉, but if the distance were 7.9 Mpc, the mass would be 4.9 × 10¹⁰ M☉. They considered the greater distance (larger mass) more probable. I note that their radial velocity curve ends around 100″ from the center, but that the galaxy extends out to 300″.
The Burbidges alone studied the barred spirals NGC 1097 and NGC 1365 (Burbidge and Burbidge 1960). They found a mass of 0.5–1.3 × 10¹⁰ M☉for NGC 1097 and 2.2–3.4 × 10¹⁰ M☉in NGC 1365. However, the rotation curves of these two galaxies span only their nuclei.
The study of the barred spiral galaxy NGC 7479 is most interesting (Burbidge, Burbidge, and Prendergast 1960d). They found the mass of the bar to be 2.2 × 10¹⁰ M☉. Some knots in the arms beyond the bar were sampled. While these data are sparse, there is a decrease in velocity of these knots with increasing distance, which is consistent with Keplerian behavior. This was at least one paper in their series that showed the possibility of Keplerian behavior beyond the turnover point of the rotation curve. However, due to the sparseness of data, one cannot say for certain that the curve is Keplerian.
On the other hand, their study of NGC 3504 (Burbidge, Burbidge, and Prendergast 1960e) was less convincing. NGC 3504 has very low inclination to the plane of the sky, meaning that very little orbital motion is projected into our line of sight, which is what the Doppler shift measures. To obtain a rotation curve of a galaxy, the measured Doppler shifts must be corrected by dividing by the sine of the inclination of the galaxy. The inclination usually is determined by how elliptical a galaxy appears in photographs. With relatively low measured Doppler velocities for galaxies with low inclination, errors of measurement are relatively large compared to the measurements, leading to greater uncertainty in the adopted rotation curves as compared to galaxies with high inclinations. Consequently, mass measurements of galaxies with low inclinations are subject to the greatest error. With these caveats, they determined a mass of 2.5–9 × 10⁹ M☉.
The rotation curve of NGC 5005 (Burbidge, Burbidge, and Prendergast 1961a) extends out to 85″ from the center and is flat beyond 40″. The authors took a different tack in determining this galaxy’s mass. Rather than using what they usually thought was the turnover point, they determined the mass from the last point measured, finding 6.95 × 10¹⁰ M☉. The galaxy’s light extends a little more than twice the distance from the center than this last point. Based upon this, the authors extrapolated the total mass to be 10.5 × 10¹⁰ M☉. It is interesting that the authors seemed to recognize that at least this galaxy’s rotation curve was not Keplerian beyond the linear behavior in its nucleus but seemed to assume that it was Keplerian beyond their last measured point. They likely reasoned that there was relatively little light emitted beyond their last point. But if they had measured the mass of the nuclear region as well as the mass encompassed at various distances between the nucleus and their last point, they would have seen clear evidence of an increasing mass to light ratio with increasing distance outside the nucleus. Why would they have expected this trend to reverse after the last point they sampled?
For NGC 3623 (M65) Burbidge, Burbidge, and Prendergast (1961b) obtained a fragmentary rotation curve, from which they determined a mass of 1.4 × 10¹¹ M☉. However, they opined that the total mass may be 2–3 × 10¹¹ M☉. Again, the total mass was based upon a consistent correlation of light and mass.
For NGC 157 Burbidge, Burbidge, and Prendergast (1961c) obtained a rotation curve that extended out about 80″ from the center. They said that the rotation curve reached past the turnover point, from which they determined a mass of 6.0 × 10¹⁰ M☉. However, when I examined their rotation curve, it was not at all clear that the curve reached the turnover point.
As with NGC 3623, Burbidge, Burbidge, and Prendergast (1962a) obtained a fragmentary rotation curve of NGC 5248. From this fragmentary rotation curve, they estimated the mass of the nucleus with an apparent diameter of 20″ to be in the range 4–5 x 10⁹ M☉. They estimated that the total mass was in the range 3–7 x 10¹⁰ M☉. Notice that the total mass is an order of magnitude greater than the mass of the nucleus. This is because NGC 5248 is an Sc galaxy, which means it has a relatively small nucleus, with most of the galaxy’s light emanating from outside the nucleus.
For NGC 253, Burbidge, Burbidge, and Prendergast (1962b) obtained a rotation curve that extended out to 290″ from the center. This is just less than half the radius of the visible distribution of matter (which extends at least to 650″). From this, the authors concluded that the mass interior to 290″ is about 5 x 10¹⁰ M☉. They also were able to measure the radial velocity of a single emission knot 400″ from the center. This yielded a mass of 2 x 10¹¹ M☉interior to 400″. Assuming the rotation velocity is that high out to the edge of the visible matter, they obtained a mass of 3.2 x 101 M☉, though they considered this is an upper limit because they expected the rotation curve would drop beyond 400″. This may be an important admission. The rotation curve does not look Keplerian at great distance from the center. This is a good example of the team having evidence of dark matter but failing to see the significance.
NGC 5383 is a barred spiral. The rotation curve Burbidge, Burbidge, and Prendergast (1962c) obtained for this galaxy extended out to the end of the bar, thus missing any contribution from its spiral arms. They determined the mass of nuclear region to be 6–7 x 10⁹ M☉. The mass interior to the end of the bar was 5 x 10¹⁰ M☉.
The rotation curve of NGC 1084 (Burbidge, Burbidge, and Prendergast 1963a) extends out to about 55″ from center. The end of the curve appears to flatten and begin to turn over. From this, the authors determined the mass to be 1.6 x 10¹⁰ M☉. The visible edge of NGC 1084 is nearly 100″ from its center, so their rotation curve extended to a little more than half the total radius. From the rotation curve, it is impossible to determine whether the behavior of the rotation curve beyond 55″ is Keplerian.
From their rotation curve of NGC 7469, Burbidge, Burbidge, and Prendergast (1963b) found that the mass interior to 3600 pc is 1.1 x 10¹⁰ M☉. However, this is about 30% of the distance from the center to the edge. The rotation curve did not extend far enough to reveal whether its behavior beyond the turnover point is Keplerian.
From their rotation curve of NGC 4258 (M106), Burbidge, Burbidge, and Prendergast (1963c) measured the mass within about 7 kpc radius from its center to be 8.2 x 10¹⁰ M☉. This is 1/3 the distance from the center to the edge and just reaches the turnover point. Assuming Keplerian behavior beyond the turnover point, they estimated the total mass is less than 15.8 x 10¹⁰ M☉. However, like with so many other galaxies, if the behavior of the rotation curve beyond the turnover point is not Keplerian, then this total mass estimate is woefully low.
Burbidge et al. (1964a) obtained a rotation curve of the dwarf Sc galaxy NGC 6503, from which they found a mass of 1.3 x 10⁹ M☉. This is the lowest mass reported by the team led by the Burbidges, but this is not remarkable since NGC 6503 is a dwarf galaxy. However, this paper is noteworthy in that it included a new coauthor, Vera Rubin. Rubin would coauthor a few more papers with the Burbidges, but she would go on in the next decade to show that rotation curves of galaxies generally do not exhibit Keplerian behavior beyond their turnover points, thus establishing the necessity of dark matter.
Burbidge et al. (1964b) obtained a rotation curve of NGC 3521, from which they determined that the mass within 170″ of its center is about 8 x 10¹⁰ M☉. One can readily see from their rotation curve that it extends past the turnover point, but the curve hardly declines or even levels off thereafter. The article noted the similarity of this galaxy to NGC 5055, which also shows a level or even rising curve beyond the turnover point. Again, this is evidence of dark matter, though the authors seemed to disregard it. Or did they? Again, Vera Rubin had now joined the team, and this may have been her first exposure to the fact that galaxy rotation curves generally don’t follow the expectation of Keplerian motion beyond the turnover point. Could this have been Rubin’s first clue that led her to show the need for dark matter just a few years later?
Rubin was lead author for the first time on a paper dealing with masses of galaxies when the team turned its attention to NGC 1792 (Rubin et al. 1964b).They found that “the total mass is very close to 1.8 x 10¹⁰ M☉.” It is easy to see from their plot that the rotation curve reaches the turnover point. Since the paper did not reveal how far out to the visible edge of the galaxy this curve extends, it is not possible to determine how much of the galaxy was included in the rotation curve.
For NGC 613 Burbidge, et al. (1964c) found that the nuclear region has a mass of 9 x 10⁹ M☉. This galaxy has a long bar. Observations at the end of the bar were anomalously high and asymmetrical, prompting discussion in the paper. But the observations for the rotation curve extend out to 80″ on one side and 100″ on the other side, while the galaxy extends out to a little more than 150″. There is no clear turnover point and hence the behavior of the rotation curve beyond the turnover point was not known.
M51 (fig. 6) is the famous Whirlpool Galaxy. Due to its low inclination, this is a difficult target for obtaining a rotation curve. Nevertheless, Burbidge and Burbidge (1964) did get a rotation curve, from which they determined a mass of 6 x 10¹⁰ M☉or less within 5.5 kpc of the center, assuming 4 Mpc distance. At this distance, 5.5 kpc works out to be 283″. M51 has a diameter of 11.2′ = 672″, so its angular radius is 336″. Thus, the rotation curve encompasses 84% of M51’s extent. As with other rather complete rotation curves, M51’s rotation curve does not show Keplerian decline past the turnover point as was expected.
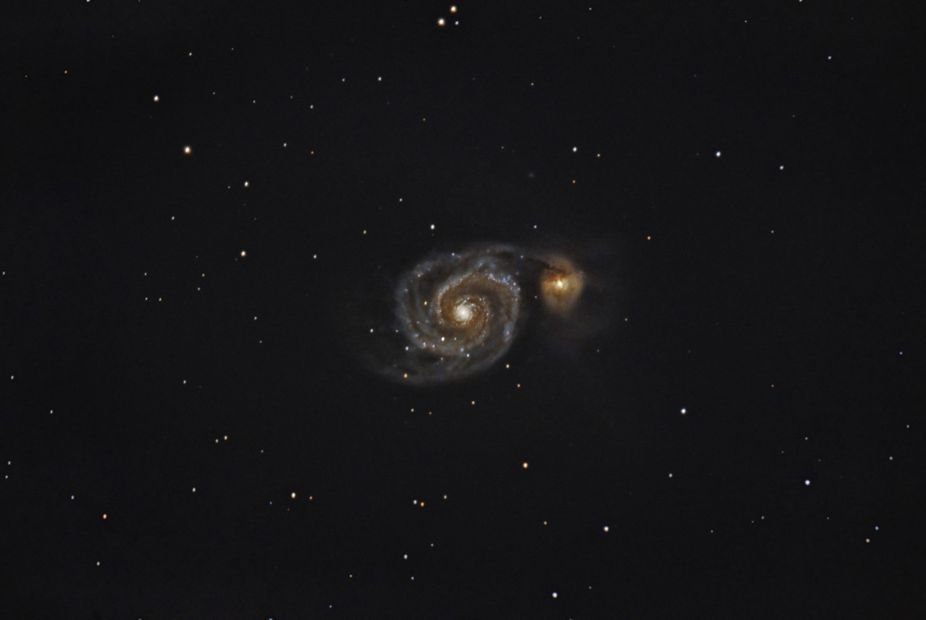
Fig. 6. M51. Photo courtesy of Jim Bonser.
For NGC 7331 Rubin et al. (1965) stated that
Out to a distance of 143″ from the center (10 kpc), the rotation-curve is generally well defined, but beyond that point (to 250″) all velocities are low.
Looking at their rotation curve, the meaning of their statement that the velocities beyond 250″ are low is not clear. The few points at great distance are lower than the peak velocities, but they hardly suggest a Keplerian decline. The authors went on to say that “The mass within 10 kpc is 8 x 10¹⁰ M☉” and that “It is shown that the total mass may be as large as 1.4 x 10¹¹ M☉.”
For NGC 4826 Rubin et al. (1965) found that “The total mass is very close to 1.8 x 10¹⁰ M☉.” The rotation curve reaches the turnover point, but the paper did not indicate how far out to the visible edge of the galaxy this curve extends.
Burbidge et al. (1965a) found that the mass of NGC 681 is 1.9 x 10¹⁰ M☉. The rotation curve extends to 40″, but the visible radius of NGC 681 extends to about 160″. Therefore, the radial velocity curve goes out only about ¼ of the way to the edge.
About NGC 6181, Burbidge et al. (1965b) said that “A rough estimate for the mass of the main body, within about 3500 pc of the center, is 4.8 x 10¹⁰ M☉.” The radial velocity curve shows non-Keplerian behavior beyond the turnover point.
From their rotation curve of NGC 972, Burbidge et al. (1965c) considered rotation out to a radius of 36″ (3860 pc with the distance to the galaxy they assumed) and found that out to this radius the mass is 8.7 x 10⁹ M☉. They made an estimate for the total mass out to a radius of 10380 pc, to which the faint outer luminosity can be detected, is 1.2 x 10¹⁰ M☉.”
Conclusion
These papers, spanning six years, provide a good survey of the state of mass determination of galaxies the decade before the reality of dark matter began to become accepted by astronomers. Given their stature, the Burbidges played a key role in retarding the acceptance of dark matter. In their obituary of Margaret, Ostriker and Freeman (2020) placed the blame upon her husband Geoffrey, the theoretician, for they wrote:
In the 1950s and 1960s, Margaret obtained optically based rotation curves for numerous local spiral galaxies. The curves were characteristically flat, the velocity not declining with radius—a result also found at radio frequencies by Morton Roberts and later in the optical regime by Vera Rubin. Oddly, in the theoretical interpretation of those results, Geoffrey fit the curves’ outer parts with a Keplerian r-1/2 dependence and made the case for dark-matter halos less obvious—but the results were there for all to see.
In 1965, the Burbidges turned their attention to quasars. Subsequently, they ceased further investigation of masses of galaxies, leaving that job to their protégé, Vera Rubin, who went on to establish the reality of dark matter. What interested the Burbidges in quasars so much? Discovered in the early 1960s, quasars have large redshifts. Assuming that their redshifts are cosmological leads to the conclusion quasars are very distant. As I have previously pointed out (Faulkner 2018), the lack of local quasars contradicts the steady state cosmology. It was Halton Arp’s support of the steady state model that caused him to make disproving quasar redshifts are cosmological his life work. Discoveries about quasars over the years have strengthened the case for their redshifts being cosmological. As a result, Arp’s reputation has suffered. The Burbidges shared Arp’s belief in the steady state model, so their work on quasars that distracted them from more productive research had similar motivation. Fortunately for them, the Burbidges’ legacy is less attached to their belief in the steady state cosmology than Arp’s is.
What blinded Geoffrey Burbidge to the evidence for dark matter at a critical time in the early 1960s? We ought not be very harsh in our assessment. He was a product of his time. Nearly all astronomers were blind to the evidence. This blindness wasn’t so much due to philosophical assumptions, such as cosmology which was the basis for rejecting cosmological redshifts of quasars. Rather, the blindness to the evidence of dark matter was more because of the simple, straightforward assumption that light and mass in galaxies are correlated. After all, more mass implies more stars, which implies greater light. Any reasonable person would find the idea that much of the matter of the universe is undetectable except via gravity is weird the first few times they encounter it. That is, Geoffrey Burbidge merely was seeing what he expected to see.
This problem of seeing what we expect is a common problem. An excellent example of this the work of Adriaan van Maanen, which I have discussed elsewhere (Faulkner 2007). A century ago, Van Maanen measured what he thought were visible rotational motion in several of the largest spiral “nebulae” (now understood to be galaxies, per discussion in footnote 3) in photographs taken a few years apart. Since galaxies are extremely far away, any change in position due to rotation over a few years is not possible, so Van Maanen’s observations were an illusion. At the time, most astronomers, including Van Maanen, thought that spiral galaxies were forming stars and solar systems within the Milky Way. If that were true, then changes in position due to rotation could have been visible over just a few years. Therefore, Van Maanen managed to find non-existent data that conformed to what he expected.
This is a common problem, and recent creationists are not immune from it. We must be vigilant that we do not ignore or minimize data that contradicts what we expect. I fear that recent creationists are making the same mistake that Geoffrey Burbidge made in ignoring the evidence for dark matter and the same mistake that Halton Arp made in rejecting the cosmological redshifts of quasars.
References
Babcock, Horace W. 1939. “The Rotation of the Andromeda Nebula.” Lick Observatory Bulletin 498: 41–51.
Burbidge, E. Margaret. 1962. “The Measurement of Rotation in Spiral, Irregular, and S0 Galaxies.” In Problems of Extra-Galactic Research. Proceedings from the IAU Symposium no. 15. Edited by George Cunliffe McVittie. International Astronomical Union Symposium no. 15, 85—104. New York, New York: Macmillan Press.
Burbidge, G. R., and E. Margaret Burbidge. 1959. “The Hercules Cluster of Nebulae.” Astrophysical Journal 130: 629–640.
Burbidge, E. M., and G. R. Burbidge. 1960. “Motions in Barred Spiral Galaxies. I. The Nuclei of NGC 1097 and NGC 1365.” Astrophysical Journal 132: 30–36.
Burbidge, E. Margaret, and G. R. Burbidge. 1964. “The Velocity Field in M51.” Astrophysical Journal 140: 1445–1461.
Burbidge, E. Margaret, G. R. Burbidge, and Kevin H. Prendergast. 1959a. “Mass Distribution and Physical Conditions in the Inner Region of NGC 1068.” Astrophysical Journal 130: 26–37.
Burbidge, E. Margaret, G. R. Burbidge, and K. H. Prendergast. 1959b. “The Rotation and Mass of NGC 2146.” Astrophysical Journal 130: 739–748.
Burbidge, E. Margaret, G. R. Burbidge, and K. H. Prendergast. 1960a. “The Rotation, Mass Distribution, and Mass of NGC 5055.” Astrophysical Journal 131: 282–292.
Burbidge, E. Margaret, G. R. Burbidge, and K. H. Prendergast. 1960b. “The Rotation and Approximate Mass of NGC 3556.” Astrophysical Journal 131: 549–552.
Burbidge, E. Margaret, G. R. Burbidge, and K. H. Prendergast. 1960c. “The Rotation Mass Distribution, and Mass of NGC 2903.” Astrophysical Journal 131: 640–653.
Burbidge, E. Margaret, G. R. Burbidge, and K. H. Prendergast. 1960d. “Motions in Barred Spiral Galaxies II. The Rotation of NGC 7479.” Astrophysical Journal 132: 654–660.
Burbidge, E. Margaret, G. R. Burbidge, and K. H. Prendergast. 1960e. “Motions in Barred Spiral Galaxies III. The Rotation and Approximate Mass of NGC 3504.” Astrophysical Journal 132: 661–666.
Burbidge, E. Margaret, G. R. Burbidge, and K. H. Prendergast. 1961a. “The Rotation and Mass of NGC 5005.” Astrophysical Journal 133: 814–820.
Burbidge, E. Margaret, G. R. Burbidge, and K. H. Prendergast. 1961b. “The Rotation and Approximate Mass of NGC 3623.” Astrophysical Journal 134: 232–236.
Burbidge, E. Margaret, G. R. Burbidge, and K. H. Prendergast. 1961c. “The Rotation and Mass of NGC 157.” Astrophysical Journal 134: 874–879.
Burbidge, E. Margaret, G. R. Burbidge, and K. H. Prendergast. 1962a. “The Rotation and Approximate Mass of NGC 5248.” Astrophysical Journal 136: 128–132.
Burbidge, E. Margaret, G. R. Burbidge, and K. H. Prendergast. 1962b. “The Rotation and Approximate Mass of NGC 253.” Astrophysical Journal 136: 339–351.
Burbidge, E. Margaret, G. R. Burbidge, and K. H. Prendergast. 1962c. “Motions in Barred Spiral Galaxies. V. The Velocity Field in NGC 5383.” Astrophysical Journal 136: 704–712.
Burbidge, E. Margaret, G. R. Burbidge, and K. H. Prendergast. 1963a. “The Rotation and Mass of NGC 1084.” Astrophysical Journal 137: 376–380.
Burbidge, E. Margaret, G. R. Burbidge, and K. H. Prendergast. 1963b. “The Rotation and Physical Conditions in the Seyfert Galaxy NGC 7469.” Astrophysical Journal 137: 1022–1032.
Burbidge, E. Margaret, G. R. Burbidge, and K. H. Prendergast. 1963c. “The Velocity Field, Rotation, and Mass of NGC 4258.” Astrophysical Journal 138: 375–384.
Burbidge, E. M., G. R. Burbidge, and K. H. Prendergast. 1965a. “Rotation and Mass of the Sa Galaxy, NGC 681.” Astrophysical Journal 142: 154–159.
Burbidge, E. M., G. R. Burbidge, and K. H. Prendergast. 1965b. “The Velocity Field in NGC 6181.” Astrophysical Journal 142: 641–648.
Burbidge, E. M., G. R. Burbidge, and K. H. Prendergast. 1965c. “The Rotation and Mass of NGC 972.” Astrophysical Journal 142: 649–654.
Burbidge, E. Margaret, G. R. Burbidge, D. J. Crampin, V. C. Rubin, and K. H. Prendergast. 1964a. “The Rotation and Mass of NGC 6503.” Astrophysical Journal 139: 539–384.
Burbidge, E. Margaret, G. R. Burbidge, D. J. Crampin, V. C. Rubin, and K. H. Prendergast. 1964b. “The Velocity Field, Rotation, and Mass of NGC 3521.” Astrophysical Journal 139: 1058–1065.
Burbidge, E. M., G. R. Burbidge, V. C. Rubin, and K. H. Prendergast. 1964c. “Motions in Barred Spirals. VI. The Rotation and Velocity Field of NGC 613.” Astrophysical Journal 140: 85–93.
Faulkner, Danny R. 2007. “What did Adrian van Maanen See? An Interesting Illustration of How Science Really Works.” Creation Matters 12, no. 1 (January/February): 1–3.
Faulkner, Danny R. 2017. “The Case for Dark Matter.” Answers Research Journal 10 (March 22): 89–101.
Faulkner, Danny R. 2018. “The Case for Cosmological Redshifts.” Answers Research Journal 11 (March 14): 31–47.
Ostriker, Jeremiah, and Kenneth Freeman. 2020. “Eleanor Margaret Burbidge.” Physics Today 73, no. 9 (1 September): 60.
Rubin, V. C., E. M. Burbidge, G. R. Burbidge, and D. J. Crampin. 1965. “The Rotation and Mass of NGC 7331.” Astrophysical Journal 141: 759–767.
Rubin, V. C., E. M. Burbidge, G. R. Burbidge, and K. H. Prendergast. 1964. “The Rotation and Mass of NGC 1792.” Astrophysical Journal 140:80–84.
Wyse, A. B., and N. U. Mayall. 1942. “Distribution of Mass in the Spiral Nebulae Messier 31 and Messier 33.” Astrophysical Journal 95 (December): 24–46.
Zwicky, F. 1937. “On the Masses of Nebulae and of Clusters of Nebulae.” Astrophysical Journal 86, no. 3 (October): 217–246.
Appendix
Spiral galaxies generally have well defined spheroidal nuclei surrounded by disks in which their spiral arms lay. In many spiral galaxies, most of their light comes from their nuclei. If light and mass are correlated, then we can compute what spiral galaxy rotation curves ought to look like. We can begin by examining the expected motion of objects orbiting outside galactic nuclei, beyond where most of the mass is.
Consider a body with small mass orbiting outside a spherically symmetrical mass distribution at a radius r from the center of the mass distribution. Under this assumption, the gravity of the mass distribution will be the same as if all its mass, m, were concentrated at its center. Hence, the gravitational acceleration, ag, of the test body will be
where G is the gravitational constant. The gravitational acceleration provides the centripetal acceleration, ac, for the test body to orbit. Centripetal acceleration is given by
where v is the orbital velocity. Equating these two equations results in
which has the function dependence v ~ 1/r1/2. This description fits the orbits of the planets very well because most of the mass in the solar system is concentrated in the sun. Consequently, the orbital speeds of the planets decrease in inverse proportion of the square root of their distances from the sun. Since this conforms to Kepler’s description of planetary orbits, this orbital behavior is called Keplerian. The planets of the solar system have very slight discrepancies from purely Keplerian motion due to gravitational interactions (perturbations) between the planets. This amounts to a violation of assuming that the planets orbit outside the mass distribution of the solar system. However, the departure from Keplerian motion is extremely small. Other violations of this simple assumption about the mass distribution are quite forgiving. If most of the mass of a galaxy is in the galaxy’s nucleus (where most of the light is), then the departure from Keplerian motion of objects orbiting outside the nucleus is minor. Furthermore, departures of the mass distribution in the nucleus from spherical symmetry are forgiving too, especially at appreciable distance from the nucleus.
What about orbital motion within the nuclei of spiral galaxies? Assume constant density, ρ, in the nucleus of a galaxy. Let m(r) be the mass enclosed by radius, r,
Now consider an object orbiting within the nucleus at distance, r, from the galactic center. Substituting this last equation into the first equation above and equating it to the second equation as I did before results in
Therefore, within galactic nuclei, we would expect there to be a linear relationship between orbital velocity and distance from the center. I derived this result assuming a constant density in the nucleus. A more realistic model would be to assume radial symmetry, with concentric shells of density that varies as a function of radius. This problem is more difficult than this simple analysis, but it results in a linear relationship between v and r too.
In blending these two solutions, a linear relationship in galactic nuclei and Keplerian motion outside the nuclei, we must realize that there is some matter distribution in the disks of galaxies. Consequently, when these two simple models are merged, there results a steep linear rise in velocity with increasing radius within galactic nuclei, followed by a transition to Keplerian motion at the edge of the mass distribution. Since the dependence of v on r initially has positive slope and the final dependence has negative slope, there must be a rollover at some point. Solving for the mass at the rollover point ought to yield a galaxy’s mass to within a factor of two.
The fact that galaxies do not exhibit true turnover points but rather have inflection points that transition to less, but still positive, slope indicates that the model is flawed. The most straightforward interpretation of rotation curves of galaxies is that most of their mass is located far from their nuclei. Since relatively little light emanates from the outer regions of galaxies, most of the mass of galaxies is dark.


.jpg)