
Research conducted by Answers in Genesis staff scientists or sponsored by Answers in Genesis is funded solely by supporters’ donations.
Abstract
Muav Formation beds are bent in the Matkatamiba fold exposed along the Colorado River in central Grand Canyon. Conventional geologists accept that this folding occurred during the Laramide orogeny at ~40–70 ma when the Colorado Plateau was uplifted. However, the Muav Formation had been deposited at 499–502 ma, so after ~450 million years it should have been fully cemented and lithified. Yet the limestone beds look as though they were bent smoothly while they were still unlithified and soft. Such a conclusion would be preposterous if there were ~450 million years between deposition of the Muav Formation and its deformation in the Matkatamiba fold. To investigate this further, Muav Formation samples were collected from the hinge and limb zones of the Matkatamiba fold, as well as samples many miles away from the fold. Macroscopic features that should be present if the Muav Formation beds in the fold had been bent via ductile deformation over millions of years are bedding plane slip, slickensides on bedding plane surfaces, thickening of hinge zones and thinning of limb zones, as well as more fracturing in the hinge zones compared to the limbs. At the microscopic scale there should be evidence of grain-boundary sliding, rotation and fracturing of grains, disruption of the calcite cement, and within many quartz grains there should be undulose extinction, deformation lamellae and deformation kink bands. Field observations are inconsistent with ductile deformation under low pressure-low temperature metamorphic conditions. While trivial localized bedding plane slip has occurred, no slickensides are found on any bedding plane surfaces. There is no thickening of beds in the hinge zones or thinning in the hinge zones. Fracturing is minimal throughout the fold and confined to within the laminae or are widely spaced, consistent with joint development due to shrinkage during dewatering. All these observed features have been replicated using damp soft sediment layers in experiments simulating compressional folding, which equates to soft-sediment deformation. None of the microscopic features expected from ductile deformation are present in any of the samples, those from the hinge and limb zones of the fold being essentially identical to those distal to the fold. There is no obvious evidence of any rotation of grains or grain boundary sliding, and there are no deformation lamellae or deformation kink bands in the quartz grains which rarely display even trivial undulose extinction, which would have been a product of their metamorphic source. The few occasional trivial fractures in most samples is consistent with sediment compaction under confining overburden pressures. Instead, the poorly sorted and scattered, angular to sub-rounded quartz and K-feldspar grains, and occasional muscovite flakes, plagioclase and glauconite grains, and brachiopod shell fragments are still in their detrital condition, “floating” in a matrix of micrite (mud-silt sized calcite particles) all lithified by calcite cement. There are no indications of the calcite cement having been disturbed since lithification of these limestone beds or of any metamorphic changes to the constituent minerals or the rock fabric. On the contrary, “injectites” in a hinge zone sample are consistent with being due to soft-sediment deformation before the limestone beds were cemented and lithified. Furthermore, SEM images clearly confirm that the calcite cement has not been disrupted since lithification in any of the samples. And even the scattered muscovite flakes are still in their detrital condition in all samples, with some having been bent or their “pages” split due to compactional loading, and no hint of any metamorphic changes due to deep burial. Thus, both the macroscopic and microscopic evidence are conclusively consistent only with soft-sediment deformation before cementation and lithification. Therefore, it is concluded that the Muav Formation had to be folded while still relatively damp, unlithified and soft soon after deposition and before cementation and lithification. Problems with radioisotope dating methods and U-Pb dates obtained for the underlying Tapeats Sandstone rule out the vast claimed ages. This can all be easily reconciled with rapid deposition of the Muav Formation early in the biblical global Flood cataclysm only ~4,350 years ago, and rapid deposition of up to ~3,300–4,500 m (~10,800–14,750 ft) of overlying sedimentary layers caused by inundation via catastrophic plate activity during the Flood year. Late or later in the Flood year, as the Farallon plate underplated the western North American plate, it caused isostatic reequilibration which likely resulted in the Late Cretaceous-Early Cenozoic Laramide uplift of the Colorado Plateau and the monocline folding in the Grand Canyon region. Because the Muav Formation beds were still relatively unlithified and soft less than a year after rapid burial, they easily responded via soft-sediment deformation to form the smooth bending in the Matkatamiba fold before the beds hardened and were cemented and lithified. Thus, nearly 500 million years of claimed geologic history can be eliminated as fictional.
Keywords: Muav Formation, Tonto Group, Matkatamiba fold, Laramide orogeny, soft-sediment deformation (SSD), ductile deformation, bedding plane slip, grain-boundary sliding, microstructures, micrite, calcite cement, dolomite, quartz, muscovite, global Flood cataclysm
Summary of Findings
- Microscopic features in Muav Formation samples within the Matkatamiba fold, whether from the hinge zones or the limbs, are no different to the distal samples in their mineral constituents and textures, being essentially still in their original detrital sedimentary condition.
- Scattered detrital muscovite flakes are wedged within the micrite, are sometimes bent around quartz, K-feldspar grains, and occasionally have frayed ends, consistent with all the limestone samples still being in their original sedimentary condition.
- There is no evidence of any grain-boundary sliding between the micrite, quartz, and the other grains, nor are there any deformation lamellae within any quartz grains, but only isolated trivial undulose extinction acquired in their metamorphic source rocks, none of which are consistent with ductile (plastic) deformation having occurred in the limestone laminae in the Matkatamiba fold, nor is there any evidence of any metamorphism due to deep burial and the deformation.
- The calcite cement is pristine with no evidence of disruption, though the bending of some muscovite flakes and the negligible tiny pore spaces are likely due to compactional loading, all indicating the cement formed after the folding, followed by patchy calcite or rare dolomite recrystallization of the micrite and cement.
- Conditions in the history of the limestone have not been different during the deformation in this fold compared to the same limestone beds distant from this fold.
- All the macroscopic features in the Matkatamiba fold, including only isolated evidence of bedding plane or flexural slippage between two laminae with no slickensides, and minor fracturing within laminae attributable to joint development during dewatering, have all been readily replicated in soft-sediment deformation experiments at laboratory scale.
- There is no macroscopic or microscopic evidence consistent with the conventional explanation that the Matkatamiba fold was produced by ductile (plastic) deformation under low pressure-low temperature metamorphic conditions over millions of years some 450 million years after deposition and cementation of the Muav Formation.
- Instead, all the macroscopic and microscopic evidence combined is only consistent with the Matkatamiba fold having been produced by soft-sediment deformation of the Muav Formation soon after deposition and before dewatering caused joint development and cementation.
Introduction
Many structures in sedimentary rock layers result from the primary depositional processes, such as graded bedding and cross-bedding (Boggs 1995). On the other hand, soft-sediment deformation or penecontemporaneous structures are so called because they develop at the time of deposition or shortly thereafter, during the early stages of the sediment’s consolidation and before full lithification. This is because the sediments need to be unsolidified or “liquid-like” for such deformation to occur (Boggs 1995).
However, other structures in sedimentary rocks are caused by deformation long after lithification and diagenesis have occurred. Rocks buried deep in the earth may be under sufficient confining pressures or stress and temperatures to undergo low-grade metamorphism and deform plastically. Prolonged, incremental strain over a long period can also cause plastic deformation. These processes are believed to be able to fold rock layers. These types of behavior are called ductile deformation, defined as the ability of a rock to accumulate strain (folding) on a mesoscopic scale. Under high enough confining pressures and accompanying elevated temperatures, rock grains may recrystallize and/or the minerals undergo metamorphism, causing new minerals such as micas to grow perpendicular to the maximum principal stress direction. Hand and thin section analysis should be able to determine if rocks experienced ductile deformation. Paleozoic rocks, including the Tonto Group of Grand Canyon, most likely were not buried deep enough to experience ductile (plastic) deformation as they were well above the brittle-ductile transition zone, which occurs at a depth of 15–20 km (~49,000–65,600 ft) at temperatures of 250–400°C (Condie 2005; Zhamaletdinov 2019). This is well below the estimated depth of ~3,300–4,500 m (~10,285–14,750 ft) to which the Tonto Group, including the Muav Formation, was likely buried (Dumitru, Duddy, and Green 1994; Peak et al. 2021; Thurston et al. 2022). Incremental strain over sustained periods of time is harder to differentiate. As noted above, it can also result in ductile deformation.
On the other hand, under some near surface conditions, rock layers may remain coherent because the grains and/or layers within them can facilitate the folding. This type of deformation is most common in near surface rocks and is a type of brittle deformation. Most near surface rock layers undergo brittle fracturing and faulting, leaving the rock’s grains fractured. Some coherent units may slide past one another along bedding planes as the rocks are folded. This helps accommodate folding through flexural slip. Tell-tale signs of this should be clearly evident in outcrops and from microscope examination of the rock fabric and the sediment grains.
There are several prominent locations in Grand Canyon where the Paleozoic sedimentary rock layers are folded, sometimes in conjunction with faulting in the underlying Precambrian basement rocks, where there are unresolved questions as to whether the folding represents soft-sediment deformation folding or later tectonic folding (ductile or brittle) well after the whole strata sequence was deposited. In most instances, the folding is usually claimed to be the result of ductile (plastic) behavior of lithified sedimentary rocks under prolonged stress due to Late Mesozoic-Early Cenozoic deformation during the Laramide orogeny, hundreds of millions of years after the whole Paleozoic strata sequence was deposited (Huntoon 2003; Karlstrom and Timmons 2012). However, the macroscopic fabric of the Tapeats Sandstone, Bright Angel Formation, and Muav Formation of the Cambrian Tonto Group involved in these folds might suggest, and seems to be more consistent with, the folding being due to soft-sediment deformation (Snelling 2023a, b, 2024). Any soft-sediment deformation should have occurred after deposition and before lithification of these sedimentary units in the Cambrian (499–508 ma) (Karlstrom et al. 2020), well before the tectonic activity associated with the Laramide orogeny that began in the terminal Mesozoic and earliest Cenozoic (~40–70 ma). This poses an apparent paradox that obviously needs resolving, and thus a focused study was designed to determine the timing and nature of this folding, beginning with a thorough investigation of the petrology of each of these rock units generally, and subsequent detailed examination of these rock units in each fold.
It has been extensively documented that lithified rocks which have suffered ductile deformation will exhibit outcrop evidence of bedding plane slip and attenuation, such as flexural slippage (Ramsay 1967). However, field examination of these folds is insufficient to determine whether they were due to such ductile behavior of the lithified rocks under much later prolonged stress or due to soft-sediment deformation soon after deposition. Detailed microscopic examination is absolutely necessary to document the character of the various lithologies, specifically, the textural relationships between the constituent grains and the timing of the formation of the cement (lithification). Tell-tale microscopic textures should be evident, such as grain boundary sliding, a preferred orientation, and recrystallization of the original detrital grains, as well as deformation lamellae and undulose extinction in those grains, and the original sedimentary cement between them should be broken, fractured, or metamorphosed. Such textural features should be absent if the folding were due to soft-sediment deformation, as the original detrital grains and the cement binding them together in the various lithologies in the folds should be essentially identical to those in the same lithologic units some distance from the folds.
Yet it appears that no previous investigators have done any thin section investigations of the Tapeats Sandstone, Bright Angel Formation, and Muav Formation to substantiate their claims of ductile deformation of these rock units in these folds other than Snelling (2021a, b, 2022a). Obviously, more detailed field and laboratory studies (especially intensive microscope examination) are needed to resolve the questions of what condition the sandstone, shale, and limestone were in when they were deformed into these folds, and how soon after deposition the deformation occurred, before or after lithification of the sandstone, shale, and limestone. Any field and laboratory study of the Tapeats Sandstone, Bright Angel Formation, and Muav Formation in the folds should also include a field and laboratory study of these rock units in other locations distant from these folds. This would enable observations and conclusions at the one location to be confirmed in the studies at the other locations, because the evidence seen in thin section examination of these rock units in these folds should be different from that in the distant sandstone, shale, and limestone samples if the folding was due to ductile behavior during deformation of the lithified sandstone, shale, and limestone in the folds. On the other hand, the microscope evidence should be essentially identical in all samples if the folding was due to soft-sediment deformation.
Therefore, on a research and sampling trip through Grand Canyon to investigate these folds with National Park Service approval, 12 samples of the Muav Formation within the Matkatamiba fold and three samples from the Muav Formation at similar stratigraphic positions within the formation at sufficient distances away from that fold were collected so as to provide comparative control samples for the subsequent detailed thin section examination (fig. 1). Snelling (2022a) reviewed extensively what is already known about the petrology of the Muav Formation and reported detailed microscope observations made on the collected samples. From the mineralogy and textures of these samples, inferences were drawn about the sand source, its transport and deposition, and the sandstone’s subsequent history. This same procedure provided the documentation that was referred to and built on in the subsequent papers on the Carbon Canyon and Monument folds, which focused on the timing of lithification (cementation) of the Tapeats Sandstone in those folds before or after the folding occurred, that is, soft-sediment deformation or ductile deformation, respectively (Snelling 2023a, b), and a similar subsequent paper on the Bright Angel Formation in the Whitmore Helipad fold with the same focus (Snelling 2024). Those papers demonstrated that folding was due to soft-sediment deformation. Now in this paper, the same issues will be similarly investigated for the overlying Muav Formation in the Matkatamiba fold to ascertain whether it is due to either ductile deformation or soft-sediment deformation.
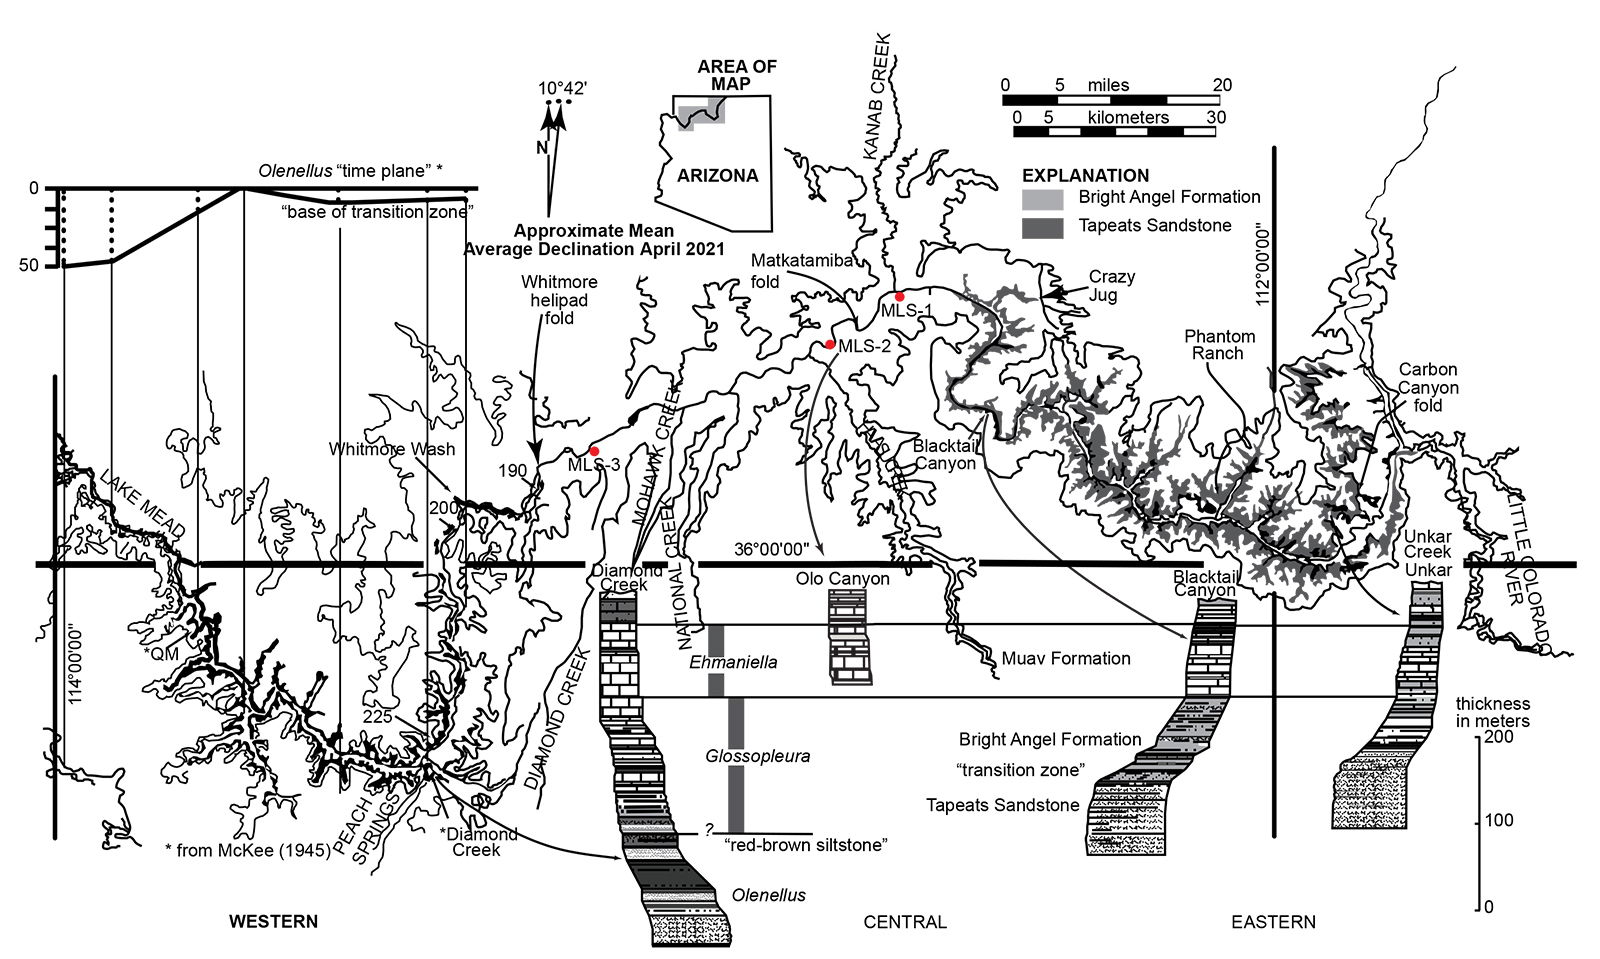
Fig. 1. Map of Grand Canyon showing the extent of exposure of the siliciclastic components of the Tonto Group, the Tapeats Sandstone, and the overlying Bright Angel Formation (after Rose, 2006, 225, fig. 1). Below the map are three representative stratigraphic sections shown in stylized profile of geomorphic expression. The inset in the upper left is the basis for the time-transgressive model proposed by McKee (1945). The datum was compiled from the reported height (in meters) at which McKee reported collecting Olenellus fossils from seven sites above the base of the “base of the transition zone” in the western Grand Canyon. Marked on the map are the locations of the Carbon Canyon, Matkatamiba and Whitmore Helipad folds, as well as the regional Muav Formation samples MLS-01 to MLS-03.
The Laramide Orogeny
The Laramide orogeny occurred in western North America during the latest Cretaceous through the Eocene (~40–70 ma) (Huntoon 2003; Karlstrom and Timmons 2012). It is named after the Laramie Mountains of eastern Wyoming and should not be confused with the Siever orogeny with which it overlaps in space and time. Conventional geologists place the Grand Canyon region near sea level from 100 to 70 ma, during which time the Sierra Nevada magmatic arc was building a series of volcanic peaks near the margin of the North American plate. The later Laramide orogeny also included widespread uplift of the Colorado Plateau, by an average of ~2 km (~6,500 ft) (Karlstrom and Timmons 2012) and a significant eastward expansion of Cordilleran deformation beyond previous limits of accretion, subduction, and magmatism. Laramide deformation was characterized by crustal shortening and northeast to eastward basement transport in a zone extending from the subduction trenches along the West Coast to the eastern limits of the Rocky Mountains (in the Black Hills). Types of deformation included east-verging thrust faulting and reverse displacements along many new and reactivated Precambrian basement faults. Faulting was accompanied by the development of monoclines and anticlines in the covering sedimentary rocks, especially in the Grand Canyon region (Huntoon 2003).
The position of the high Rocky Mountains, and the associated and intimately-related high-elevation Colorado Plateau adjacent to them, ~1,000 km (~620 mi) from the edge of the North American plate remains poorly understood. Epeirogeny (plateau building) is the uplift of regions without major tilting, folding, or thrusting of strata to build high elevation but relatively flat plateaus, which requires buoyancy of the crust on a regional scale. The plate tectonic explanation generally favored for Laramide orogenesis was a flattening of the angle of subduction of the oceanic plate known as the Farallon plate under western North America. Several hypotheses have been proposed as the cause of the flat-slab subduction—a more rapid rate of subduction, and/or the oceanic Farallon plate was thickened, and may have consisted of an oceanic plateau (Liu et al. 2010). In addition, Clarey (2020, 330–334) suggested the subducted plate under western North America contained a divergent boundary which caused flattening of the subduction angle due to its high heat and buoyancy. As a consequence of the shallow subduction angle, it has been suggested that no magmatism occurred (a magmatic gap) in part of the central west of the North American continental plate during the Paleogene (Dickinson and Snyder 1978), and the underlying oceanic lithosphere actually caused drag on the root of the overlying continental lithosphere (Jones et al. 2011). This so-called magmatic gap occurred because the subducted slab was in contact with relatively cool continental lithosphere, rather than hot asthenosphere (Dumitru et al. 1991). And another result of the shallow subduction angle and drag on the continental root was that it caused a broad belt of basement-cored mountains, some of which became the Rocky Mountains. But it is unclear how exactly this might have occurred.
Dickinson (1981, 125) summarized how this concept of flat-slab subduction of the Farallon plate under western North America would have “played out” (fig. 2):
- The belt of magmatism moved inland as the locus of melting near the top of the subducted slab shifted away from the subduction zone;
- Magma generation waned as slab descent became sub-horizontal because the slab no longer penetrated as deeply into the asthenosphere; and
- Shallower descent of the slab increased the degree of shear and the area of interaction between the descending slab and the overriding cratonic crust (fig. 2c).
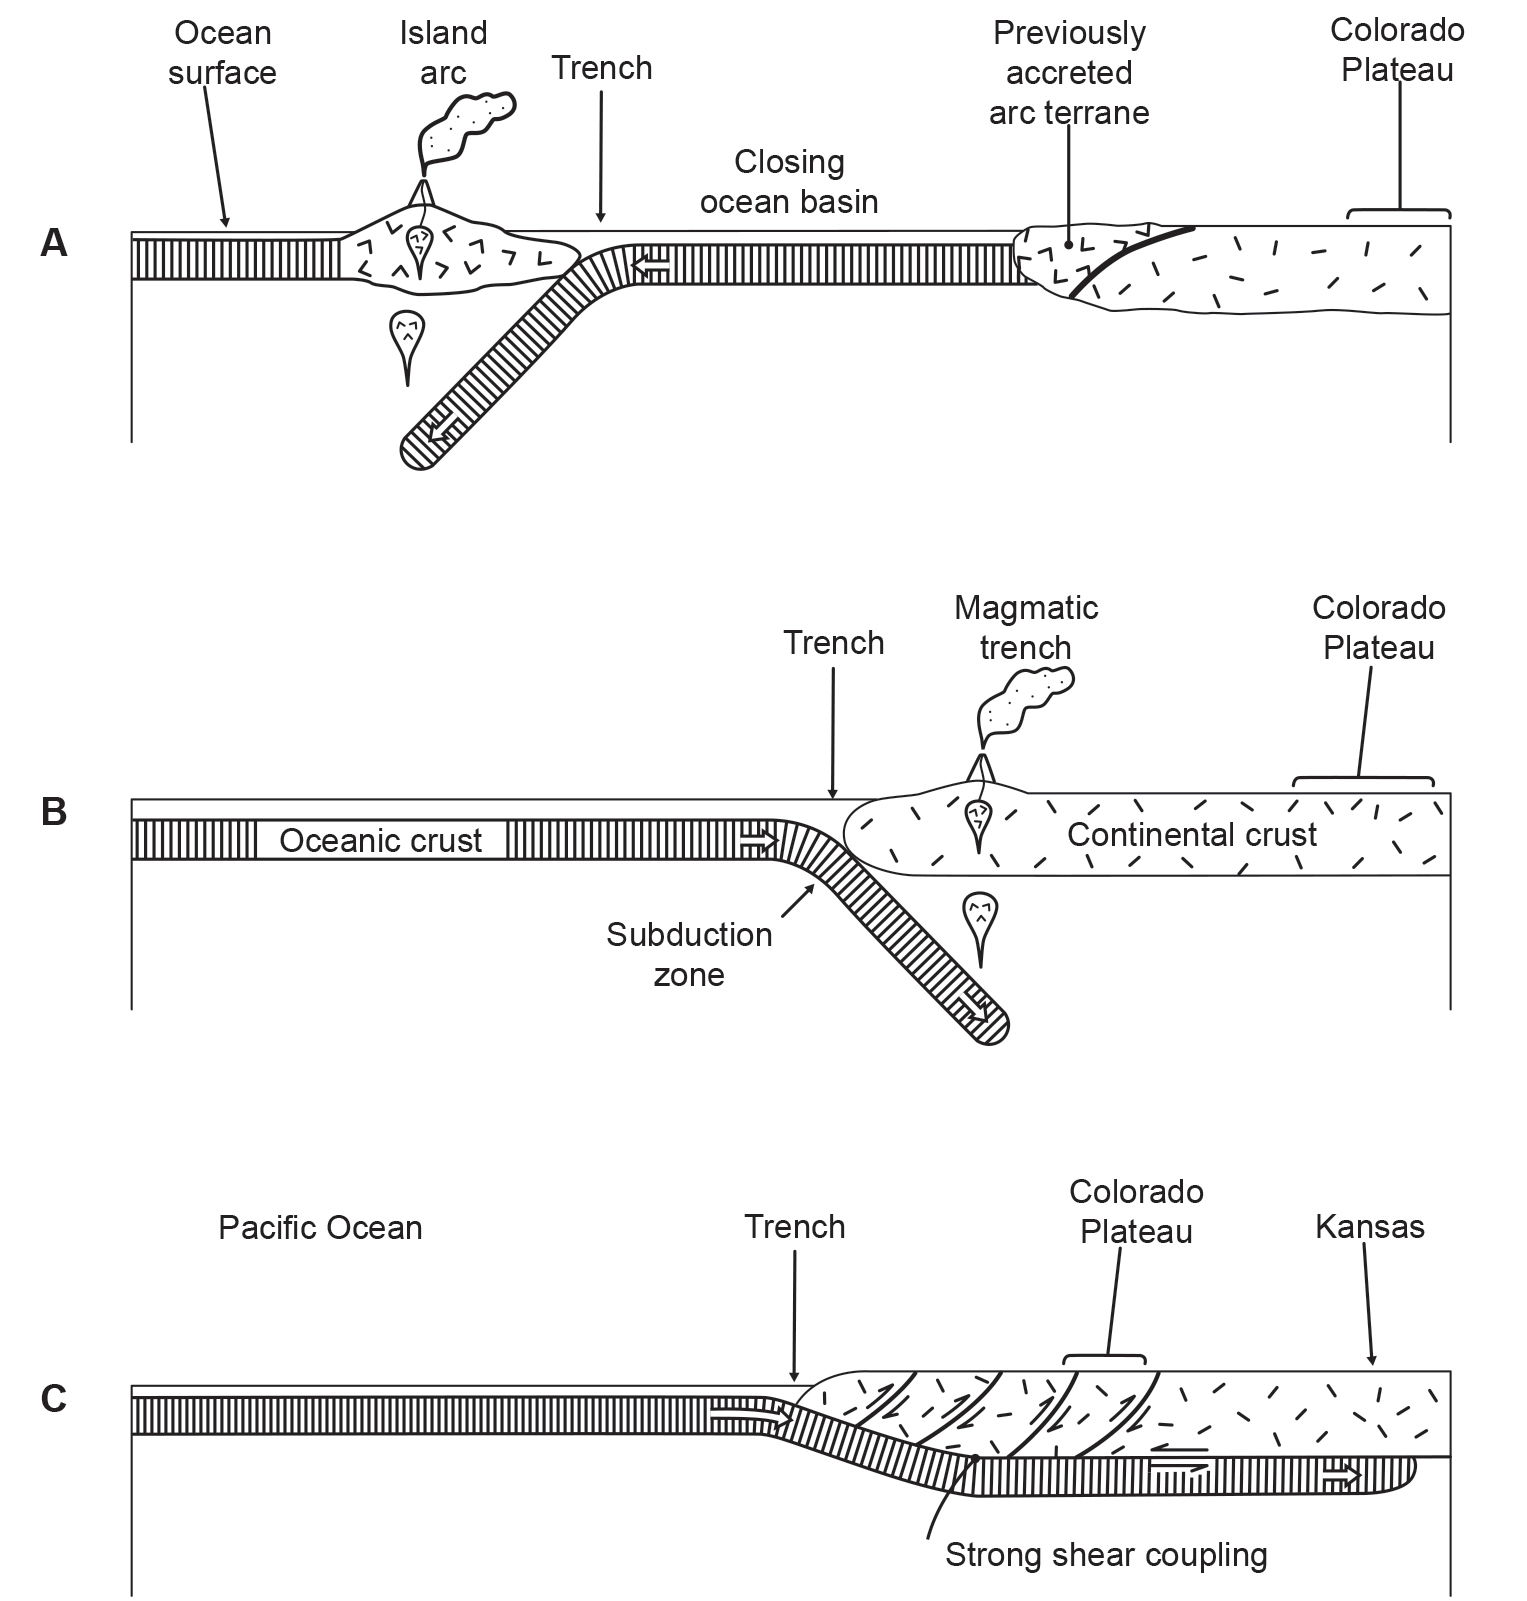
Fig. 2. Convergent margin orogens along western North America (after Dickinson 1981). Vertical scales are exaggerated. (a) Intra-oceanic arc-trench orogen active periodically in post-Precambrian through Late Triassic time. Note that the ocean basin progressively closed, causing the island arc to be accreted to the continent. Then another subduction zone and its island arc apparently formed offshore and likewise was eventually accreted to the continent. (b) Subsequent landward subduction caused development of a magmatic arc inboard on the continent above the steeply descending slab active from the Late Triassic to Late Cretaceous. (c) Then the subduction became rapid, even in the conventional timescale, resulting in shallow slab descent and slab underplating of the continent to produce buoyant uplift and strong shear-coupling with eastward telescoping of the continental crust during the Laramide orogeny.
As rapid subduction took place, the subducted hot, buoyant, oceanic Farallon plate would have under-plated North America as far east as the Great Plains, thereby contributing to the uplift of the West. The area that was to become the Colorado Plateau was apparently caught in the eastward compressing Laramide cordillera, but its exact cause is unclear.
According to conventional geologists, numerous prior major tectonic episodes during and since the Proterozoic had deformed the relatively stable Colorado Plateau region, producing a network of faults (Karlstrom and Timmons 2012). In each case, the stresses were different, and the resulting fault networks had different orientations and styles. Walcott (1890) was the first to recognize that reactivation of earlier-formed Proterozoic faults occurred during the Laramide orogeny. Due to the compressional stress regime of the Laramide orogeny, what had been normal faults in the Proterozoic became high-angle (steeply-dipping) contractional reverse faults, such that older Paleozoic rocks on the west sides of fault lines were pushed up over younger Paleozoic strata on the east sides. Hence Laramide shortening structures have been called basement-cored “thick-skinned” structures, referring to the fact that Proterozoic crystalline basement rocks were pushed upward along faults.
The Laramide orogeny thus profoundly impacted the Grand Canyon region (Huntoon 2003; Karlstrom and Timmons 2012). It caused widespread uplift, east-northeast crustal shortening, compartmentalization of the Colorado Plateau into subsidiary uplifts and basins, and widespread erosion. This resulted in the development of generally north-striking, east-dipping monoclines as the underlying basement failed along the major Proterozoic faults in response to east-northeast contraction (fig. 3). These monoclines were essentially “forced folds” of the Paleozoic strata due to the upward movement of the underlying basement blocks on high-angle normal faults forcing the overlying Paleozoic strata to bend passively into steeply dipping limbs (the monoclines) separating flat-lying beds of the upthrown blocks from the flat-lying beds of the downthrown sides. Laramide monoclinal folding in the Grand Canyon region was accompanied by mild regional warping of the intervening structural blocks, resulting in uplifts such as the Kaibab Plateau and downwarps such as the Cataract Basin (fig. 3).
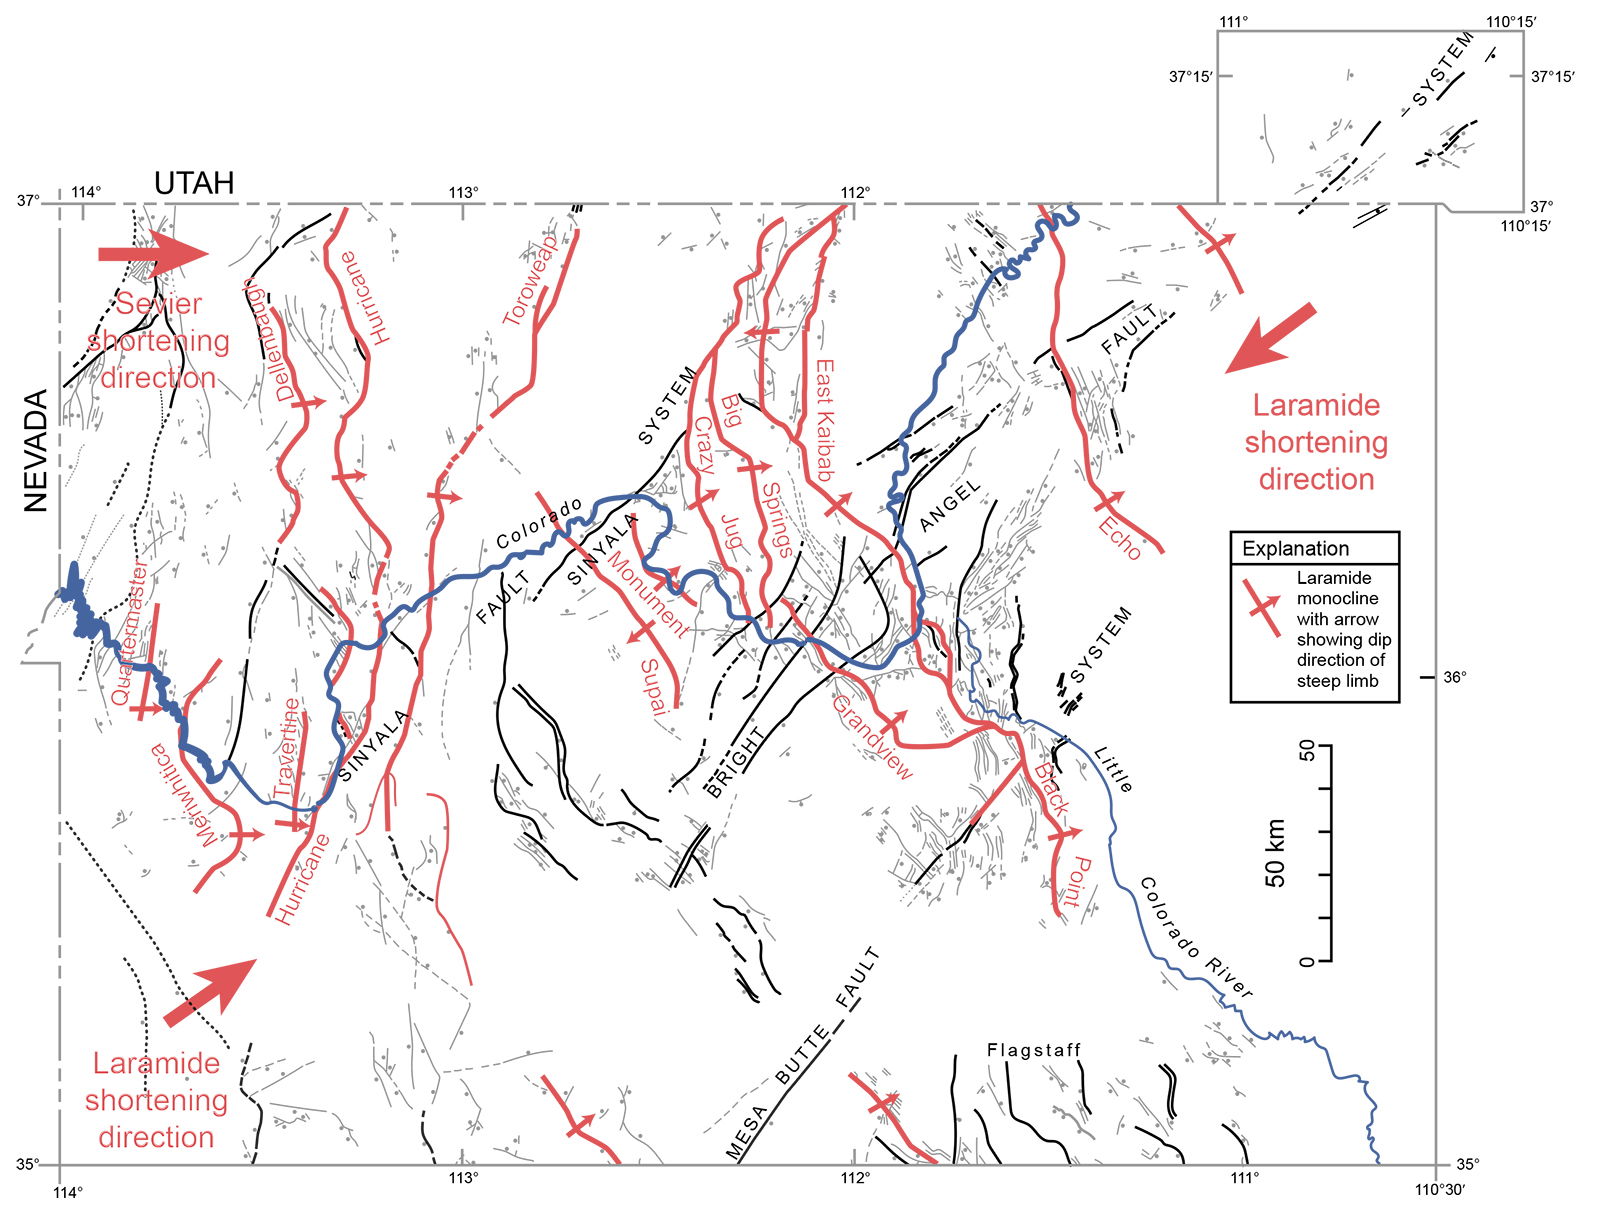
Fig. 3. Laramide compressional deformation of the Grand Canyon region that caused earlier normal faults in the Precambrian basement rocks to be inverted as a result of that reactivation into reverse faults and to be linked together into complex, segmented and bifurcating monoclinal uplifts of the Paleozoic sedimentary strata draped over them (after Karlstrom and Timmons 2012).
Massive erosion followed the uplift of the Laramide orogeny. It progressively uncovered older rocks to the south and west, including the Precambrian basement along the southwestern edge of the Colorado Plateau region. The enormous volume of detritus from Mesozoic strata eroded off of the Grand Canyon region and areas to the south was apparently transported northeastward into the intracontinental basins of Utah and beyond (Huntoon 2003).
In the Early Eocene, there was a northeastward reorientation of Laramide stresses within the Colorado Plateau region (Chapin and Cather 1983). This caused 100 km (~60 mi) of north-northeast translation of the Colorado Plateau along right-lateral, strike-slip faults that partially decoupled the Colorado Plateau from the North American continent along the future Rio Grande Rift. This Early Eocene reorganization of stresses appears to have resulted in minor development, or reactivation, of northwest-trending monoclines in the Grand Canyon region.
Grand Canyon Monoclines
Most Laramide monoclines in the Grand Canyon region formed in the Paleozoic sedimentary cover strata in response to reverse movements along favorably oriented faults in the Precambrian basement (Huntoon 2003) (fig. 4). Three lines of evidence demonstrate that most faults under the monoclines were inherited from Precambrian time:
- juxtaposition of Precambrian basement crystalline rocks having different lithologies and fracture-foliation fabrics (Karlstrom et al. 2003) that cannot be restored by removal of Laramide offsets,
- juxtaposition of the overlying Precambrian Supergroup strata that cannot be restored to pre-fault conditions by removal of Laramide offsets, and
- presence of the Early Cambrian, potentially synorogenic, Sixtymile Formation (Karlstrom et al. 2018, 2020) along the west side of the Butte fault in eastern Grand Canyon.
Total crustal shortening resulting from the deformation within the monoclines was less than 1% across the Grand Canyon region (Davis 1978). There are two reasons for this low percentage, namely, the spacings between the monoclines are large in comparison to the local shortening across them, and the dips of the underlying Precambrian faults are steep.
The maximum offset across a Grand Canyon monocline is at least 750 m (~2,500 ft) along the East Kaibab Monocline (Huntoon 2003). The longest monocline, the East Kaibab Monocline, is ~300 km (~190 mi) long. The regional trends of the monoclines in the Grand Canyon region are generally north-south, and the east-west spacings between them vary from 11 to 50 km (7 to 30 mi). They are characterized by great sinuosity but they also tend to branch in en echelon patterns (fig. 3). For example, branching is well-developed along the East Kaibab Monocline. This includes the prominent northwest-trending Phantom-Grandview branch which splays from the main fold, and the Fossil-Monument-Eremita branch which is a weakly-developed detached western extension that is segmented with intervening gaps exhibiting no discernible deformation. Such changes in the trend and the complicated branching are linked directly in outcrops on the floor of Grand Canyon to Precambrian fault patterns which have been reactivated (Huntoon 1993).
Most segments of Grand Canyon monoclines are developed in the Paleozoic section over a single, high-angle reverse fault in the Precambrian basement (Huntoon 2003) (fig. 4). Laramide displacements are along the faults, and generally produced abrupt offsets at the top of the Precambrian basement. The dips of the faults are typically between 60° and 70°, dipping to the west. In profile, the anticlinal and synclinal axial surfaces in the monoclines converge downward on, and terminate against, the underlying faults at or below the Precambrian-Cambrian contact. Consequently, the dips of the strata increase and the widths of the folds decrease with depth in the monoclines. The heights to which the faults propagated into the overlying Paleozoic strata are proportional to the offsets at the Precambrian-Cambrian contact. The displacements on the faults gradually attenuated with elevation largely through apparent ductile deformation of the Paleozoic rocks so that they rarely extend above the top of the Supai Group. Deformation in close proximity to the faults at the cores of the monoclines includes (fig. 4):
- minor horizontal shortening folds and kink bands in the footwall block,
- highly localized drag-folding adjacent to the fault surface, and
- numerous conjugate sets of minor thrust faults.
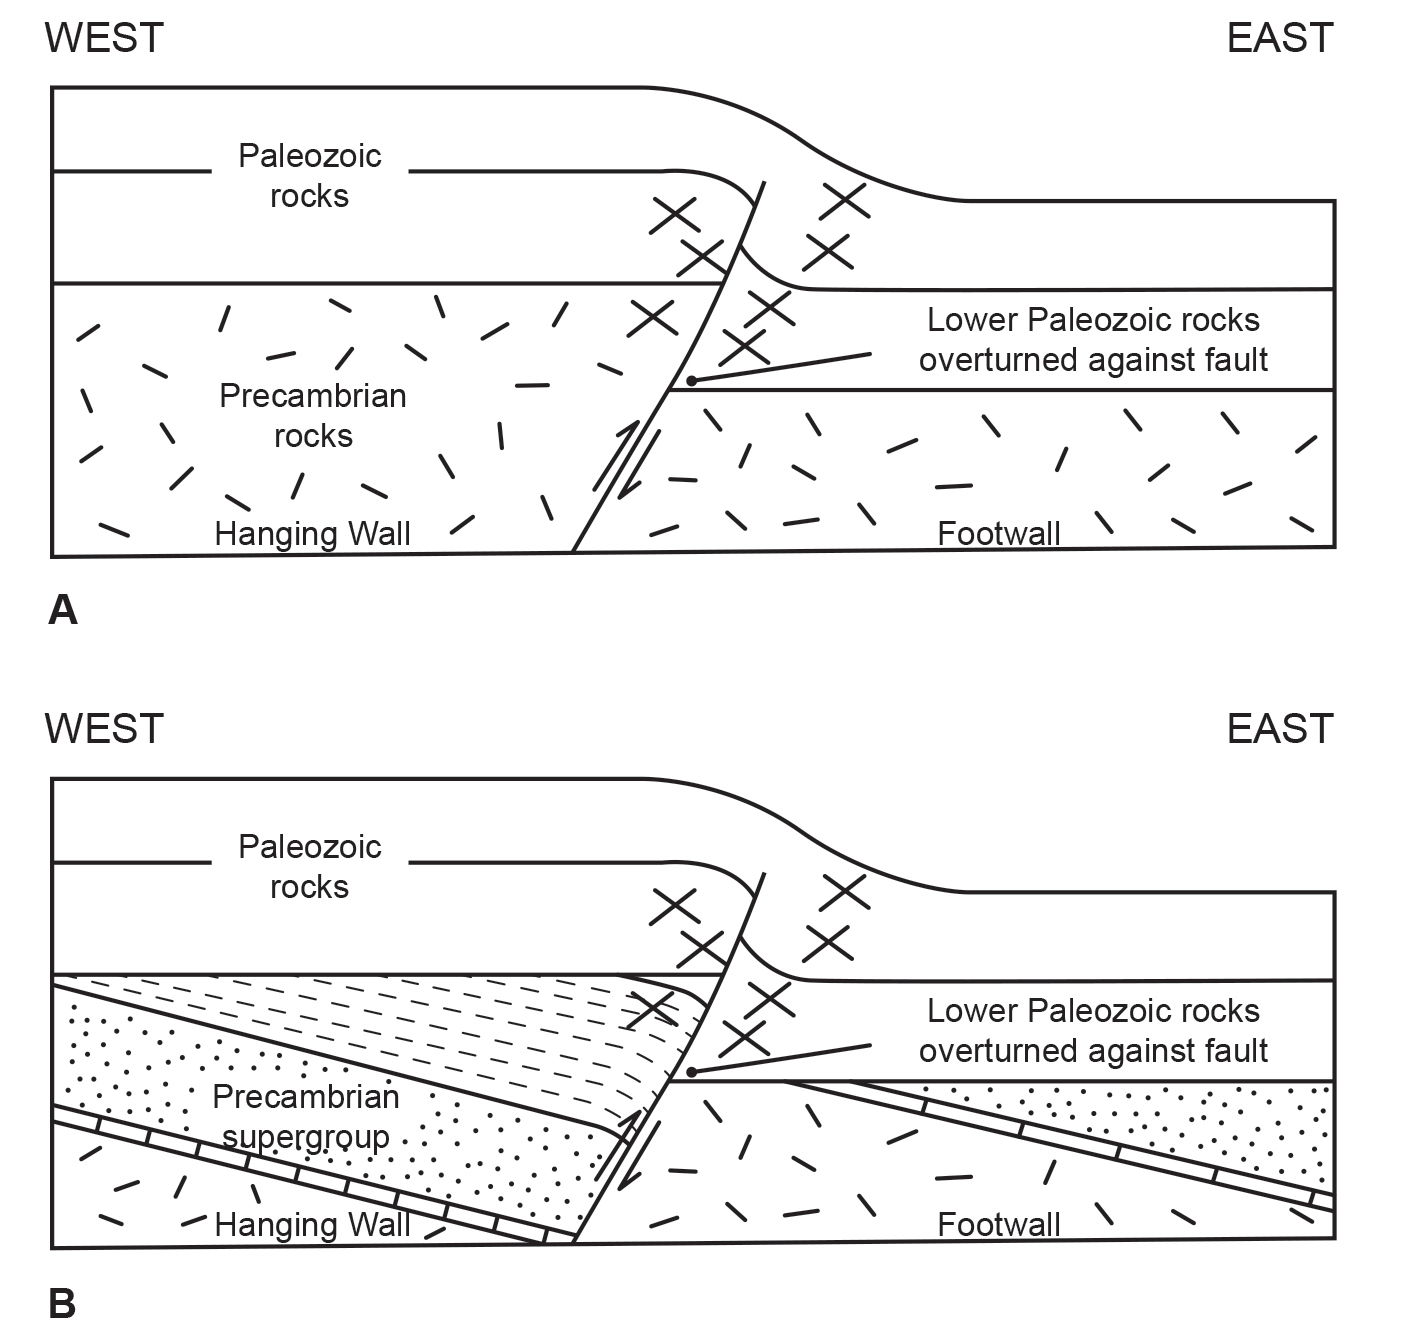
Fig. 4. Idealized composite profiles of Grand Canyon monoclines contrasting with and without the ductile Precambrian Grand Canyon Supergroup in the hanging wall of the underlying reactivated fault (after Huntoon 2003). Small crosses represent small-scale conjugate thrust faults. (a) Precambrian crystalline rocks in the hanging wall (similar to the Monument fold). (b) Precambrian sedimentary strata in the hanging wall (similar to the Carbon Canyon fold).
Shortening across a monocline at all levels is equal to the heave of the Precambrian-Cambrian contact across the underlying reverse fault (Huntoon 2003).
Where the Paleozoic rocks were deposited directly on the crystalline basement rocks, the strength of the unfaulted crystalline rocks tends to be isotropic, being the same regardless of direction prior to failure. In contrast, the Grand Canyon Supergroup sedimentary strata are highly anisotropic as a result of their bedding, especially in the Chuar Group. However, the Paleozoic beds in the monoclinal limbs can be strongly thinned owing to slip on bedding planes and braided networks of minor faults, and, with continued slip, can even be overturned and mimic the dips of the master faults (Karlstrom and Timmons 2012).
Monocline profile variations are most easily observed by the degree of folding of the Precambrian-Cambrian contact in the hanging wall block, as well as by the level within the fold where the anticlinal axial surface converges on the reactivated fault. An ideal monocline is one developed over a single reactivated fault that dips at 60° and is contained wholly within isotropic, rigid, crystalline rocks. Reactivation of the fault under the monocline produced a step-like offset at the Precambrian-Cambrian contact (fig. 4a). Both the anticlinal and synclinal axial surfaces in the overlying fold converge downward on the intersection between the Precambrian-Cambrian contact and the fault surface on the respective sides of the structure. Thus, the Precambrian-Cambrian contact remains planar, and the fold does not extend down into the Precambrian crystalline basement.
In contrast, the Precambrian-Cambrian contact in the hanging wall is folded downward toward the reactivated fault in locations where Grand Canyon Supergroup strata are preserved in the hanging wall block (fig. 4b). Dips of the contact in the hanging wall block adjacent to the fault range up to 20°. The degree of flexing and setback of the anticlinal hinge from the fault increases in proportion to the thickness of the underlying Supergroup section. This variant is a function of the considerably greater ductility of the Grand Canyon Supergroup sedimentary strata in contrast to the rigidity of the crystalline rocks. The Precambrian-Cambrian contact in the footwall block remains essentially planar until it very closely abuts the reactivated fault regardless of whether sections of the Supergroup strata are present in the footwall block. Consequently, the synclinal axial surface always converges on the intersection between the contact and the fault surface in the footwall block in the monoclines.
The stress regime responsible for the development of the monoclines involved east-northeast-oriented maximum principal stresses and vertical minimum principal stresses, typical of the Laramide orogeny (Huntoon 2003). Orientations of the maximum principal stresses have been deduced from conjugate shear fractures in both Precambrian and lower Paleozoic rocks at numerous locations along the monoclines (Huntoon 1993). According to Huntoon (2003) conjugate shears occur at all scales from microscopic (for which he provided no photomicrographs as evidence) to mesoscopic, and they appear as intersecting second-order thrust faults. In contrast to the second-order thrusts, the basement failed along steeply dipping first-order Precambrian normal faults that were already in place. These pre-existing faults accommodated Laramide strain by inverting their throw direction, becoming reverse faults. The presence of these weaknesses rendered the rocks anisotropic, which destroys the ideal relationship between the principal stress and fracture orientations predicated by Hubbert (1951). Consequently, the dips of the reactivated faults in the basement rocks do not reveal exclusive information about the Laramide stress regime.
It is difficult to establish the timing for the inception of monoclinal folding in Grand Canyon using stratigraphic evidence because the Late Cretaceous section has been eroded from the region. However, Late Cretaceous rocks containing unconformities are present in the southern high plateaus of Utah and elsewhere in the Rocky Mountains region, and these establish a Maastrichtian initiation for Laramide deformation (Anderson et al. 1975; Dickinson et al. 1987). It is assumed that the Grand Canyon region was undergoing concurrent uplift. The beveling of some Grand Canyon monoclines indicates they were developing concurrently with the regional upwarping that produced similar unconformities in Utah.
An analysis of apatite fission-track thermochronology data collected from Grand Canyon rocks led Naeser et al. (1989) to conclude Laramide uplift and monoclinal folding commenced about 60 million years ago followed by a second pulse of uplift beginning in Late Eocene time between 40 and 35 million years ago, younger than most of the Laramide deformation. Dumitru, Duddy, and Green (1994) also interpreted their apatite fission-track thermochronology data as recording two phases of cooling of Grand Canyon rocks, one during the Laramide deformation at 70 ma, and another at 50–30 ma. Flowers, Wernicke, and Farley (2008) used apatite (U-Th)/He thermochronology data to constrain the <70°C cooling history of eastern Grand Canyon as denudation occurred during and after the Late Cretaceous-Cenozoic Laramide orogeny with a more recent cooling event occurring after ~25 ma. Kelley and Karlstrom (2012) added further apatite fission-track thermochronology data for Paleozoic strata of eastern Grand Canyon and likewise concluded exhumation occurred during the Late Cretaceous (90–70 ma) part of the Laramide deformation event, followed by further exhumation at ~25–17 ma. These findings are consistent with the timing of tectonism deduced from the incomplete stratigraphic record at Grand Canyon.
The East Kaibab and Supai Monoclines
One of the largest monoclines in the Colorado Plateau is the East Kaibab Monocline, named by Powell after the Native American word “Kaibab,” which means “mountain buried below” (Reches 1978a). The East Kaibab Monocline structure is ~300 km (~190 mi) long, and is composed of flexures, folds and faults (figs. 3, and 5–7). Its exposure changes laterally from a smooth flexure to a fault to a combination of fault and flexure. It trends generally north-south from the Bryce Canyon area, Utah, to San Francisco Peaks, Arizona, but locally trends east. The maximum offset along the East Kaibab Monocline is at least 750 m (~2,500 ft), the most of any Grand Canyon monocline (Huntoon 2003), while its vertical displacement ranges up to 1,200 m (~3,935 ft) (Reches 1978a).
The East Kaibab Monocline is conspicuously sinuous like so many of the Grand Canyon monoclines, being systematically curvilinear as a composite of north-northwest- and north-northeast-trending segments (Davis 1978). Branching is also well-developed along the East Kaibab Monocline, with the prominent Phantom-Grandview branch and the weakly-developed detached Fossil-Monument-Eremita branch that is segmented with intervening gaps exhibiting no discernible deformation (fig. 3) (Huntoon 2003).
The Colorado River, Grand Canyon and their tributaries or side canyons cut through the East Kaibab Monocline and provide three-dimensional exposures for about 30 km (~19 mi) along the structure (Reches 1978a). The Butte Fault is intermittently exposed beneath the flexure for about 18 km (~11 mi), providing opportunities to study the fault-fold relations also. Fig. 7 depicts the geologic history of the Butte Fault that underlies the East Kaibab Monocline. West of Lava Chuar Hill, the East Kaibab Monocline splits into two branches, one of which continues southward, and the second of which trends southeastward into Palisades Creek (fig. 3). About 4 km (~2.5 mi) of the first branch appears as the Butte Fault in Precambrian units. Some remnants of the overlying Paleozoic strata indicate that this segment of the Butte Fault was not active after Precambrian time (Walcott 1890, 56). The second branch is now known as the Palisades Fault because it lies along Palisades Creek, where one can observe the transition from fault to continuous flexure in the Paleozoic strata. The two branches of the East Kaibab Monocline rejoin southeast of Desert View (fig. 3).
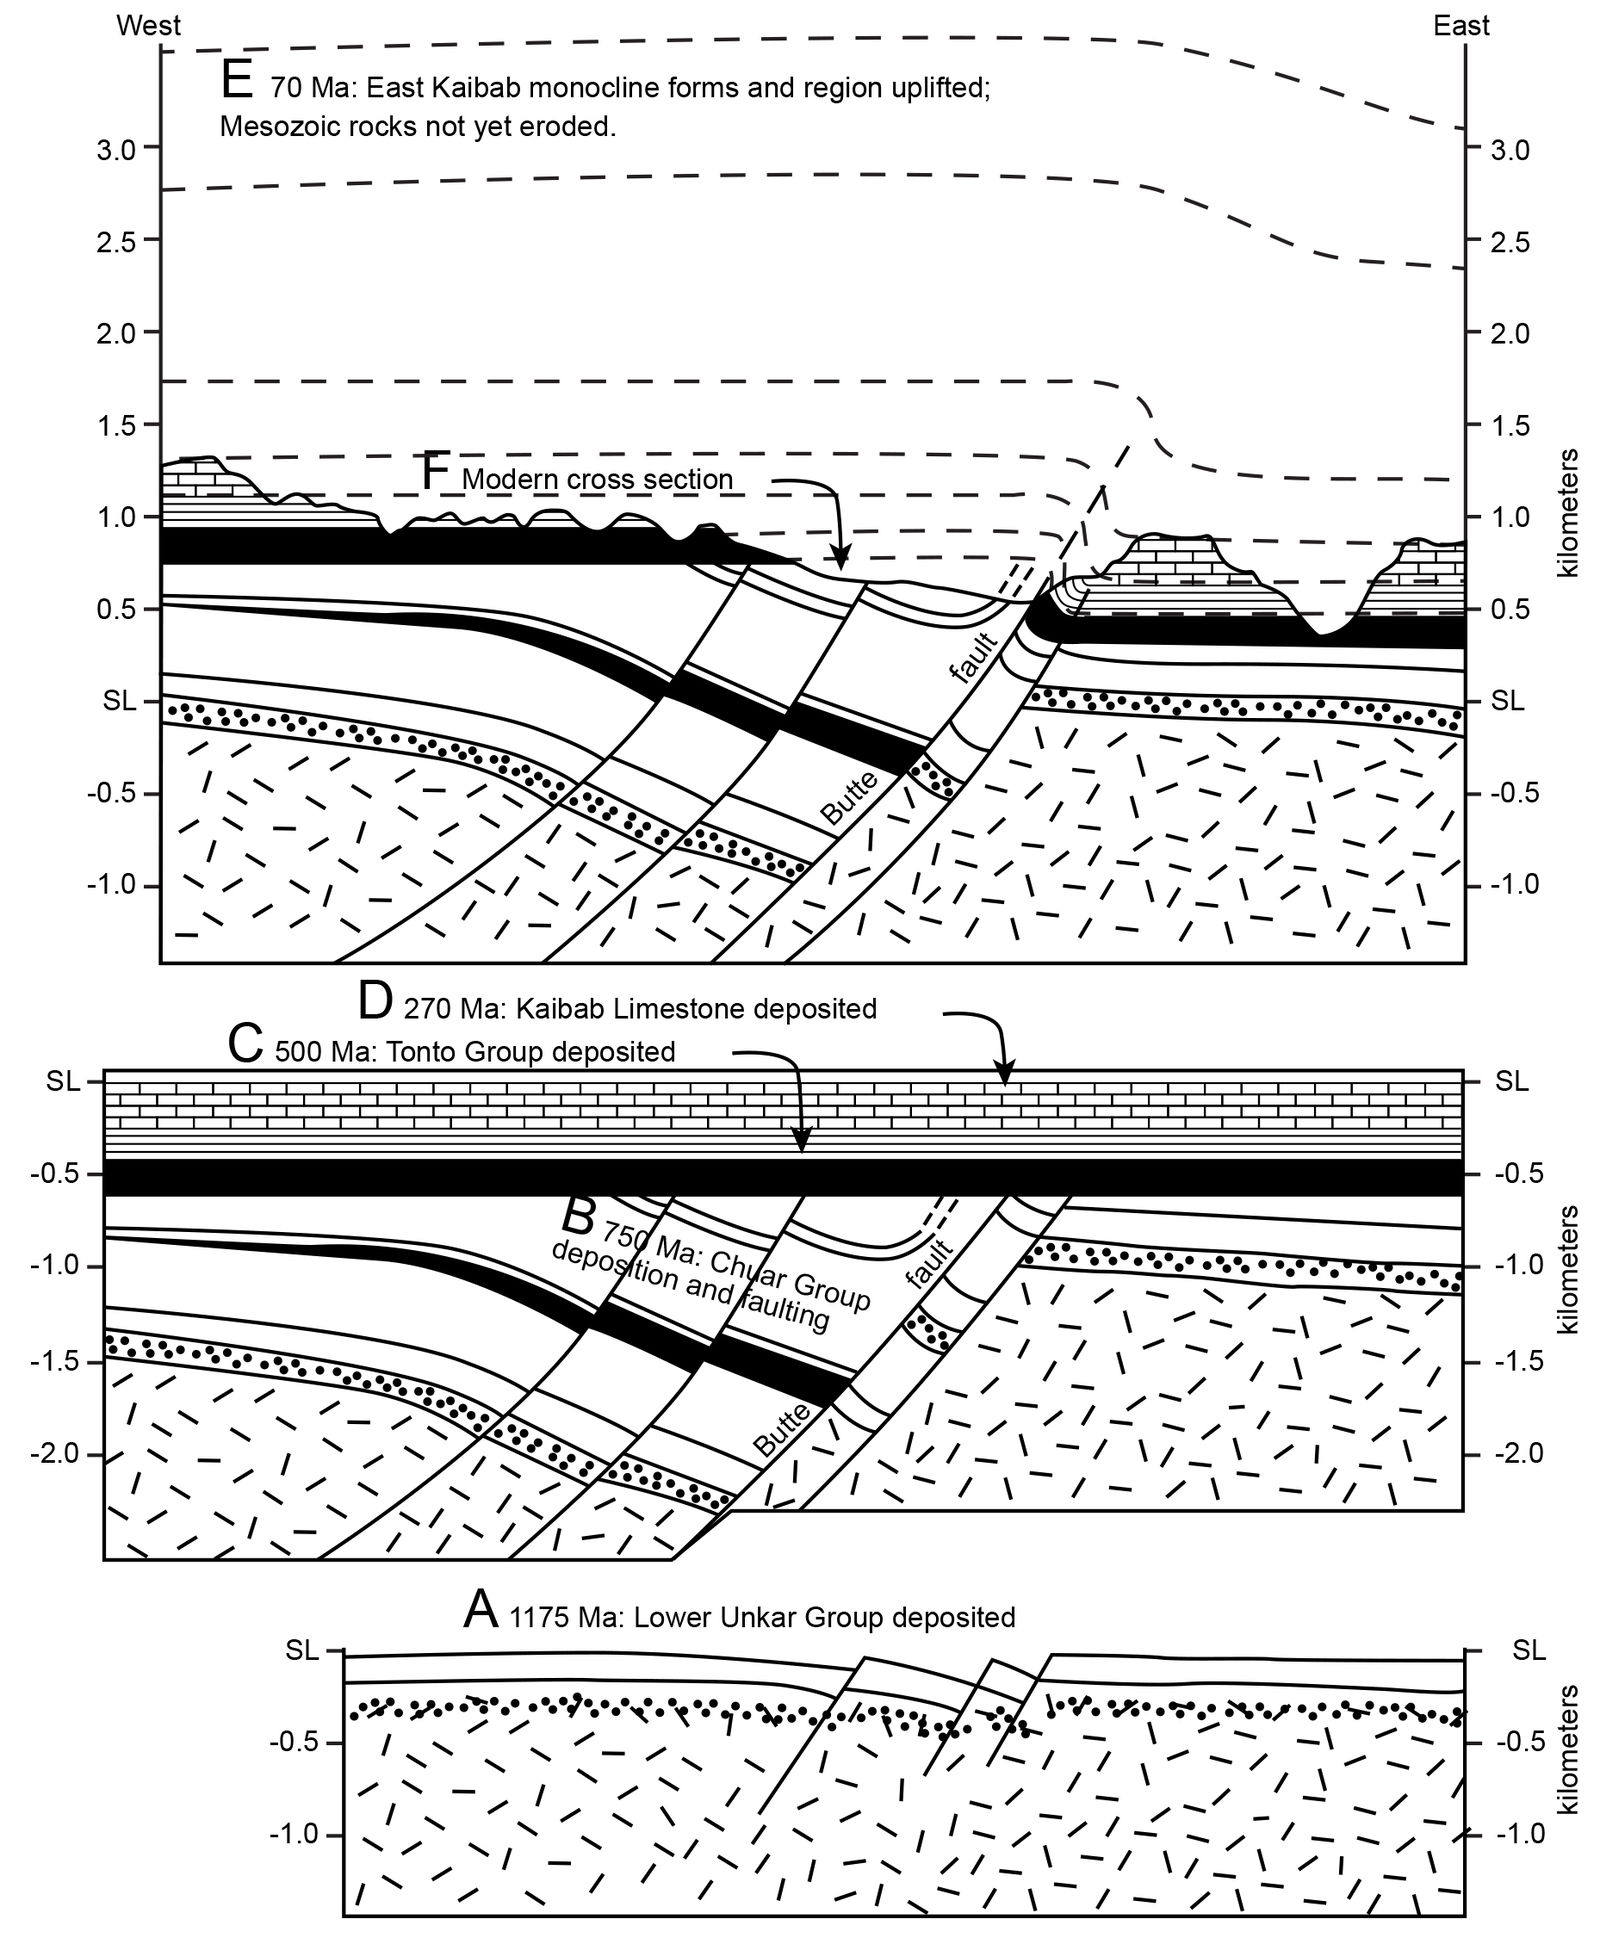
Fig. 7. The history of the Butte Fault, eastern Grand Canyon, illustrating the fault reactivation that produced the Carbon Canyon and other related folds along its length (after Karlstrom and Timmons 2012). (a) Between 1200 and 1100 Ma, lower Unkar Group sedimentary strata (dot pattern) were deposited and tilted owing to normal faulting of them and the underlying Paleoproterozoic crystalline basement rocks on northwest-striking faults like the Palisades Fault, a branch of the Butte Fault. (b) By 742 Ma, Chuar Group sedimentary strata had been deposited, folded, and faulted owing to west-side-down movement on the Butte Fault. (c) Deposition of the Cambrian Tonto Group sedimentary strata (black band) took place by 500 Ma on top of the Great Unconformity over the tilted Grand Canyon Supergroup strata. (d) The region remained near sea level throughout the deposition of the Paleozoic strata, ending c. 270 Ma with deposition of the Kaibab Limestone (brick pattern). (e) By 70 Ma, the region was compressed and uplifted, and the Butte Fault was reactivated with west-side-up slip to create the East Kaibab Monocline, with the ~ 2 km (~6,560 ft) of Mesozoic strata that once covered the region (dashed lines). (f) Present topographic profile shows the west-side-down net displacement of the Proterozoic rocks of the Butte Fault, but west-side-up displacement of the Paleozoic strata.
The thicknesses of the Cambrian through Pennsylvanian strata (Tapeats Sandstone through the Supai Group) between the anticlinal and synclinal axial surfaces in the East Kaibab Monocline are attenuated between 30 and 60% (Huntoon 2003), that is, the strata thin in the limbs. This contrasts with comparatively gentle dips of less than 15° with virtually no attenuation at the level of the Permian strata (Hermit through Kaibab Formations). Those Permian strata occupying the anticlinal hinge are rarely thinned by brittle failure in the form of downward propagating grabens because of space-compensating horizontal shortening across the monocline. The Precambrian-Paleozoic contact in the footwall block to the east of the East Kaibab Monocline is broadly flexed for the ~5–8 km (~3–5 mi) in the area immediately north of Grand Canyon. The flexing adds ~300 m (~1,000 ft) of structural relief to the fold where it is best developed (fig. 7). Furthermore, the Precambrian-Paleozoic contact in the hanging wall is folded down toward the reactivated, west-dipping Precambrian Butte Fault, with dips up to 20° adjacent to the fault, in locations where the Grand Canyon Supergroup strata are preserved in the hanging wall block.
Reches (1978a) used a variety of stress indicators to determine that the average orientation of the maximum principal stress was N76°E along the Palisades segment of the East Kaibab Monocline. His analysis used stress orientations deduced from the Paleozoic strata from calcite twinning, minor faults, kink bands, and minor folds.
Davis and Tindall (1996) deduced that there had been a component of right-lateral strike-slip motion along the Precambrian basement fault underlying the northern part of the East Kaibab Monocline. Their findings were based on the orientations and motions along minor faults in the Cretaceous strata within the fold. They estimated that lateral slip was as much as three times the vertical offset at that location, consistent with the motion expected along a reactivated basement fault that was not oriented perpendicular to the minimum principal stress.
The history of tectonic activity along the East Kaibab Monocline was outlined by Walcott (1890) in a study on the eastern Grand Canyon. According to Walcott, movement along the trend of the East Kaibab Monocline began in the Grand Canyon region as a Precambrian fault, downthrowing older, “Algonkian” strata on the west from 15 to 1500 m (~ 49 to ~4920 ft). During the late Paleozoic, the sense of displacement on the Precambrian basement fault reversed and an eastward-facing monoclinal fold was formed, displacing strata a few tens of meters. The same sense of movement resumed during the Cenozoic, producing the East Kaibab Monocline and the accompanying faults. The net displacement aggregated more than 900 m (~2,950 ft) in the vicinity of Grand Canyon.
In contrast, there have been no published investigations of the Supai Monocline, and the accompanying Matkatamiba Syncline that is related to the Matkatamiba fold, except for the mapping of them (Billingsley 2000) (fig. 9). The Supai Monocline and Matkatamiba Syncline are a weakly-developed fold system detached from other Kaibab Plateau monoclines in Grand Canyon (fig. 3). They parallel the East Kaibab Monocline and its branches to the west, but with intervening gaps exhibiting no discernible deformation (Huntoon 2003). Changes in the trends of the monoclines and the complicated branching are linked directly in outcrops on the floor of Grand Canyon to Precambrian fault patterns demonstrating they were reactivated during the Laramide orogeny (Huntoon 1993).
The East Kaibab Monocline marks the eastern boundary of the Kaibab Plateau in eastern Grand Canyon, whereas the Supai Monocline and Matkatamiba Syncline are within the Kaibab Plateau in central Grand Canyon, about 50 km (~31 miles) to the west (fig. 3). The Supai Monocline, like most other segments of Grand Canyon monoclines, appears to have developed in the Phanerozoic strata over a segmented system of high angle reverse faults in the underlying Precambrian crystalline basement (Huntoon 2003; Karlstrom et al. 2003) (figs. 4a and 9). Like the Butte Fault underlying the East Kaibab Monocline, the fault underlying the Supai Monocline sits not only within the Precambrian crystalline basement but penetrates the overlying Phanerozoic strata, as depicted in fig. 10. The vertical displacement on the fault system is only about 6 m (~20 ft) at its southern end, but about 45.5 m (~149 ft) at its northern end (Billingsley 2000), very much less than the 1,200 m (~3,935 ft) maximum vertical displacement of the Butte Fault. However, in the Matkatamiba Syncline the Phanerozoic strata are simply folded (fig. 8).
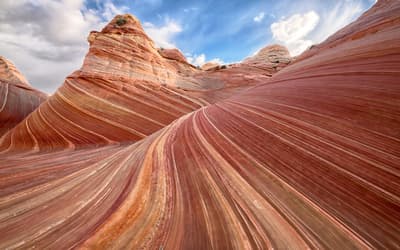
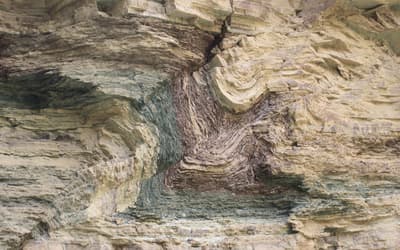
Fig. 8. The Matkatamiba fold in which beds of the Muav Formation have been folded (bent) twice monoclinally, as can be seen in the vertical cliff forming the northern wall above the stepped slope of layers along the Colorado River at river mile 148.8 within Grand Canyon. The scale of this fold is evident from the man standing beside the upper limb. The change in color of the Muav Formation marks the boundary between the Gateway Canyon Member (lower pale buff color) and the overlying Havasu Member (reddish).
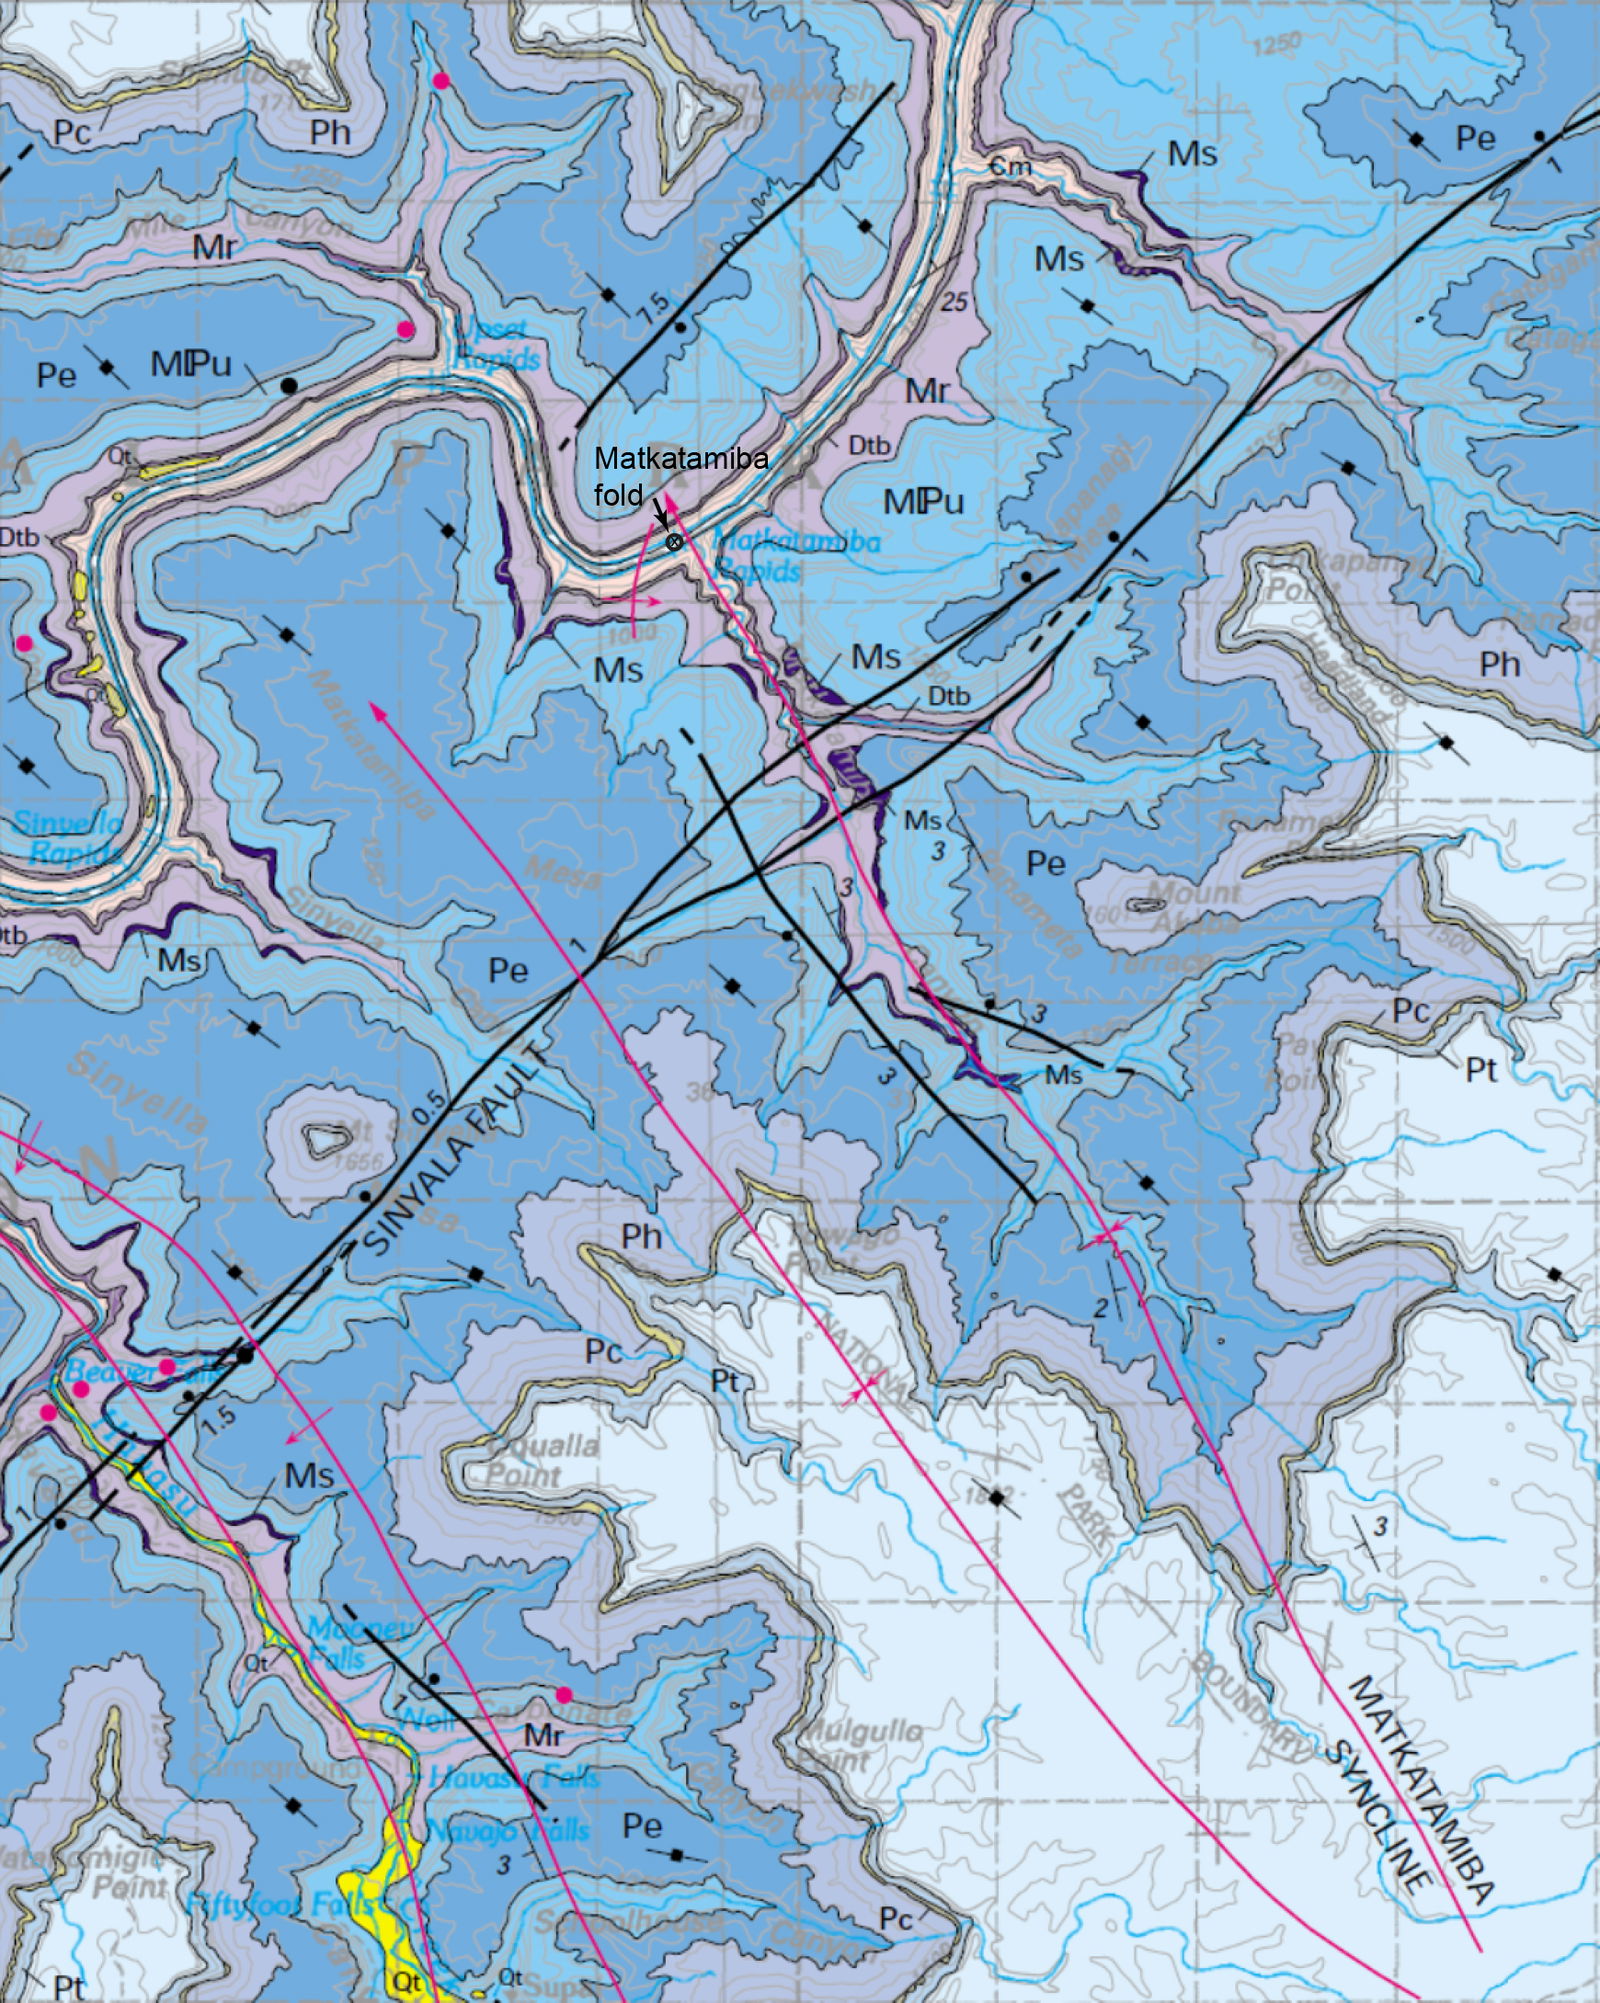
Fig. 9. Geologic map of the Matkatamiba fold area in the central Grand Canyon (from Billingsley 2000), showing the Matkatamiba Syncline (marked by the red oblique line with the arrow indicating the direction of the synclinal folding), which crosses the Colorado River near the Matkatamiba Rapids. Adjacent to it is the local flexure responsible for the monoclinal Matkatamiba fold. The location of the Matkatamiba fold is marked.
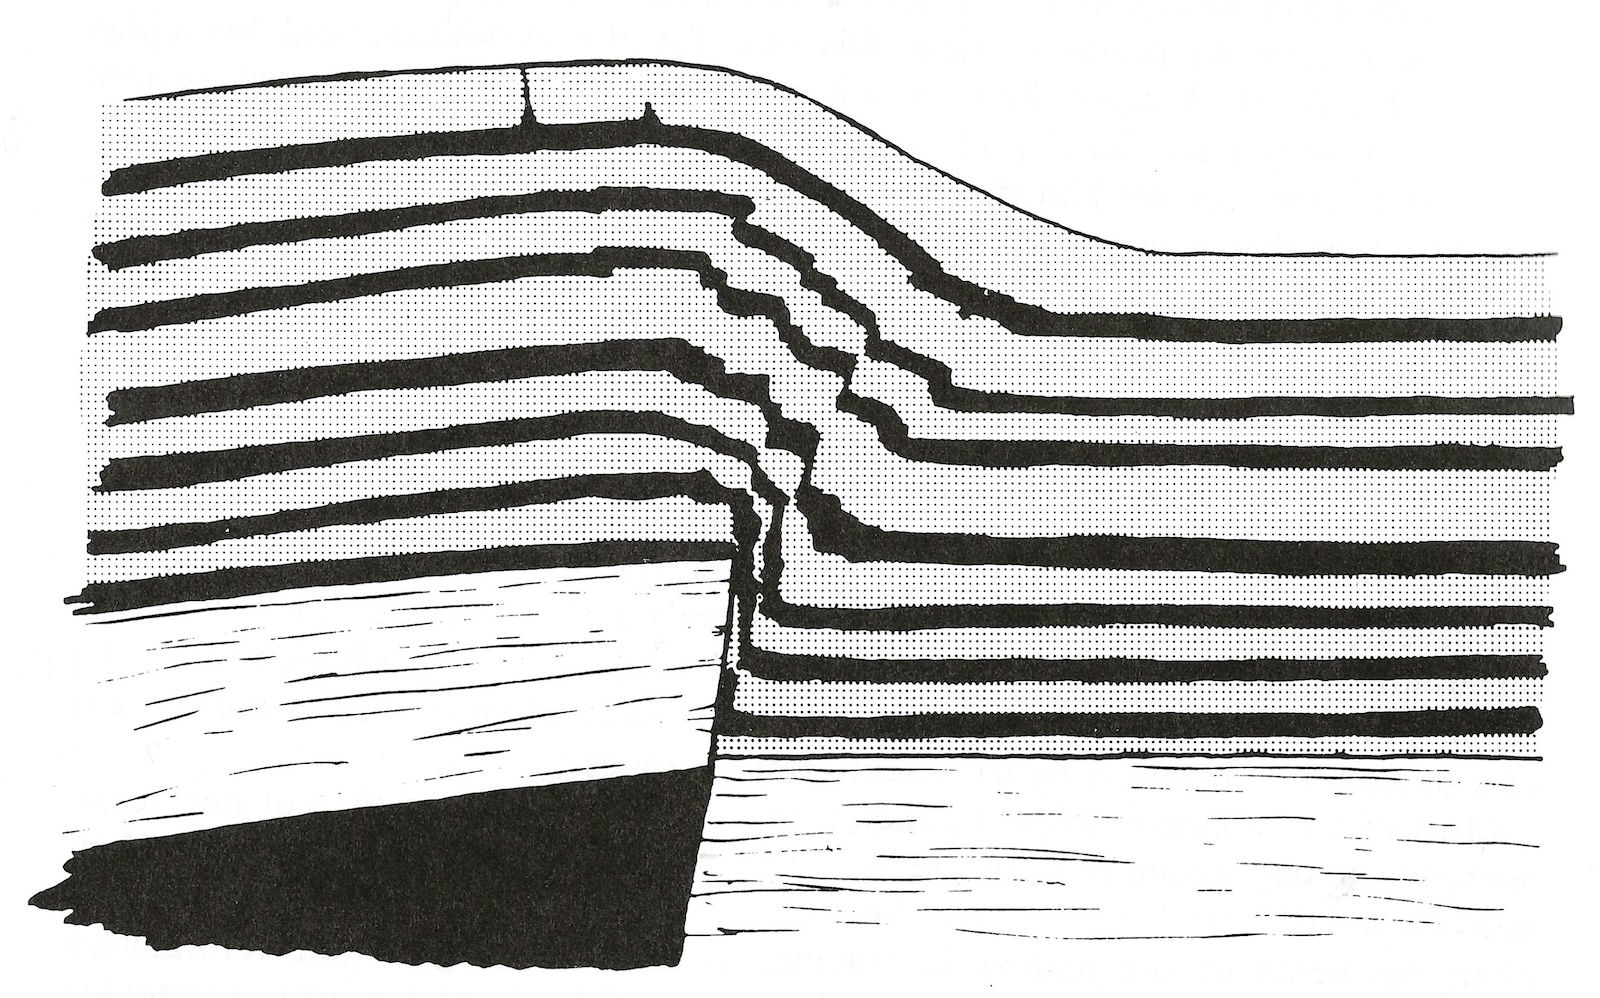
Fig. 10. Simulated development of a monoclinal flexural fold over a reactivated Precambrian basement fault, as happened along the Monument Fault to produce the Monument Monocline and fold in the central Grand Canyon (Snelling 2023b) (after Davis 1978).
The Matkatamiba Fold
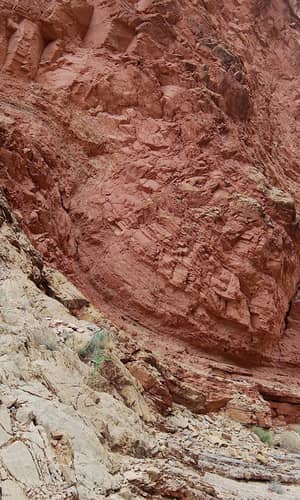
The prime example of the folds investigated is the folding of the Cambrian Tapeats Sandstone (Middleton and Elliott 2003; Snelling 2023a) where sandstone beds were dragged upwards into, against and by the Butte Fault at the synclinal hinge of the East Kaibab Monocline in eastern Grand Canyon during the Laramide orogeny (Huntoon 2003; Karlstrom and Timmons 2012). The best exposed fold in this system is in Carbon Canyon (Snelling 2023a) (fig. 6), a side canyon to Grand Canyon through which flows Carbon Creek, a tributary of the Colorado River at river mile 65 from Lees Ferry (fig. 1). Another prominent fold in the Tapeats Sandstone is the Monument fold produced by the vertical displacement of the Monument Fault along and underneath the Monument Monocline (Snelling 2023b) (figs. 1 and 3).
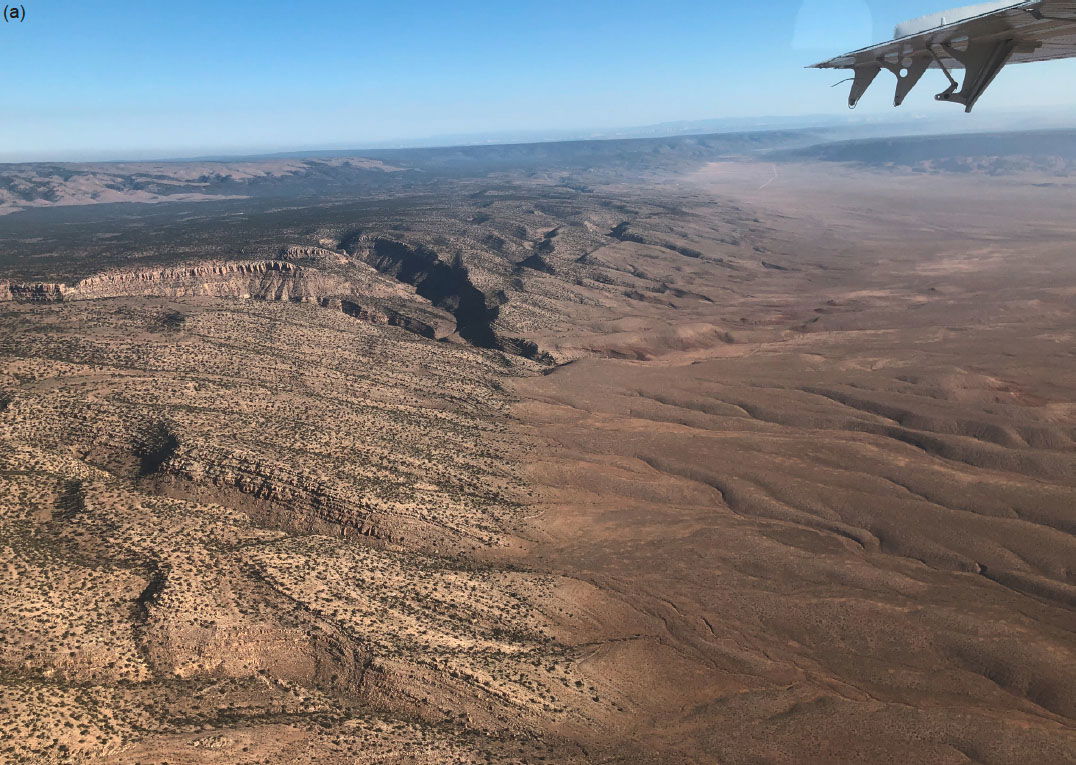
Fig. 5. The East Kaibab Monocline: (a) As seen overhead from an aircraft. In the middle and to the left in the photo can be seen where a tributary in a side canyon of the Colorado River, the South/North Fork of Rock Canyon, has cut through the monocline. In the left foreground can be seen the dipping Kaibab Formation limestone layers that form the rim rock of the Grand Canyon. (b) As seen from ground level, looking north from highway 89A. Again, the dipping Kaibab Formation limestone layers can be seen.
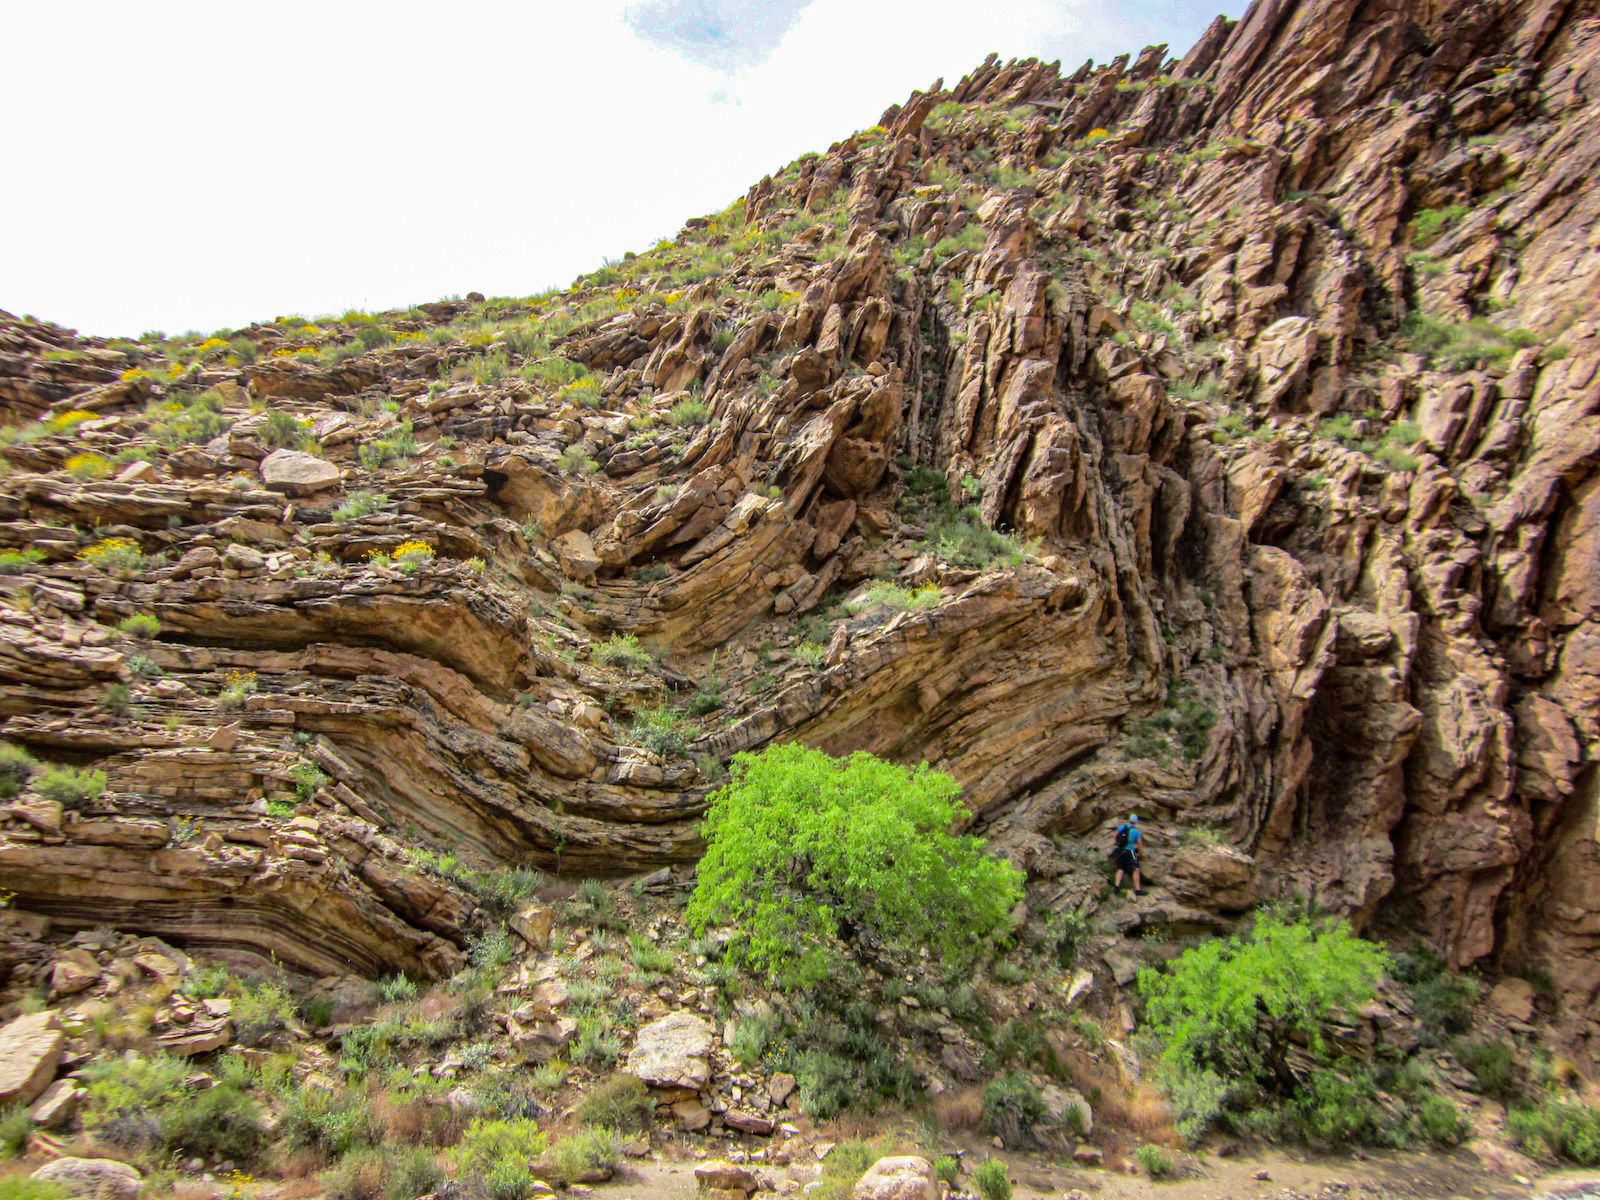
Fig. 6. The Carbon Canyon fold in which beds of the Tapeats Sandstone have been folded (bent) through ~90° adjacent to the Butte Fault. Carbon Canyon is a side canyon to the Colorado River corridor at river mile 65 and the fold is exposed best in the southern wall of the side-canyon about 2 km (about 1.2 mi) from the river. The man who is ~1.8 m (6 ft) tall standing on the fold provides the scale.
The overlying Bright Angel and Muav Formations are likewise bent in both those folds. Whereas the bent Muav Formation along the East Kaibab Monocline and Butte Fault is exposed along Kwagunt Creek in eastern Grand Canyon (fig. 11), it is poorly exposed and not readily accessible in the Monument fold. However, a small monoclinal fold in the Muav Formation is well exposed and accessible in the cliff above the northern side of the Colorado River (river right) in central Grand Canyon at river mile 148.8 from Lees Ferry, just below Matkatamiba rapid (figs. 1, 8, and 9). Although this Matkatamiba fold is not associated with either a fault or monocline, it coincides closely with the axis of the Matkatamiba Syncline and is part of a small, mapped branch monocline to the west of it (fig. 9). Therefore, the generation of this fold would still appear to be related to the movements on the Kaibab Plateau monoclines that are claimed to have occurred during the Laramide orogeny and thereafter (Karlstrom and Timmins 2012). However, that orogeny occurred a very long time after the Cambrian deposition of the Muav Formation, yet the character of the limestone beds appears to be consistent with soft-sediment deformation soon after deposition hundreds of millions of years earlier.
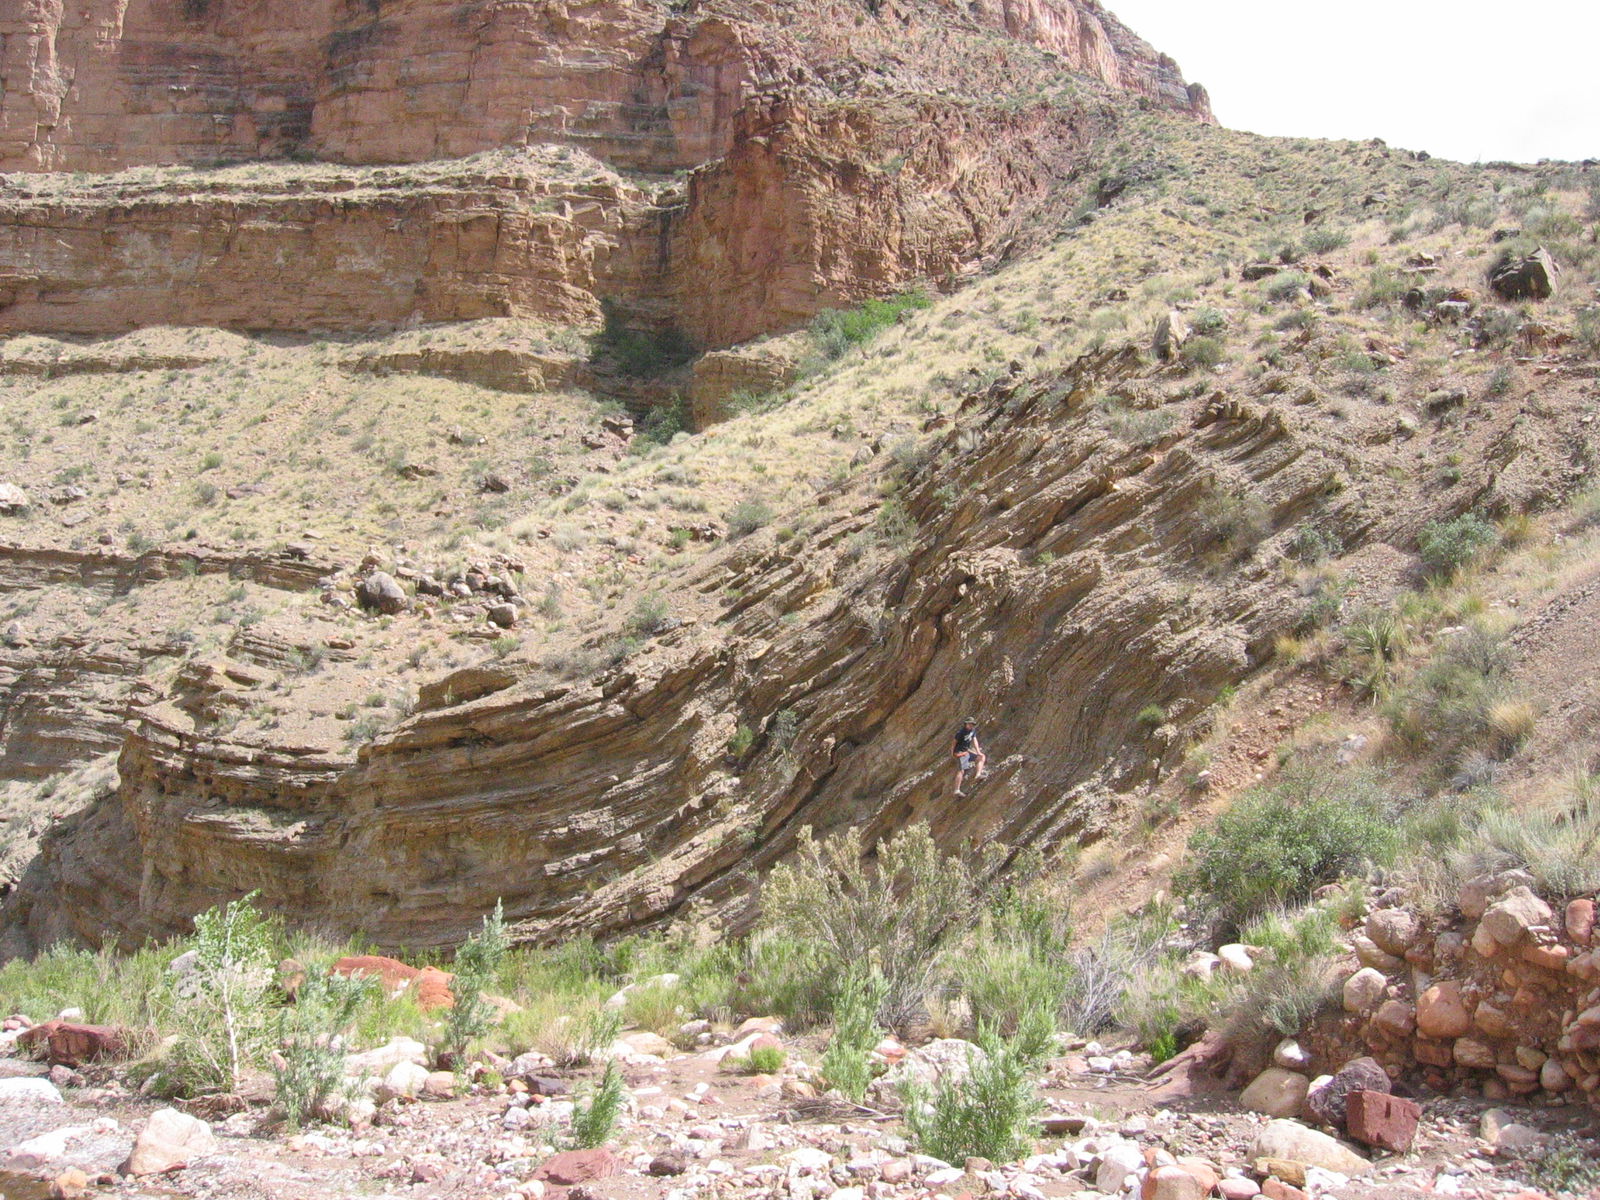
Fig. 11. The exposure of folded Muav Formation beds in the East Kaibab Monocline adjacent to the Butte Fault in the southern wall of Kwagunt Canyon, a side canyon to the Colorado River corridor at river mile 56.6. This outcrop is about 1 mi west up Kwagunt Creek from the Colorado River. The young man standing on the outcrop provides the scale. Similar bending of the Redwall Limestone beds can also be seen above the Muav Formation beds.
The Matkatamiba fold is an open monoclinal fold with very little displacement of the limbs and no apparent mechanical crowding of the constituent relatively thin limestone beds in the Muav Formation in the two hinge zones (fig. 8). Thus, the thin limestone beds appear to have been bent smoothly when still soft, prior to their lithification. The pronounced change in color of the limestone beds in the vertical sequence of the Muav Formation in the Matkatamiba fold marks the boundary between the top of the Gateway Canyon Member (pale gray) and the bottom of the overlying Havasu Member (reddish), as can be verified by the mapped exposures in the Canyon walls both upstream and downstream for many miles from the fold (Elston 1989; Rose 2003; Snelling 2022a).
In commenting on the Carbon Canyon fold, Hill and Moshier (2009) claim that evidence from field studies and rock deformation experiments demonstrate that these solid rocks behaved in a ductile manner as the Tapeats Sandstone beds in that fold were deformed slowly under great stress, and that the beds thus were “bent” by microscopic reorientations of mineral grains and by changes in bedding thickness along the fold. They then reference Huntoon (2003) to state that these tight folds in beds of the Tapeats Sandstone in Carbon Canyon can be explained by mechanical crowding at the synclinal hinge of the East Kaibab Monocline during slow deformation under stress of the solid sandstone in a ductile manner. Because the Muav Formation limestone beds directly overlie the Bright Angel Formation and below it the Tapeats Sandstone, Hill and Moshier (2009) would undoubtedly explain the bending of the limestone beds in the Matkatamiba fold as due to the same processes and mechanisms.
However, Hill and Moshier (2009) offer no supporting evidence of these claims about the bending of the Tapeats Sandstone beds in the Carbon Canyon fold. They provide no documentation of the quoted rock deformation studies, nor any evidence from any thin section examination of the Tapeats Sandstone from the Carbon Canyon fold of the claimed microscopic reorientations of mineral grains. And the only documentation they provide of any field studies is a single photograph of the vertical beds of the Tapeats Sandstone at the Carbon Canyon location, but not of the folded beds showing the mechanical crowding. For that they refer to Huntoon (2003), but his field photograph, while showing the bent Tapeats Sandstone beds at the Carbon Canyon location, is incorrectly labeled as the south wall of Chuar Canyon, when it is in fact the south wall of Carbon Canyon. Furthermore, Huntoon (2003) also did not provide any thin section evidence for any re-orientation of mineral grains.
Subsequently, Tapp and Wolgemuth (2016) similarly focused on the Carbon Canyon fold. They showed a photo of the fold (125, their fig. 12-13), describing it as compressional folding in the Tapeats Sandstone (reproduced here in fig. 12). On an overlay they traced some of the sandstone beds through the fold, some of the fractures, and the apparent changing direction of the fold hinges, which they claimed to be due to flexural slippage. They claimed that the bending resulted in numerous fractures in each sandstone bed that did not heal (reseal). They then illustrated what flexural slippage would look like in two hypothetical folds (125, their fig. 12-14), describing how flexural slippage creates gaps in the fold hinges that may be filled in later with weathered material or weaker rock may deform into the spaces (fig. 13). Either way, the layering in the fold hinges should be thicker relative to the widths of the sandstone beds along the fold limbs. They claimed that neither of these features would be present if this fold had occurred due to soft-sediment deformation. However, their photo of the fold shows no such thickening of the sandstone beds in the fold hinges, and they fail to discuss alternate explanations for the fractures, such as joints due to horizontal contraction within the beds during dewatering and lithification, and especially due to unloading caused by erosion of Grand Canyon and its side canyons. Similarly, there is no such thickening of the Muav Formation limestone beds in the hinge zones of the Matkatamiba fold (fig. 8). There are widely spaced vertical fractures within the Havasu Member well above the fold with no displacements along them, and joints within both the Gateway Canyon and Havasu Members in the folded boundary zone between these members in the fold, but all these are readily explained as due to horizontal contraction within the limestone beds during dewatering and lithification subsequent to their folding.
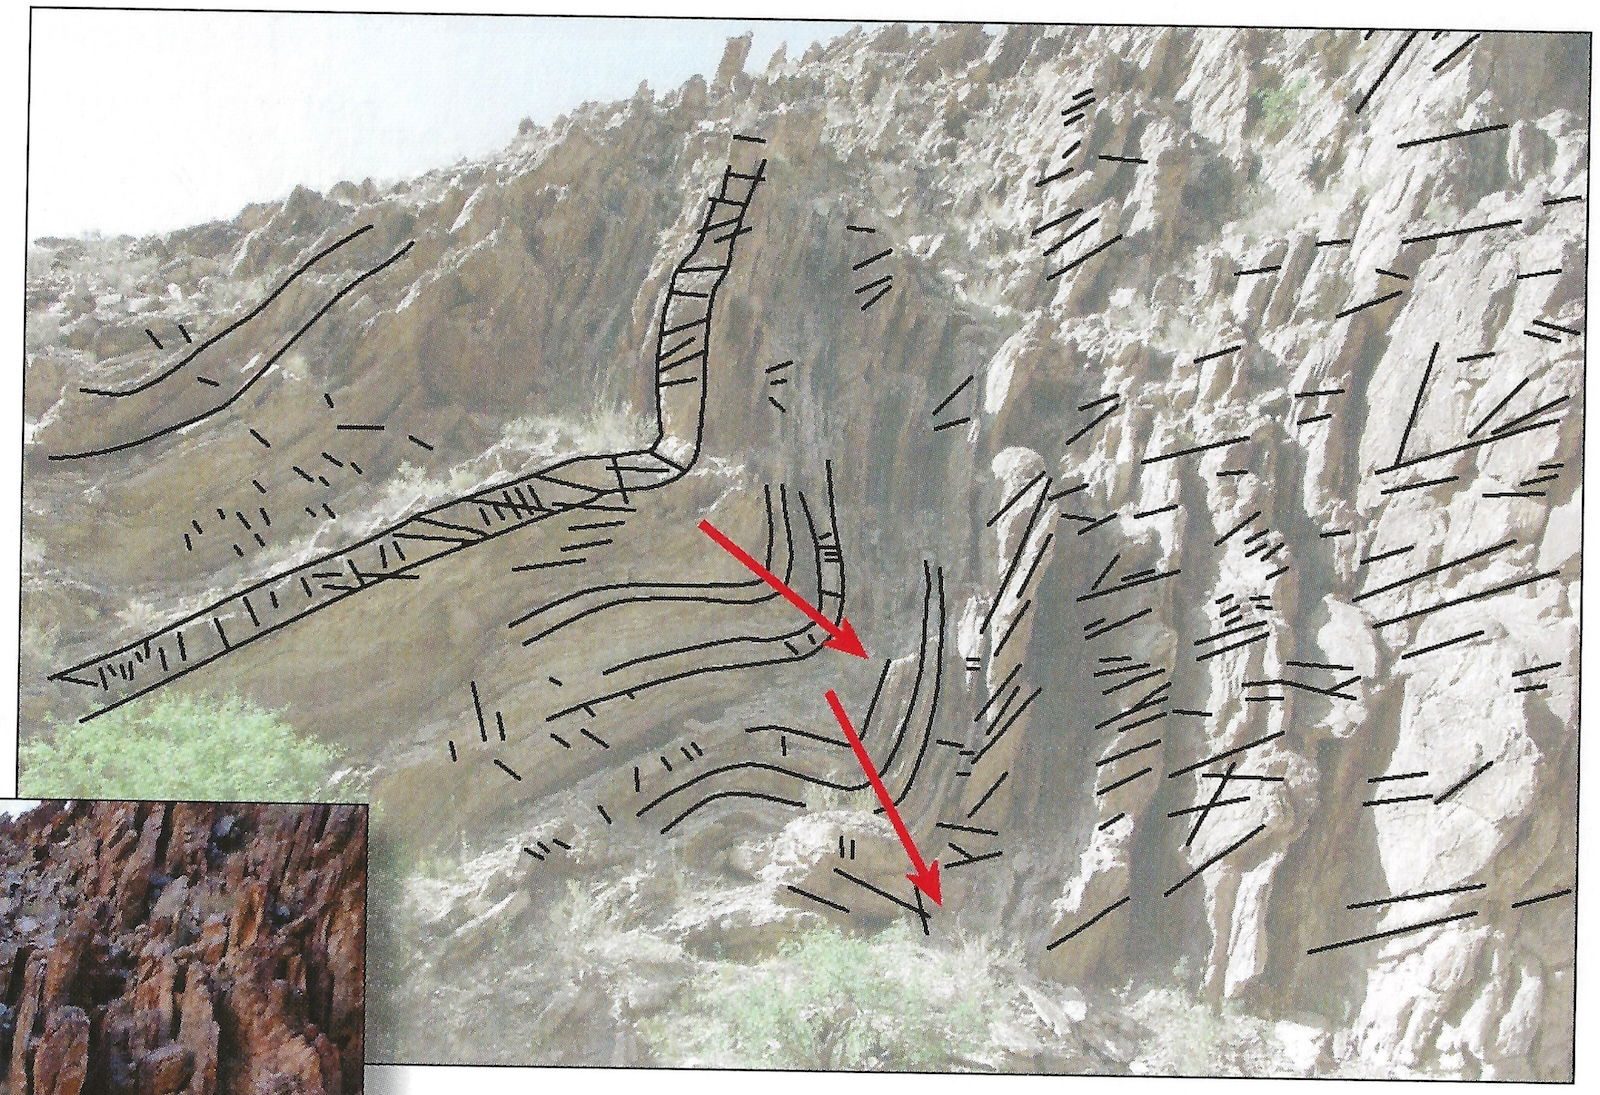
Fig. 12. The similar Carbon Canyon fold in the eastern Grand Canyon with overlaid annotations (after Tapp and Wolgemuth 2016, fig. 12-13). Their annotations show traces of some of the sandstone beds, some of the fractures, and their interpretation of the changing direction of the folds apparently resulting from bedding plane or flexural slippage.
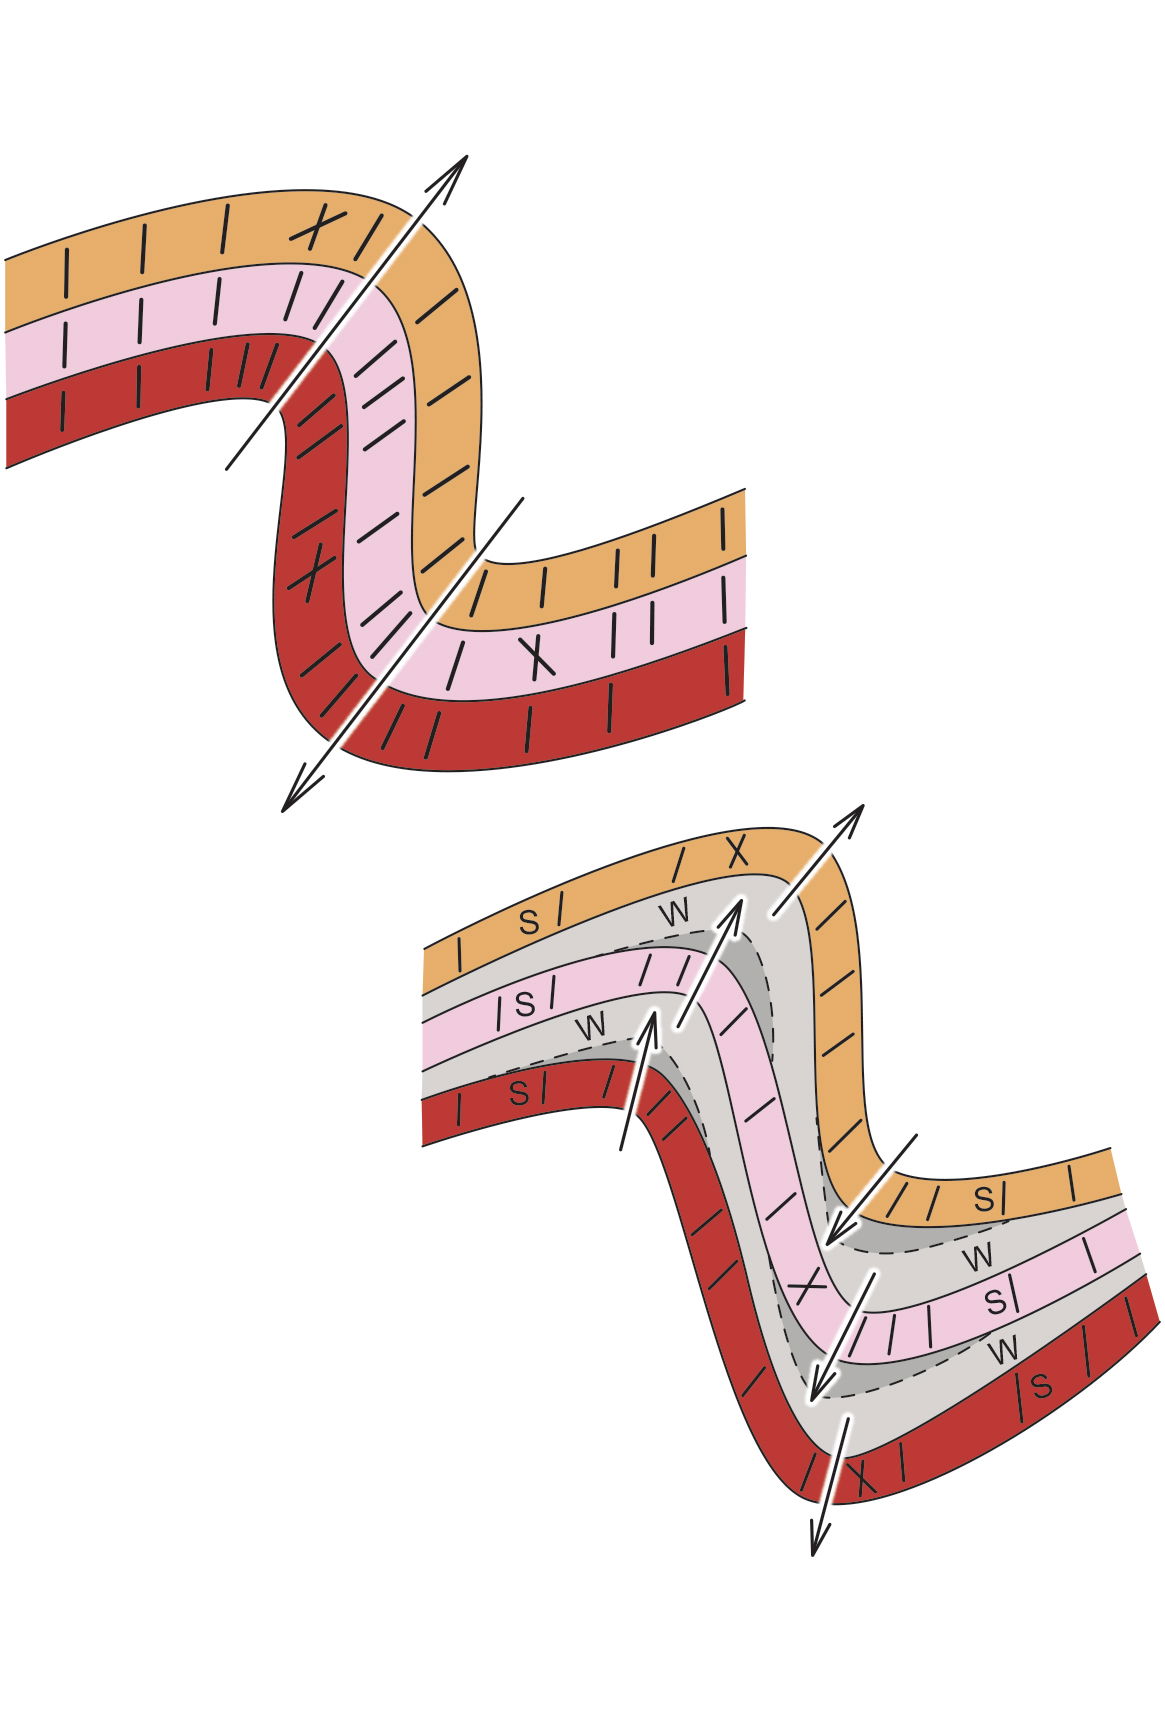
Fig. 13. Folding from two scenarios as presented by Tapp and Wolgemuth (2016, fig.12-14). (a) Rock layers all of equal strength. They maintain that compacted sediments will look similar, but without the fractures. (b) Rock layers of different strength (w=weak, s=strong). The dashed lines show bedding plane or flexural slippage filled with weaker rock.
The Muav Formation
Snelling (2022a) provided a detailed review of past investigations of the Muav Formation, including its stratigraphy, body and trace fossils, sedimentary structures, U-Pb detrital zircon ages, provenance, and depositional environment. Additionally, based on the detailed petrographic study of 15 samples collected from a fold and from locations distal to it, Snelling (2022a) documented and described in detail the mineral grains and textures within the limestone, then discussed his findings to draw conclusions as to the petrology of the Muav Formation.
The Cambrian Muav Formation is the 42–252 m (136–827 ft) thick cliff-forming formation that outcrops towards the top of the Tonto Group across ~500 km in the walls of Grand Canyon, Arizona, and beyond (Elston 1989; McKee 1945; Middleton and Elliott 2003; Noble 1914, 1922; Rose 2003, 2006, 2011; Rowland, Osborn, and Graber 1995; Schuchert 1918; Wanless 1973, 1975; Wheeler and Kerr 1936). It is an integral component of the fining upwards lithologies of the Cambrian Tonto Group, which has been touted conventionally as the classic example of the time-transgressive “deepening seas” sedimentation model (McKee 1945). Originally described as the Muav Limestone, it has been recently renamed as the Muav Formation due to it consisting of minor dolostone beds and laminae, and some extensive intraformational flat-pebble conglomerate layers, within the dominant thick beds and thin laminae of limestones, that sometimes also have alternating siltstone partings. The Muav Formation immediately overlies a gradational and intertonguing boundary with the Bright Angel Formation, which in turn overlies the Tapeats Sandstone that mostly sits directly on a pronounced erosion surface known as the Great Unconformity (Karlstrom et al. 2018, 2020; Peters and Gaines 2012). The underlying rocks eroded at the Great Unconformity include granitic plutons intruded into the Granite Gorge Metamorphic Suite schists unconformably overlain by the tilted sedimentary strata and basalt layers of the Grand Canyon Supergroup, all dated as Precambrian (Ilg et al. 1996; Karlstrom et al. 2003). Both the correlated equivalents of the Muav Formation and the Great Unconformity have been traced across several continents and around the globe, respectively (Clarey 2019, 2020; Clarey and Werner 2023; Peters and Gaines 2012).
Within the Muav Formation a few trilobites and some brachiopods and gastropods are sparsely scattered within some members (McKee 1945; Middleton and Elliott 2003; Resser 1945: Rose 2003). Difficult-to-recognize trace fossils are present in the formation, primarily burrows and trails likely left by various worms and other invertebrates (McKee 1932, 1945; Middleton and Elliott 2003; Noble 1914; Rose 2003; Schuchert 1918; Wanless 1973, 1975). Some limestone beds are mottled due to apparent ubiquitous worm burrows. The formation itself is well-bedded with thick and thin limestone laminae, in some sections with alternating siltstone partings (McKee 1945; Noble 1922; Rose 2003, 2006; Snelling 2022a; Wanless 1975). Cross-laminations are common but difficult to observe, and sometimes are also associated with current ripples and megaripples. Some intraformational flat-pebble conglomerate layers are extensive in thin beds or sets of beds that extended many miles. Detrital zircon grains extracted from the Tapeats Sandstone have been U-Pb dated to determine the maximum depositional age of that formation and coupled with biostratigraphic trilobite faunal zones correlated globally have constrained the conventional age of the overlying Muav Formation to 499–502 ma (early Middle Cambrian) (Karlstrom et al. 2018, 2020; Matthews, Guest, and Madronich 2017). Additionally, U-Pb dates obtained from detrital zircon grains extracted from the underlying Bright Angel Formation potentially identify the provenance of its sediment grains (Gehrels et al. 2011). U-Pb age peaks among its detrital zircons matched the nearby Paleoproterozoic Yavapai and Mazatzal provinces, indicating the primary source of its sediment grains was the locally underlying granitic plutons and schists, plus a very small portion from the underlying Grand Canyon Supergroup strata (though long-distance transport of some grains cannot be entirely ruled out). Given that the small quantities of finer-grained clasts scattered through the poorly sorted limestones of the Muav Formation are of the same silicates, it is reasonable to conclude those grains came from the same sources. The consensus uniformitarian-interpreted depositional environments for accumulation of the Muav Formation are shallow-marine distal offshore to subtidal, intertidal, and even tidal flats (McKee 1945; Middleton and Elliott 2003; Rose 2003, 2006, 2011; Wanless 1973, 1975), yet it has been described as part of “one of the most dramatic global marine transgressions in Earth history” (Karlstrom et al. 2018).
Snelling (2022a) reported that calcite grains are the dominant component of the Muav Formation with subordinate dolomite. However, bulk rock XRD analyses of the 15 samples studied demonstrated that quartz and K-feldspar feature prominently in many samples, ranging from 2.7% to 55.9% and 0.9% to 26.3%, respectively. Illite is also present, indicative mostly of muscovite, but likely some from glauconite and also minor illite alteration. In thin section, the limestones are fine-grained and generally poorly sorted, with angular to sub-rounded, medium silt to fine sand-sized quartz and K-feldspar grains scattered through the tiny-grained calcite matrix (micrite) that has in places been recrystallized into larger grains and patches. Occasional thin edge-on detrital muscovite flakes are wedged between the quartz and K-feldspar grains. A few samples contain small glauconite pellets and grains, and a few contain small shell fragments. There are virtually no original pores remaining, the rock fabric being cemented mostly by recrystallized calcite. In many samples, post-depositional dolomite alteration of calcite has occurred. There is no evidence, macroscopic or microscopic, of any metamorphic changes to the detrital mineral grains or textures.
Snelling (2022a) concluded that the silicate grains within the Muav Formation are consistent with their provenance being the underlying local basement rocks, as indicated by the detrital zircon U-Pb ages, while the carbonate mud was likely derived from the ocean floor to the west. Indeed, due to the very short-distance transport of the sediment and rapid deposition of the limestones, quartz, and K-feldspar grains are scattered randomly through the entire formation and are often angular or sub-angular, while the extremely soft detrital muscovite flakes have survived, sometimes bent with frayed ends. The dominant thickening, thinning, and pinching out of laminae in the limestones (with some alternating siltstone partings), the occasional cross-laminations, ripples and megaripples, and the extensive intraformational flat-pebble conglomerate layers are consistent with rapid deposition by high-energy storm-like surges. Furthermore, they are consistent with observational evidence of spontaneous stratification and continuous rapid deposition of heterogranular sediment mixtures including carbonate mud floccules (Schieber et al. 2013). Numerous detrital zircon grains in the underlying Tapeats Sandstone yield U-Pb ages that are considerably younger than its designated depositional age (Karlstrom et al. 2018,2020; Snelling 2022a). These coupled with the well-documented problems with the many assumptions undergirding the U-Pb dating method (Snelling 2000, 2009, 2022b), and the evidence of past grossly accelerated nuclear decay rates (Vardiman, Snelling, and Chaffin 2005), totally undermine the validity of the conventional age for the Muav Formation. Instead, Snelling (2022a) found that when summing up the mineralogical content, textural features, sedimentary structures, the continental-scale deposition, the invertebrate fossils and fragments, and even the trails and burrows of transitory invertebrates that had to be buried and fossilized rapidly, these results are all consistent with the catastrophic erosion of the Great Unconformity near the onset of the global Genesis Flood cataclysm about 4,350 years ago, and with the tsunami-driven rapid short-distance transport and deposition of the Muav Formation within the fining upwards Sauk megasequence in the first few days or weeks of that year-long event.
Folding Mechanisms in Folds
It has been claimed that the Tapeats Sandstone was bent in the Carbon Canyon fold by ductile deformation (Hill and Moshier 2009; Huntoon 2003; Tapp and Wolgemuth 2016). Given the spatial and temporal relationship of the Matkatamiba fold to the other monoclinal folds in the Kaibab Plateau (fig. 3), the claim that the folding was due to ductile deformation also applies to the Muav Formation in the Matkatamiba fold. By ductile deformation they presumably mean continuous deformation at the scale of observation in which the rock flowed under the influence of stress without macroscopic fracturing (Fossen 2016). They make no mention of any possible accompanying metamorphism due to elevated temperatures at the depth of burial. As summarized by Paterson (2001), ductile flow of rocks can occur by the following three mechanisms:
- change of shape of grains by crystal plasticity, which is referred to as dislocation creep,
- change of grain shape by diffusion through or around grains, called diffusion creep, and
- relative movement of grains, referred to as granular flow or grain-boundary sliding.
In (3), in order to minimize the formation of voids (dilatancy), the grains must change their shapes by mechanism (1) or (2). Except for these local accommodations, very large strains may be achieved without change of overall grain shape, as in “superplastic flow” in very fine-grained aggregates.
Thus, where folding of sedimentary rock units has occurred subsequent to their diagenesis and deep burial, ductile deformation during folding of the otherwise brittle rock can be facilitated by grain-boundary sliding and bedding-plane slip and attenuation. The role of grain-boundary sliding has been thoroughly investigated theoretically, experimentally and in field situations, and the resulting macroscale and microscopic features of rock textures and mineral grain characteristics are well documented (Bestmann and Prior 2003; Billia et al. 2013; Etheridge and Wilkie 1979; Gratier et al. 2011; Hansen, Zimmerman, and Kohlstedt 2011; Hippertt 1994; Hiraga et al. 2013; Jackson, Faul, and Skelton 2014; Langdon 1970; Lee and Morris 2010; Lee, Morris, and Wilkening 2011; Massey, Prior, and Moecher 2011; Menegon et al. 2015; Morris and Jackson 2009; Ree 1994; Sundberg and Cooper 2010; Vernon 2018; Watanabe et al. 2013; Wojtal, Blenkinsop, and Tikoff 2022). Similarly, bedding-plane slip and attenuation have been demonstrated to facilitate folding without brittle fracturing, being simulated with numerical modeling and well-studied in laboratory and field settings (Becker 1994; Behzadi and Dubey 1980; Borja, Sama, and Sanz 2003; Chapple and Spang 1974; Cooke and Pollard 1997; Cooke et al. 2000; Cooke and Underwood 2001; Couples and Lewis 2000; Crook et al. 2006; Epard and Groshong 1995; Horne and Culshaw 2001; Hughes and Shaw 2015; Kuenen and de Sitter 1938; Nino, Philip, and Chéry 1998; Ramsay 1974; Roth, Sweet, and Goodman 1982; Sanz et al. 2008; Suppe 1983; Suppe and Medwedeff 1990; Tanner 1989).
Furthermore, the pressures inherent in the folding process have also been shown to cause elastoplasticity and visco-elastic compression of the particle matrices within sedimentary rocks which facilitates accommodation of the volume changes in the hinges and limbs of the resultant folds (Benesh et al. 2007; Borja 2006; Cundall and Strack 1979; Erickson and Jamison 1995; Guiton, Leroy, and Sassi 2003; Matsuoka and Nakai 1974; Mühlhaus et al. 2002; Sanz, Borja, and Pollard 2007; Simo and Taylor 1985). The effects of all of these processes on the rock fabric and texture, and on the rock matrix and its mineral grains, can be observed and documented in the outcropping folds and under the microscope in rock sections.
Rock deformation laboratory studies have demonstrated that solid rock can deform in a ductile manner slowly under stress (Davis and Reynolds 1996; Friedman et al. 1976; Friedman, Hugman, and Handin 1980; Gangi, Min, and Logan 1977; Ghosh 1968; Griggs 1936, 1939; Handin et al. 1976; Weinberg 1979), but mechanical crowding and thinning of limestone beds at the macroscopic scale is not definitive proof that folding occurred slowly under stress as if the lithified sandstone beds were deformed in a ductile manner. It is also readily demonstrated in laboratory studies that beds of soft sand, silt, and mud will similarly be crowded and thinned mechanically when deformed while still soft due to the confining pressures in the hinges of the folds (Borg and Maxwell 1956). Only if thin section examination of the limestone reveals deformation lamellae and undulose extinction in any contained quartz grains under cross-polarized light due to deformation stress (Bailey, Bell, and Peng 1958; Carter 1971; Carter, Christie, and Griggs 1964; Christie and Ardell 1974; Christie, Griggs, and Carter 1964; Davis and Reynolds 1996; Fairbairn 1939; Groshong 1988; Hansen and Borg 1962; Hansen, Borg, and Maxwell 1959; Mitra and Tullis 1979; Tullis, Christie, and Griggs 1973; Twiss 1974, 1976; Whisonant 1970; White 1973a, b) can it be demonstrated that the mechanical crowding of the limestone beds in this fold was caused by slow deformation of the solid, thinly-laminated limestone beds.
Detailed field and laboratory studies are always needed to resolve the questions of what condition the limestone beds were in when they were deformed into this fold, and thus how the deformation occurred. Such field studies should involve careful documentation and analysis of the folding and faulting (Aydin and Johnson 1983; Davis and Reynolds 1996; Groshong 1988; Hafner 1951; Jessell 1988a, b; Reches 1978b; Reches 1983; Reches and Dieterich 1983; Reches and Johnson 1978) and would require sampling of the limestone so that thin sections could then be prepared for detailed microscope examination. For control purposes the same limestone beds need to be sampled from areas distant from the fold under investigation to compare under the microscope the grains and rock fabric/texture in those distal limestone samples with those in the samples obtained from the fold.
Expected Macroscopic Features Due to Ductile Deformation
Though somewhat similar, two classification schemes of folds have been proposed. Donath and Parker (1964) classified folds according to a generic-mechanical scheme based on mean ductility and ductility contrast within the folded sequence of layers (Hatcher and Bailey 2020) (fig. 14a). Accordingly, there are two broad groups of folds—flexural folds in which the fold shape is determined by the layering in the rocks, and passive folds in which the layering only serves as a displacement marker during folding (fig. 14b). A second, broad twofold subdivision is fundamentally a separation of brittle from ductile behavior. Slip along bedding, cleavage or foliation planes is important in forming brittle folds. The process of ductile flow dominates in passive folds. Thus, in flexural-slip folds, layer thicknesses remain constant, and folding is accomplished by slip along and between layers. They are easily recognized by slickensides, fibers or other movement indicators such as slip lines or lineations on layer surfaces, and by constant layer thickness (Hatcher and Bailey 2020). In flexural-flow folds, the stronger beds change thickness little or not at all, while the weaker beds undergo appreciable thickness changes, and cleavage is strong in the weak layers, but poorly developed in the strong layers. Thus, some beds were thickened in the hinge (axial) zones and thinned into limbs as folding proceeded, indicating a higher contrast in internal ductility. In contrast, passive-slip folds are ideally developed by movement parallel to a strong cleavage or shearing along planes, both of which are inclined to the layering. And finally, passive-flow folds develop by ductile flow due to plastic deformation so that the fold limbs are thinned, and the hinges are relatively thickened equally in all rock types, thus producing similar folds.
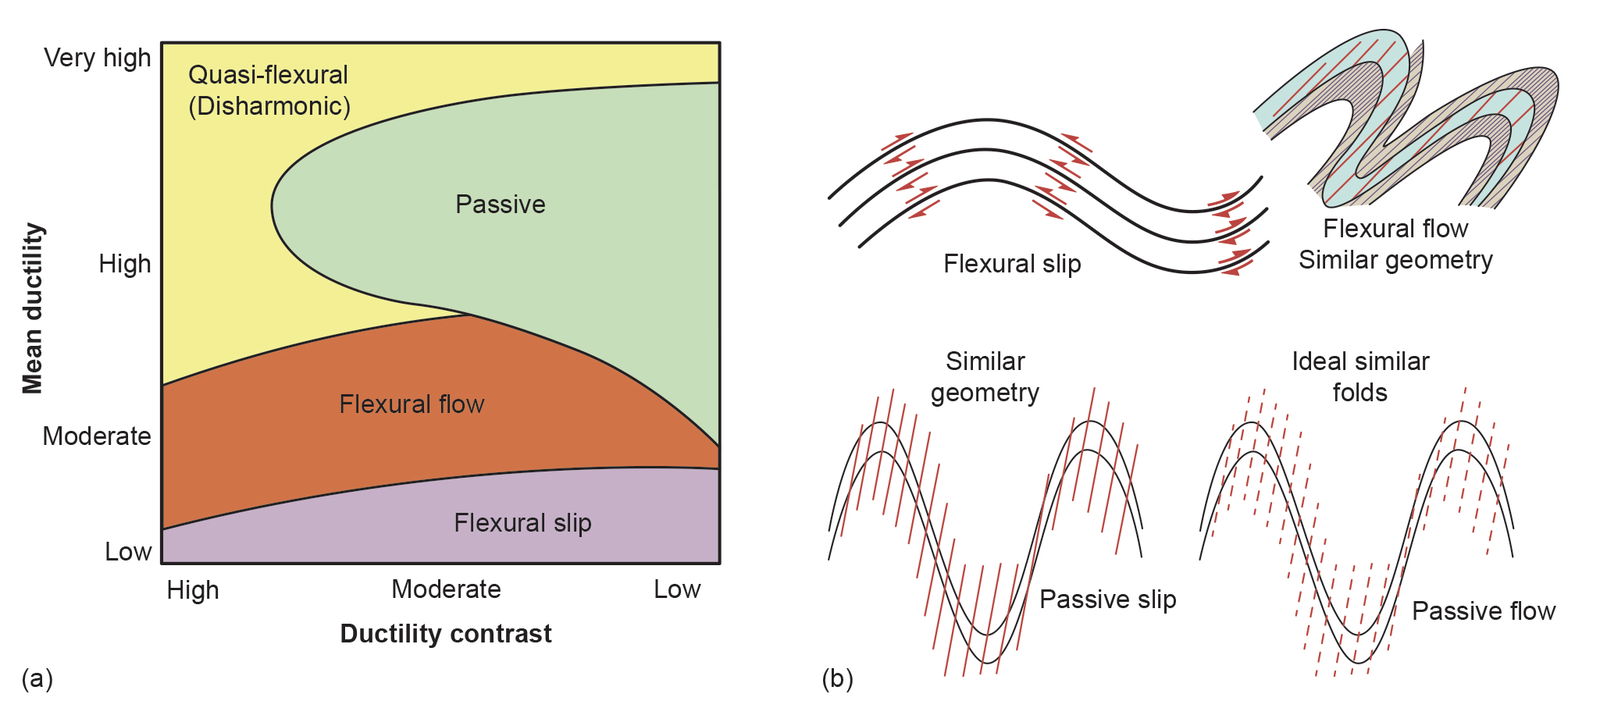
Fig. 14. The Donath and Parker (1964) classification of folds. (a) The basis for the classification with respect to the ductility contrast versus the mean ductility. (b) The types and mechanisms on fold types. Red lines represent cleavage. In flexural-slip folds, layer thicknesses remain constant, and folding is accomplished by slip along layers. In flexural-flow folds, strong layers change thickness little or not at all, weak layers undergo appreciable thickening, and cleavage is strong in weak layers but poorly developed in strong layers. Passive-slip folds are ideally developed by movement parallel to a strong cleavage. Passive-flow folds develop by ductile flow with limbs thinned (or relatively thickened) equally in all rock types (similar folds).
However, Ramsay (1967) subsequently classified folds into several classes based instead on their descriptive geometric shapes as determined on their profiles perpendicular to their hinge zones (Fossen 2016; Hatcher and Bailey 2020) (fig. 15). His classification involves an indirect relationship between layer thickness, both perpendicular to the layering and parallel to the fold axial surface, and the angle of dip at different points on successive folded surfaces. Lines connecting points of equal dip across a layer are called dip isogons. The relative convergence, divergence or parallelism of dip isogons is the classification key, with the degree of convergence of isogons directly related to fold tightening. Thus, folds where the isogons converge towards the concave part of the fold are classified as Class 1 folds, folds with parallel isogons belong to Class 2 folds, and folds with isogons that diverge toward the concave part of the fold are in Class 3 folds (fig. 15). Class 1 folds are further subdivided into three groups. Class 1A folds have strongly convergent isogons which change direction through distance along the bedding more than the dip of the bedding surfaces they connect (fig. 15a). Class 1B folds correspond to parallel-concentric folds with convergent isogons which change direction the same as the bedding surfaces they connect (fig. 15b). And Class 1C folds are modified similar or parallel folds that have weakly convergent isogons which change direction less that the bedding surfaces they connect (fig. 15c). Then, Class 2 folds are ideal similar folds in which the isogons are parallel (fig. 15d), while Class 3 folds have extremely thickened hinges or extremely thinned limbs in which the isogons change direction in the opposite sense to the bedding surfaces they connect (fig. 15e).
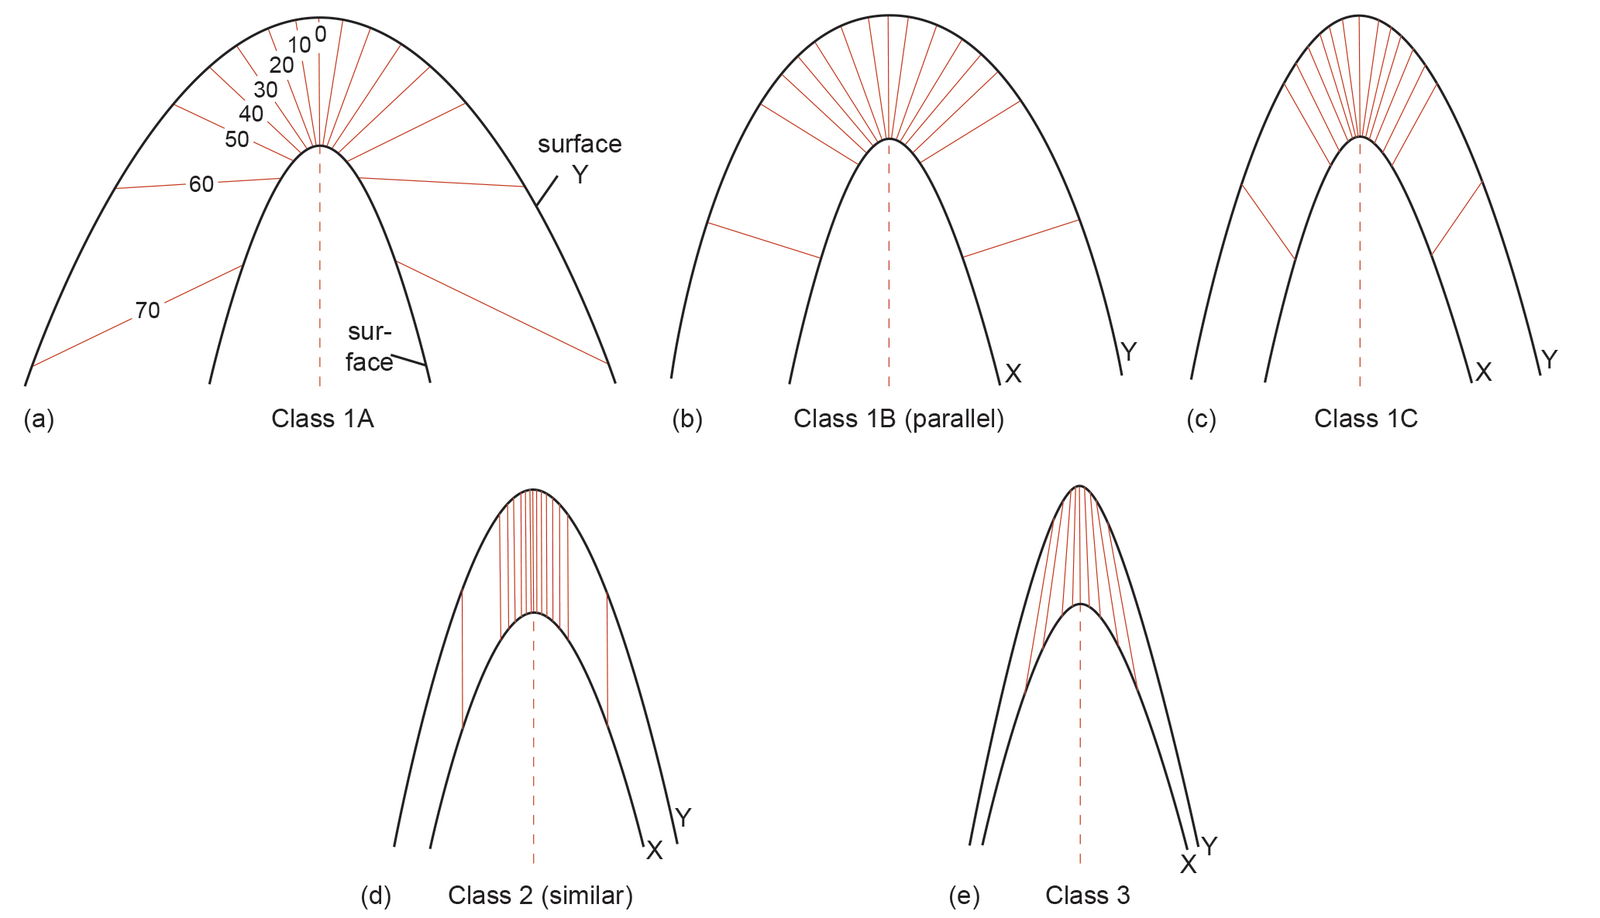
Fig. 15. The Ramsay (1967) fold classes. (a) In a class 1A fold, isogons change direction through distance along the bedding more than the dip of the bedding surfaces they connect. (b) Isogons change direction the same in a class 1B fold as the bedding surfaces they connect. (c) Isogons change direction less in a class 1C fold than the bedding surfaces they connect. (d) Isogons are parallel in class 2 folds. (e) Isogons in a class 3 fold change direction in the opposite sense to the surfaces they connect.
Fossen (2016) noted that Class 1B folds are due to active folding, buckling or bending that was initiated when the layers were shortened parallel to the layering. A contrast in competence or viscosity between the folding layers and their host rock is required for the folding to have occurred, with the folding layers evidently more competent than the host rock or matrix. Fossen (2016) also equated Ramsay’s (1967) Class 1B folds with Donath and Parker’s (1964) flexural folding. Furthermore, Fossen (2016) distinguished bending, where the forces act across layers at a high angle, from buckling, where the main forces act parallel to the layers. He then cited the classic geologic results of bending as the forced folds created in sedimentary layers blanketing faulted rigid basement blocks. Displacement is forced on the sedimentary layers by movements along pre-existing faults, and the sedimentary layers are soft enough to respond to monoclinal folding until at some critical point they rupture and the faults start propagating up-section, for example, the Laramide-uplift created monoclines of the Colorado Plateau (fig. 10). In contrast, Fossen (2016) equated Donath and Parker’s (1964) passive folding with Ramsay’s (1967) Class 2 folds in which the layering exerts no mechanical influence on the folding due instead to passive flow occurring. Thus, passive folds form in response to any kind of ductile strain, whether shearing, transpression or even coaxial strain.
Bedding plane or flexural slip implies slippage along interfaces between layers or along thin layers during folding, while maintaining with bed thickness, and is the dominant mode of folding at the low temperatures and pressures at shallow depths in the upper crustal brittle regime (Fossen 2016; Hatcher and Bailey 2020). As already noted, bedding plane or flexural slip has been demonstrated to facilitate folding without brittle fracturing, being simulated with numerical modeling and well-studied in laboratory and field settings, including along the East Kaibab Monocline (Becker 1994; Behzadi and Dubey 1980; Borja, Sama, and Sanz 2003; Chapple and Spang 1974; Cooke et al. 2000; Cooke and Pollard 1997; Cooke and Underwood 2001; Crook et al. 2006; Couples and Lewis 2000; Epard and Groshong 1995; Horne and Culshaw 2001; Hughes and Shaw 2015; Kuenen and de Sitter 1938; Nino, Philip, and Chéry 1998; Ramsay 1974; Roth, Sweet, and Goodman 1982; Sanz et al. 2008; Suppe 1983; Suppe and Medwedeff 1990; Tanner 1989).
Furthermore, it is a prerequisite for flexural slip that the deforming medium is layered or has a strong mechanical anisotropy (Fossen 2016; Hatcher and Bailey 2020). Thus, for a layered sequence of beds to maintain constant thickness during folding, it must be uniformly strong rock such as bedded sandstone (for example, the Tapeats Sandstone) or carbonates (for example, the Muav Formation) so the beds can slip past one another. On the other hand, where the mechanical properties of successive layers differ (mechanical anisotropy), as with interlayered sandstone and shale, flexural slippage still occurs, but the shale may become thickened or even crumpled into the hinge zone of the folds without any ductile flow. In both cases, the bedding surfaces act like fault planes and thus flexural slippage is easily recognized by slickensides or fibers on the slipped bedding surfaces. Maximum slip occurs at the inflection points and dies out towards the hinge line, where it is zero. The sense of slip is opposite on each limb, and slip is constant relative to the hinge where the sense of the slip changes. Relative slip on the convex side of a flexural-slip fold is always towards the fold hinge, whereas the concave side slip is opposite. The net result is that layering plays a pivotal role in parallel folding, the bending of massive sandstone or carbonate beds being an ideal example.
In contrast, a layered sequence of beds is said to deform by flexural flow if some beds flow ductilely, while others remain brittle and buckle or bend (Hatcher and Bailey 2020). Flexural flow requires moderate- to high-ductility contrast between layers. The whole rock mass may be in a state of ductile flow, but some rocks have higher viscosities under moderate temperatures (300–500°C) and higher pressures than interlayered weaker rocks. Such conditions do not apply to unmetamorphosed sedimentary rocks. The products of flexural flow are also mostly similar-type folds (Classes 1C and 3), and rarely ideal similar folds (Class 2). Similarly, passive flow involves uniform ductile flow of an entire rock mass, but there is little mechanical contribution from the rock material being deformed. Furthermore, there must be little or no ductility contrast between beds or layers, even if their compositions differ markedly, and there must be flow across the layering. Again, the necessary conditions for passive flow to occur do not apply to unmetamorphosed sedimentary rocks, and the products are again similar and similar-type folds (Classes 2 and 3 and 1C respectively). And finally, passive slip as described by Donath and Parker (1964) and Ramsay (1967) as slip at an angle to the layering that produces new cleavage and schistosity does not apply to unmetamorphosed sedimentary rocks. In any case, it is now often considered as a problematical fold mechanism (Hatcher and Bailey 2020).
Therefore, the focus needs to be on what details might apply to the limestone beds of the Muav Formation within the Matkatamiba fold that should be observed at the macroscopic field scale. Field observations that would classify the type of fold are also critical in determining the mechanism and the conditions under which the folding occurred. If flexural slip occurred after lithification during ductile deformation, then slickensides should be observed on the surfaces of the beds that moved relative to one another. Was there bed attenuation observed in the limbs or bed thickening in the hinges, and any mechanical crowding? Yet even after such field observations are made, it is the microstructures that are the best clues as to the conditions under which the folding occurred.
Expected Microstructures Due to Ductile Deformation
Vernon (2018) and Wojtal, Blenkinsop, and Tikoff (2022) reviewed the various mechanisms by which minerals and rocks undergo deformation, that is, change of shape and strain, at the scale of grains or small aggregates, with particular reference to the optical microstructures produced by each mechanism. To relate microstructures to deformation mechanisms, Vernon (2018) concluded:
- the microstructures produced by different deformation mechanisms must be known from natural and especially experimental observations, and
- the microstructures must be stable enough to survive subsequent deformation and/or heating events.
Furthermore, deformation mechanisms can be classified in various ways, but brittle and ductile deformation can be distinguished at the microscope scale.
In brittle deformation, fractures occur across and/or between grains, and the resulting fragments move relative to one another. Fig. 16 depicts the textures that would be observed under the microscope as a result of brittle deformation either by granular flow grain rotation and frictional sliding, which is common during deformation at shallow depths of porous sediments, or by cataclastic flow, which also produces micro-fracturing of grains during deformation of well-consolidated sedimentary and non-porous rocks (Fossen 2016). In ductile deformation, the grains change their shapes or move relative to one another without fracturing (loss of cohesion) at the grain scale (Passchier and Trouw 1996). In both situations, but especially during brittle deformation, a change of shape of an aggregate may be accomplished or assisted by dissolution of minerals at some sites, transfer of dissolved chemical components in solution, and deposition at other sites in the deforming aggregate, known as stress-induced solution transfer.
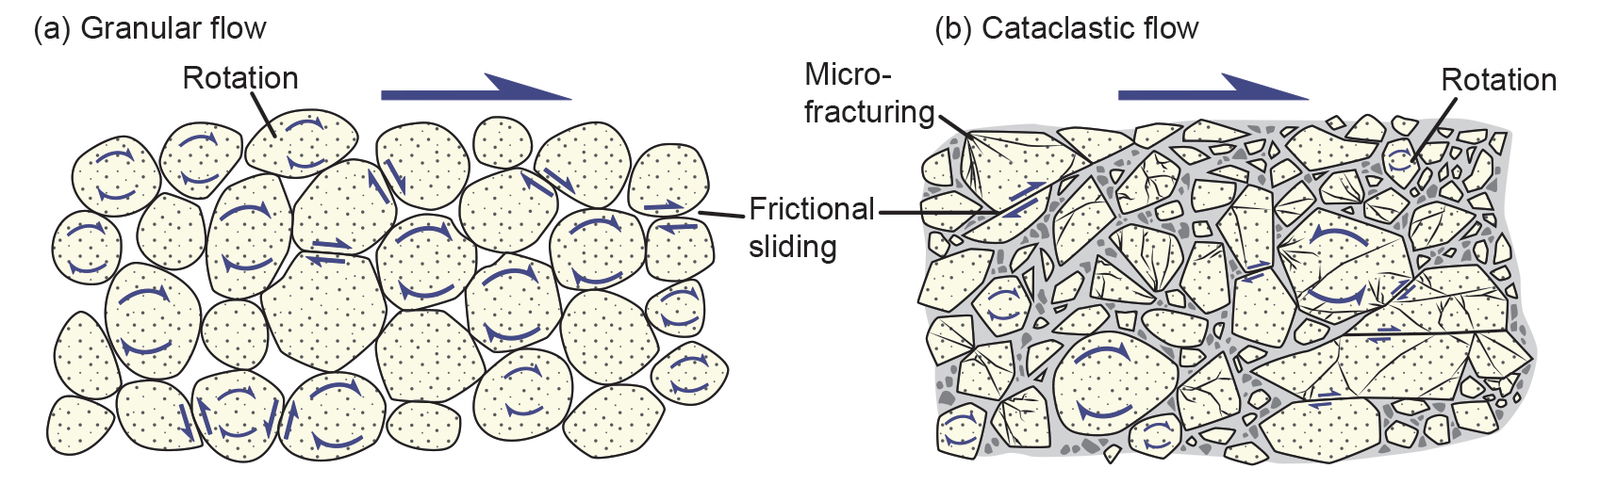
Fig. 16. Brittle deformation mechanisms (after Fossen 2016). (a) Granular flow is common during shallow deformation of porous rocks. (b) Cataclastic flow occurs during deformation of well-consolidated and brittle sedimentary and non-porous rocks.
There is much documentation of the grain shapes and rock fabrics/textures in undeformed and deformed sandstones, and to a lesser extent in limestones, in both field, laboratory and theoretical studies (Adams, MacKenzie, and Guildford 1984; Borg et al. 1960; Davis and Reynolds 1996; Etchecopar and Vasseur 1987; Friedman 1963; Gallagher et al. 1974; Hobbs 1968; Ingerson and Ramisch 1942; Jessell 1988a, b; Kamb 1959; Lister and Hobbs 1980; Lister, Paterson, and Hobbs 1978; Means 1990; Rowland 1946). There are also ample published studies on the effects on sand grains of their deformation under stress—deformation lamellae in any quartz grains and undulose extinction in any quartz grains under cross-polarized light (Bailey, Bell, and Peng 1958; Carter 1971; Carter, Christie, and Griggs 1964; Christie and Ardell 1974; Christie, Griggs, and Carter 1964; Davis and Reynolds 1996; Fairbairn 1939; Groshong 1988; Hansen and Borg 1962; Hansen, Borg, and Maxwell 1959; Mitra and Tullis 1979; Tullis, Christie, and Griggs 1973; Twiss 1974, 1976; Whisonant 1970; White 1973a, b). Attention also needs to be paid during thin section examination of the samples from the fold for any evidence of thermal effects on any quartz grains, and on the carbonate grains and matrix, such as recrystallization or conversion recrystallization or to metamorphic minerals (Carter, Christie, and Griggs 1964; Groshong 1988; Hobbs 1968; Lister and Hobbs 1980; Lister, Paterson, and Hobbs 1978; Mitra and Tullis 1979; Tullis, Christie, and Griggs 1973; White 1973a; Yardley, MacKenzie, and Guildford 1990).
Vernon (2018) and Wojtal, Blenkinsop, and Tikoff (2022) have provided details of the specific microstructures each of these mechanisms produces and which should be visible in petrographic examination of thin sections (fig. 17). Even though many of the illustrated examples they provide are from metamorphic rocks, the same observations are applicable to limestones, and in particular, potentially to those limestones of the Muav Formation within the Matkatamiba fold.
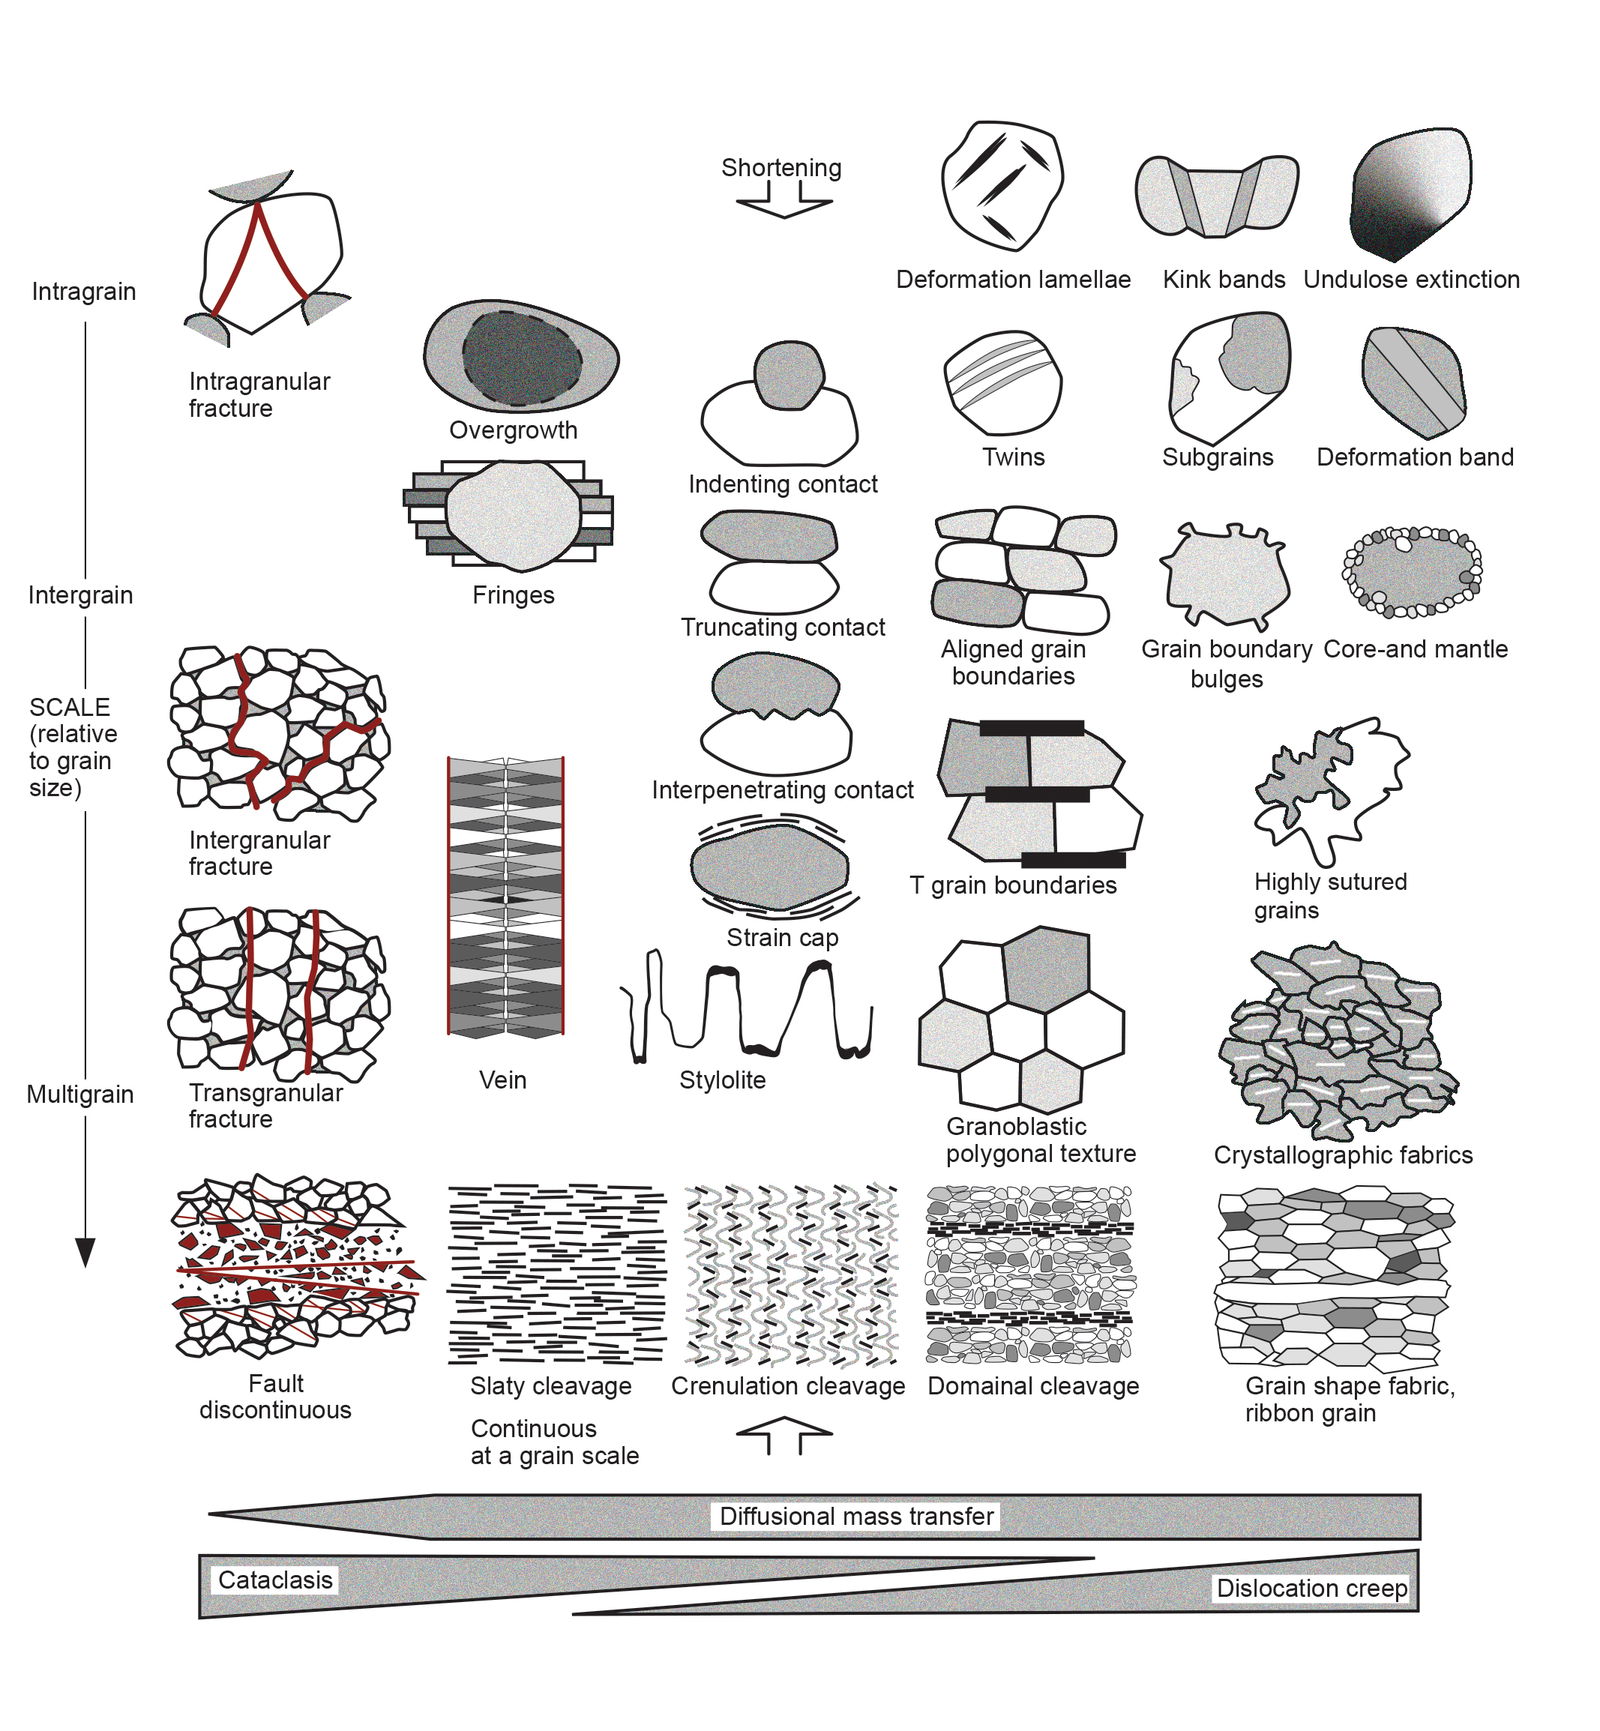
Fig. 17. A framework for analyzing secondary microstructures (after Wojtal, Blenkinsop, and Tikoff 2022). Microstructures within a grain (intragrain) are at the top, microstructures between adjacent grains (intergrain) are in the center, and microstructures involving many grains (multigrain) are at the bottom. Red lines indicate fractures. Microstructures are drawn in an orientation that shows vertical shortening. This diagram excludes asymmetric microstructures used for shear sense indicators.
Crystal Plasticity or Dislocation Creep
Crystal plastic flow is permanent deformation by non-cataclastic (ductile) flow, which involves slip (translation gliding) and/or deformation twinning, without loss of cohesion on the grain scale. These processes enable a grain to change its shape by allowing one part of the crystal to undergo shear with respect to a neighboring part (Hobbs, Means, and Williams 1976). Microstructural evidence of such crystal plastic deformation includes kink bands, deformation lamellae, and deformation twins (fig. 17).
These microstructures have been duplicated experimentally—for example, Carter, Christie, and Griggs (1964); Drury and Urai (1990); Etheridge and Hobbs (1974); Etheridge, Hobbs, and Paterson (1973); Griggs et al. (1960); Hirth and Tullis (1992); Hobbs (1968); Hobbs, McLaren, and Patterson (1972); Mares and Kroenenberg (1993); Tullis (1983); Tullis, Christie, and Griggs (1973); Wilson and Bell (1979). Individual grains may become very elongated or may become converted to stretched out aggregates of much smaller grains formed by recrystallization during deformation. The mechanisms of crystal plastic flow in mineral deformation are summarized by Barber (1985); Barber and Meredith (1990); Gottstein and Mecking (1985); Green (1992); Hobbs, Means, and Williams (1976); and Knipe (1989).
Slip (Translation Gliding)
Slip is the primary mechanism of deformation of rocks (Vernon 2018). It causes layers of a grain to slide past each other without fracturing and without changing the orientation of the slipped portion of the grain. Therefore, it cannot be detected in thin section, in contrast to deformation twinning in which a change of orientation is produced (fig. 18). However, the shape of the grain is changed in the slip process. Slip occurs on specific planes (commonly planes of dense atomic packing) and in specific directions in the crystal. A slip system is the combination of a slip plane and a slip direction in that plane. Slip systems have been determined for many minerals at various temperatures. Because of the crystallographic control of slip planes, ductile deformation of grain aggregates typically results in a strong crystallographic preferred orientation.
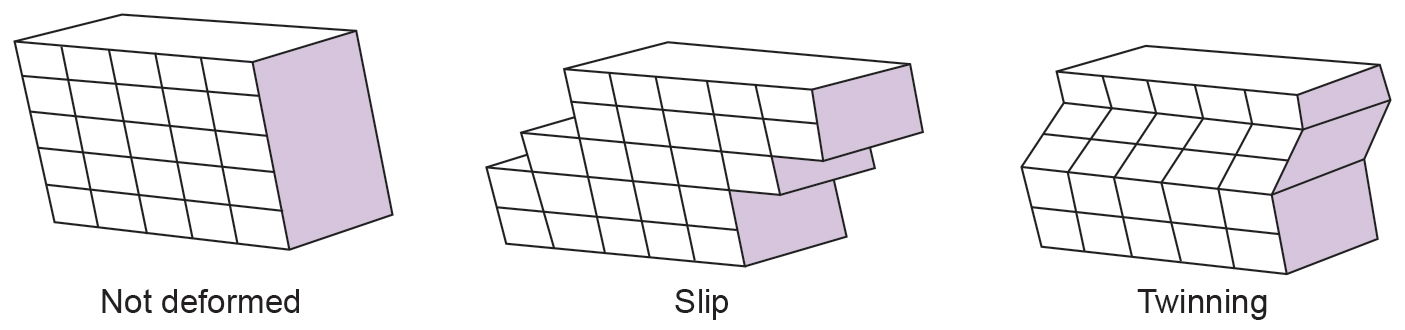
Fig. 18. Diagrams showing the general processes of slip and deformation twinning (after Vernon 2018). Note that twinning produces a change in orientation, which shows up as a change of color and/or birefringence under the microscope, but slip does not.
The ease with which a slip system operates depends on the strain rate and temperature (Vernon 2018). Some minerals with relatively high crystallographic symmetry, such as quartz and calcite, have several slip systems and can deform relatively easily over a range of conditions, especially at elevated temperatures of 400–600°C in the presence of water and above 700°C if dry. In contrast, many other minerals, such as mica and plagioclase, are of lower symmetry and may have only one dominant slip system, so they deform with greater difficulty. The more slip systems a mineral has, the more readily a grain of that mineral can change its shape in response to local differential stress. Minerals with at least five active independent slip systems can deform homogeneously by slip (Kelly and Groves 1970), quartz and calcite being common examples.
In grains of minerals with few slip systems, slip is commonly assisted by deformation twinning and kinking (fig. 17). In effect, a set of kink bands or of deformation twins acts as an additional independent slip system if repeated on a fine enough scale. Grains that are unfavorably oriented for slip may deform by fracturing and displacement along cleavages. Moreover, because of the common contrast between deformability of different minerals, local transient voids at grain boundaries may be relatively common, especially during deformation at lower temperatures. Those spaces may assist movement of fluid through the otherwise coherent rocks.
Slip takes place by movements of dislocations, as explained by Hobbs, Means, and Williams (1976) and Vernon (1976, 2000). Dislocations are line defects in which one row of atoms is decoupled from the rest of the lattice, effectively moving the dislocation through the solid crystal. The movement of dislocations through crystals enables solid crystalline materials to change their shapes without breaking. The stress on the mineral causes one row of atoms at a time to break. Then the next row breaks and the one behind it joins together again. So, successive rows break, one at a time, until the break (dislocation) moves right through the mineral grain, causing a displacement of one row of atoms. If many thousands of these minute displacements occur, they cause the mineral grain to change its visible shape. Each dislocation needs only a very small amount of energy, and the process does not require the mineral to change the overall arrangement of its atoms, so the mineral retains its identity during the deformation.
Kinking
Kinking occurs when slip on a single slip plane is inadequate to maintain homogeneous deformation (Vernon 2018). The grain sharply bends (kinks), and the deformation localizes into kink bands, which enable shortening of the grain to continue (fig. 17). The whole grain may divide into kink bands, or the kink bands may be separate and commonly lenticular, or wedge shaped. A kink band may be defined as part of a grain that undergoes rotation with respect to the unkinked part of the grain, the axis of rotation coinciding with the line of intersection of the kink band and the slip plane, perpendicular to the slip direction (Nicolas and Poirier 1976; Spry 1969).
Kink bands in a mineral grain are usually revealed by differences in absorption color, owing to their orientation differences. The widths and degrees of misorientation of the kink bands are variable, which distinguishes them from deformation twins, between which the misorientation is constant. By contrast, deformation lamellae are regularly-spaced “lines” across a mineral grain, while deformation twins are also regularly-spaced bands that can be lenticular (fig. 17). Broadly similar microstructures, reflecting heterogeneous deformation from one layer to another in a deforming grain but which cannot be described as kink bands according to their definition, are best referred to as deformation bands (Hobbs, Means, and Williams 1976; Spry 1969) (fig. 17).
Elongate sub-grains (extinction bands) formed by recovery in quartz are often referred to as “kink bands,” but should not be confused with kink bands formed by slip alone (Nicolas and Poirier 1976). Elongate sub-grains and true kink bands may be present in the same grain of quartz. Kinking is common in minerals with strongly anisotropic crystal structures and consequently only one slip plane, such as biotite, but also occurs in minerals with several slip systems, such as quartz (Christie, Griggs, and Carter 1964).
Deformation Lamellae
Deformation lamellae are narrow (0.5–10 µm), planar, crystallographically oriented zones with slightly different refractive index from that of the adjacent grain (Blenkinsop and Drury 1988; Carter 1971; Carter, Christie, and Griggs 1964; Christie, Griggs, and Carter 1964; Drury 1993; Green and Radcliffe 1972; Hobbs, Means, and Williams 1976; Turner 1948; White 1973b) (fig. 17). Deformation lamellae parallel to slip planes have been produced experimentally, but some natural deformation lamellae have complicated and variable structures and may not reflect slip alone.
Deformation lamellae generally are aligned perpendicular to extinction bands (elongate sub-grains). They are most common in quartz but have also been observed in plagioclase (Borg and Heard 1970) and calcite (Turner 1948). They tend to be formed most commonly during lower-temperature deformation. Deformation lamellae typically occur in one plane in quartz and may be slightly curved. They are generally visible due to their slightly different extinction and/or relief (refractive index) compared to the host grain and are often very closely spaced (on the order of their width) (Wojtal, Blenkinsop, and Tikoff 2022). They may be pervasive across a whole grain or localized into smaller domains. They form parallel to crystallographic planes (for example, parallel to the rhomb planes in quartz), and they may occur in more than one set in a grain.
Deformation Twinning (Twin Gliding)
Some minerals, such as calcite and plagioclase, undergo deformation twinning (mechanical twinning, secondary twinning, or twin gliding) in response to deformation (Vernon 2018) (figs. 17 and 18). The distribution of these twins within grains is typically heterogeneous. Deformation twinning operates by a limited amount of simple shear (at the microscopic scale, though it may be more complicated at the atomic scale) parallel to a glide plane (the twin plane) and in a particular direction (the glide direction), both of which depend on the crystal structure of the mineral, and which together constitute the twinning system. Thus, deformation twinning occurs in some minerals but not in others. In contrast to slip, the amount of deformation that can be achieved by twinning is limited by these requirements, especially because twins have only one sense of shear. Each atomic layer is sheared (not translated) by an amount sufficient to produce a mirror image of the original crystal (fig. 18). This restores the original structure, each half of the twin being misoriented symmetrically with respect to the other.
Twinning tends to be favored over slipping at lower temperatures and faster strain rates (Vernon 2018). Deformation (secondary) twins are distinguished from growth (primary) twins on the basis of their typically lenticular shapes. Deformation twins are always multiple, never simple, and have been produced experimentally in calcite and plagioclase (fig. 17). Deformation twinning is common in plagioclase, where it occurs according to two “twin laws,” namely, albite-law twinning and periclase-law twinning. Both of these twin laws are favored by the same local stress system, and so they tend to operate simultaneously (Vernon 1965). Another example is calcite (Paterson and Turner 1970). Burkhard (1993) reviewed deformation twinning in calcite, inferring that micro-twins and straight, narrow twins (< 1 µm thick) are characteristic of very low temperature deformation, whereas above about 100°C wider (> 1–5 µm), and fewer twins occur. Above ~200°C, curved twins, twins that are themselves twinned and completely twinned grains occur. And above ~250°C, older twins commonly show evidence of boundary migration. Deformation twinning also occurs in dolomite, and oxide minerals, such as rutile and hematite (Hennig-Michaeli 1977).
Hardening and Softening During Deformation
Broadly speaking, crystal plasticity may be divided into low- and high-temperature types (Vernon 2018). Low-temperature plasticity occurs at roughly half the melting temperature at laboratory strain rates and is dominated by glide of dislocations in slip planes. This leads to interference, tangling and hence immobilization of dislocations, causing the mineral to resist strain. Thus, the process is called strain hardening (strengthening). High-temperature plasticity is dominated by thermally activated recovery and recrystallization processes, which cause softening (weakening). The process involves untangling of dislocations, and consequently the mineral is able to continue to deform (creep) at relatively small differential stresses. The amount of strain accumulation depends on competition between strain hardening and recovery/dynamic recrystallization.
Plastic deformation at high temperatures (dislocation creep) is probably the main deformation process in the deeper parts of the earth’s crust (Yund and Tullis 1991). The resulting grains may show undulose (undulatory) extinction and sub-grains, sutured grain boundaries, and a pronounced shape and/or crystallographic preferred orientation. At very high temperatures, ductile grain-boundary sliding may occur. However, water-assisted cataclastic deformation may be responsible for some sub-grains and recrystallized grains in quartz that are optically identical to those commonly inferred to be due to dislocation creep (den Brok 1998).
Undulose Extinction and Sub-Grains
Undulose extinction is a smooth variation in the extinction position of a single grain when examined in cross-polarized light (Wojtal, Blenkinsop, and Tikoff 2022) (fig. 17). It is a very common feature of deformed rocks, especially in quartz and feldspar grains. The variation in extinction position indicates a variation in the orientation of the crystal lattice of the grain, affecting the polarizing direction of transmitted light and thus the extinction position of different parts of the grain. In moderately deformed grains, these undulose variations in the extinction position and thus lattice orientation are commonly localized into sub-grains, which are intracrystalline domains where the lattice orientation may vary by up to 10° from the rest of the grain (White 1977). This upper limit to the lattice misorientation for sub-grains distinguishes a sub-grain that forms within grains from two separate grains.
Sub-grains may have relatively planar walls in crystallographically controlled directions (fig. 17). In quartz, the basal (perpendicular to the sides of the hexagonal shape seen in large quartz crystals) and prism (parallel to the sides of the hexagonal crystal shape) planes are common sub-grain boundaries. If both directions have developed, the resulting effect is a pattern of square or rectangular domains of contrasting extinction, which is called a chessboard pattern of sub-grains (Wojtal, Blenkinsop, and Tikoff 2022). Some sub-grains have distinctly tabular shapes that define deformation bands (fig. 17). If the sub-grain boundaries are sharply defined and straight, they can be referred to as kink bands. Deformation lamellae are also tabular features but restricted to very small widths.
Diffusion Creep
Diffusion creep (diffusive mass transfer) involves change of grain shape by diffusion of chemical components, either in aqueous solution (stress-induced solution transfer or dissolution-precipitation creep) or by solid-state diffusion along grain boundaries (grain-boundary diffusion or Coble creep) or through crystals (volume diffusion or Nabarro-Herring creep), which requires high temperatures (Fossen 2016; Vernon 2018; Wojtal, Blenkinsop, and Tikoff 2022) (fig. 19). In both cases, vacancies in the atomic lattice of the minerals move toward high-stress sites so that the minerals accumulate strain over time. Stress-induced solution transfer (also called pressure solution) is equivalent to Coble creep in dry rocks (Wheeler 1992). Typically, material is removed from sites of high normal compressive stress and deposited at low-stress sites, with the result that a volume of rock changes its shape (Rutter 1976).
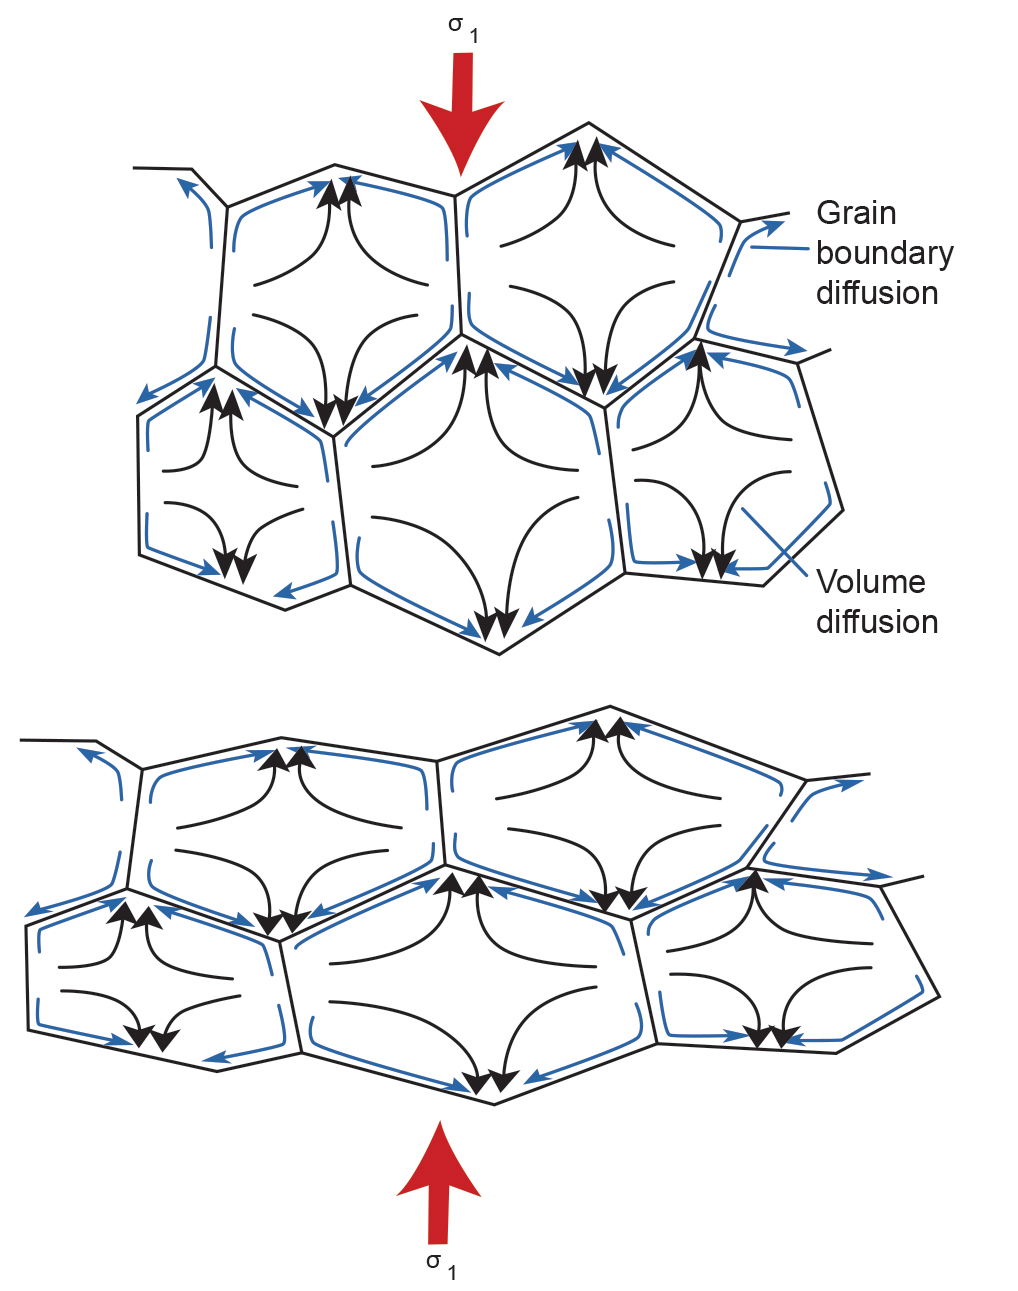
Fig. 19. Diffusion in a mineral can occur within grains by means of volume diffusion, or along grain boundaries by means of grain-boundary diffusion (after Fossen 2016). In both cases crystal lattice vacancies move toward high-stress sites so that the minerals accumulate strain over time. Note that the atoms involved move in the opposite way.
The term “pressure solution” strictly refers to the actual dissolving of minerals, and so the term “solution-transfer” has been proposed for the overall process of solution, transfer and redeposition of chemical components (Durney 1972). A preferable term is “stress-induced solution transfer” (Passchier and Trouw 1996), which emphasizes the necessity of deformation in the process. The term “dissolution-precipitation creep” or simply “solution-precipitation creep” (den Brok and Spiers 1991) also implies a deformation-controlled process.
Stress-induced solution transfer (dissolution-precipitation creep) is especially effective at low metamorphic grades and produces microstructures such as truncated detrital grains, truncated ooliths, truncated fossils, truncated pebbles, stylolitic surfaces, tectonic overgrowths, and “beard” structures (Cox and Etheridge 1982; McClay 1977; Powell 1982 [fig. 17]). However, the process can also occur in
- the deformation of high- and medium-grade metamorphic rocks, producing veins and beard structures (Wintsch and Yi 2002),
- during fluid-assisted “superplastic” deformation (ductile grain-boundary sliding), and
- especially in ductile shear zones.
McClay (1977) estimated that stress-induced solution transfer in fine-grained quartz and calcite rocks can produce geologically reasonable strain rates at 200–300°C and that Coble creep in calcite rocks can produce geologically reasonable strain rates at around 300°C.
Microstructures generally taken to indicate diffusion creep in deformed rocks include equant grain shapes, indented grains, overgrowths, and a lack of crystallographic preferred orientation (Bons and den Brok 2000) (fig. 16). However, crystallographic preferred orientations resulting from crystallographic orientation-dependent dissolution and growth have been described for naturally deformed quartz-rich rocks (Becker 1995), and for experimentally deformed quartz rocks (den Brok 1996). Additionally, modeling by Bons and den Brok (2000) has indicated that dissolution-precipitation creep may be important in the development of crystallographic preferred orientations in rocks, and thus, the presence of a crystallographic preferred orientation alone cannot be used as evidence for dislocation creep.
Diffusion creep can grade into ductile grain-boundary sliding, and frictional grain-boundary sliding (during brittle deformation) (Vernon 2018). An example is provided by deformation experiments on fine-grained (2–10 µm) albite (plagioclase) with a small amount of water (< 1%) in which the deformation changed directly from cataclastic flow to grain-boundary diffusion creep with increasing temperature and decreasing strain rate, without any intermediate dislocation creep (Tullis and Yund 1987, 1991). The resulting microstructures include rectangular grain shapes, overgrowths of different composition from the original grains and low concentrations of dislocations (Tullis and Yund 1991).
Den Brok (1998) has shown that rates of stress-induced solution transfer depend on micro-cracking, which may increase greatly with sudden increase in stress or fluid pressure. This can enhance grain-boundary diffusion rates and cause rock weakening. Stress-induced solution transfer tends to predominate at lower temperatures, at which diffusion occurs more readily than dislocation creep. But dislocation creep tends to swamp stress-induced solution transfer at higher temperatures (Wheeler 1992). However, because diffusion occurs along grain boundaries, stress-induced solution transfer is accentuated by finer grain sizes and so can dominate dislocation creep, even at the higher temperatures of the lower crust, where dislocation creep would otherwise predominate. Calculations made by Wheeler (1992) also suggest that stress-induced solution transfer is more effective in polymineralic rocks than in single-mineral aggregates, owing to chemical interactions during the deformation.
Ductile Grain-Boundary Sliding
Grain-boundary or frictional sliding and fracturing during granular flow are characteristic features of brittle deformation (Fossen 2016) (fig. 16). However, a distinction is drawn between intergranular fracturing, intragranular fracturing, frictional sliding on fractures and grain boundaries, and grain rotation, which in combination are due to cataclastic flow (figs. 16 and 17). In contrast, granular flow, which is characterized by grain rotation (or rolling) and frictional grain-boundary sliding, is only intergranular deformation in that there is no permanent internal deformation of the grains. It occurs at very shallow depths on porous sediments such as weakly consolidated sandstone or limestone buried at less than ~1,000 m (~3,300 ft) depth. It involves deformation in a shearing mode or in response to vertical loading (compaction). In these processes, if the stresses across grain contacts become high enough it may cause the sedimentary rock’s grains to fracture. Those fractures are confined to individual grains and are therefore intragranular microfractures. Under low pressure conditions and with small grain contact areas microfractures may form close to the grain surfaces, commonly chipping small flakes off of the surfaces of the grains (fig. 20). This microfracturing is referred to as spalling or flaking. At higher confining pressures, corresponding to depths in excess of ~1,000 m (~3,300 ft), fractures can split the grains into more evenly sized parts, and the mechanism is known as transgranular fracturing. Once fractured, the grains reorganize themselves by frictional sliding and rotation, leading to porosity reduction.
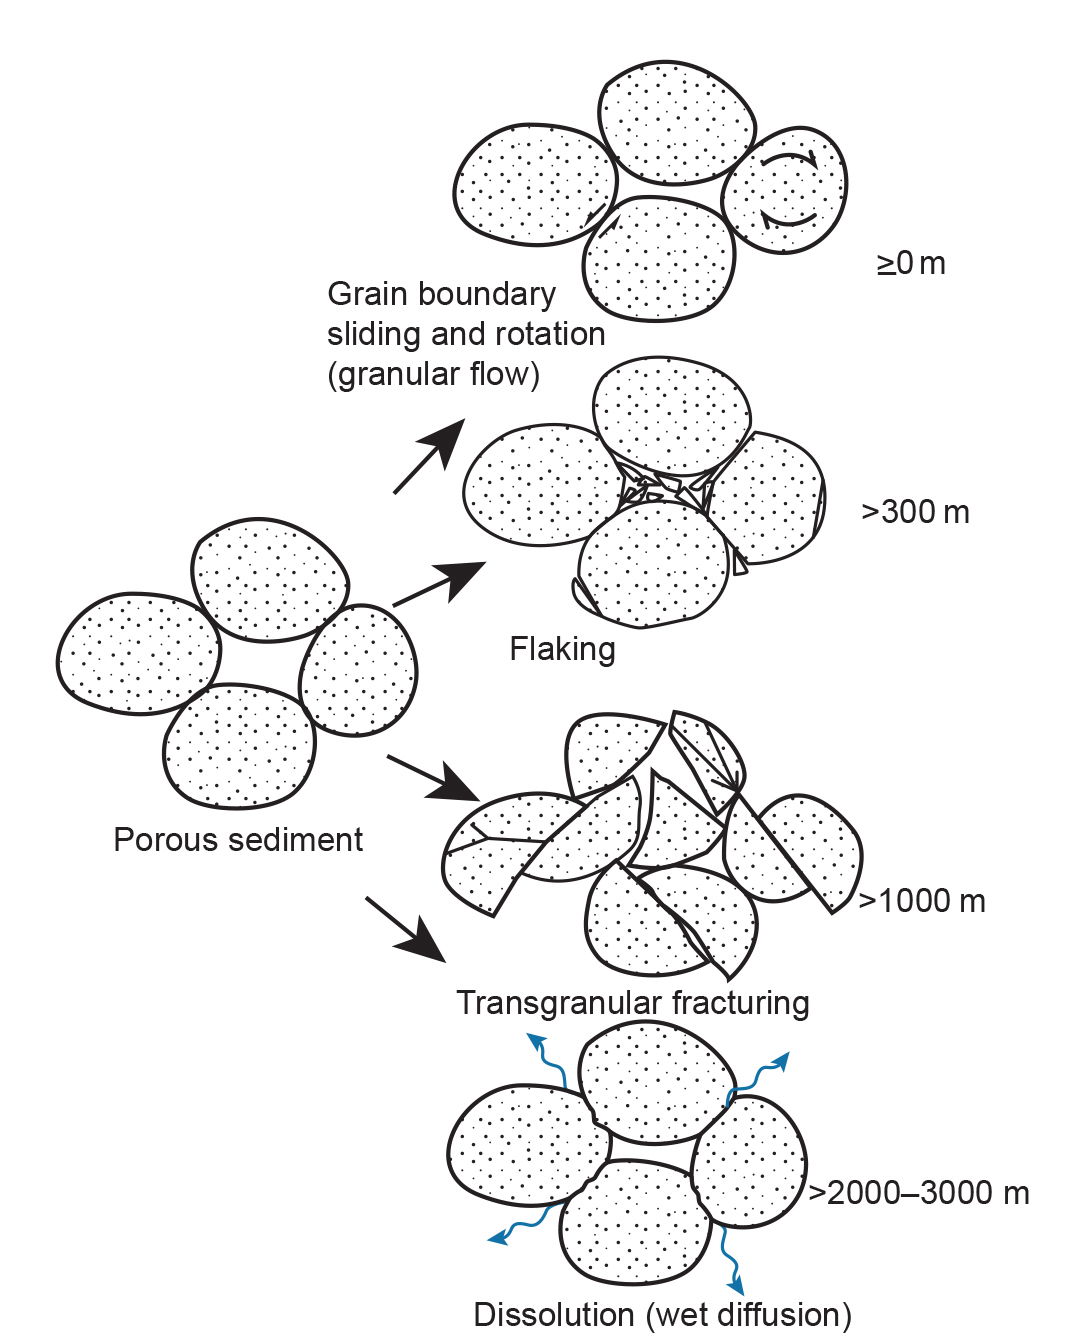
Fig. 20. Deformation mechanisms operative at shallow depths (after Fossen 2016). Very approximate depths are indicated.
However, grain-boundary sliding also occurs during ductile deformation (Wojtal, Blenkinsop, and Tikoff 2022). Some very fine-grained polyphase metal alloys, at certain temperatures (at least half the melting temperature) and strain rates, can be deformed experimentally in tension up to strains of more than 1,000% without fracturing (Vernon 2018). This is referred to as superplastic deformation (grain size-sensitive flow). The mechanism involved is grain-boundary sliding, which involves relative grain movement without loss of cohesion and normally in the absence of fluid. Resulting potential gaps between grains are filled by diffusive mass transfer (Ashby and Verall 1973; Edington, Melton, and Cutler 1976; Nicolas and Poirier 1976; Poirier 1985; Schmid, Boland, and Paterson 1977), dislocation motion (Tullis 1983), or both these processes (Kenkmann and Dresen 2002), and so the aggregate remains coherent.
Superplasticity is a state in which solid crystalline material is deformed well beyond its usual breaking point, usually over about 600% of its breaking point during tensile deformation, which is usually achieved at high temperature. The mechanisms of superplasticity are still debated, but the consensus is that it relies on atomic diffusion and the sliding of grains past each other (grain-boundary sliding). Superplasticity has been proposed for quartz (Behrmann 1985; Behrmann and Mainprice 1987; Boullier and Guegen 1975), calcite (Behrmann 1983), and feldspar (Allison, Barnett, and Kerrich 1979). Some have suggested that normal crystal plasticity can change rapidly to superplasticity below a critical grain size (Behrmann 1983; Schmid, Boland, and Paterson 1977), possibly in millimeter-scale domains (Behrmann and Mainprice 1987).
However, it is not easy to determine the extent to which superplasticity occurs in natural rock deformation (Gilotti and Hull 1990). The following microstructural features have been suggested as indicators of superplastic behavior in rocks (Boullier and Guegen 1975; Schmid 1982):
- grains remaining equant, even after large accumulate strains,
- very small grain size around 1–10 µm, and
- moderate concentrations of dislocations without dislocation cells (that is, no sub-grains).
However, small grain sizes and equant grains are also compatible with dynamic recrystallization during dislocation-induced flow (Schmid 1982; White 1977) so that superplasticity generally cannot be inferred with confidence from microstructure alone. Another characteristic feature of superplasticity may be the absence of strong preferred orientation, since diffusion-accommodated grain-boundary sliding tends to weaken existing preferred orientations, in contrast to aggregates recrystallized dynamically, which typically have crystallographic preferred orientations. However, the lack of strong preferred orientation cannot always be taken to imply superplasticity, because static recrystallization may or may not reduce the strength of preferred orientations produced during dynamic recrystallization (Law 1990). Thus, more general terms such as “non-cataclastic grain size-sensitive flow” or “non-cataclastic granular flow” (Stünitz and Fitz Gerald 1993) would better describe natural deformation.
In some rocks, non-cataclastic grain size-sensitive flow may be promoted by the formation of transient, fine-grained reaction products in metamorphic reactions, or by fluid, which assists diffusion and results in a kind of high-temperature pressure solution (Mukai et al. 2014; Tullis and Yund 1991; Tullis, Yund, and Farver 1996). This can be called fluid-assisted diffusion creep. Experiments deforming fine-grained feldspar aggregates have shown that fluid occurring in pores at hydrostatic conditions spreads along grain boundaries during deformation, causing a change from dislocation creep to diffusion creep with consequent reduction in strength (Tullis, Yund, and Farver 1996). Because minerals continuously dissolve in and precipitate from the fluid as deformation proceeds, microstructural evidence of fluid-assisted diffusion creep may be difficult or impossible to distinguish from other forms of grain-sensitive flow. However, rectangular grain shapes and compositionally different grain overgrowths have been observed in high-temperature diffusion creep experiments on fine-grained sodic plagioclase (Tullis and Yund 1991). Fluid-assisted ductile grain-boundary sliding should be conceptually distinguished from frictional grain-boundary sliding, which involves not only intergranular fluid, but also rotation of discrete fragments, rather than maintaining a coherent aggregate during deformation.
Conditions favoring various deformation mechanisms
Different deformation mechanisms dominate at different conditions of temperature, pressure, strain rate, differential stress, grain size, fluid content and fluid composition, though several deformation mechanisms may operate simultaneously, even if one dominates (Vernon 2018) (fig. 17). For example, higher confining pressure and lower fluid pressure tend to promote dislocation creep over cataclastic behavior, and larger grain sizes tend to favor dislocation creep and deformation twinning, owing to greater ease of accommodation of strain produced by these processes at grain boundaries, compared with the situation in finer-grained aggregates.
The different deformation mechanisms that are operative in a deforming mineral under various physical conditions can be expressed by means of a deformation mechanism map of stress versus temperature contoured for a range of strain rates (Rutter 1976) (fig. 21). Deformation mechanism maps show the range for which a particular deformation mechanism dominates. They are partly based on experimental data that have been extrapolated into geologically realistic strain rates and temperatures, and partly on theoretical considerations (Fossen 2016). The example in fig. 21 is for quartz. Realistic natural strain rates are indicated in yellow. It should be noted that such maps are hampered by many uncertainties and limited data availability.
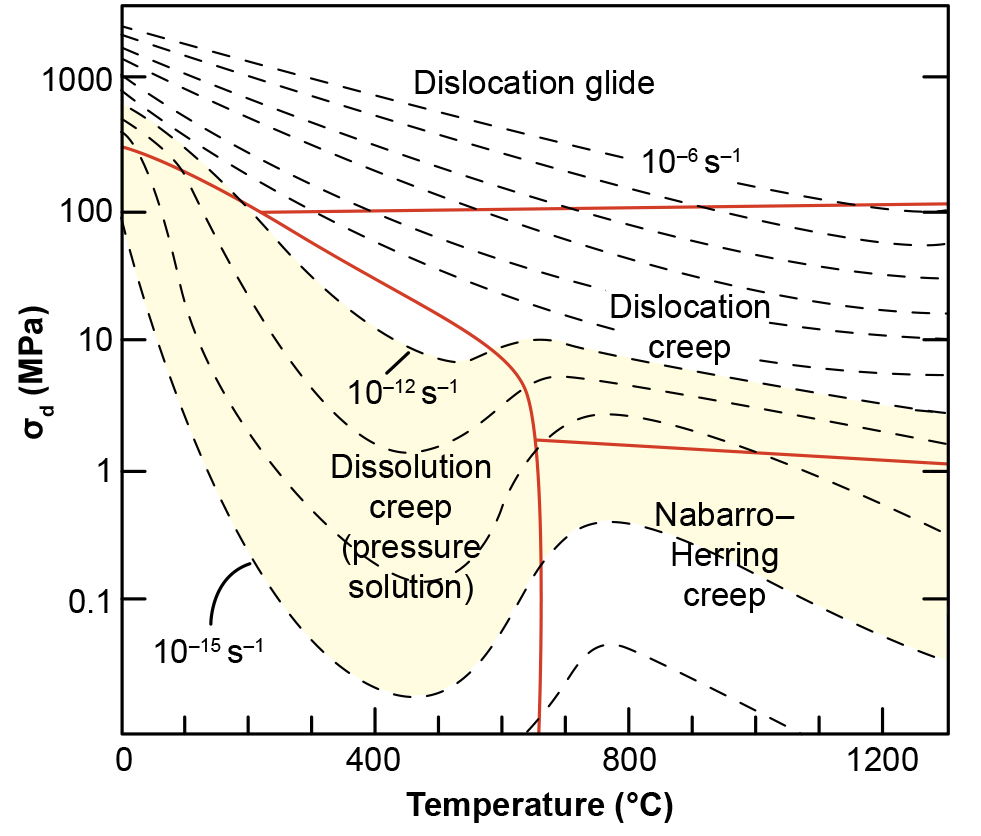
Fig. 21. A stress-temperature deformation mechanism map for quartz (after Rutter 1976). Realistic natural strain rates are indicated in yellow (10-12–10-15 s-1).
Experiments have shown that the main factors favoring ductile flow of solid dry rocks are (Vernon 2018):
- high confining pressure, which makes it difficult for the rock to expand and hence break during deformation,
- high temperature, which allows dislocations to move freely through minerals, and
- slow application of the deforming force, which gives the dislocations enough time to move.
Therefore, in dry rocks, flow tends to dominate in the deeper parts of the earth’s crust, where rocks are hot and under high-confining pressures. Generally, fractures dominate at depths of less than ~15 km (~9 mi), the brittle-ductile boundary, and flow dominates at greater depths, though many exceptions occur, and the conditions vary with the minerals concerned. For example, quartz tends to be ductile at lower temperatures than feldspars, probably because of its lower melting temperature.
Microstructural evidence of dynamic recrystallization is generally taken to indicate relatively high temperature, but the temperature varies greatly with the mineral. For example, though calcite typically undergoes ductile deformation and dynamic recrystallization at greenschist facies or higher temperatures (Busch and van der Pluijm 1995; Rutter 1976; Vernon 1981), these processes can also occur in calcite in temperatures as low as 150–250°C (Kennedy and White 2001).
Fluids are also important. For example, small amounts of water in the crystal structure increase the ductility of quartz. However, water films on grain boundaries may block atomic bonding between grains and so reduce the “effective pressure,” leading to fracturing and brittle deformation. Nevertheless, water may assist diffusive flow in fine-grained calcite aggregates deformed at low differential stress (Rutter 1974), and greatly assists grain-boundary migration crystallization (Mancktelow and Pennacchioni 2004).
The overall situation, summarized by Wintsch and Yi (2002), is that at geological strain rates in quartz-rich rocks, brittle deformation dominated by fracture mechanisms changes to deformation by dislocation creep at ~200°C. In plagioclase, brittle-to-ductile transition occurs at ~450°C. If water is present, a field of stress-induced solution transfer displaces dislocation creep at 200–300°C. Wintsch and Yi (2002) inferred that, though biotite and quartz deformed by dislocation creep, most of the deformation was accommodated by deformation-enhanced dissolution of minerals at grain boundaries perpendicular to the shortening direction (evidenced by truncated zoning patterns in plagioclase and orthoclase) and precipitation in the form of beards (or fringes in fig. 17) on the ends of grains that face the extension direction. Thus, solution-precipitation creep can accompany and even dominate over dislocation creep at high temperatures in the presence of water. However, quartz microstructure and crystallographic preferred orientation are also sensitive to other variables, such as strain rate and water weakening, as pointed out by Law (2014).
Recovery and Recrystallization
During deformation, dislocations in different slip planes can interfere with each other and form “tangles,” which inhibit their movement and hence further deformation of the mineral (strain strengthening or strain hardening). Recovery and recrystallization are processes that tend to reduce the concentration and/or tangling of dislocations, and so produce volumes of material capable of continued deformation (Vernon 2018; Wojtal, Blenkinsop, and Tikoff 2022). Thus, ductile deformation is a competition between strain strengthening (hardening) and recovery processes.
Recovery includes all processes that attempt to return a crystal to the undeformed state without the formation of high-angle (high-energy) boundaries (Hobbs, Means, and Williams 1976). In other words, no new grains are formed. Recovery may be dynamic or static, depending on whether or not it occurs during or after deformation, respectively.
During recovery, dislocations free themselves from tangles by dislocation “climb” (the movement of edge dislocations out of their slip planes by the addition or loss of point defects, which is a heat-activated process), and by dislocation “cross-slip” (the movement of screw dislocations from one slip plane to another) (Vernon 2018). Both these processes untangle dislocations and so reduce the amount of strain strengthening. The freed dislocations migrate to form sub-grain boundaries, which become “walls” of organized dislocations (Hobbs, Means, and Williams 1976; Spry 1969). This leaves relatively strain-free volumes (sub-grains) between the sub-grain boundaries so that further deformation can proceed.
Optically, sub-grain boundaries tend to be relatively evenly spaced and show small misorientation angles (Vernon 2018). Bending of grains, presumably involving dispersed dislocations, produces undulose (undulatory) extinction, which grades into slightly misoriented sub-grain boundaries. A maximum misorientation of 10° is often taken as a rough guide for sub-grains in quartz (White 1977). Larger misorientations produce grain boundaries. Precise distinction between sub-grain and grain boundaries on the basis of dislocation arrangements requires transmission and scanning electron microscopy (TEM and SEM).
However, slightly misaligned fragments that optically resemble sub-grains can be formed by micro-fracturing (Lloyd and Freeman 1994; Urai, Means, and Lister 1986). Yet normally such microfractures are formed in the presence of fluid, and thus sub-grains of this type potentially may be recognized by the presence of healed lines of fluid inclusions along the sub-grain boundaries, provided it can be ascertained that the inclusions were not formed along microfractures that developed along existing sub-grain boundaries.
The optical relief of sub-grain (low-angle) boundaries generally is not as marked as with grain (high-angle) boundaries, and together with the small mis-orientations, makes it clear that the sub-grains occur within grains (hence the name). Sub-grains may be equant or elongate. Elongate sub-grains form perpendicular to slip planes and appear optically as “extinction bands” at high angles to the slip planes. Sub-grains have been observed in a variety of minerals, including quartz (Hobbs, Means, and Williams 1976), calcite (Vernon 1981) and plagioclase (Fitz Gerald, Etheridge, and Vernon 1983; Vernon 1975).
Recrystallization involves the formation of strain-free volumes inside deformed grains by the creation and/or movement of grain boundaries in response to deformation (Vernon 2018; Wojtal, Blenkinsop and Tikoff 2022). During recrystallization, strain energy is reduced by:
- migration of existing high-angle (high-energy, random, irrational) grain boundaries, kink-band boundaries, or twin boundaries,
- development and migration of new high-angle grain boundaries (excluding kink-band boundaries and fractures), and
- development of new low-energy crystal faces, all in the same mineral.
A generally applicable definition of recrystallization is the development and/or migration of high-angle (random) grain boundaries or crystal faces in solid state in response to deformation and in the same mineral.
Recrystallization typically produces aggregates of new (recrystallized) grains that are strain free and therefore capable of continued deformation (Vernon 2018). The new grains may be:
- polygonal in minerals with relatively uniform three-dimensional lattice structures, such as quartz, feldspar, and calcite (fig. 17),
- crystals with low-energy faces in minerals with strongly anisotropic lattice structures, such as mica (Bell 1978; Etheridge and Hobbs 1974; Vernon 1977b), or
- irregularly shaped where grain-boundary migration recrystallization is the dominant process.
However, recrystallization does not involve the production of new minerals, although small compositional changes between new and old grains commonly occur in minerals with complex compositions (for example, Etheridge and Hobbs 1974; Vernon 1975, 1977a). Stünitz (1998) has shown that differences in composition between old and recrystallized plagioclase grains can contribute to the driving force for recrystallization.
Nucleation of new grains during recrystallization generally does not involve the formation of completely new grains (that is, from new nuclei developed randomly within old grains), but typically involves either sub-grain rotation or strain-induced grain-boundary migration (“bulge nucleation”). However, both processes can produce similar microstructures (Lloyd and Freeman 1994), and microfracturing can produce slightly misaligned fragments that optically resemble sub-grains (den Brok and Spiers 1991; Lloyd and Freeman 1994; Urai, Means, and Lister 1986). The following three processes are involved in recrystallization.
Sub-grain rotational recrystallization (Hobbs 1968; Poirier and Guillopé 1979) occurs when dislocations accumulate in sub-grain boundaries, causing the boundaries to progressively increase their complexity and misorientation. When a dislocation is added to a sub-grain boundary it changes the angle mismatch between the two sub-grains. By this process, sub-grain boundaries become grain (high-energy, high-angle) boundaries. It involves progressive crystallographic mis-orientation with limited grain-boundary migration, so that orientation relationships between the old and new (recrystallized) grains may be recognized (Hobbs 1968; Vernon 1975). Sub-grains leading to recrystallization have been observed in quartz (Hobbs 1968; Tullis, Christie, and Griggs 1973), calcite (Vernon 1981), K-feldspar (Altenberger and Wilhelm 2000; Bell and Johnson 1989), and plagioclase (Bell and Johnson 1989; Dornbusch, Weber, and Skrotzki 1994; Vernon 1975). Photographic evidence under the microscope of progressive rotation of sub-grains to produce new (recrystallized) grains during deformation of transparent minerals has been presented by Means and Xia (1981) and Means (1989).
Recrystallization by strain-induced grain-boundary migration involves differential migration of parts of a high-angle boundary, such as a grain boundary, kink-band/deformation-band boundary, or a deformation-twin boundary (Vernon 2018). The migration occurs by diffusion of atoms across the boundary, which consequently moves in the opposite direction to the diffusion direction and forms a “bulge.” Strain-induced grain-boundary migration is driven by strain energy differences (differences in the dislocation concentration) on either side of the grain, kink-band, or twin boundary. The process tends to relax gradients in strain (recrystallization) and/or composition. So, as the boundary moves into a deformed grain it leaves undeformed mineral behind it. The microstructural result is a sutured (bulged) grain boundary, kink-band boundary, or deformation-twin boundary, with markedly smaller new grains along the boundary (fig. 17). The process occurs at low temperatures in quartz and calcite (Drury, Humphreys, and White 1985; Schmid, Panozzo, and Bauer 1987; Schmid, Paterson, and Boland 1980).
Sutured grain boundaries, kink-band boundaries and twin boundaries have been observed in a wide variety of minerals including quartz, plagioclase and calcite (Vernon 1981), and K-feldspar (Altenberger and Wilhelm 2000) (fig. 16). In minerals with relatively isotropic crystal structures (quartz, feldspar, calcite), strain-induced grain-boundary migration produces equant new grains, whereas in minerals with strongly anisotropic crystal structures (sheet silicates such as micas), it produces aggregates of elongate new grains.
Poirier and Guillopé (1979) have pointed out that trace amounts of water increase the rate of grain-boundary migration, even in anhydrous minerals such as quartz (Green, Griggs, and Christie 1970). They suggested that water may enhance grain-boundary mobility by increasing the glide and/or climb mobility of grain-boundary dislocations, in the same way as it appears to induce easier glide or climb of lattice dislocations (Griggs 1974; McLaren and Retchford 1969).
Though bulges in grain boundaries commonly appear rounded (except for minerals such as sheet silicates), long-lasting strain-induced grain-boundary migration at relatively high temperature can lead to a stepped rather than smooth sutured interface (Kruhl 2001; Kruhl and Peternell 2002). The steps or sharp deflections appear to be due to crystallographic control, such as the formation of rhombohedral planes in quartz (Masberg, Hoffer, and Hoernes 1992).
Grain-boundary migration recrystallization (fast grain-boundary migration) is a more pronounced form of grain-boundary bulging that occurs during recrystallization (Vernon 2018). It has been observed in materials progressively deformed under the microscope (Means 1989; Urai 1983). The process produces bulges with long wavelengths of the order of the grain size, which migrate through the aggregate, continuously converting parts of it from one lattice orientation to another. These changing “orientation domains” move through the aggregate in a complex way, leading to irregular grain shapes, though locally interfaces may have marked steps, suggesting crystallographic control, especially if fluid occurs along the grain boundaries. Though no new grains are produced, some can be removed or dissected, and others can coalesce or amalgamate by progressive reduction of misorientation. The process affects large areas, so that original grains may be completely consumed (Urai, Means, and Lister 1986). Fast grain-boundary migration can change rapidly to slow grain-boundary migration and vice versa, owing to sudden changes in the grain-boundary structure or the absorption of impurities (Urai 1983).
Grain-boundary migration recrystallization occurs at relatively high temperatures (amphibolite facies) in quartz and calcite (Schmid and Casey 1986; Schmid, Panozzo, and Bauer 1987; Schmid, Patterson, and Boland 1980; Stünitz and Fitz Gerald 1993). However, the process is also promoted by water on the migrating boundaries (Mancktelow and Pennacchioni 2004). This interpretation is supported by experiments in which fluid-assisted grain-boundary migration recrystallization can produce new grains with crystal faces (Urai 1983; Urai, Means, and Lister 1986). In wet samples, a continuous fluid film occurs along the migrating boundary, incorporating fluid inclusions as it moves. The boundary migration occurs by dissolution of the grain with the higher dislocation concentration, diffusion through the fluid film, and precipitation on the other grain.
In principle, recrystallization may occur either during deformation (dynamic recrystallization or syndeformational recrystallization) or after deformation (static recrystallization), which is equivalent to static grain growth (Vernon 2018). Static recrystallization has been inferred to occur if temperatures remain high enough for grain-boundary migration after strain rates decrease (in which case it could modify microstructures formed by dynamic recrystallization).
Dynamic recrystallization of low-melting-temperature minerals has been observed directly in in situ experiments under the microscope (Vernon 2018). Such studies have enabled detailed observation of grain-boundary movements and changes in grain shapes with progressive deformation and recrystallization. For example, Urai (1983) found that:
- dynamically recrystallized grains do not necessarily have undulose extinction,
- recrystallization may occur by grain and twin-boundary migration (bulge nucleation) and progressive misorientation of sub-grains,
- recrystallization may occur along fractures,
- grain boundaries may progress and regress cyclically,
- one grain may be cut up into two grains by grain-boundary movement,
- two grains may coalesce into one,
- incomplete elimination of serrations may lead to the preservation of “leftover grains,”
- bimodal grain-size distributions may form, and
- “orientation families” of grains with similar orientations may develop, owing to different rates of boundary migration in different directions.
White (1977) suggested that dynamically recrystallized grains can be recognized by the presence of sub-grains, deformation bands and deformation lamellae, in contrast to optically strain-free new grains expected from static recrystallization. Even though Urai (1983) and Urai, Means, and Lister (1986) found that dynamically recrystallized grains do not necessarily have undulose extinction, new (recrystallized) grains with undulose extinction are at least consistent with dynamic recrystallization. In fact, any evidence of deformation in new (recrystallized) grains is diagnostic of dynamic recrystallization, such as optically-observable sub-grains. Similarly, orientation families, that is, groups of several apparently independent grains with identical crystallographic orientations, may also be reliable indicators of dynamic recrystallization. Furthermore, while aggregates of relatively coarse-grained, optically strain-free polygonal grains have been interpreted as indicating static recrystallization, strain-free grains have also been produced by dynamic recrystallization in experiments (Urai, Means, and Lister 1986). And one potentially useful microstructural feature is the observation that boundaries of grains developing during strain-induced grain-boundary migration (dynamic recrystallization involving bulge nucleation) grow away from their centers of curvature, whereas the reverse applies to static grain growth.
In both sub-grain rotation and strain-induced grain-boundary migration, new grains are smaller than the original deformed grains, so that grain size reduction is typical of dynamic recrystallization (Vernon 2018; Wojtal, Blenkinsop, and Tikoff 2022). New grains tend to be much smaller at lower temperatures (250–300°C for quartz and 400–450°C for feldspar) and/or fast strain rates. Indeed, at relatively low temperatures (200–300°C for quartz and 400–500°C for feldspar) and/or fast strain rates, recrystallization mainly involves grain-boundary migration, which involves bulging of grain boundaries in response to variable dislocation concentrations, forming small strain-free grains. However, grain-boundary migration recrystallization is restricted to the relatively high temperatures of amphibolite facies conditions for quartz and calcite (Fitz Gerald and Stünitz 1993; Schmid and Casey 1986; Schmid, Panozzo, and Bauer 1987; Schmid, Patterson, and Boland 1980) and granulite facies conditions for feldspar (Lafrance, John, and Scoates 1996).
Experimental studies on quartz aggregates have identified three regimes of dislocation creep, defined by different mechanisms of dynamic recrystallization (Hirth and Tullis 1992; Tullis et al. 2000). These regimes operate at different temperature-strain rate conditions and produce different microstructures, which have also been recognized in naturally-deformed quartzites. However, they form at much lower temperatures, owing to presumed slower natural strain rates.
Regime 1 occurs at the lowest temperatures of deformation and is characterized by difficult dislocation climb, low grain-boundary mobility and high dislocation-density contrasts between different grains. Dislocation glide is accommodated by recovery and strain-induced grain-boundary migration (bulging recrystallization) at slow rates, producing very small bulges. The bulging occurs mainly at triple junctions and along fractures, if present. Regime 2 is characterized by recrystallization involving progressive sub-grain rotation and occurs at intermediate temperatures. Regime 3 is characterized by grain-boundary migration recrystallization at fast rates and occurs at high temperatures. During this recrystallization whole grains may be swept clear of dislocations, and sub-grain rotation is only important for the initial formation of new grains.
Deformation of Polymineral Aggregates
Ductile behavior of minerals and rocks is generally defined as the capacity to deform without fracturing on the grain scale (Passchier and Trouw 1996; Vernon 2018). However, ductility has also been defined as “the capacity for substantial change of shape without gross fracturing” (Paterson 1978). The latter definition refers to megascopic or macroscopic flow and is independent of the microscopic mechanisms of deformation, which can include not only crystal plasticity and diffusional flow (which maintain cohesion at the microscopic scale) but also cataclastic (microscopically brittle) mechanisms. In other words, based on that definition, a rock can be ductile on the scale of a hand specimen or outcrop but partly brittle on the microscopic scale.
A major factor governing ductility is the number of slip systems available for deformation to occur without producing holes or cracks (Murrell 1990). Five independent slip systems are necessary for plastic deformation without fracturing at grain boundaries (Groves and Kelly 1963). However, many minerals have strongly anisotropic structures (for example, micas) and so have fewer slip systems than those with more three-dimensional structures (for example, quartz). The result is that some minerals (that is, micas) can change their shapes in response to general local stress fields more readily than others. This can lead to localization of deformation into high-strain zones or to the opening of pores or local cracks, which are important in localizing fluids.
Natural rocks typically have several minerals with different deformation properties that can vary with external conditions (for example, temperature, pressure, water activity) (Vernon 2018). This situation produces deformation contrasts between different minerals, which occur when stronger and weaker minerals coexist. For example, strong feldspar and weak quartz typically coexist, deforming at relatively low temperature (<500°C). The feldspar deforms plastically a little before it fractures (brittle deformation), whereas the quartz flows and recrystallizes in a ductile manner, commonly forming “ribbons” of fine-grained recrystallized aggregates. Those ribbons originate as kink bands or deformation bands that recrystallize with progressive deformation.
Evidence of both ductile and brittle behavior is seen in many felsic mylonites in which feldspar deforms cataclastically, whereas quartz and mica deform mainly by dislocation creep, commonly assisted by neocrystallization (Vernon, Williams, and D’Arcy 1983). On the other hand, sometimes biotite deforms by fracturing along the cleavage, forming “shreds” or cleavage platelets that become stretched out along a developing foliation (Johnson, Vernon, and Upton 2004; Vernon, Johnson, and Melis 2004), as indicated by experimental results (Shea and Kronenberg 1993).
Though fluid-enhanced microcracking is commonly an important deformation mechanism in such rocks, both brittle and ductile processes alternate, and cohesion is maintained during deformation (Gapais 1989; Stel 1986). This has been referred to as “semi-brittle” behavior. In some rocks, hydrous minerals that grow from fluids that enter the rock during brittle deformation undergo ductile deformation (Simpson 1986), which may be followed by more fracturing and mineral growth in a cyclic process (Stel 1986).
The effect of ductility contrasts in rocks can be so great that deformation is forced to partition preferentially into zones rich in weak minerals, such as mica (Goodwin and Tikoff 2002; Shea and Kronenberg 1993) and/or fine-grained aggregates (Stünitz and Fitz Gerald 1993), promoting the formation of local zones of high strain (shear zones).
As already noted, contrasts in the deformation of quartz and feldspar are strongly temperature dependent. Similarly, strain rate is important when considering deformation contrasts between minerals. Furthermore, large grains generally deform more readily by dislocation flow than smaller grains of the same mineral, probably because intracrystalline slip can occur with less interference from adjacent grains (Rutter 1976). However, in many rocks, large grains of quartz and K-feldspar are stronger than surrounding finer-grained aggregates of weaker minerals such as mica. This is because intergranular deformation is important in fine-grained aggregates (for example, by grain-boundary sliding, reaction-assisted diffusion), leading to increased strain rates (Etheridge and Vernon 1981; Stünitz and Fitz Gerald 1993). However, as pointed out by de Bresser, ter Heege, and Spiers (2001), dynamic recrystallization can lead to major zones of weakening and strain localization only if grain growth is inhibited.
In summary, the focus needs to be on what should be observed at the microscopic scale in the Muav Formation limestone layers within the Matkatamiba fold. Ductile deformation features, especially in calcite and quartz grains, that should be evident if the limestone was lithified before the folding occurred should include undulose extinction, kink bands, deformation bands, deformation lamellae, deformation twins, pressure effects at the contacts between grain boundaries, sub-grains, sutured grain boundaries, grain boundary bulges, intragranular fractures, intergranular fractures, crystallographic preferred orientations, some rotated grains or sub-grains, some grain size reduction, and/or recrystallized grains.
A Petrographic Study
So, was the folding of the Muav Formation limestone layers within the Matkatamiba fold due to slow processes of ductile deformation over millions of years that occurred hundreds of millions of years after the limestone lithified, or was the folding due to soft-sediment deformation soon after deposition before dewatering and lithification? It should be very evident that to resolve this debate requires a petrographic examination of limestone samples from the fold to determine what microstructural features are present. Ductile deformation should have resulted in definitive microstructural features which should be visible in the limestone’s grains and cement under the microscope, as described in detail above. On the other hand, the absence of such microstructural features and instead the presence of preserved primary depositional features would indicate soft-sediment deformation had occurred, particularly if those preserved primary depositional features in limestone samples from the fold are identical to those in samples from the same limestone beds distant from the fold.
No such petrographic study has previously been published. So, during an investigation of four folds in the Grand Canyon, 12 samples of the Muav Formation were collected from the Matkatamiba fold, and three samples from outcrops along the Colorado River corridor distant from that fold (fig. 1 and table 1). The purpose was to compare under the microscope the samples from the fold (fig. 22) with the distal samples (fig. 1) to ascertain what effects the folding had on the limestone and thus determine the conditions during, and the timing of, the folding relative to the conditions and timing of the deposition and subsequent lithification (cementation) of the limestone. Details of the locations of those samples are provided in figs. 1 and 22, and in table 1, as well as in the appendix (in the Supplementary material). Within the Matkatamiba fold, two Muav Formation beds were sampled, the uppermost bed in the Gateway Canyon Member and the overlying lowermost bed of the Havasu Member, in corresponding pairs on either side of the boundary between those two members. Those sampling locations can be seen in fig. 22. All samples were sent to Calgary Rock and Materials Services, Inc. (Calgary, Canada) for thin sectioning and for scanning electron microscope (SEM) examination.
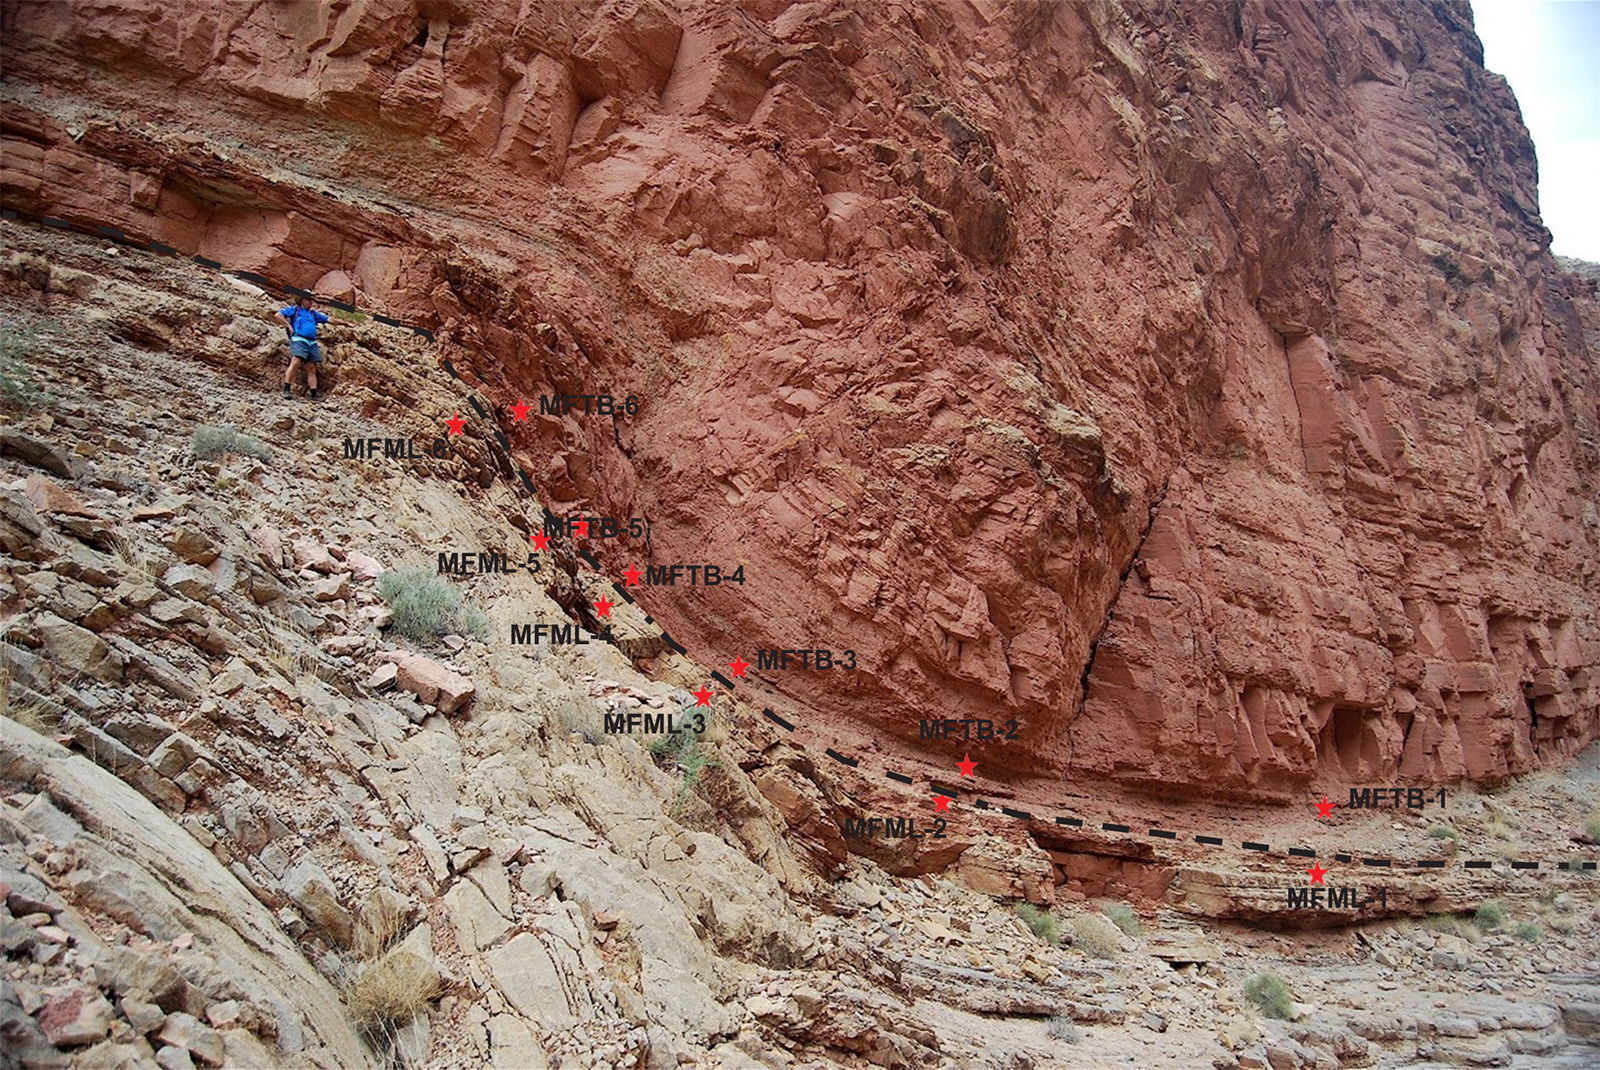
Fig. 22. The Matkatamiba fold about 100 ft (~30 m) in the cliff above the Colorado River, river right at river mile 148.8, showing the locations of the samples collected, being marked by red stars labeled with the sample numbers. The samples were collected in corresponding pairs from the uppermost Gateway Canyon Member bed and the overlying Havasu Member bed either side of the boundary between them at various distances along the limb of the fold and through the monoclinal hinge zone. The man standing on the outcrop provides the scale.
Table 1. Locations and stratigraphic details of all the Muav Formation samples examined in this study.
| Sample | Location | Location Coordinates | Stratigraphic Position | Notes |
|---|---|---|---|---|
| MLS-01 | River mile 143.5 |
N 36° 23.543’ W 112° 37.581’ |
Kanab Canyon Member, Muav Formation | River left ledges just above Kanab Rapid |
| MLS-02 | River mile 153.6 |
N 36° 19.383’ W 112° 43.301’ |
Gateway Canyon member, Muav Formation | River right just above Sinyella Rapid |
| MLS-03 | River Mile 180.2 |
N 36° 11.633’ W 113° 05.433’ |
Top of Peach Springs Member, Muav Formation | River left ledge just below Son of Lava Rapid |
| MFML-01 |
Matkatamiba fold River mile 148.8 |
N 36° 23.553’ W 112° 37.558’ |
Top of Gateway Canyon Member, Muav Formation | Upstream away from the hinge zones of the fold |
| MFML-02 |
Matkatamiba fold River mile 148.8 |
N 36° 20.557’ W 112° 40.701’ |
Top of Gateway Canyon Member, Muav Formation | 47.5 m along the bed downstream of MFML-01 |
| MFML-03 |
Matkatamiba fold River mile 148.8 |
N 36° 20.408’ W 112° 40.497’ |
Top of Gateway Canyon Member, Muav Formation | 13.5 m along the bed downstream of MFML-02 |
| MFML-04 |
Matkatamiba fold River mile 148.8 |
N 36° 20.462’ W 112° 40.655’ |
Top of Gateway Canyon Member, Muav Formation | 7.5 m along the bed downstream of MFML-03 in the lower hinge zone |
| MFML-05 |
Matkatamiba fold River mile 148.8 |
N 36° 20.470’ W 112° 40.630’ |
Top of Gateway Canyon Member, Muav Formation | 4 m along the bed downstream of MFML-04 in the lower hinge zone |
| MFML-06 |
Matkatamiba fold River mile 148.8 |
N 36° 20.368’ W 112° 40.643’ |
Top of Gateway Canyon Member, Muav Formation | 6 m along the bed downstream of MFML-05 from the upper hinge zone |
| MFTB-01 |
Matkatamiba fold River mile 148.8 |
N 36° 23.553’ W 112° 37.558’ |
Bottom of Havasu Member, Muav Formation | Above the boundary opposite MFML-01 |
| MFTB-02 |
Matkatamiba fold River mile 148.8 |
N 36° 20.557’ W 112° 40.701’ |
Bottom of Havasu Member, Muav Formation | 47.5 m along the bed downstream of MFTB-01 |
| MFTB-03 |
Matkatamiba fold River mile 148.8 |
N 36° 20.408’ W 112° 40.497’ |
Bottom of Havasu Member, Muav Formation | 13.5 m along the bed downstream of MFTB-02 |
| MFTB-04 |
Matkatamiba fold River mile 148.8 |
N 36° 20.462’ W 112° 40.655’ |
Bottom of Havasu Member, Muav Formation | 7.5 m along the bed downstream of MFTB-03 in the lower hinge zone |
| MFTB-05 |
Matkatamiba fold River mile 148.8 |
N 36° 20.470’ W 112° 40.630’ |
Bottom of Havasu Member, Muav Formation | 4 m along the bed downstream of MFTB-04 in the lower hinge zone |
| MFTB-06 |
Matkatamiba fold River mile 148.8 |
N 36° 20.399’ W 112° 40.578’ |
Bottom of Havasu Member, Muav Formation | 6 m along the bed downstream of MFTB-05 from the upper hinge zone |
Thin Section Examination
Thin sections for this study were mounted on standard glass microscope slides. Before the slices were cut using a diamond saw, the rock samples were impregnated under confining pressure with epoxy resin that contained a blue dye. This ensured that grains did not get dislocated, or the rock fabrics got distorted during the sawing of the slices. However, this process left the thin sections with a blue dye stain as the surrounding background and in any holes or pores within the rock fabrics. Before cover slips were added, the thin sections were stained so as to make the K-feldspar and calcite in the rock fabrics more easily distinguished. Thus, the K-feldspar grains have a distinctive yellow color, and the calcite is pinkish in plain polarized light.
Detailed petrographic descriptions of all samples from extensive thin section examination are provided in the appendix (in the Supplementary material), along with photomicrographs of the whole thin sections from which the descriptions were derived. The locations and stratigraphic details of all samples are provided in table 1, as well as in the appendix. It should again be noted that the 15 samples were collected from several stratigraphic levels within the Muav Formation. One sample each was collected from the Peach Springs and Kanab Canyon Members, while seven came from the Gateway Canyon Member and the remaining six from the Havasu Member (Snelling 2022a). Since the 12 samples along and through the Matkatamiba fold straddle the boundary between the Gateway Canyon Member and the overlying Havasu Member, the two sets of six samples from each unit in that outcrop come from the same two respective stratigraphic levels. Those six samples in each of those two sets are thus comparable to one another. The results of the XRD analyses which provided a quantitative estimate of the mineral constituents of each limestone sample are compiled in table 2. These estimated mineral constituents could then be verified under the petrographic microscope.
Table 2. Mineral compositions of the Muav Formation samples in this study from X-ray diffraction (XRD) analyses, courtesy of Ray Strom, Calgary Rock and Materials Services, Inc., Canada, and the estimated average porosities.
| Sample | Quartz | K-Feldspar | Plagioclase | Calcite | Dolomite | Siderite | Illite | Total | Total Carbonates | Total Silicates |
|---|---|---|---|---|---|---|---|---|---|---|
| MLS-01 | 3.0% | 0.9% | – | 65.0% | 31.1% | – | – | 100.0% | 96.1% | 3.9% |
| MLS-02 | 10.2% | 12.7% | 1.9% | 68.7% | 2.2% | – | 4.3% | 100.0% | 70.9% | 29.1% |
| MLS-03 | 8.1% | 14.1% | – | 71.7% | 3.3% | – | 2.8% | 100.0% | 75.0% | 25.0% |
| MFML-01 | 25.6% | 26.3% | – | 21.9% | 19.8% | – | 6.4% | 100.0% | 41.7% | 58.3% |
| MFML-02 | 28.2% | 24.9% | – | 20.1% | 26.8% | – | – | 100.0% | 46.9% | 53.1% |
| MFML-03 | 39.3% | 26.3% | – | 31.1% | 2.8% | – | 0.5% | 100.0% | 33.9% | 66.1% |
| MFML-04 | 12.2% | 14.9% | – | 51.1% | 17.0% | – | 4.8% | 100.0% | 68.1% | 31.9% |
| MFML-05 | 34.8% | 17.5% | – | 43.5% | 3.6% | – | 0.6% | 100.0% | 47.1% | 52.9% |
| MFML-06 | 7.2% | 9.1 % | – | 75.0% | 7.6% | – | 1.1% | 100.0% | 82.6% | 17.4% |
| MFTB-01 | 5.3% | 6.0% | – | 71.4% | 17.3% | – | – | 100.0% | 88.7% | 11.3% |
| MFTB-02 | 55.8% | 18.3% | – | 17.6% | 3.8% | – | 4.5% | 100.0% | 21.4% | 78.6% |
| MFTB-03 | 20.4% | 15.6% | – | 60.5% | 1.5% | 0.8% | 1.2% | 100.0% | 62.8% | 37.2% |
| MFTB-04 | 22.5% | 18.5% | – | 49.6% | 2.7% | – | 6.7% | 100.0% | 52.3% | 47.7% |
| MFTB-05 | 2.7% | 4.5% | – | 92.8% | – | – | – | 100.0% | 92.8% | 7.2% |
| MFTB-06 | 4.9% | 5.8 % | – | 4.3% | 81.9% | – | 3.1% | 100.0% | 86.2% | 13.8% |
Thin sections of the complete set of 15 samples are shown at normal scale in fig. 23, while the photomicrographs in fig. 24 show typical textures within these same samples of the Muav Formation used in this study. It should be noted that the blue dye staining caused by the impregnated epoxy between the grains sometimes encroaches on the grain edges or even across grain surfaces. Thus, some patches of blue dye mark the occasional pore spaces. The details of the mineral constituents in these samples and their textures indicate rapid deposition of the Muav Formation (Snelling 2022a).
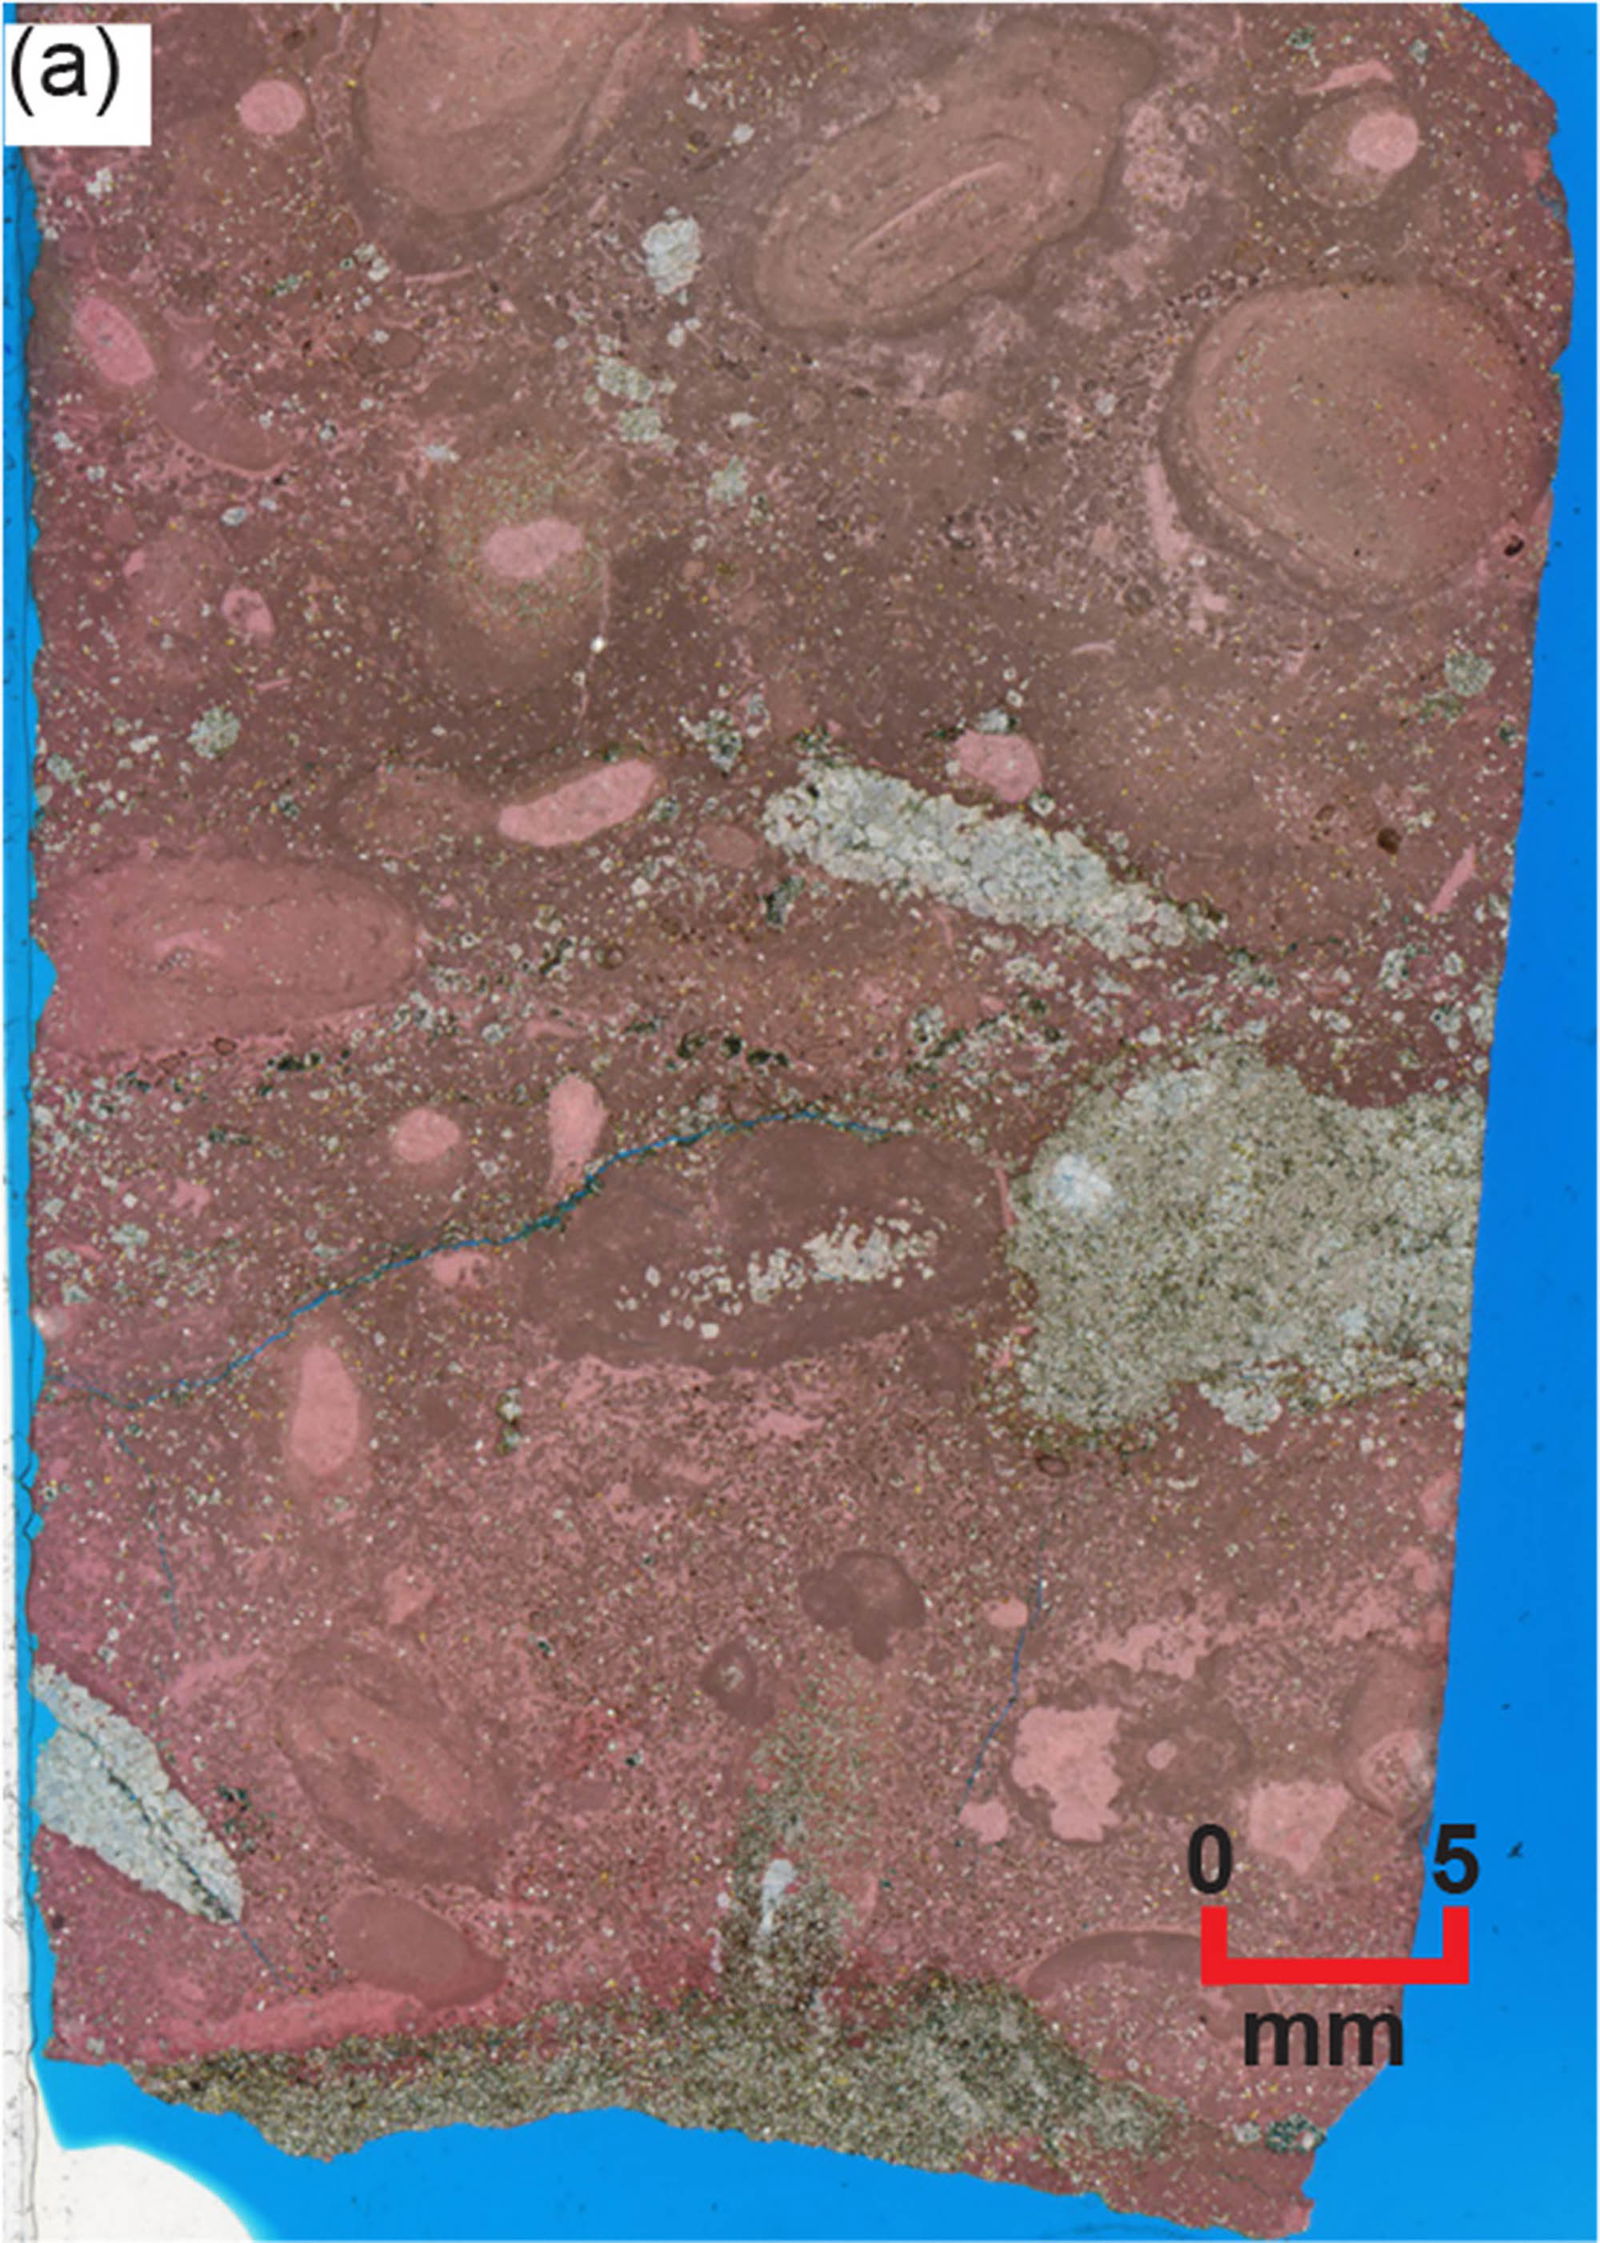
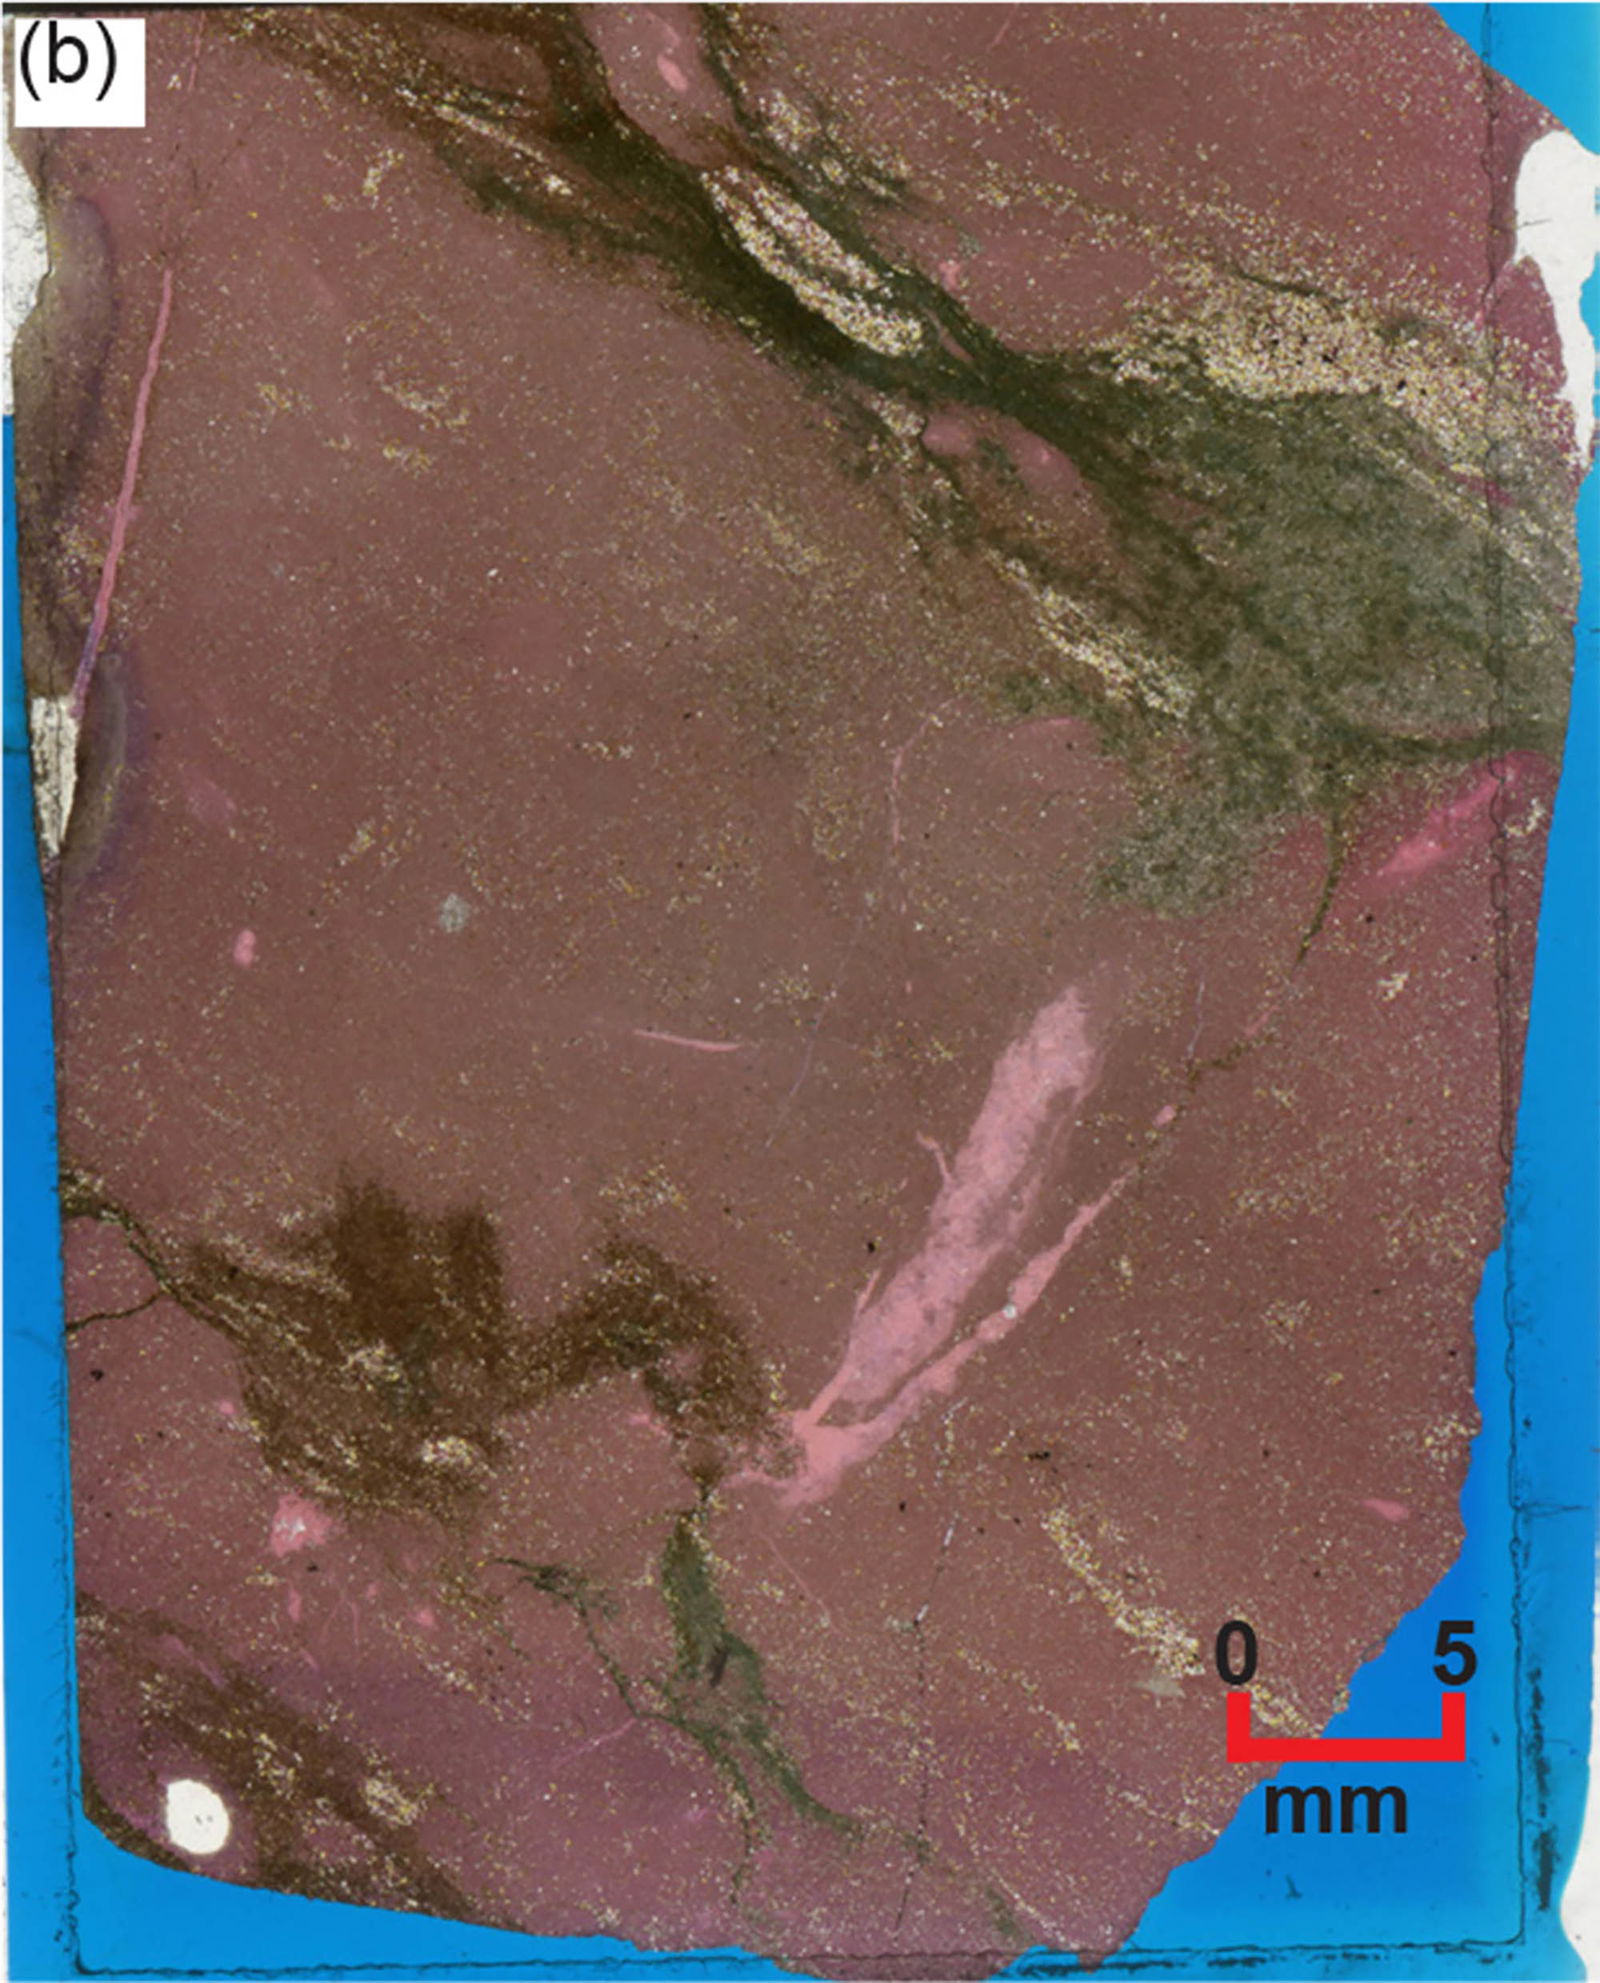
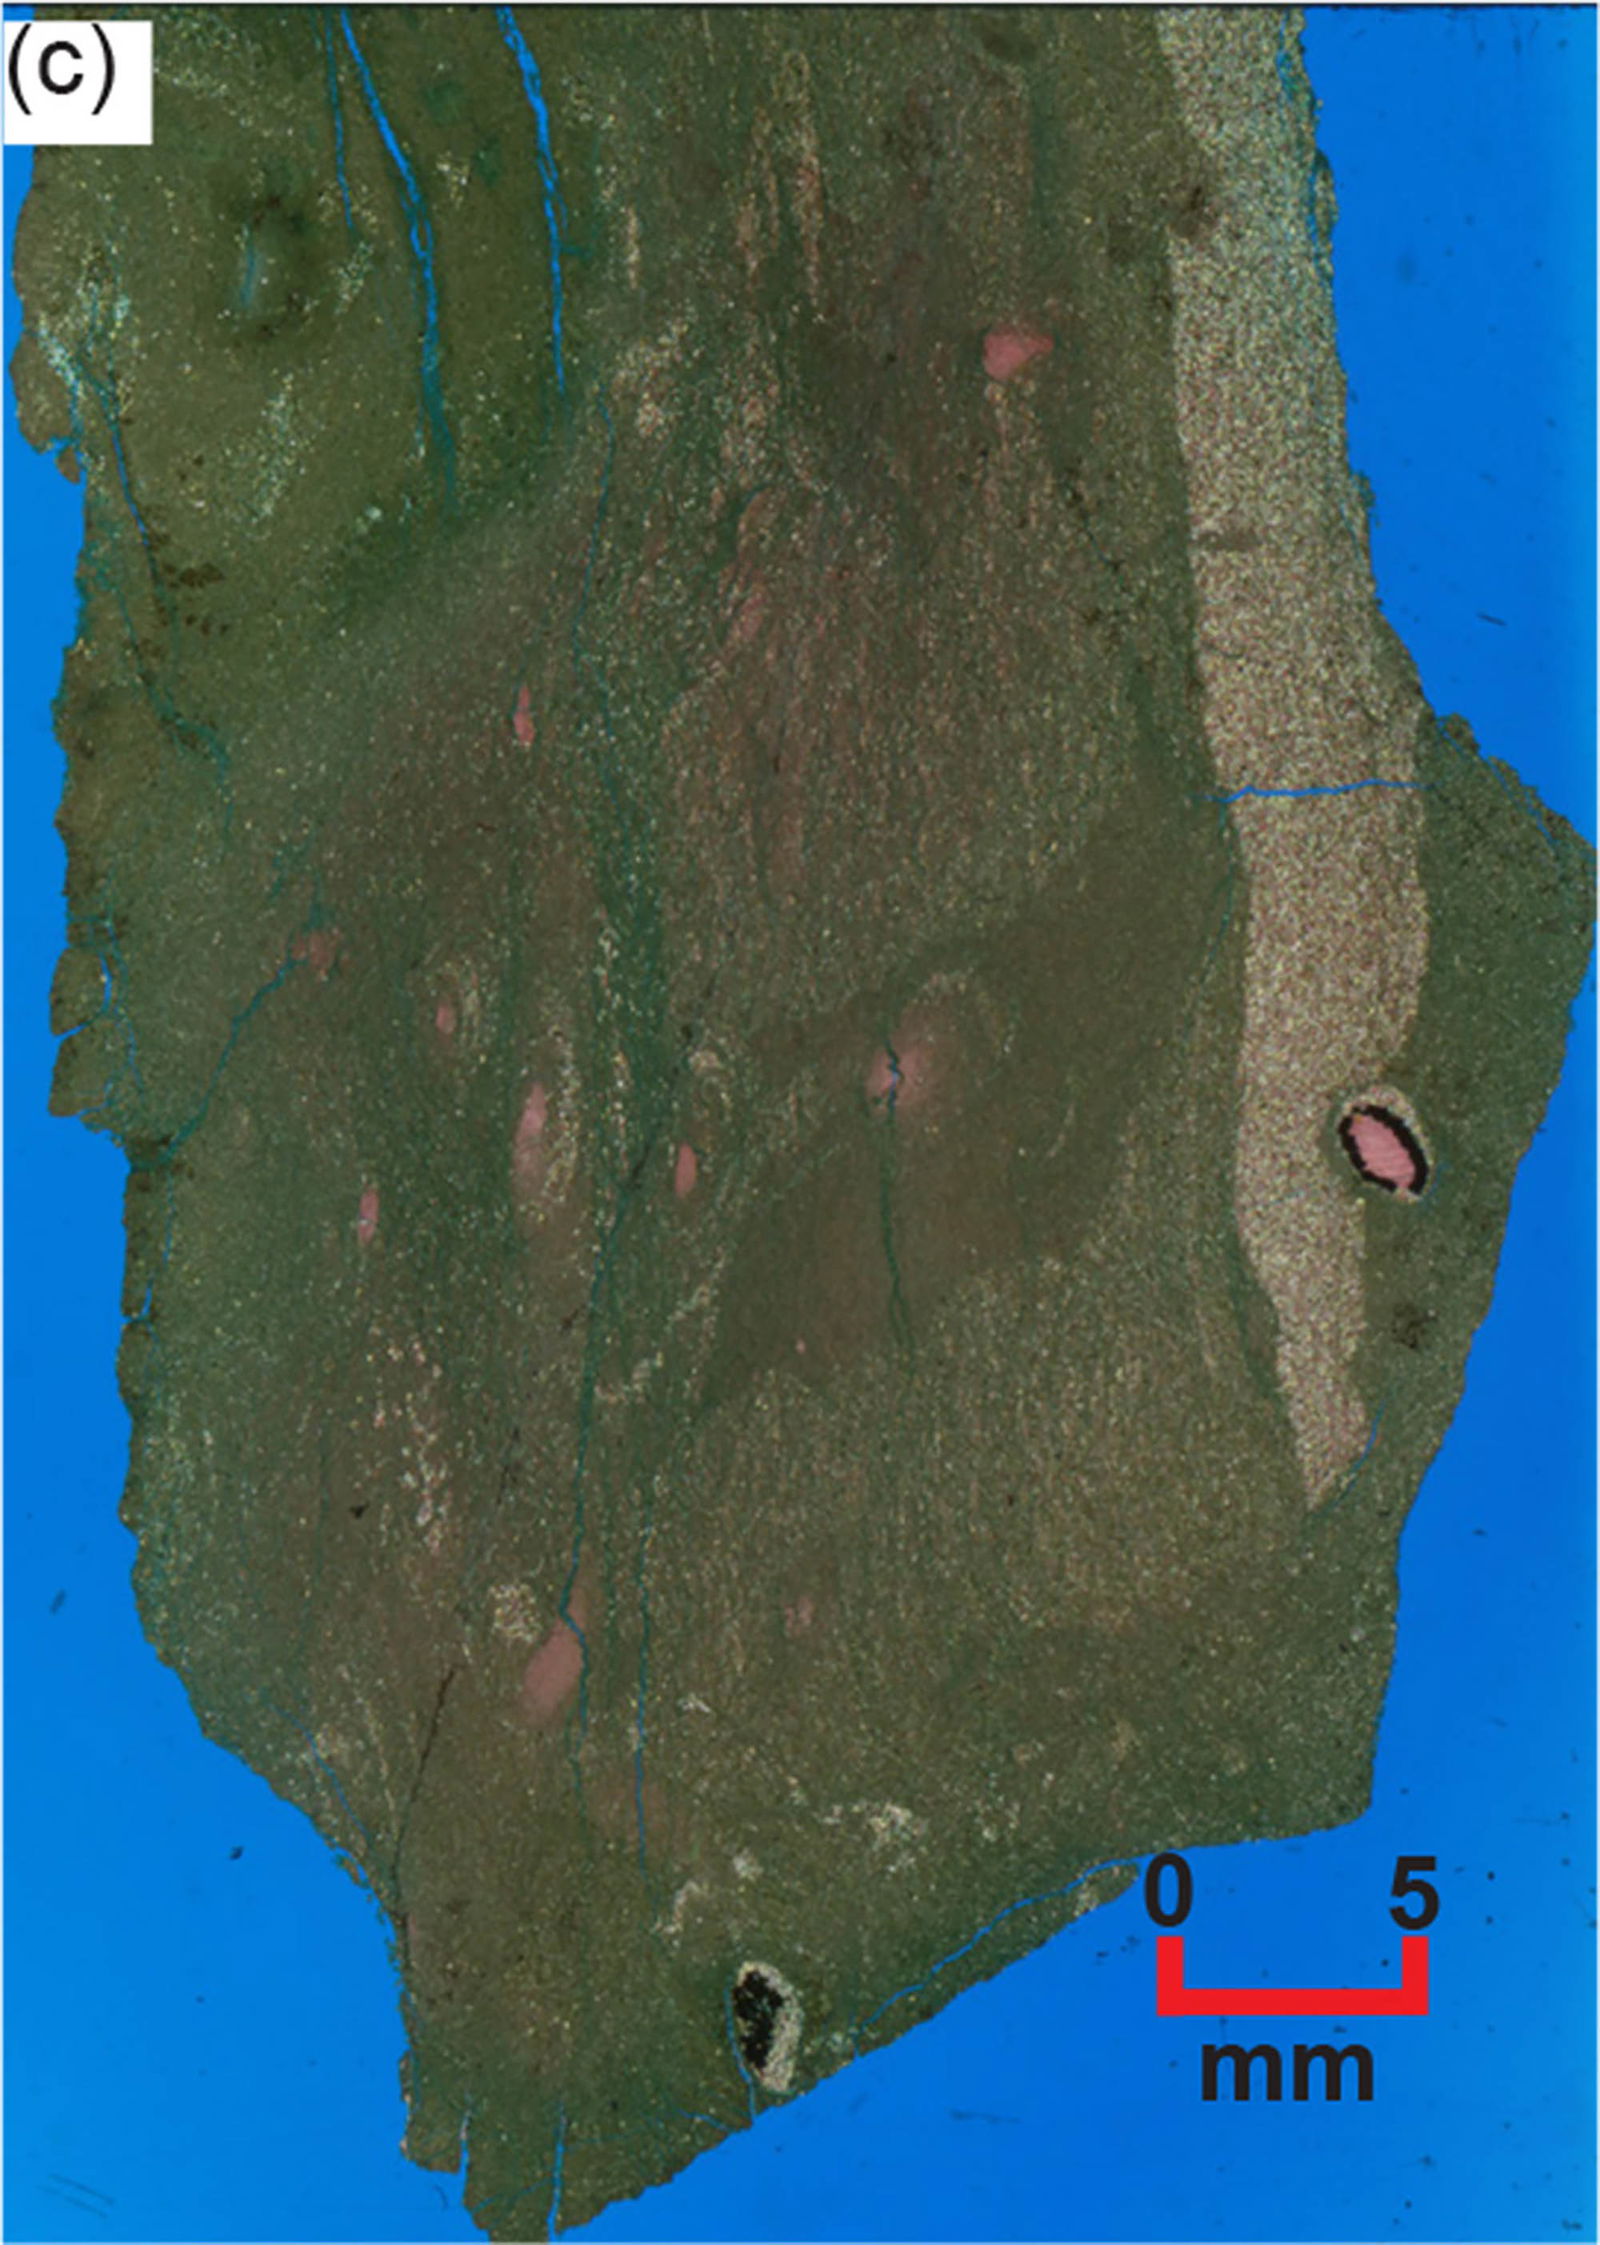
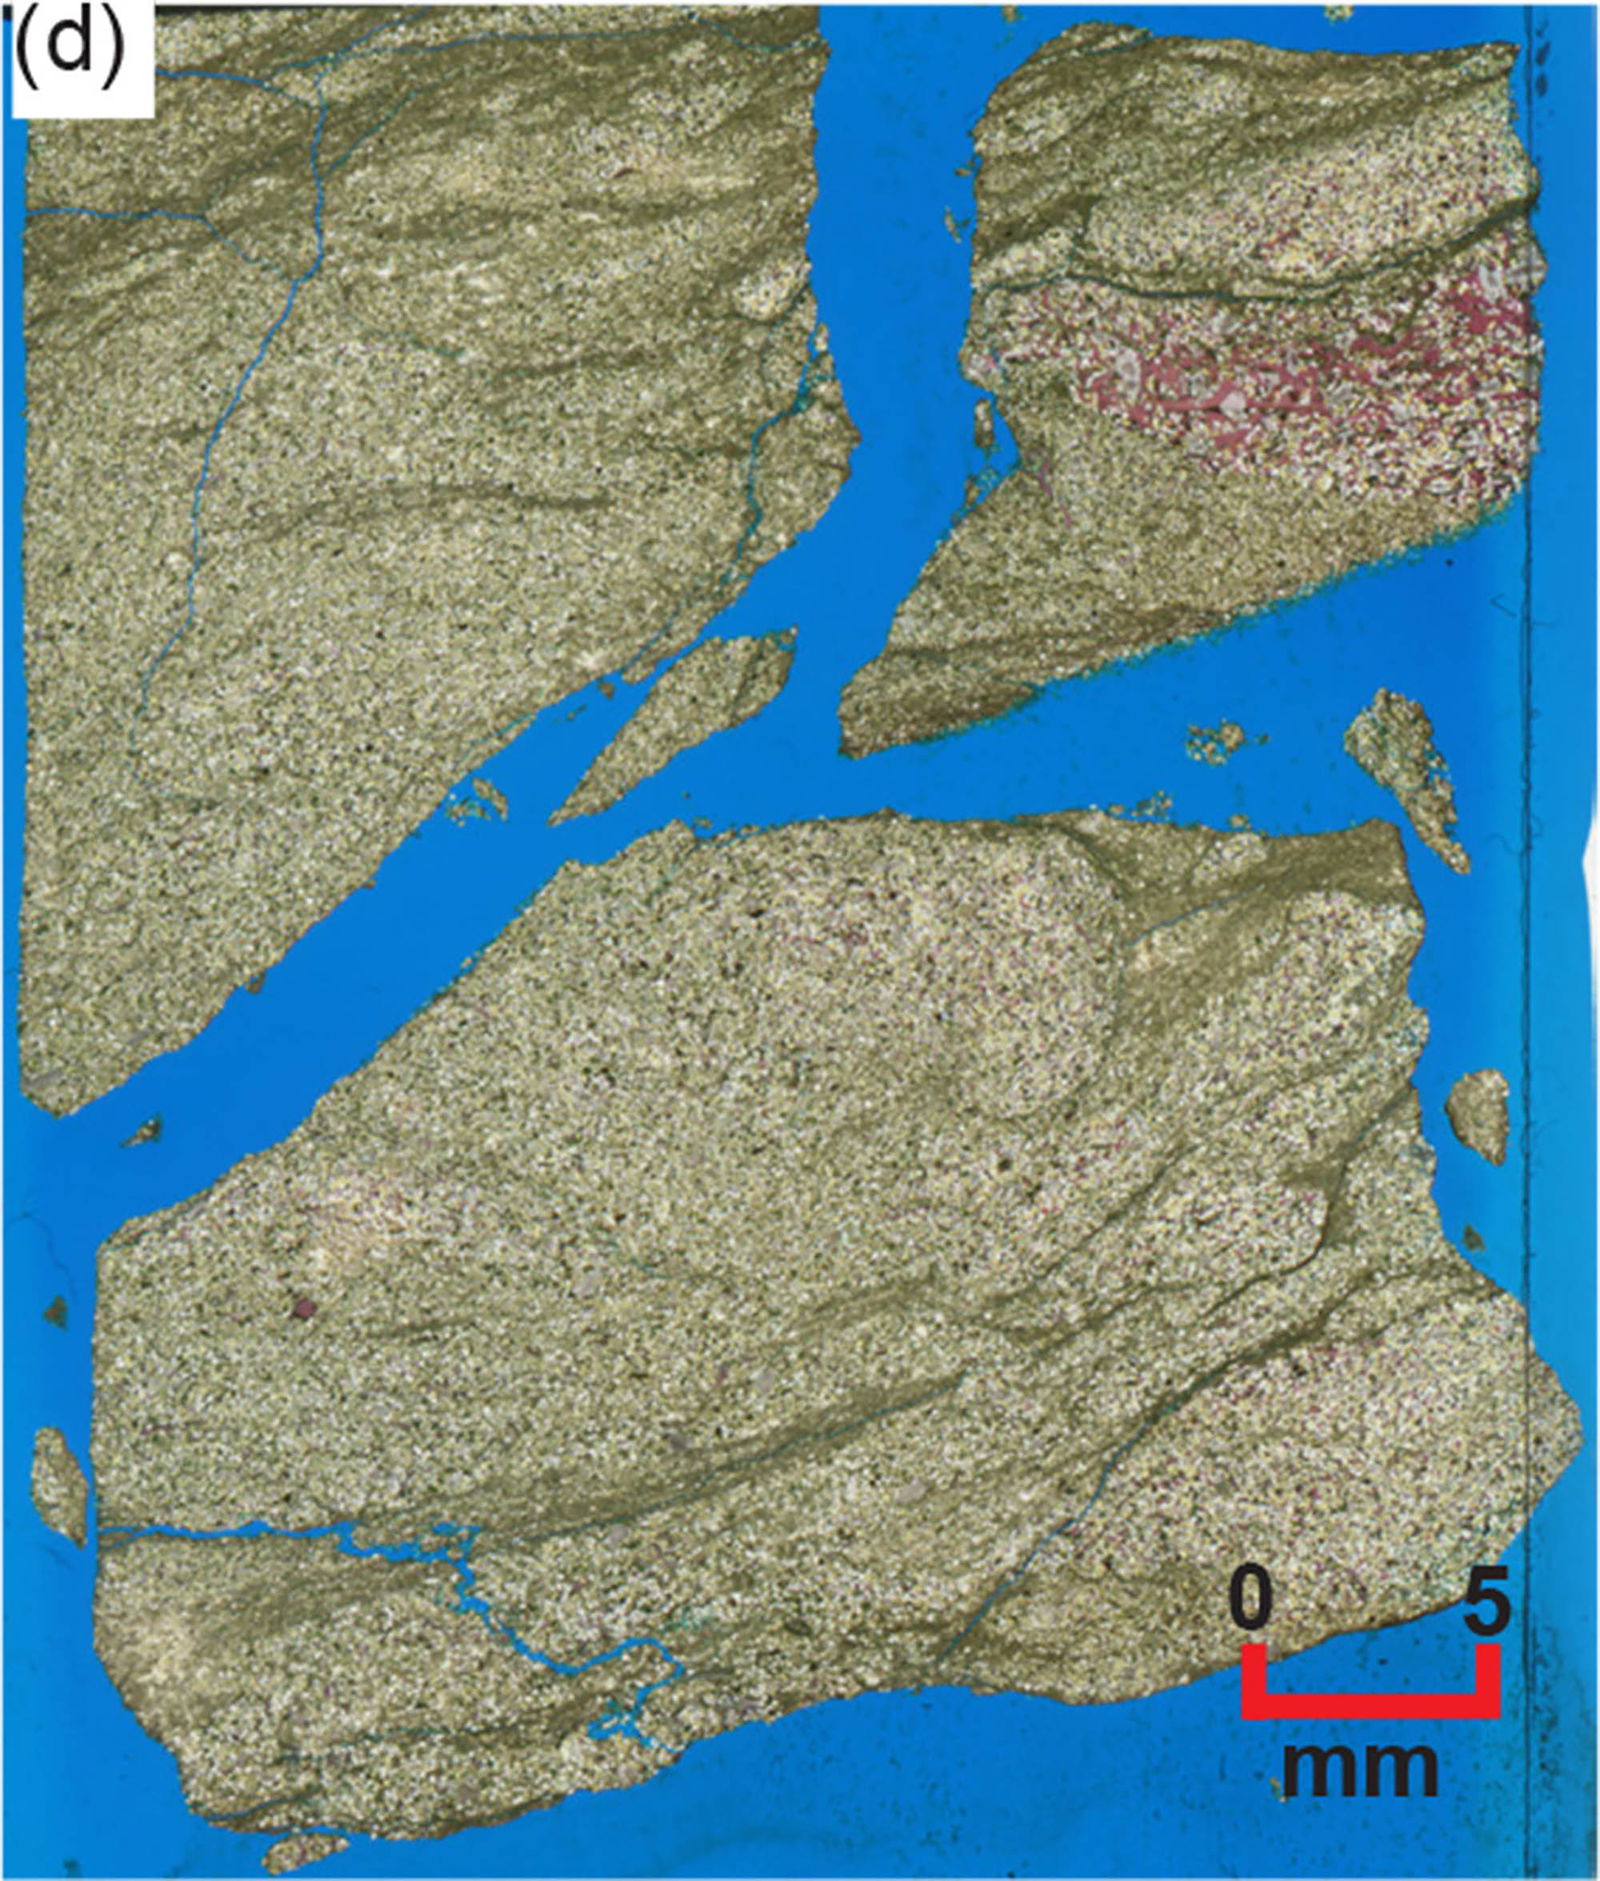
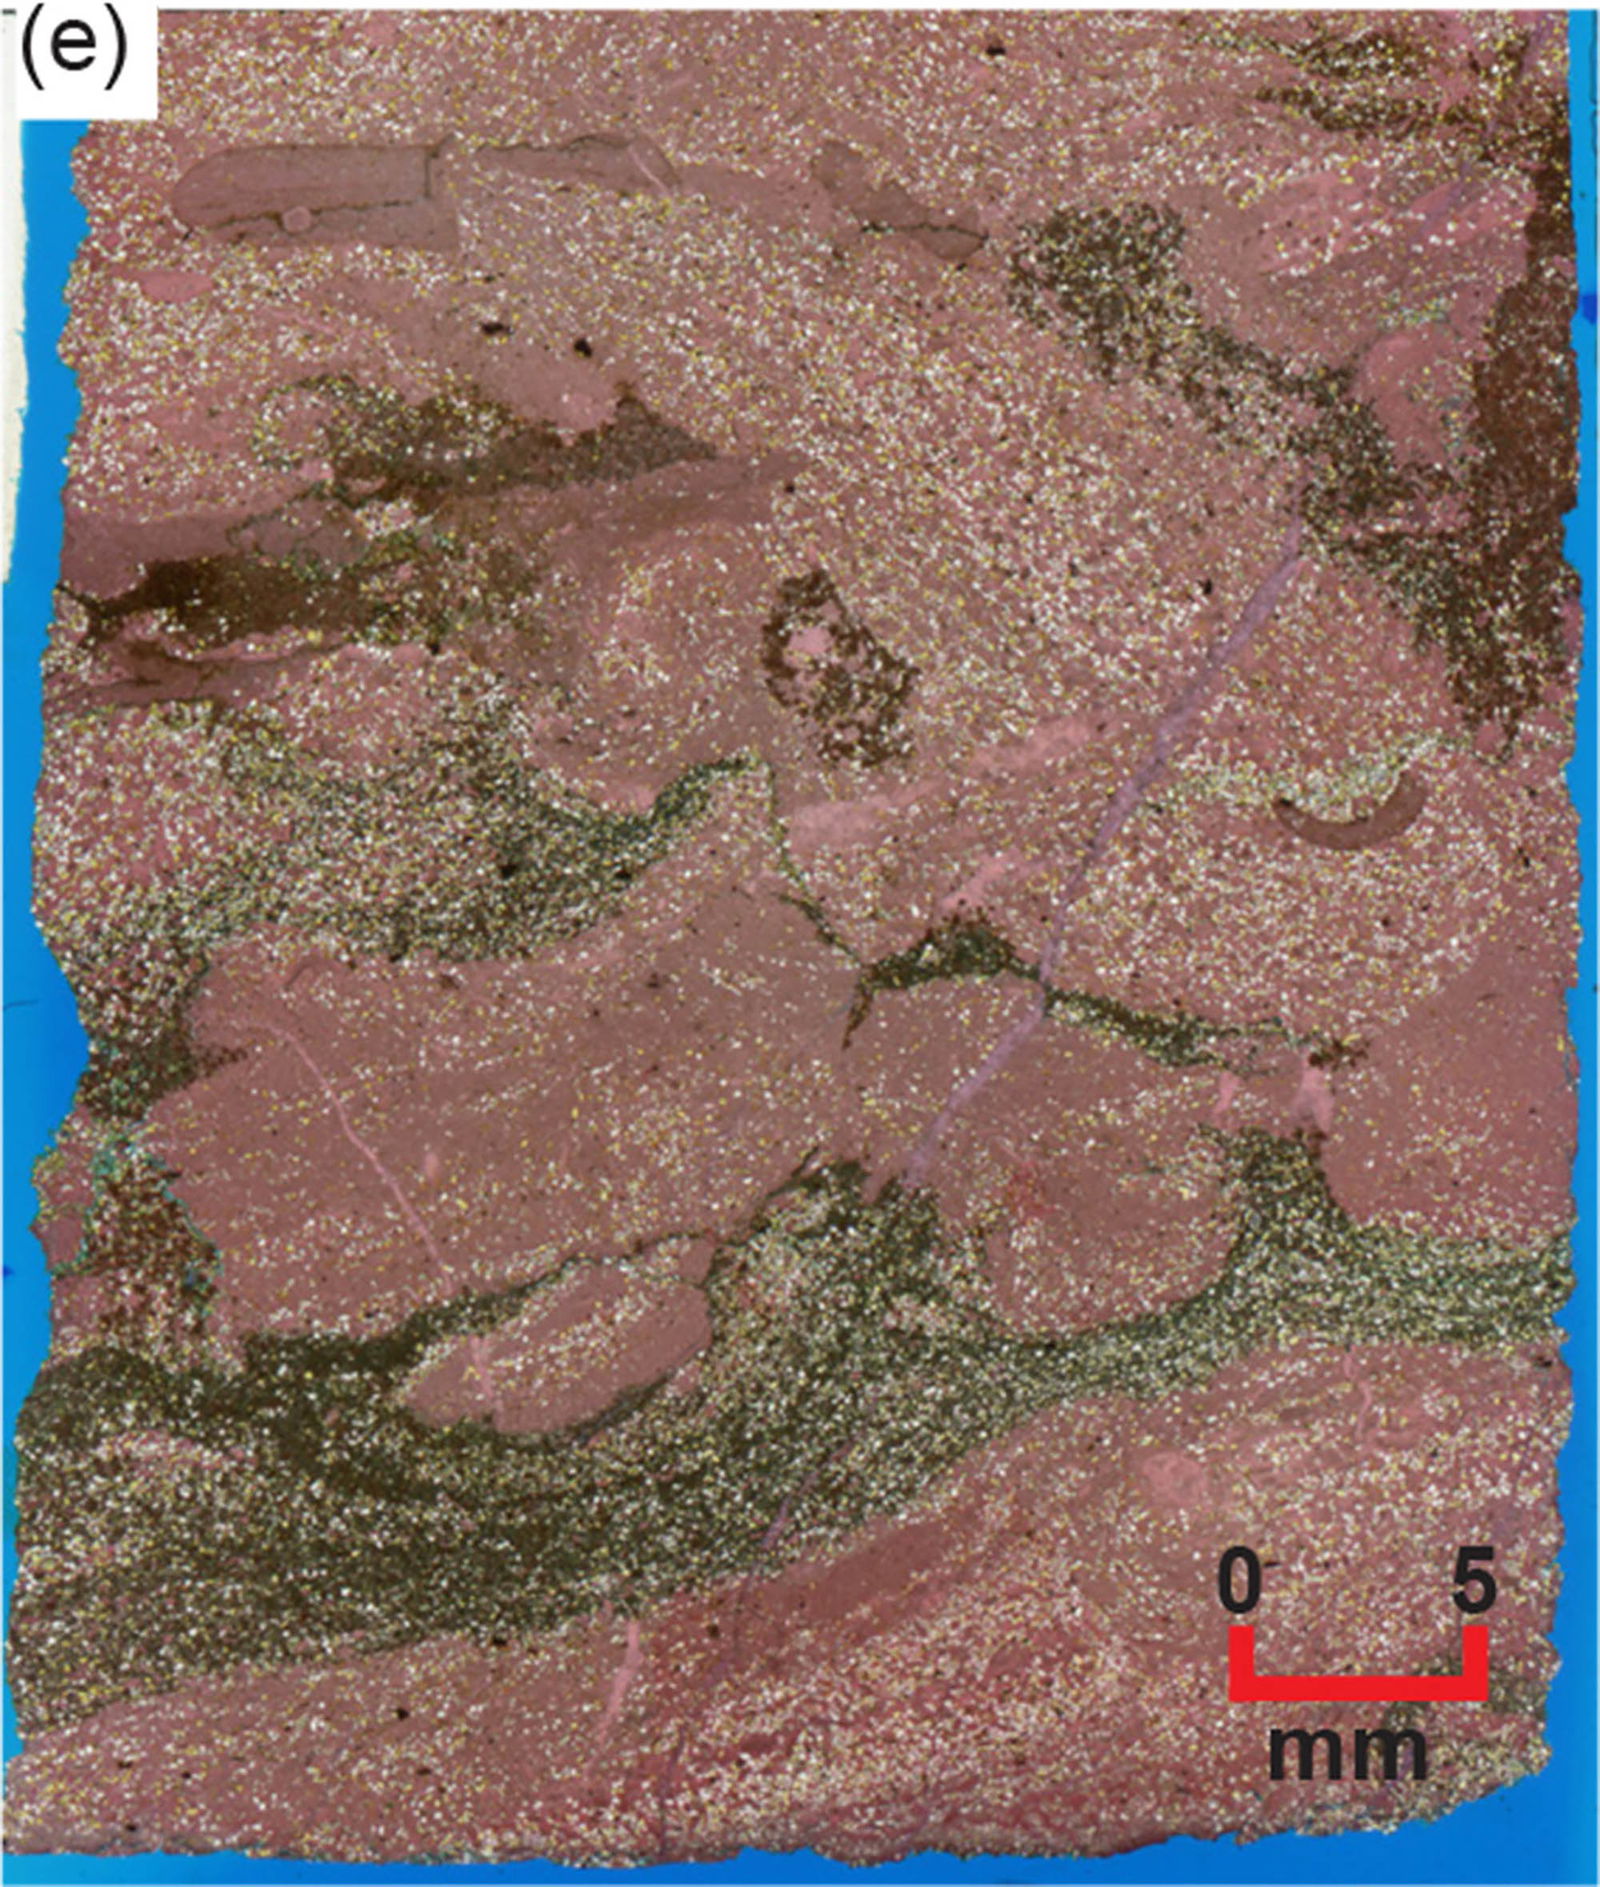
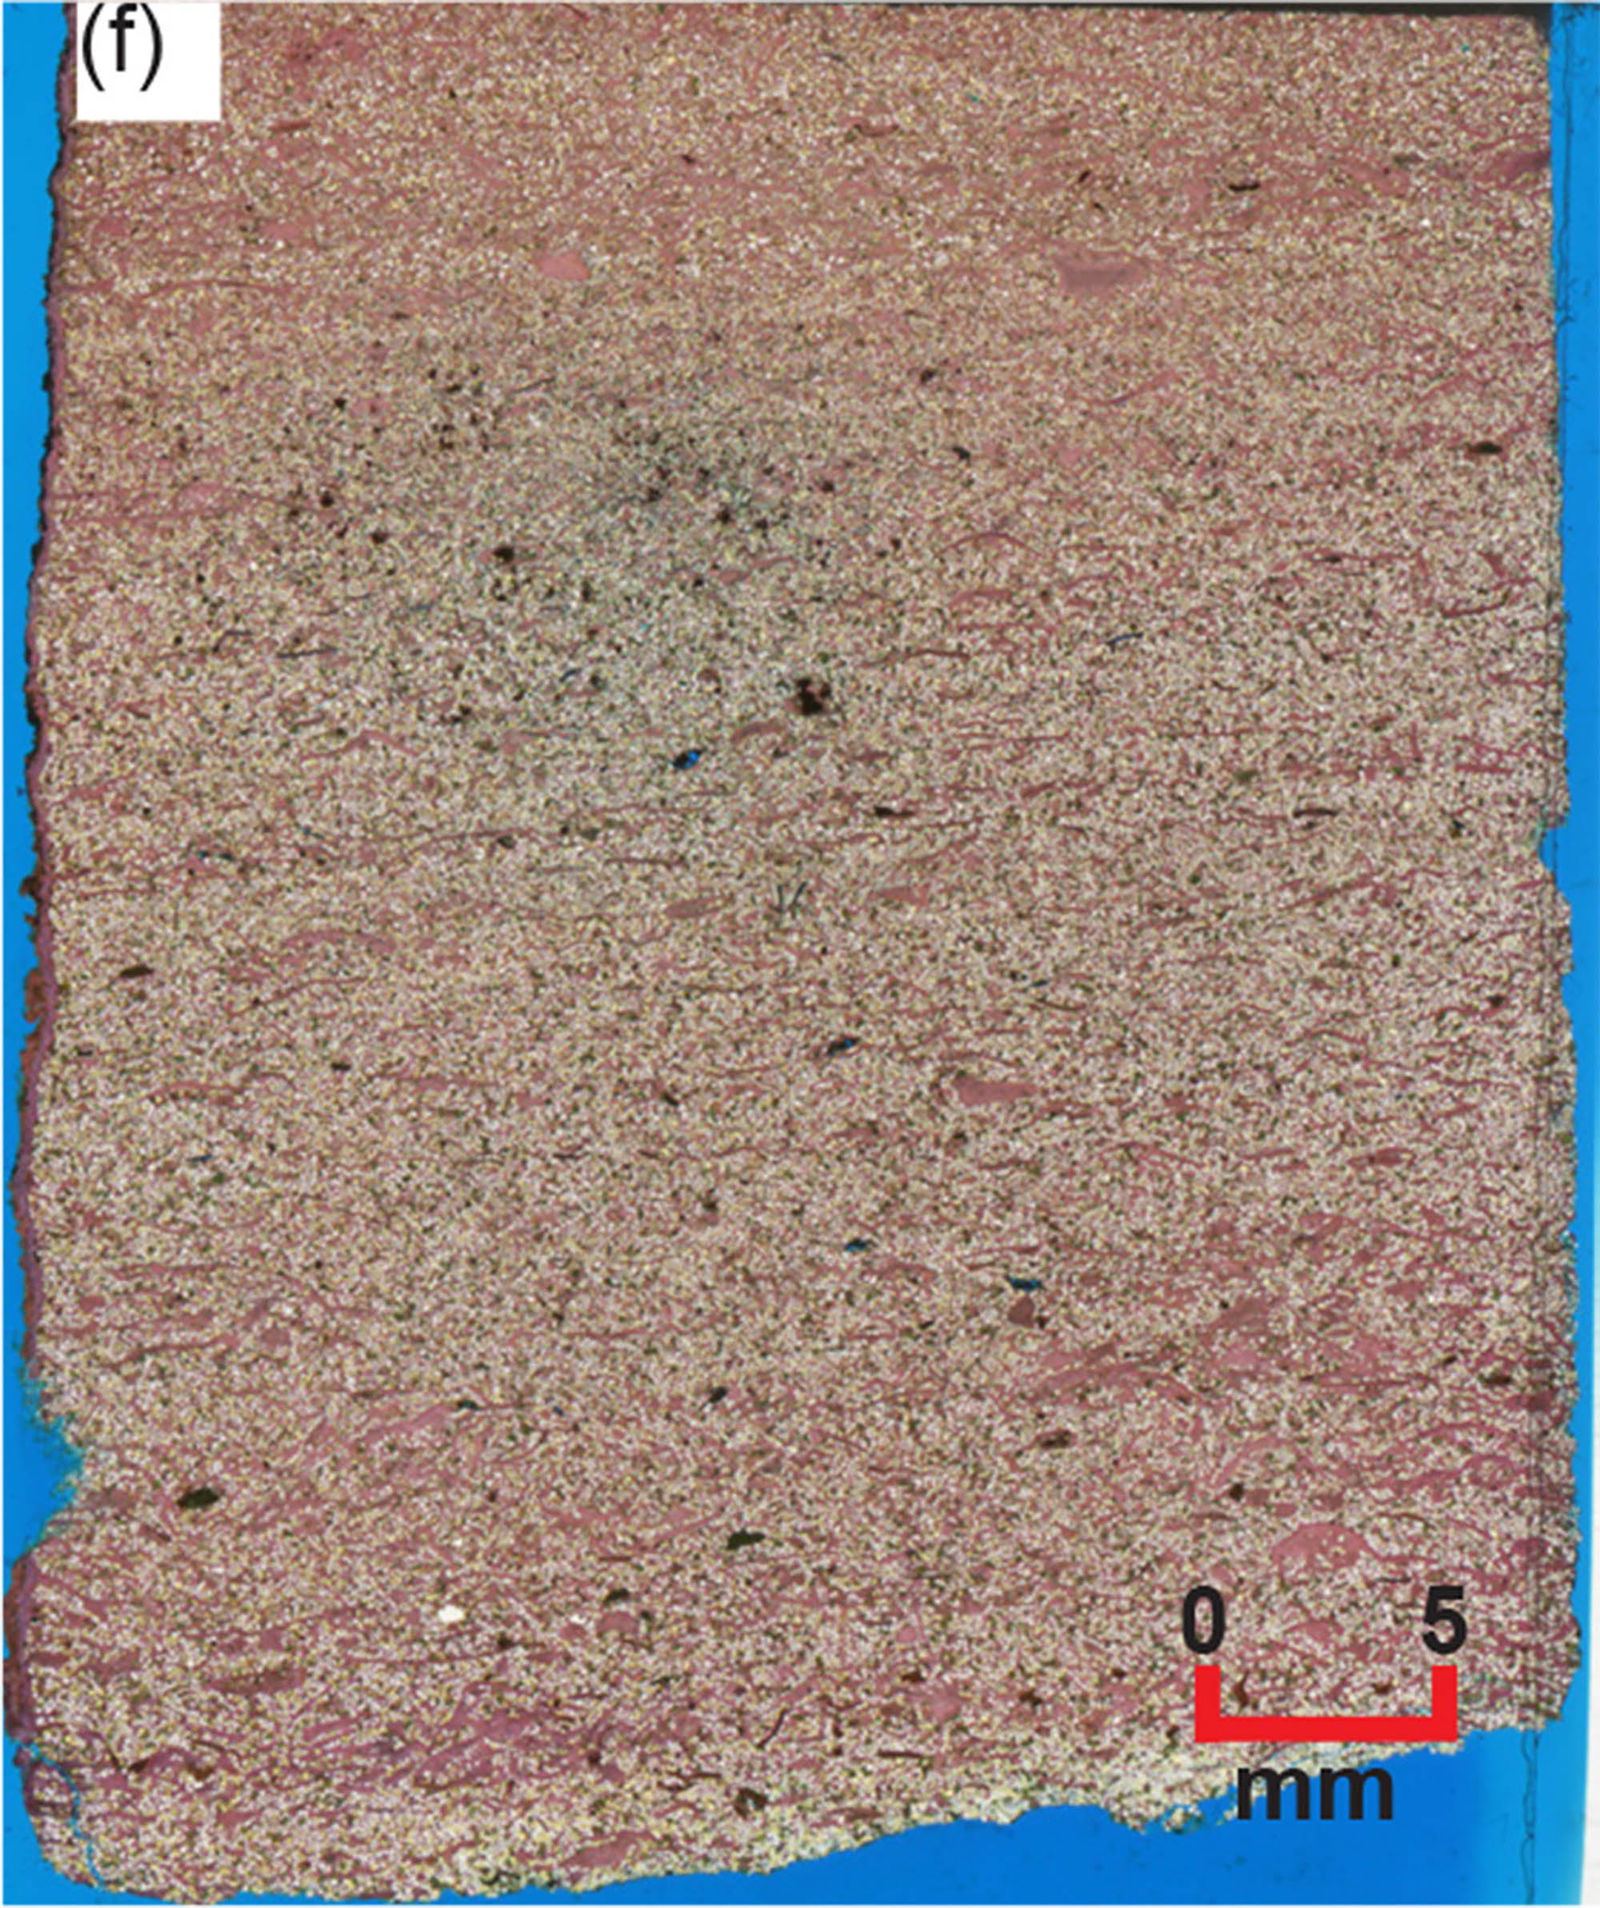
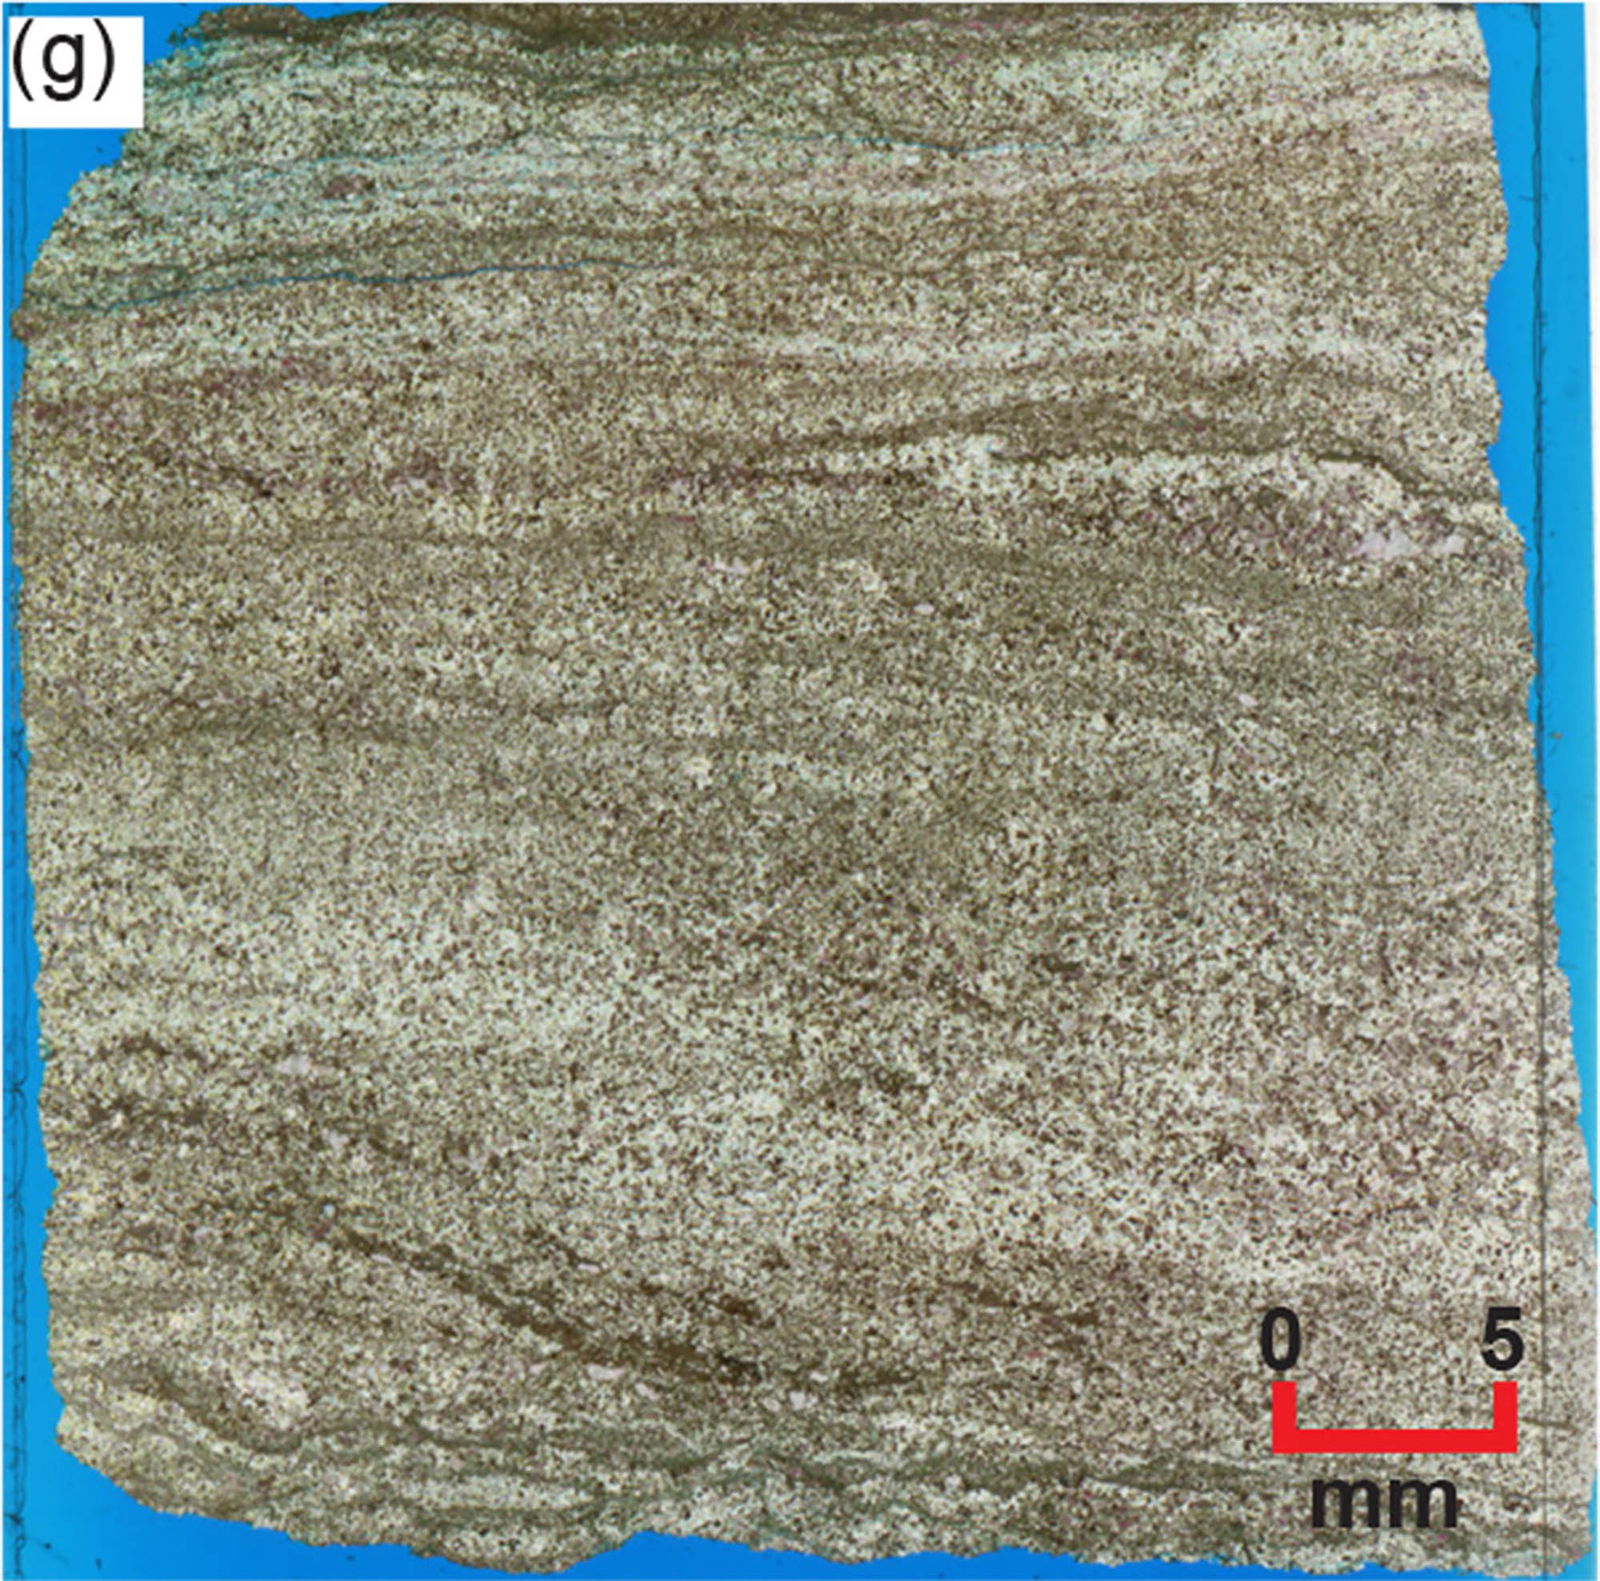
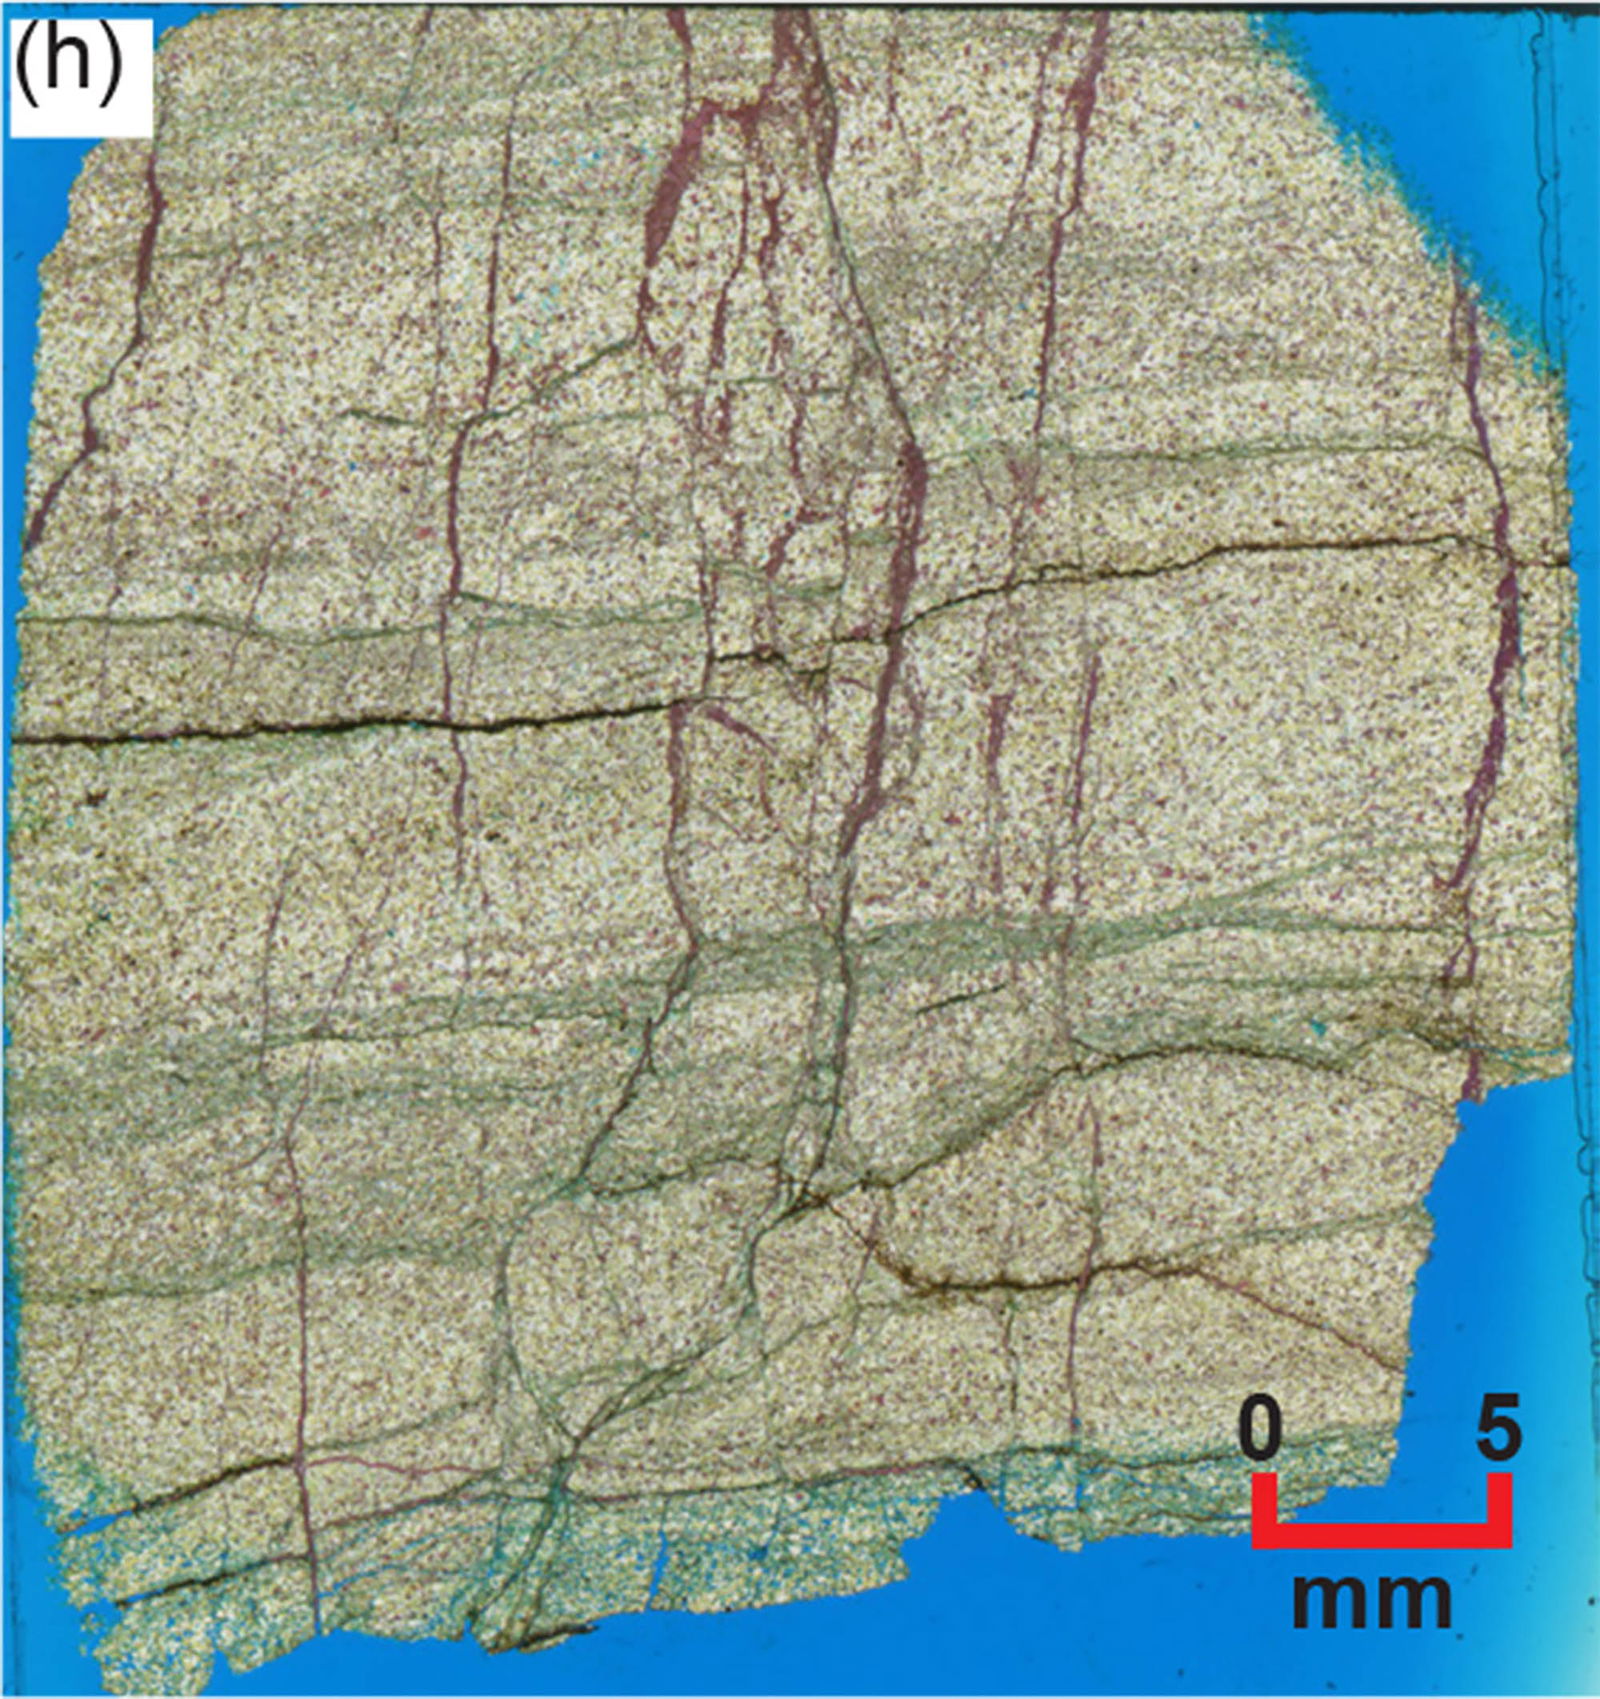
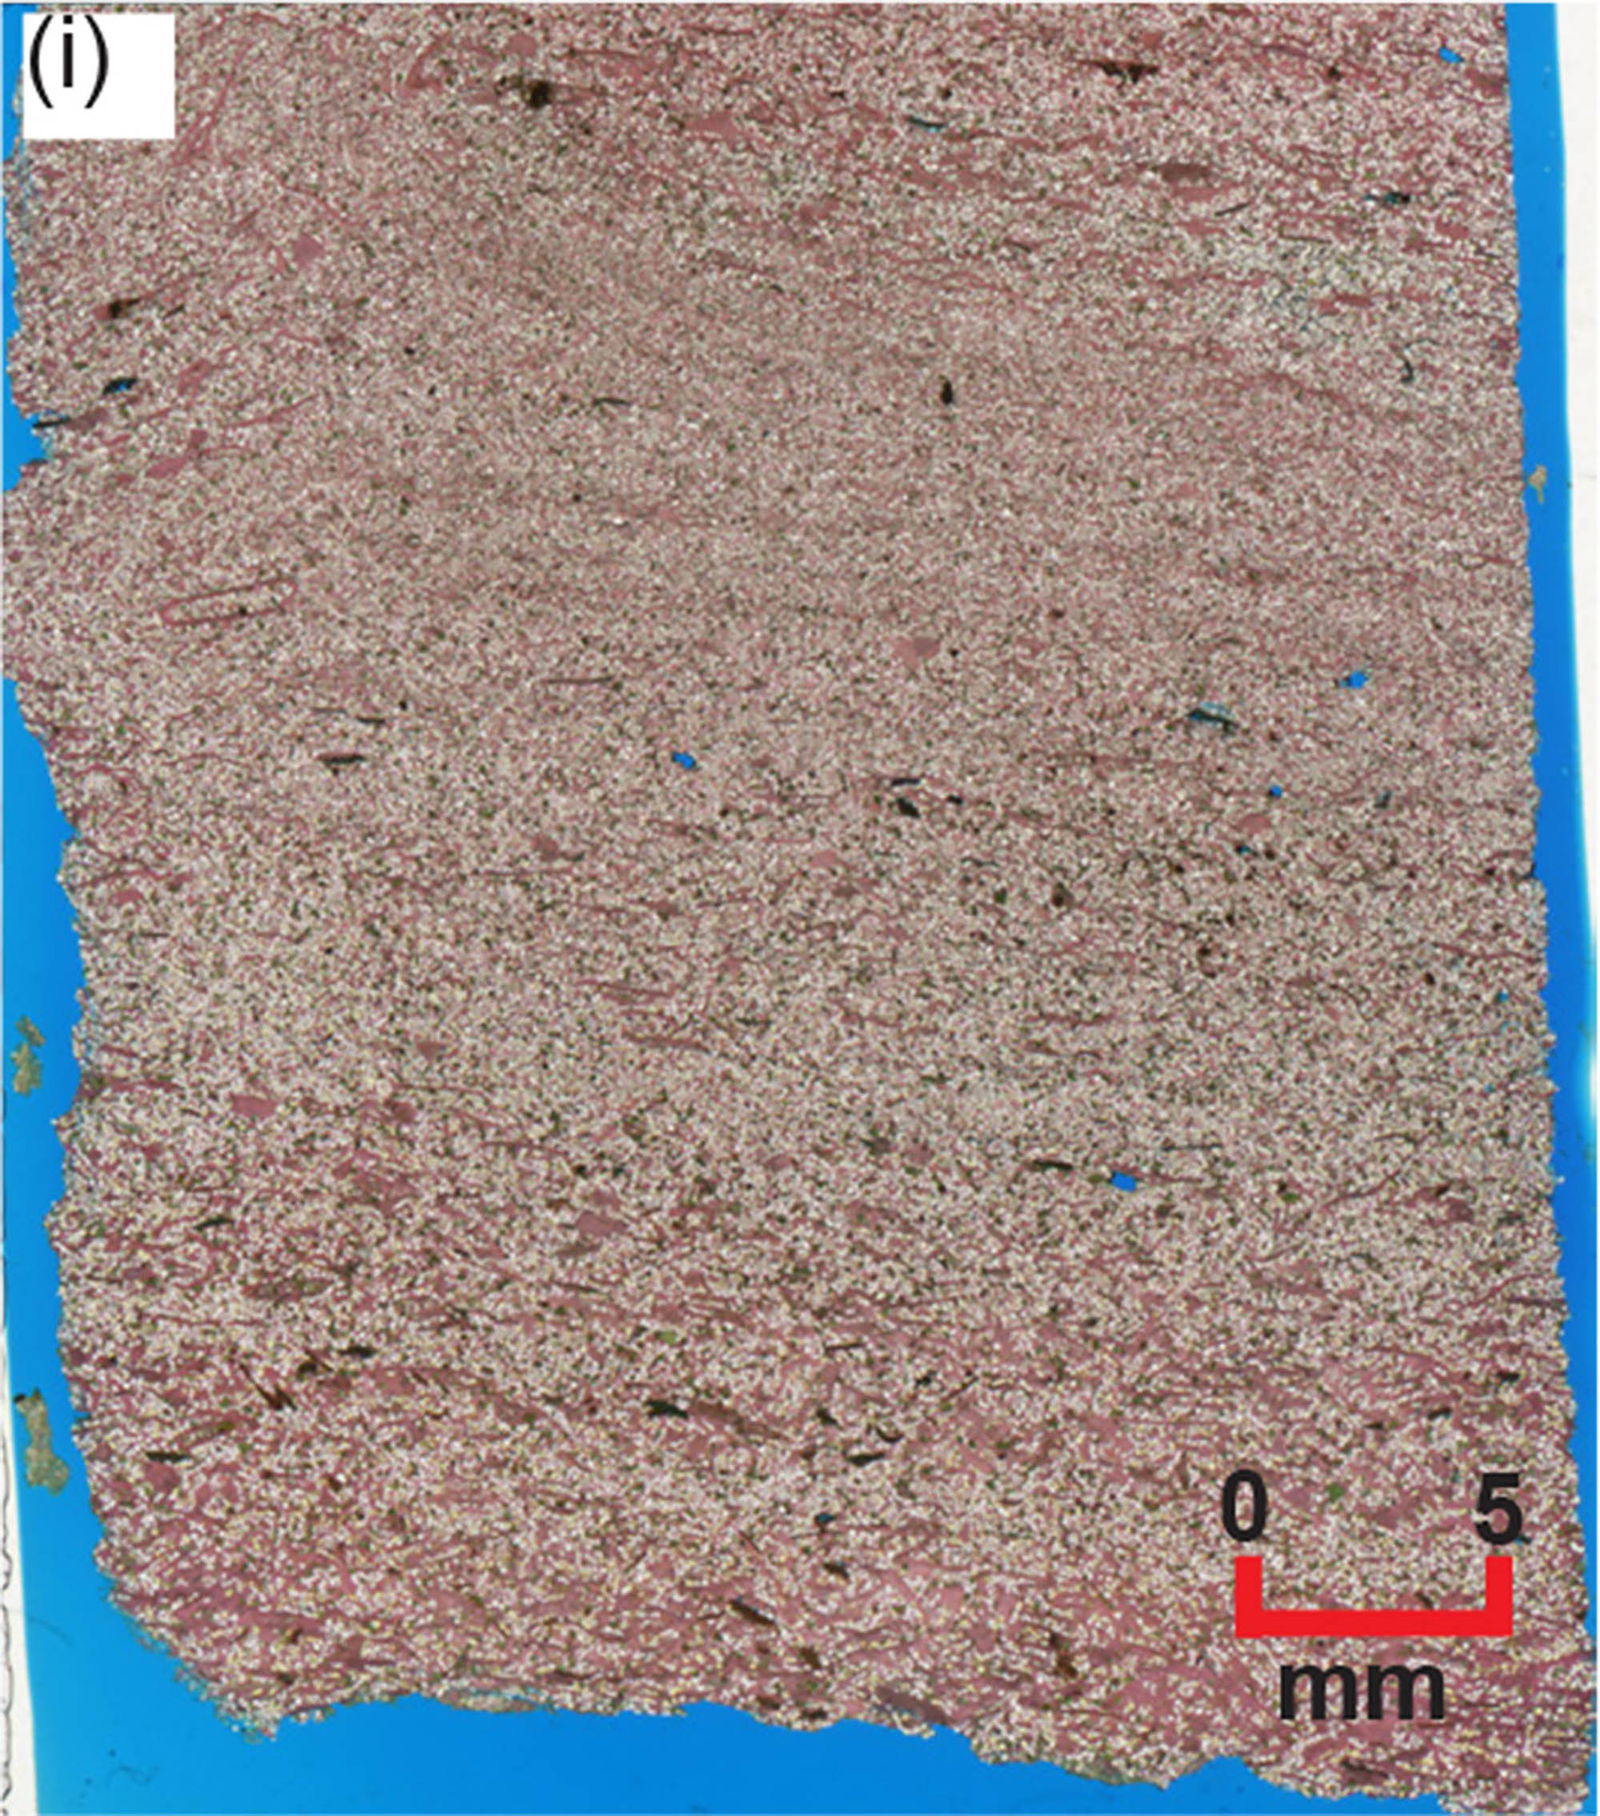
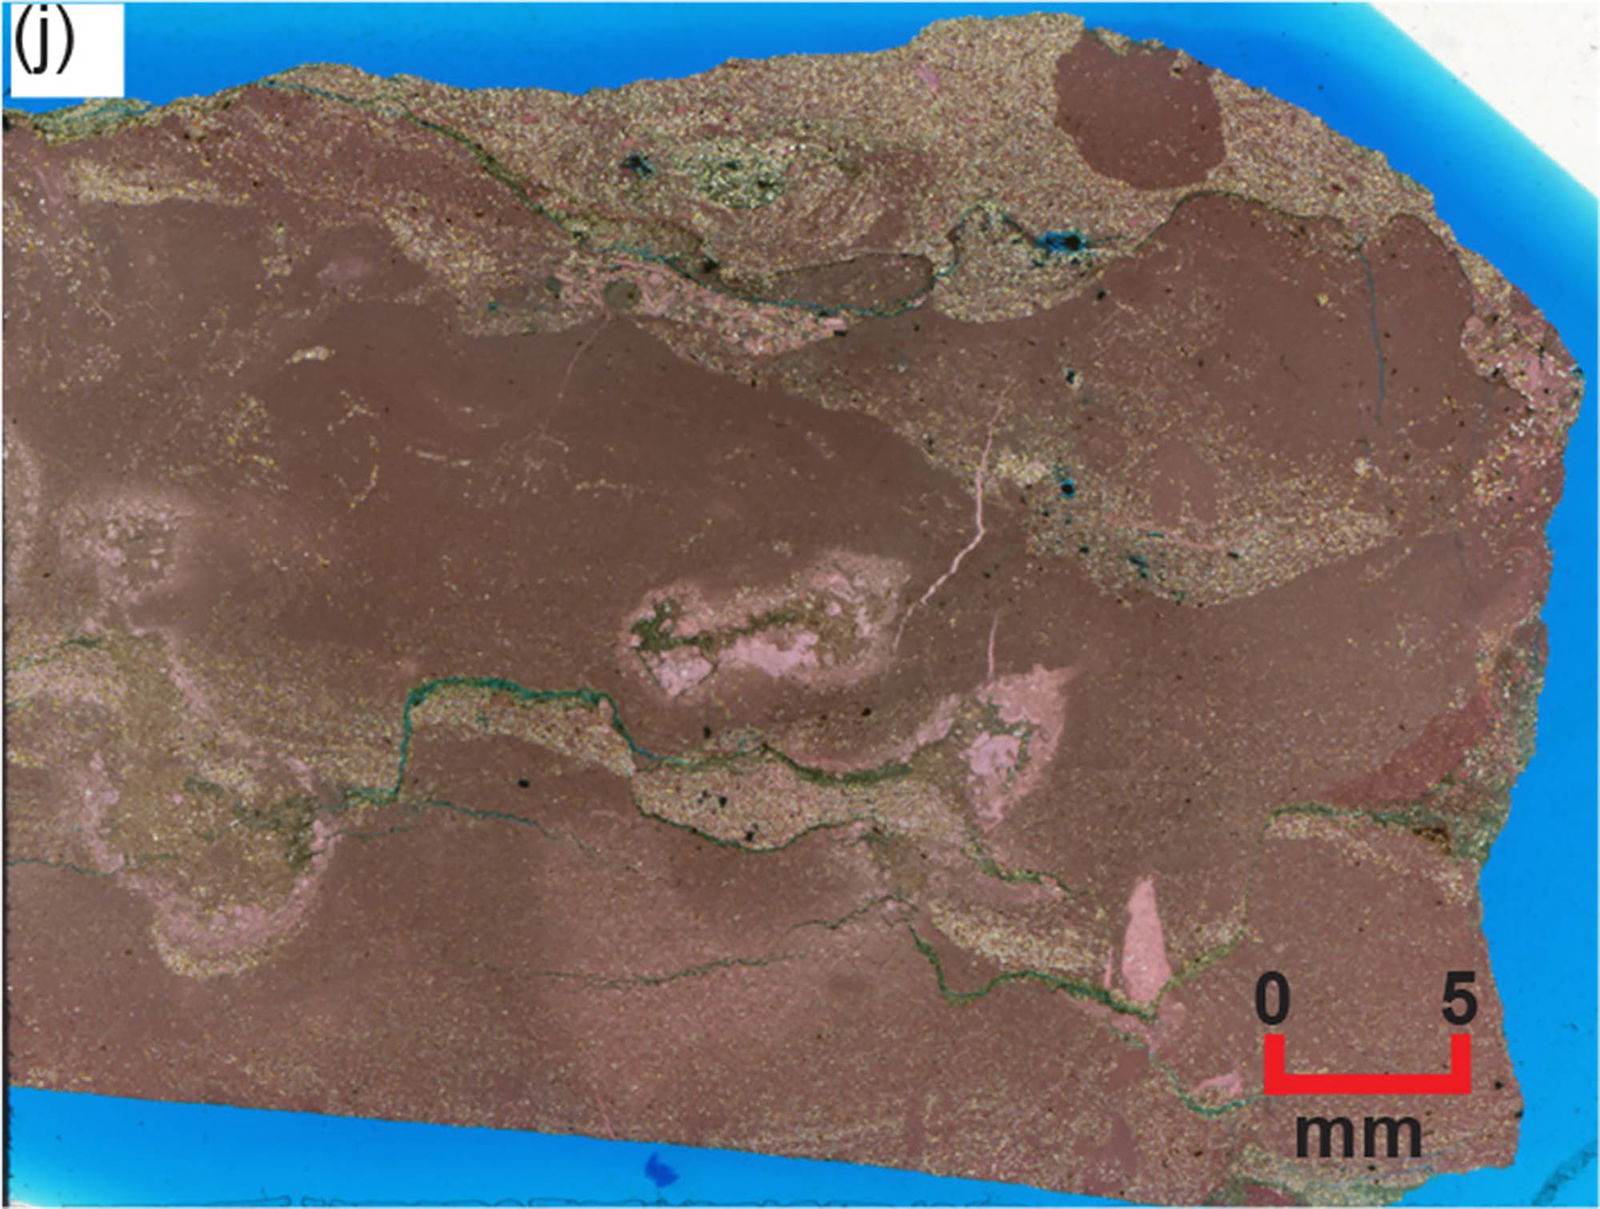
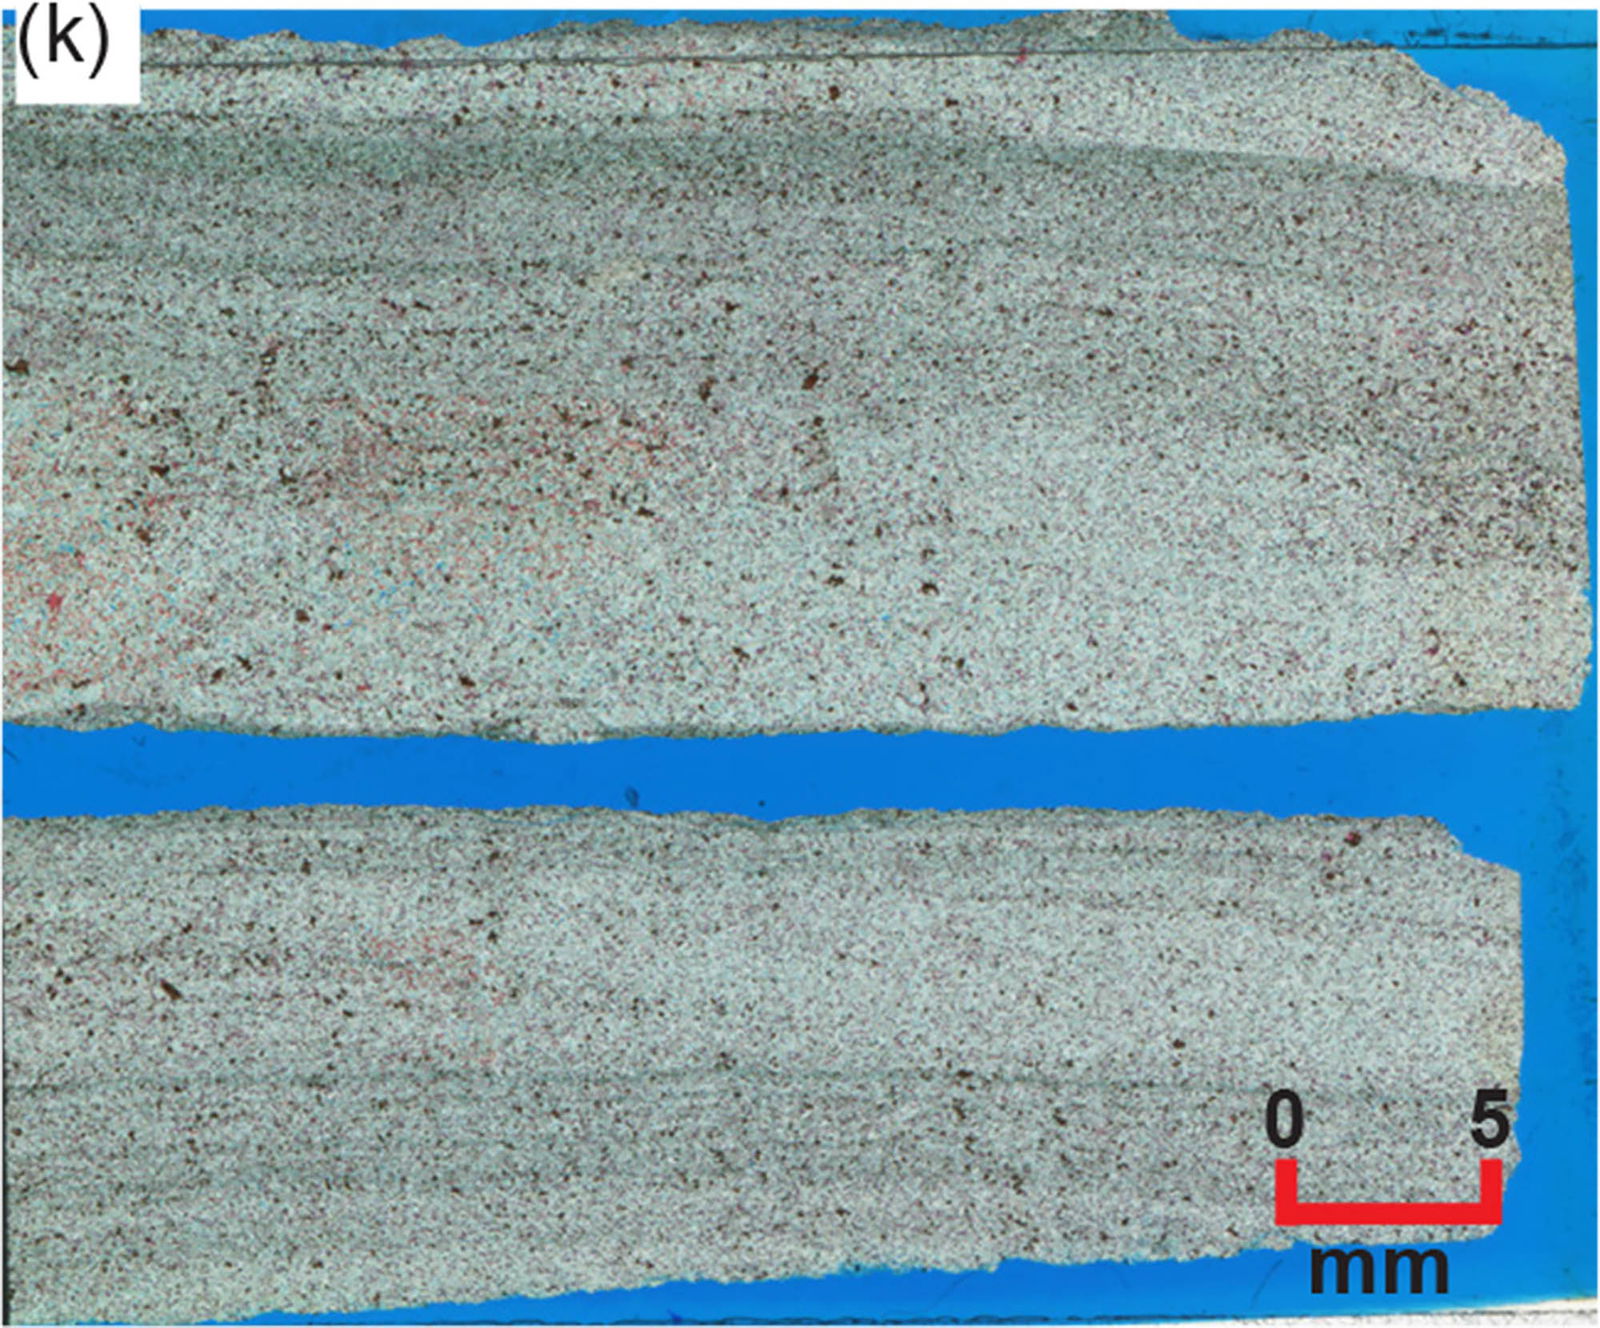
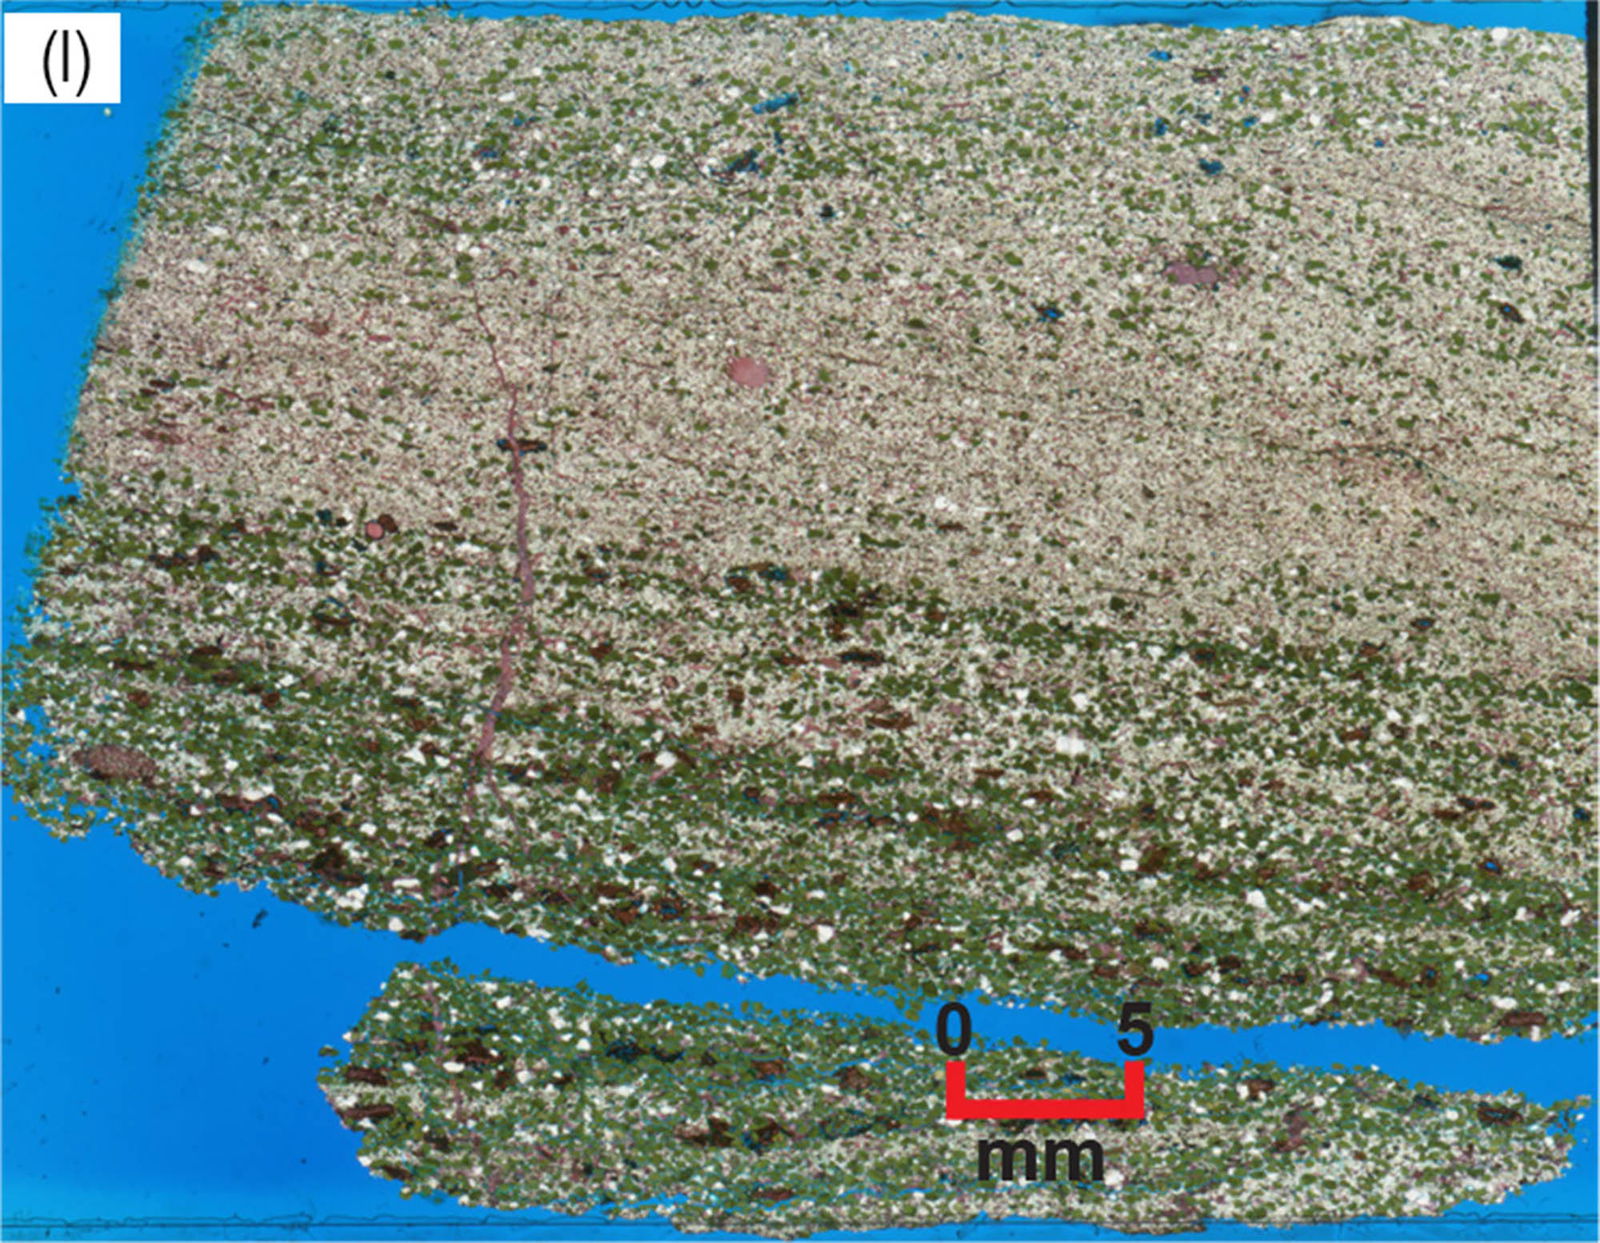
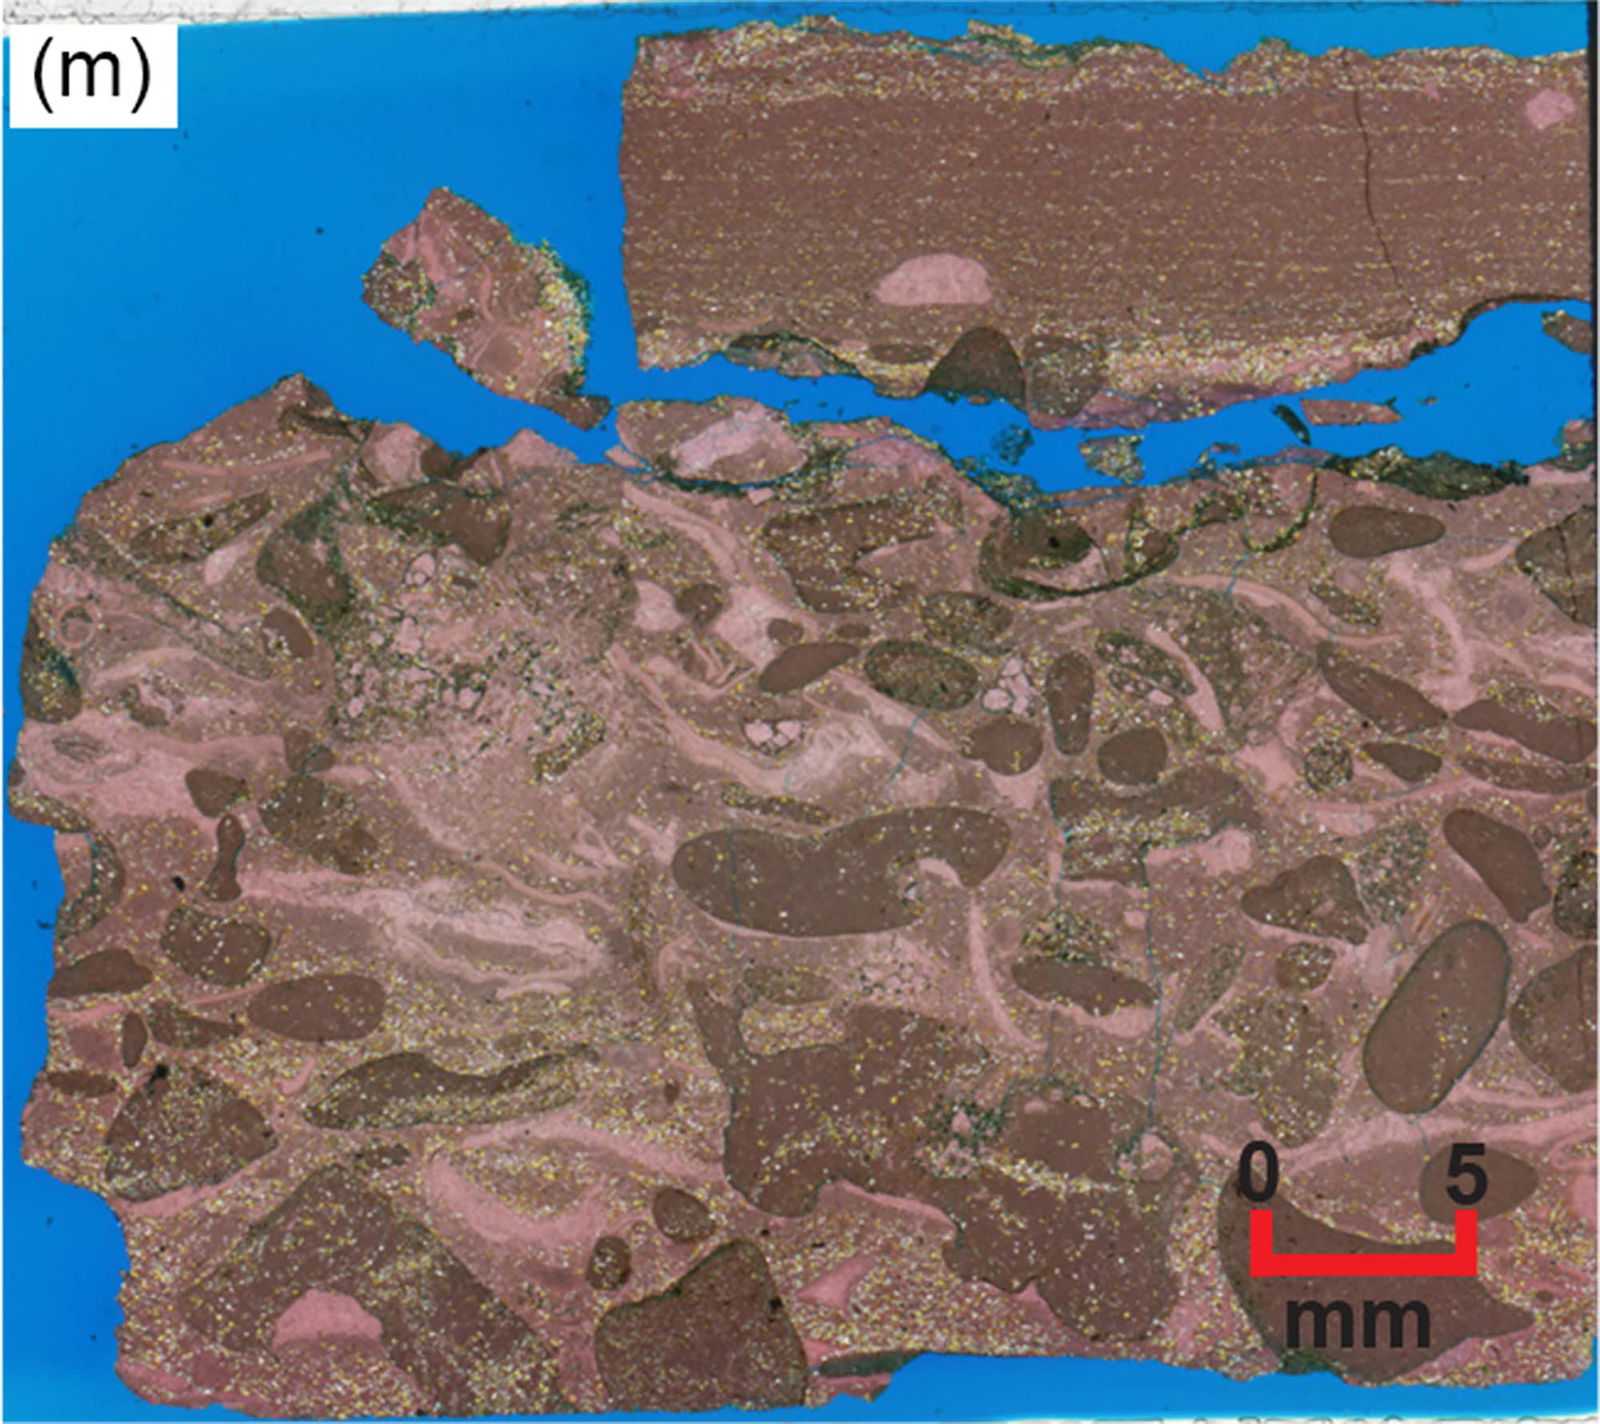
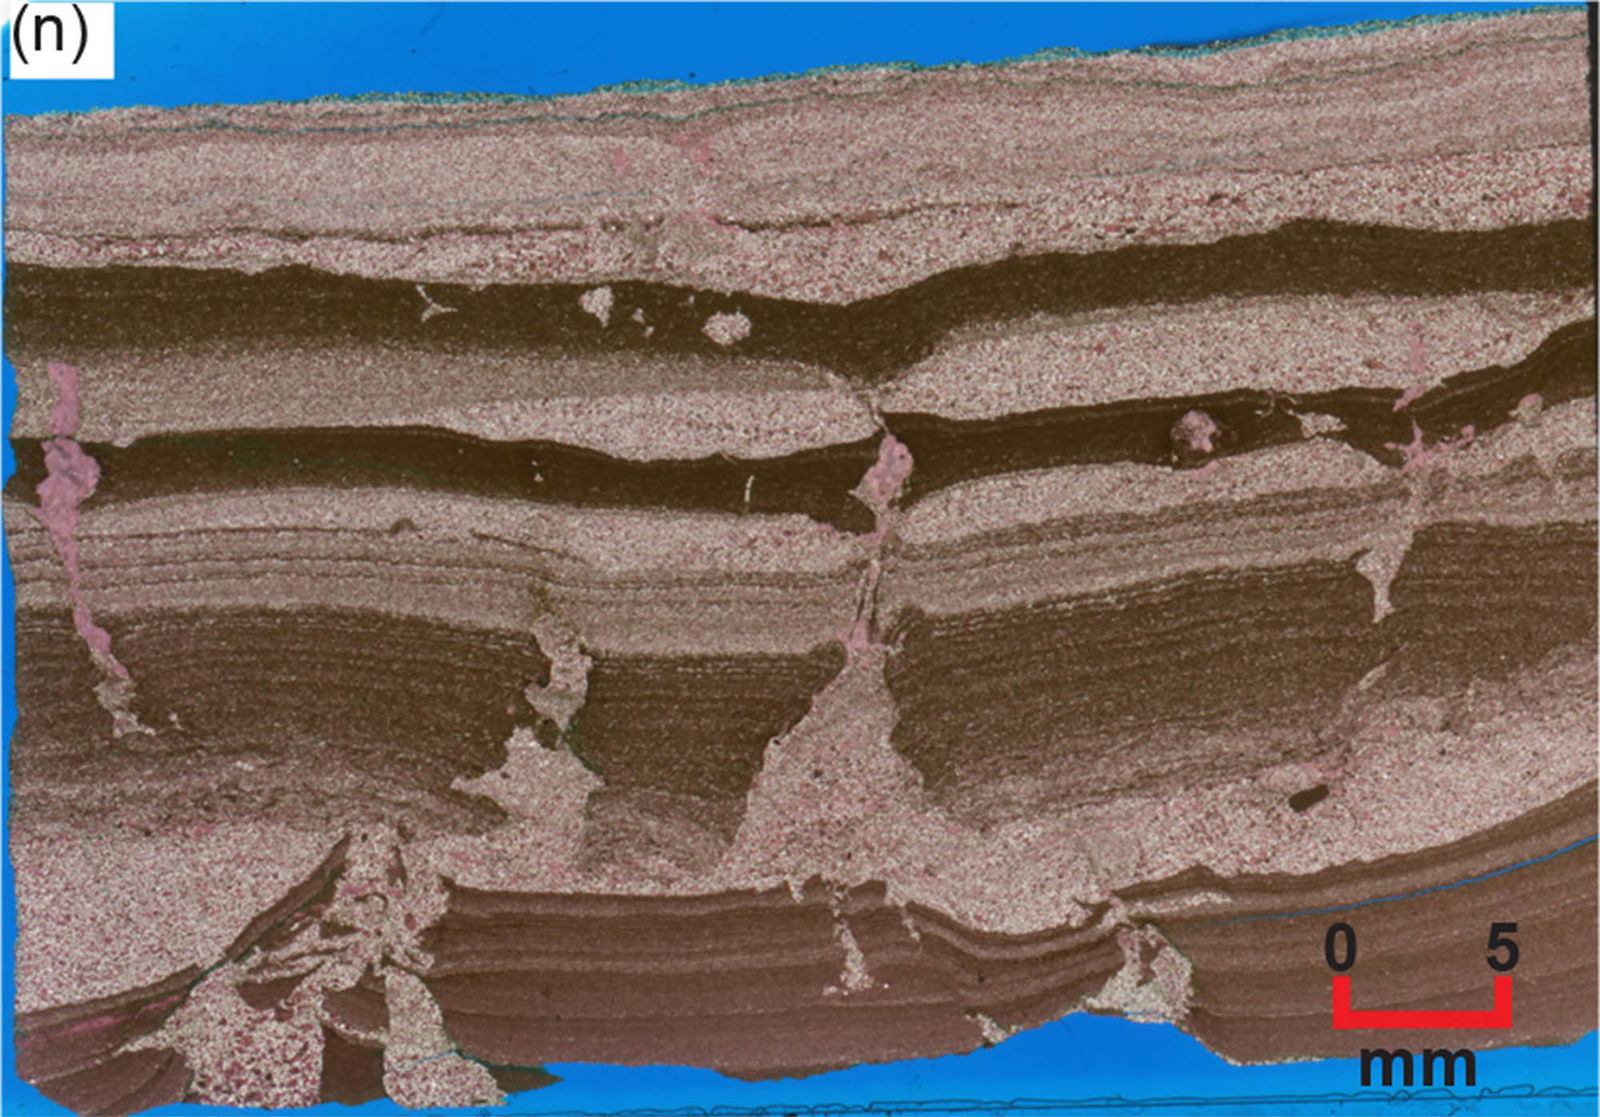
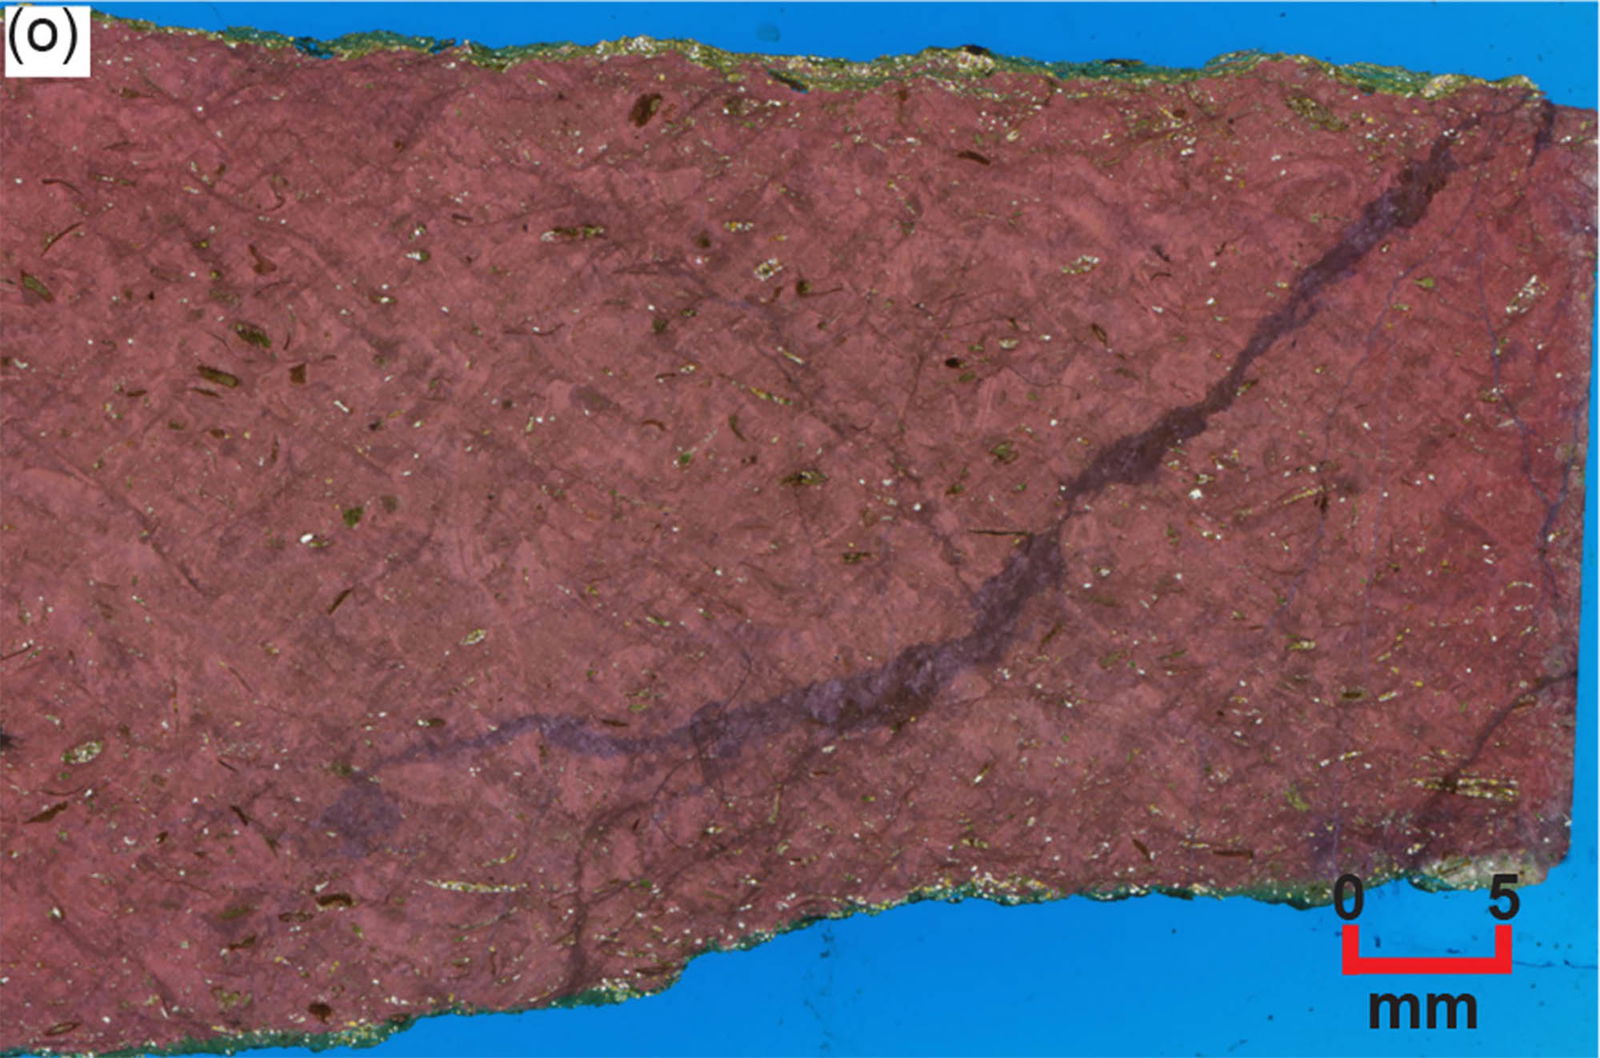
Fig. 23. High-resolution scans of the thin sections of the Muav Formation samples at normal hand specimen scale (scale bars indicate ~5 mm), orientated so that the bedding is across the image and the upside is to the top. (a) MLS-01, (b) MFTB-01, (c) MFTB-06, (d) MFML-01, (e) MFML-06, (f) MFTB-02, (g) MFML-02, (h) MFML-05, (i) MFTB-03, (j) MLS-02, (k) MFML-03, (l) MFTB-04, (m) MLS-03, (n) MFML-04, and (o) MFTB-05.
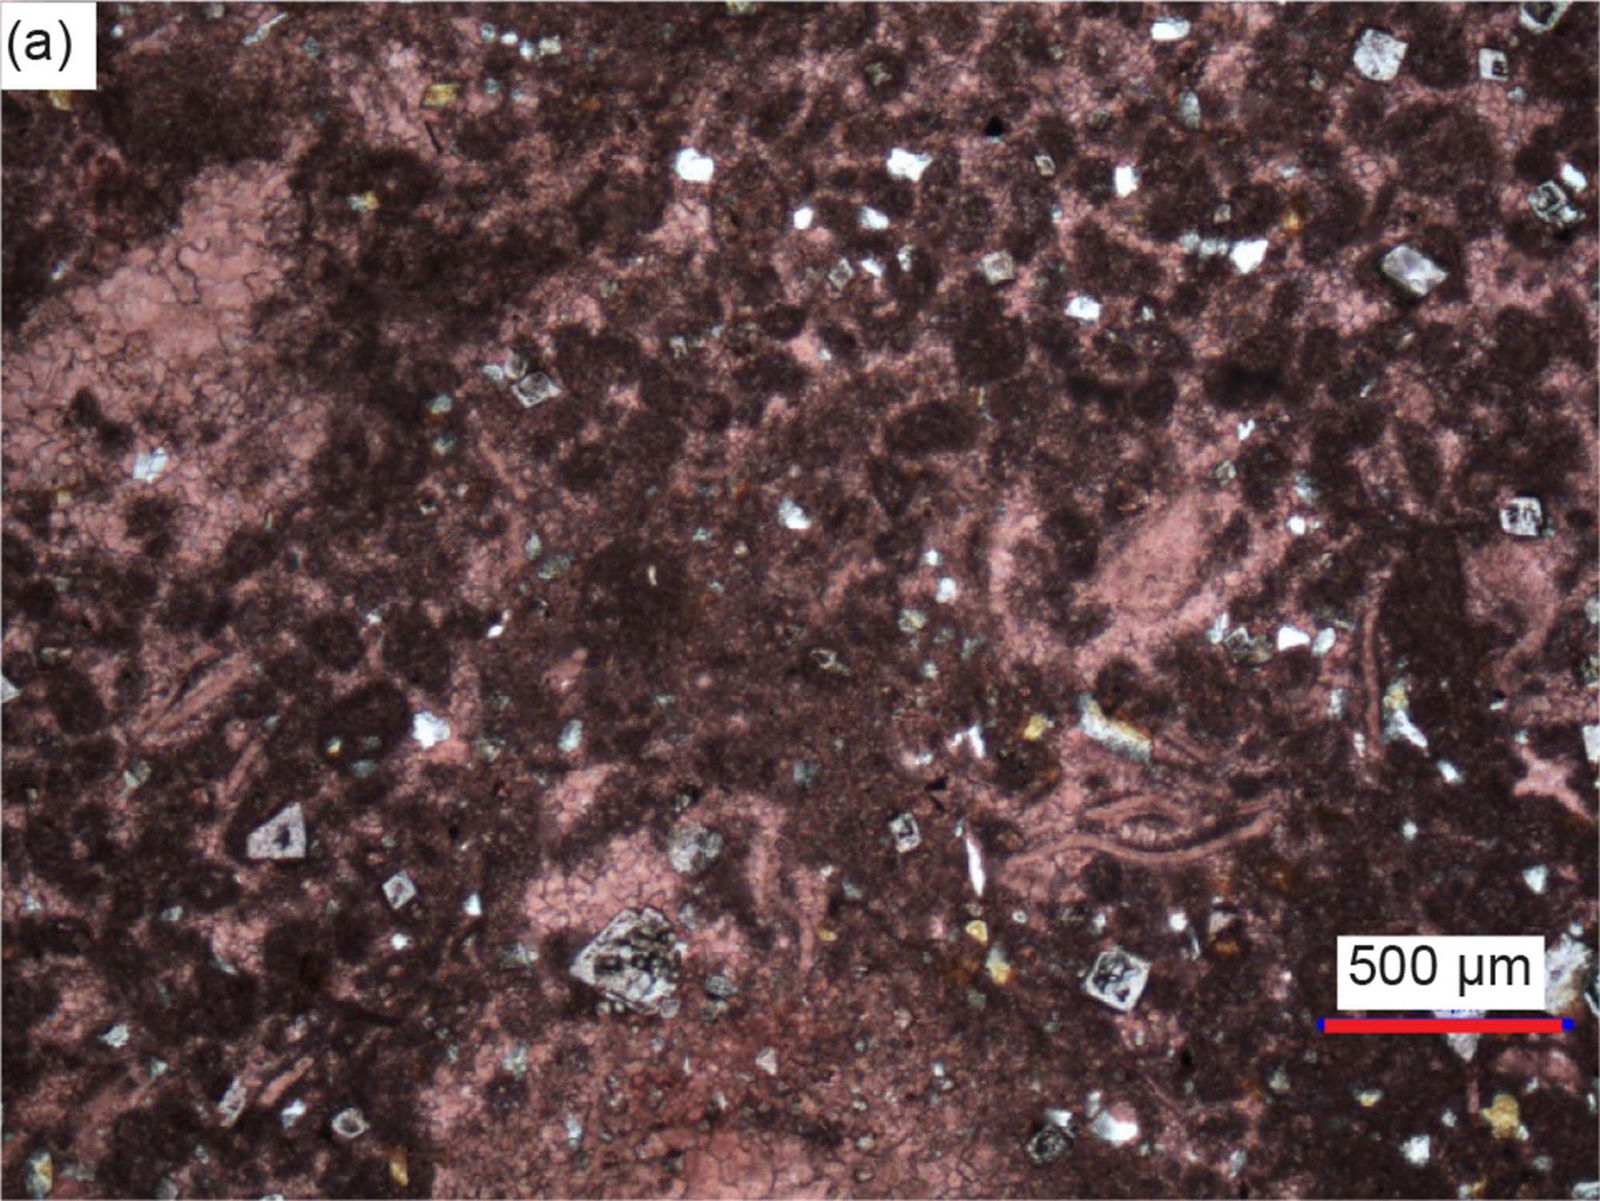
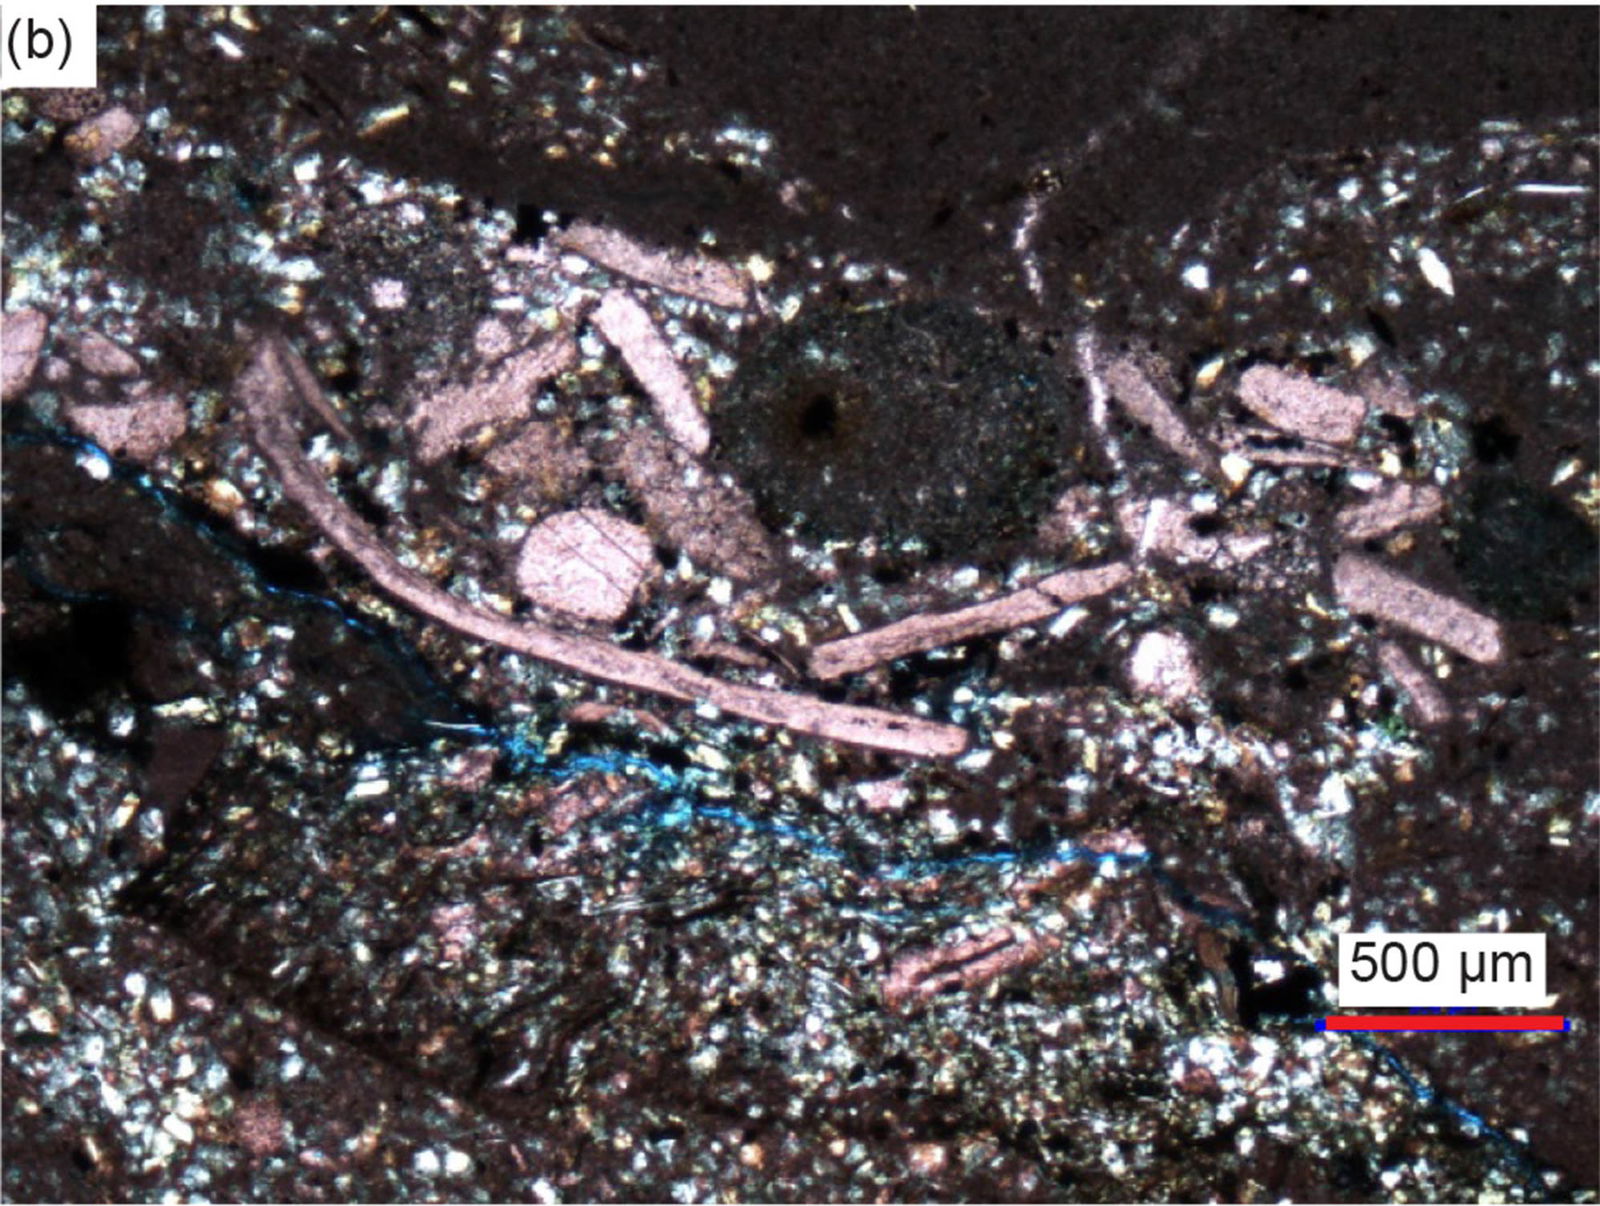
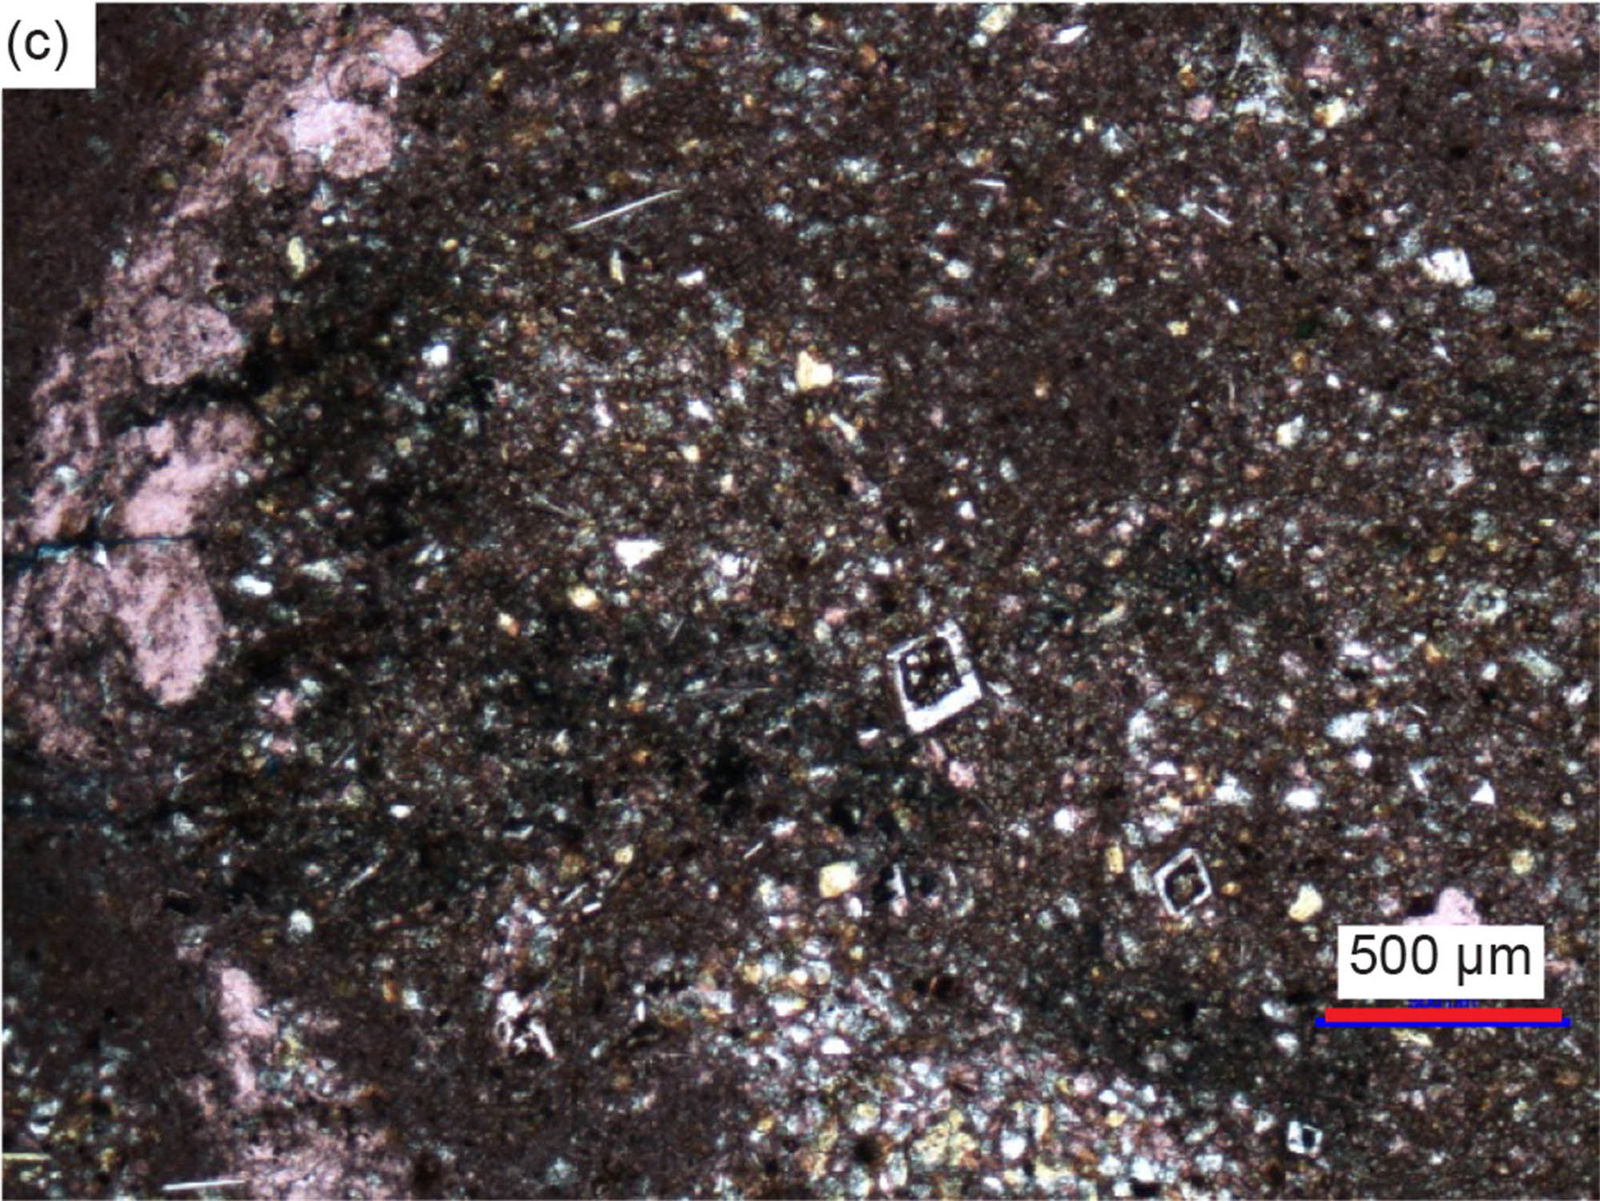
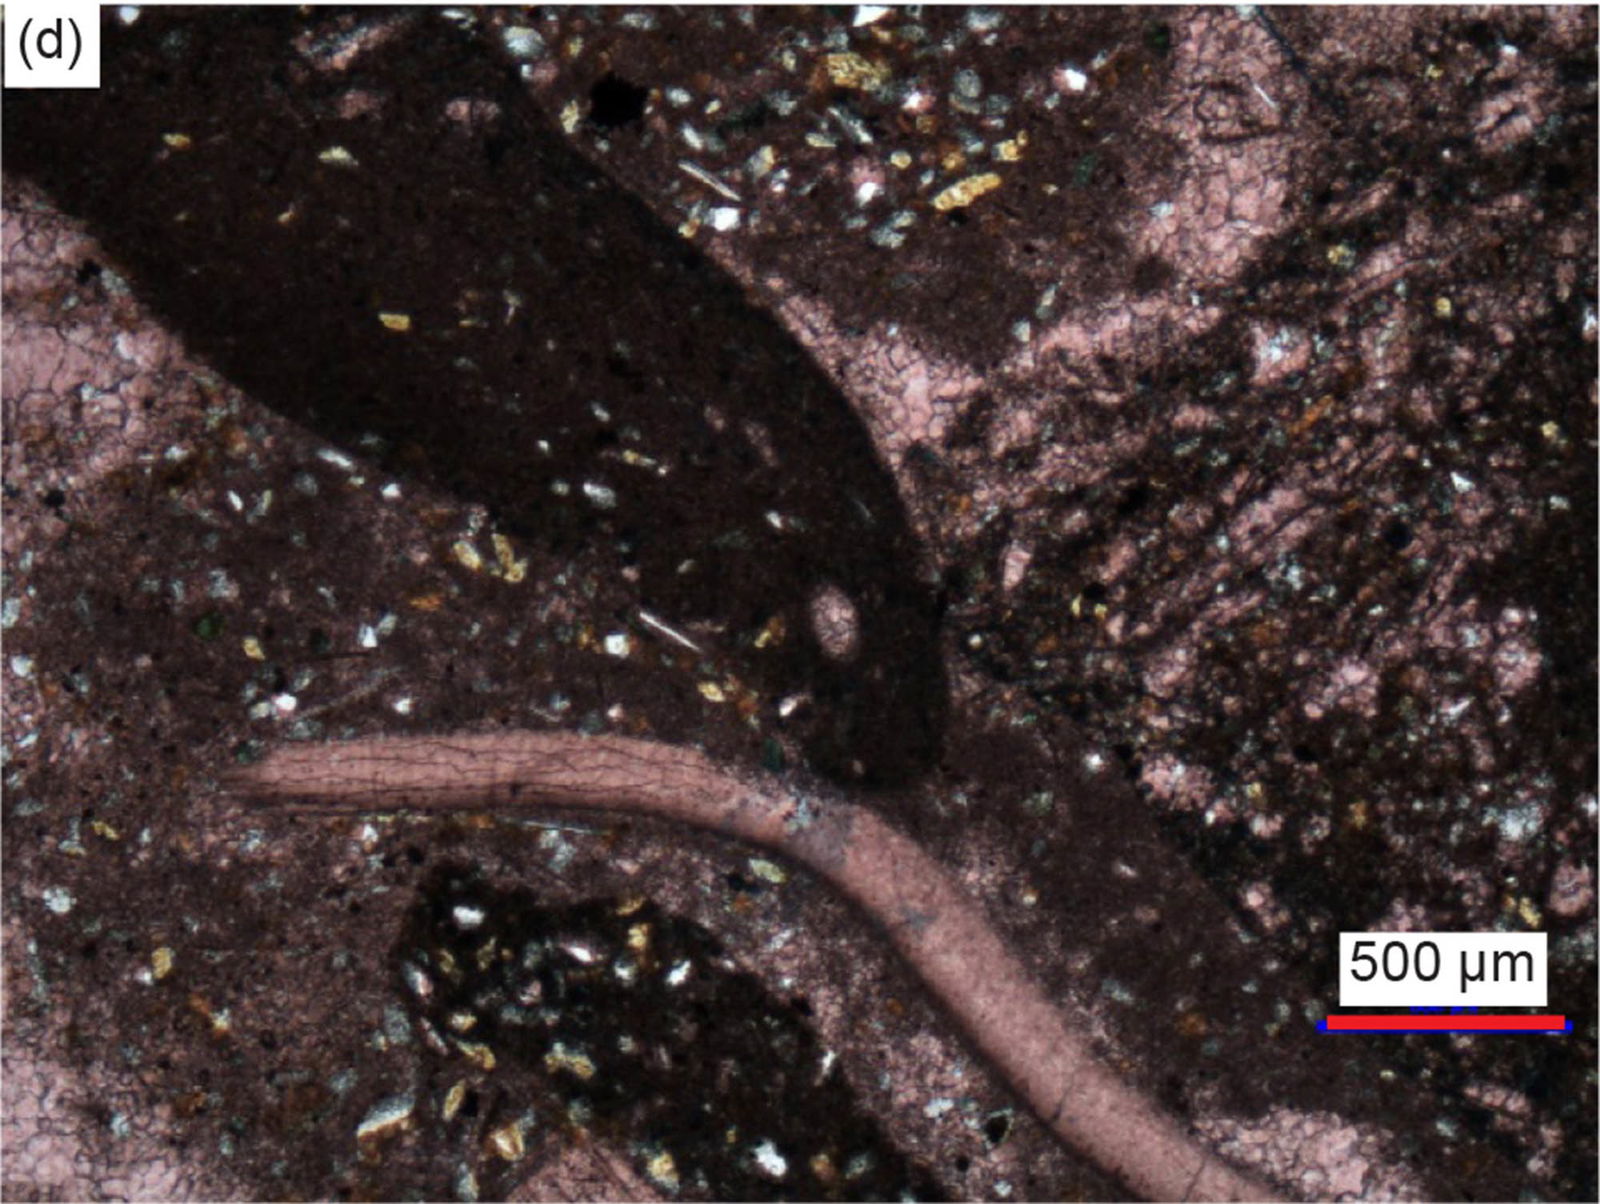
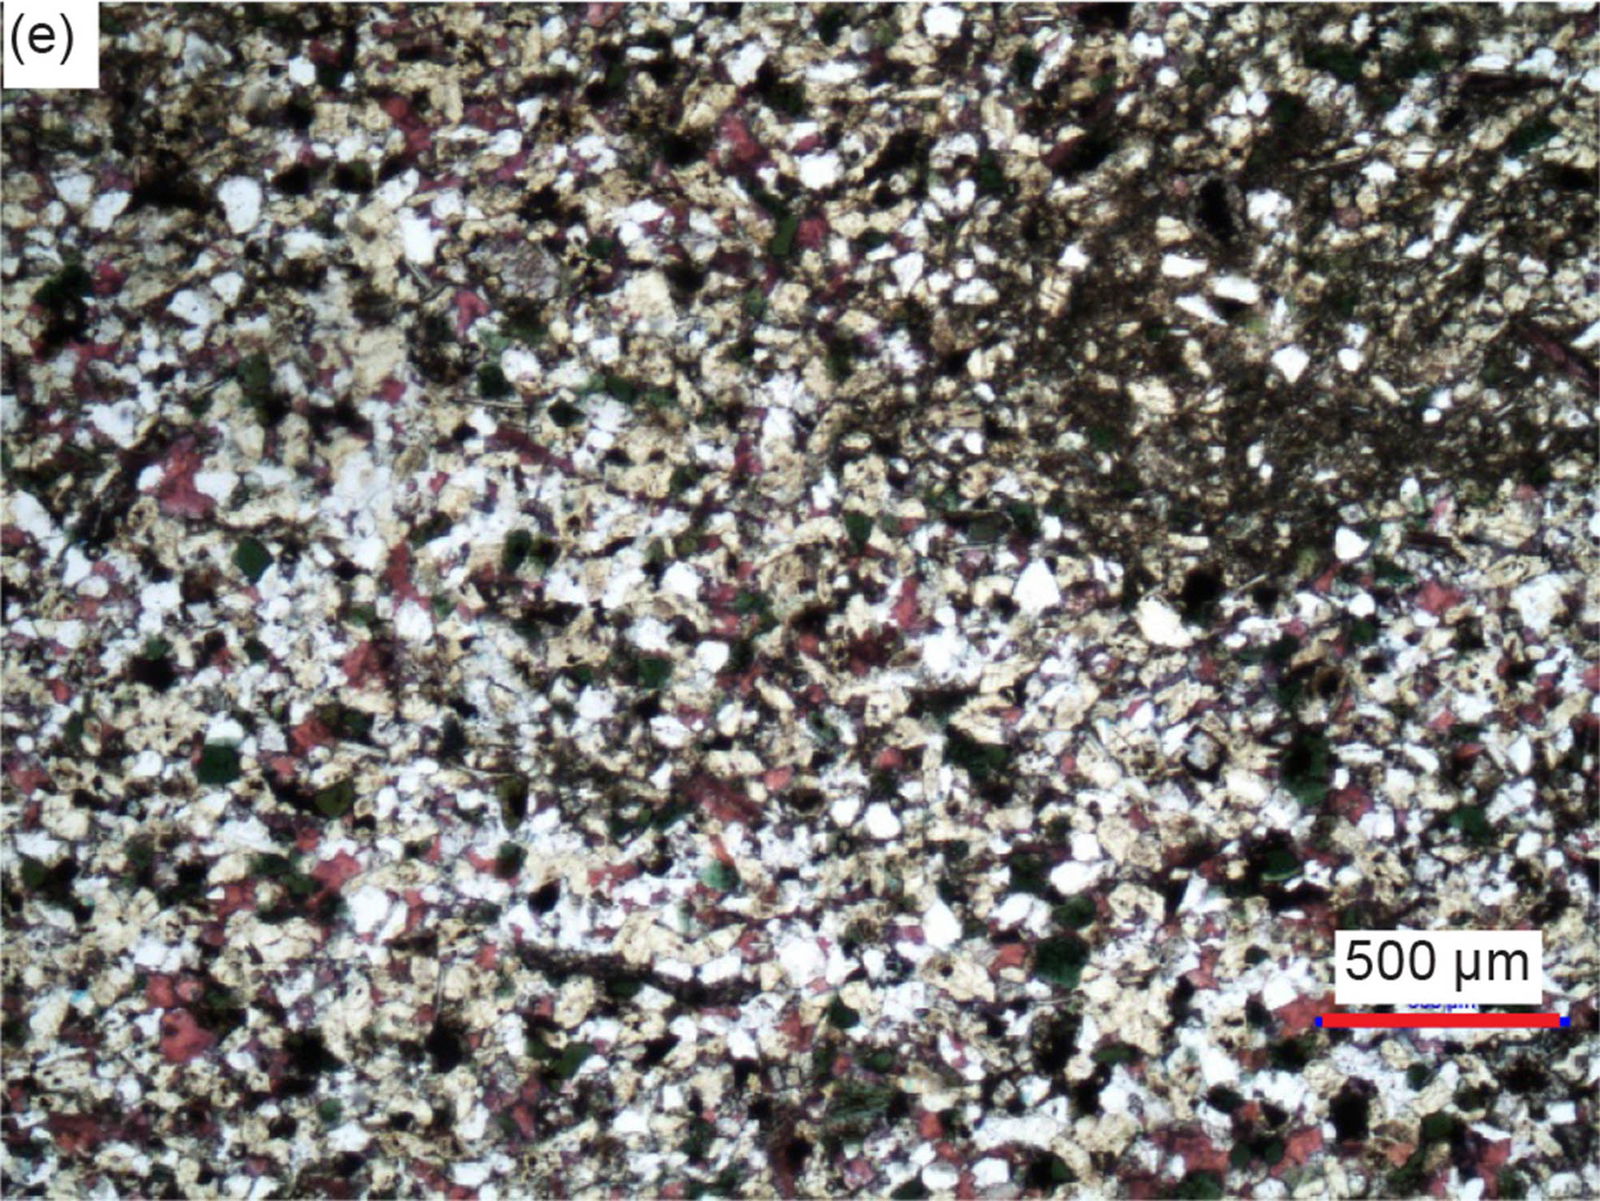
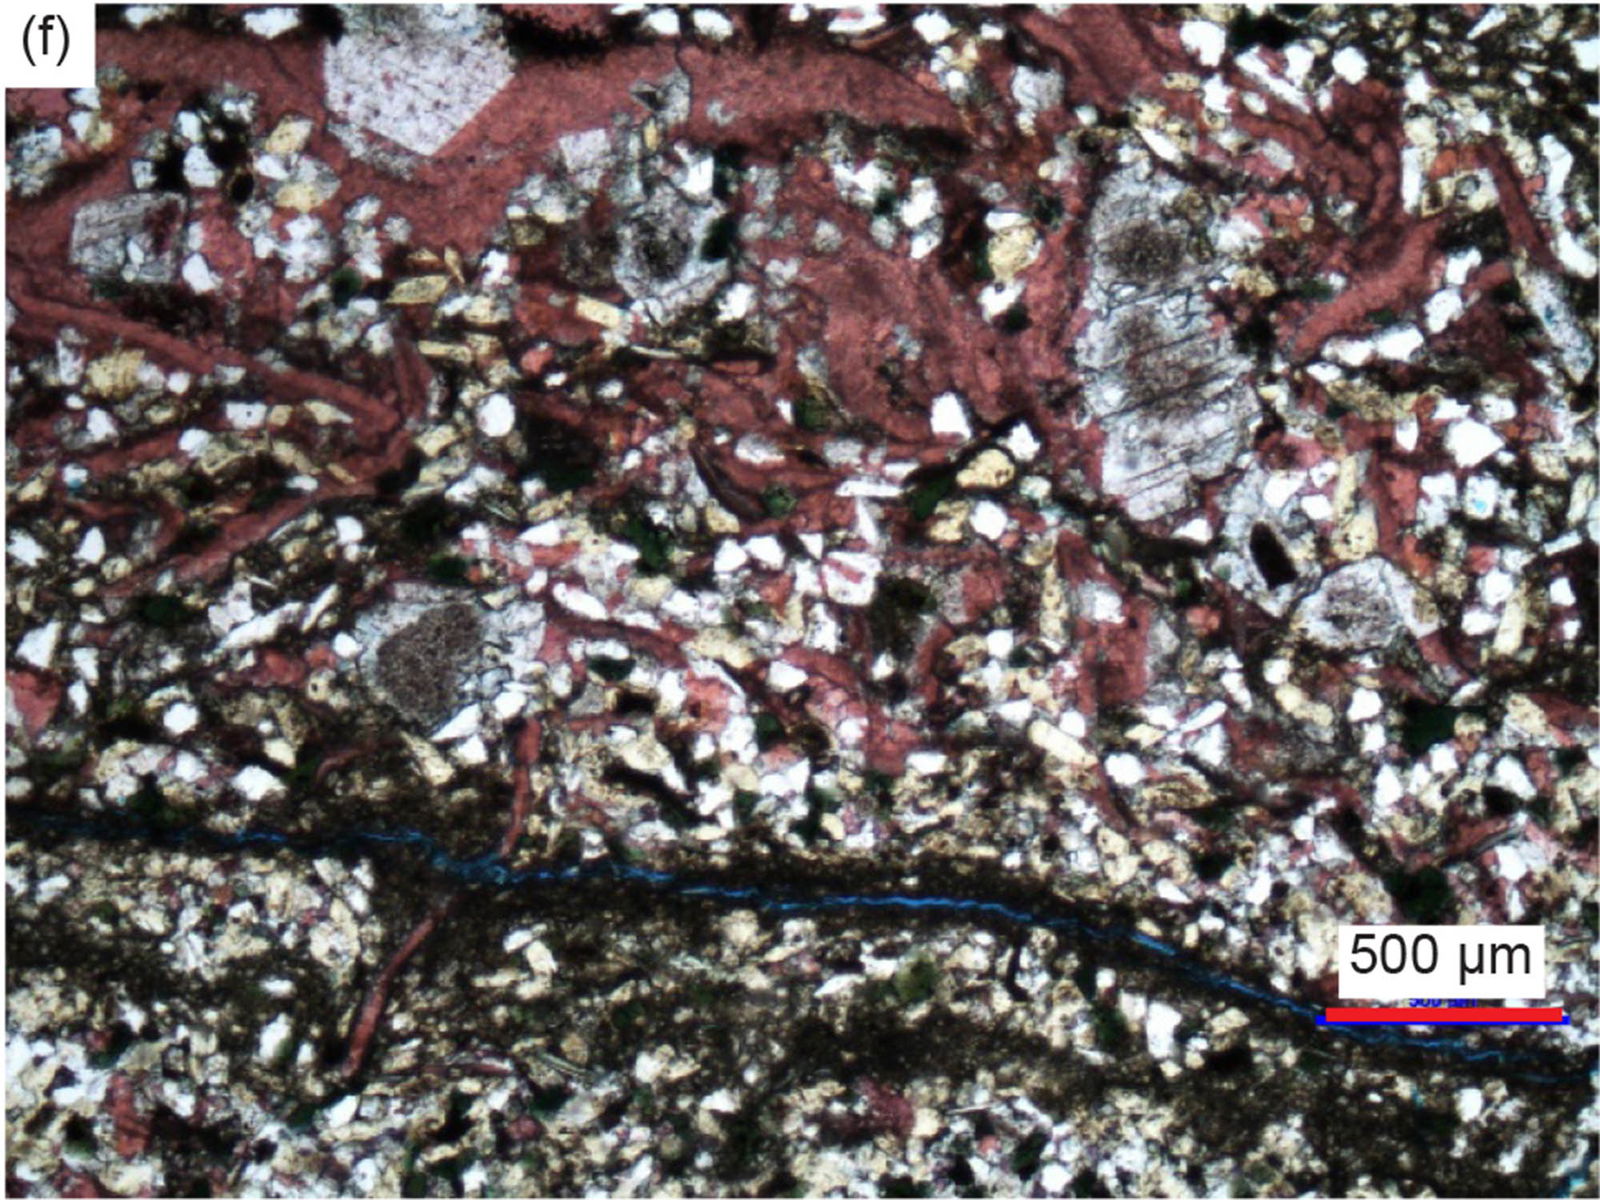
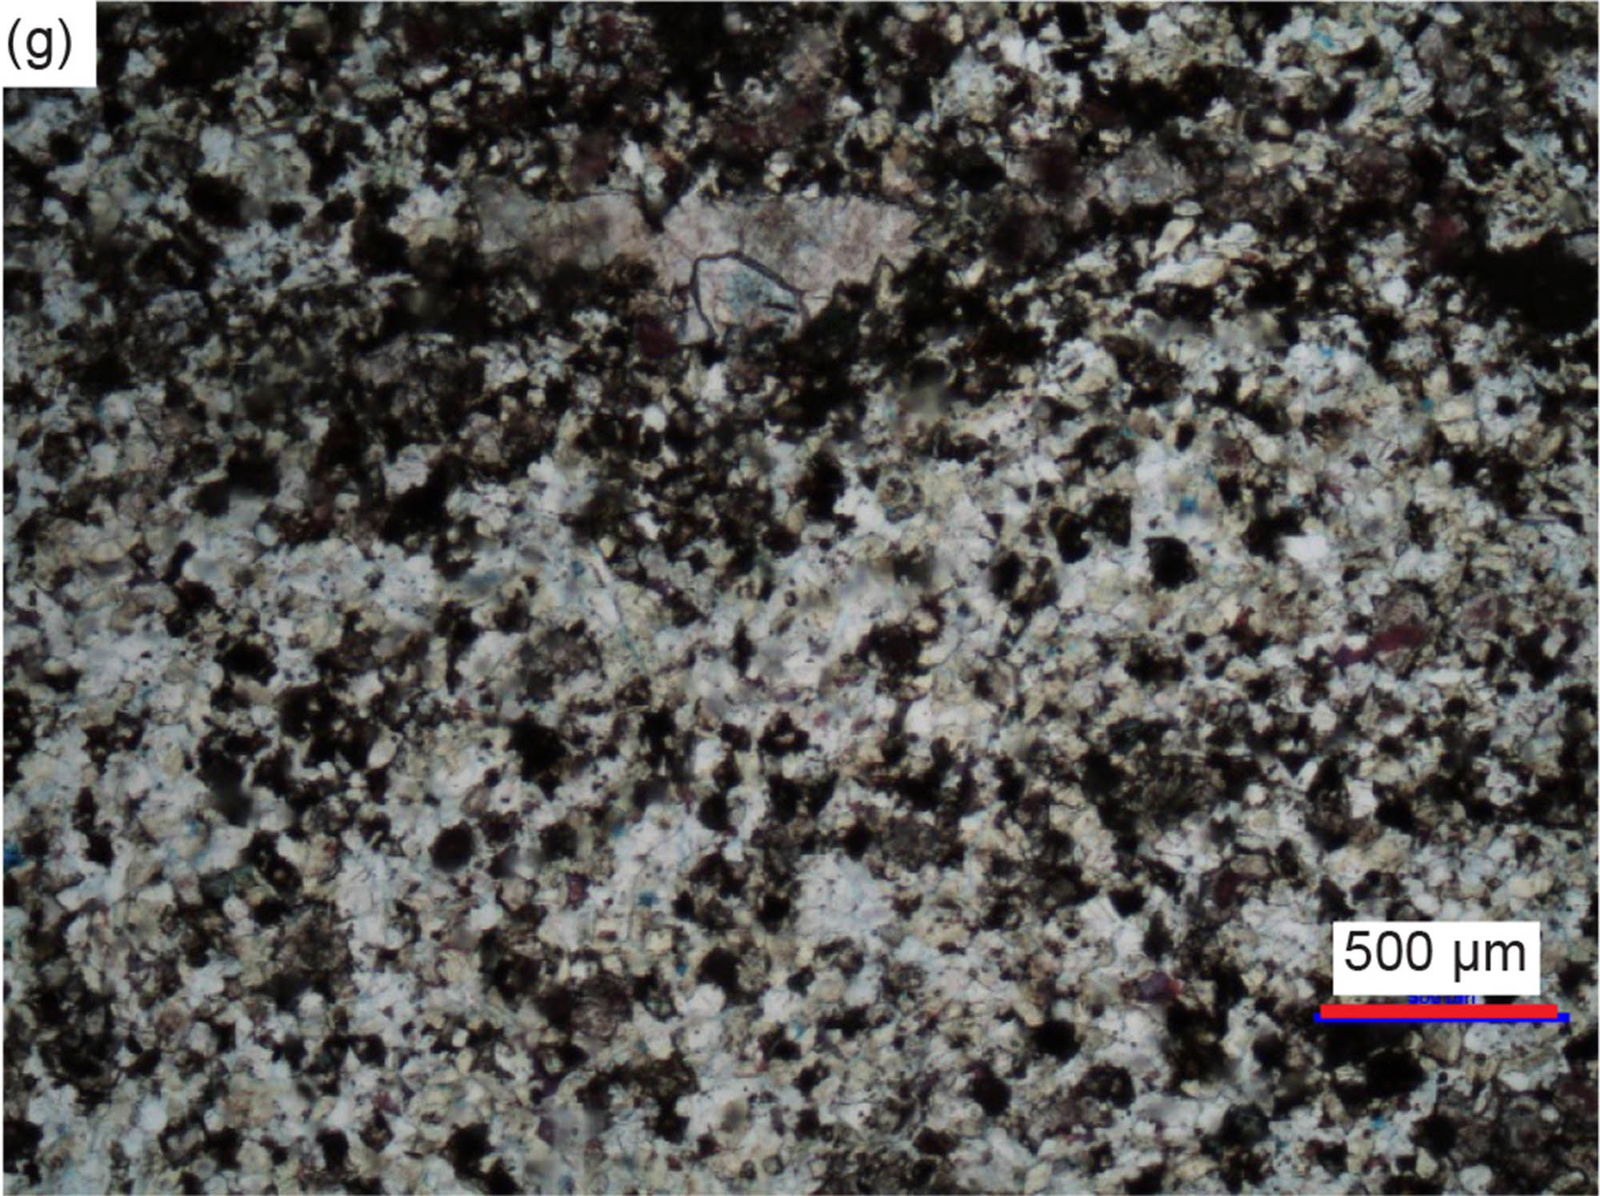
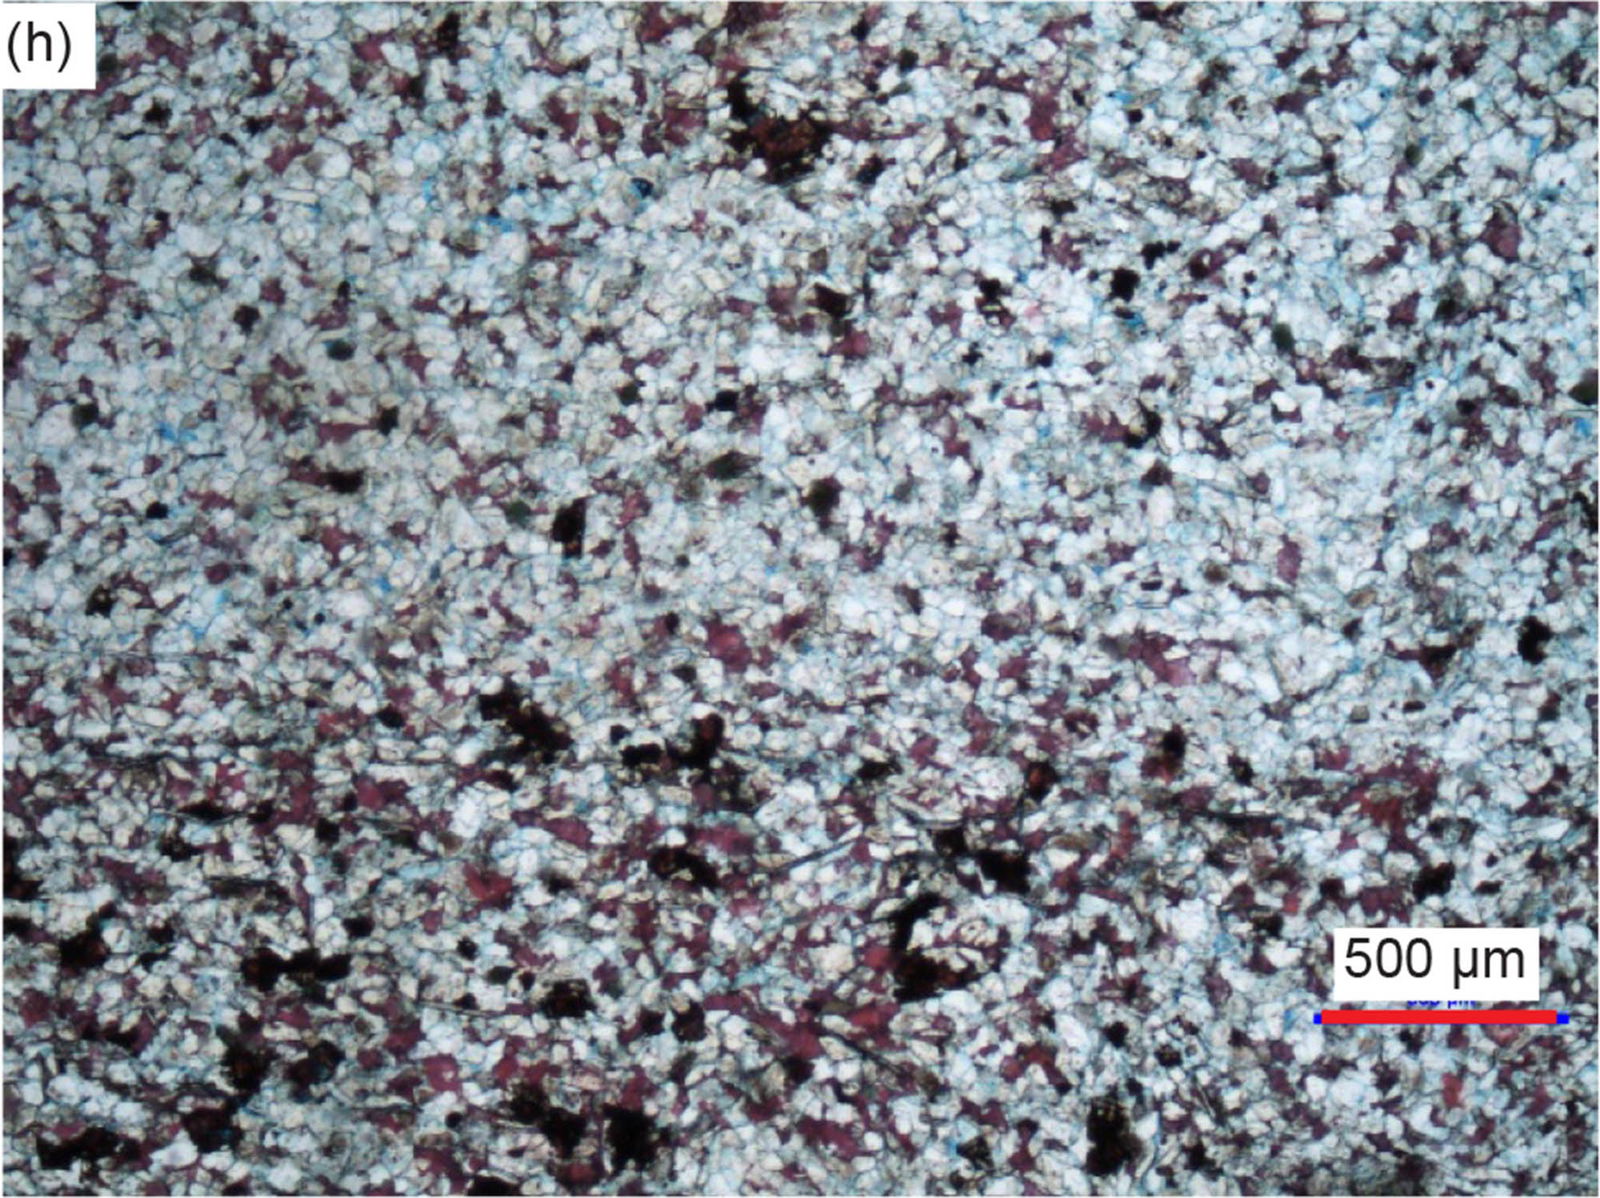
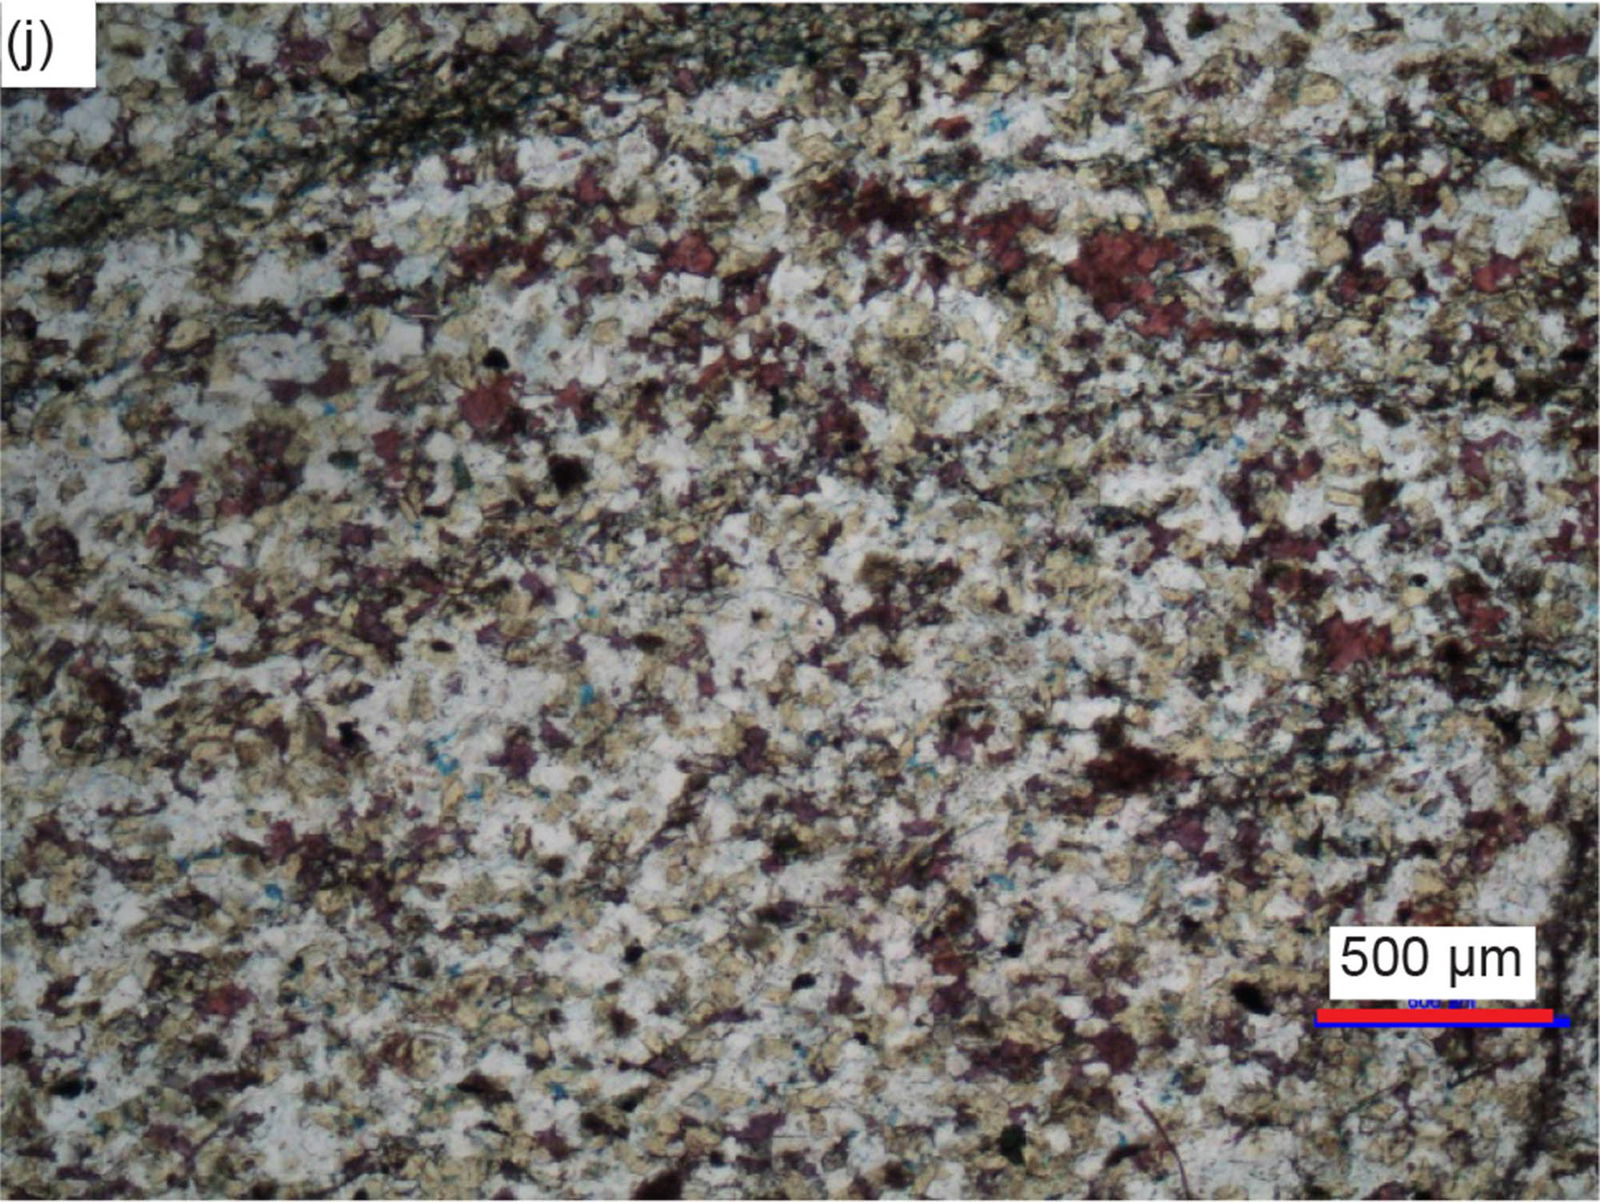
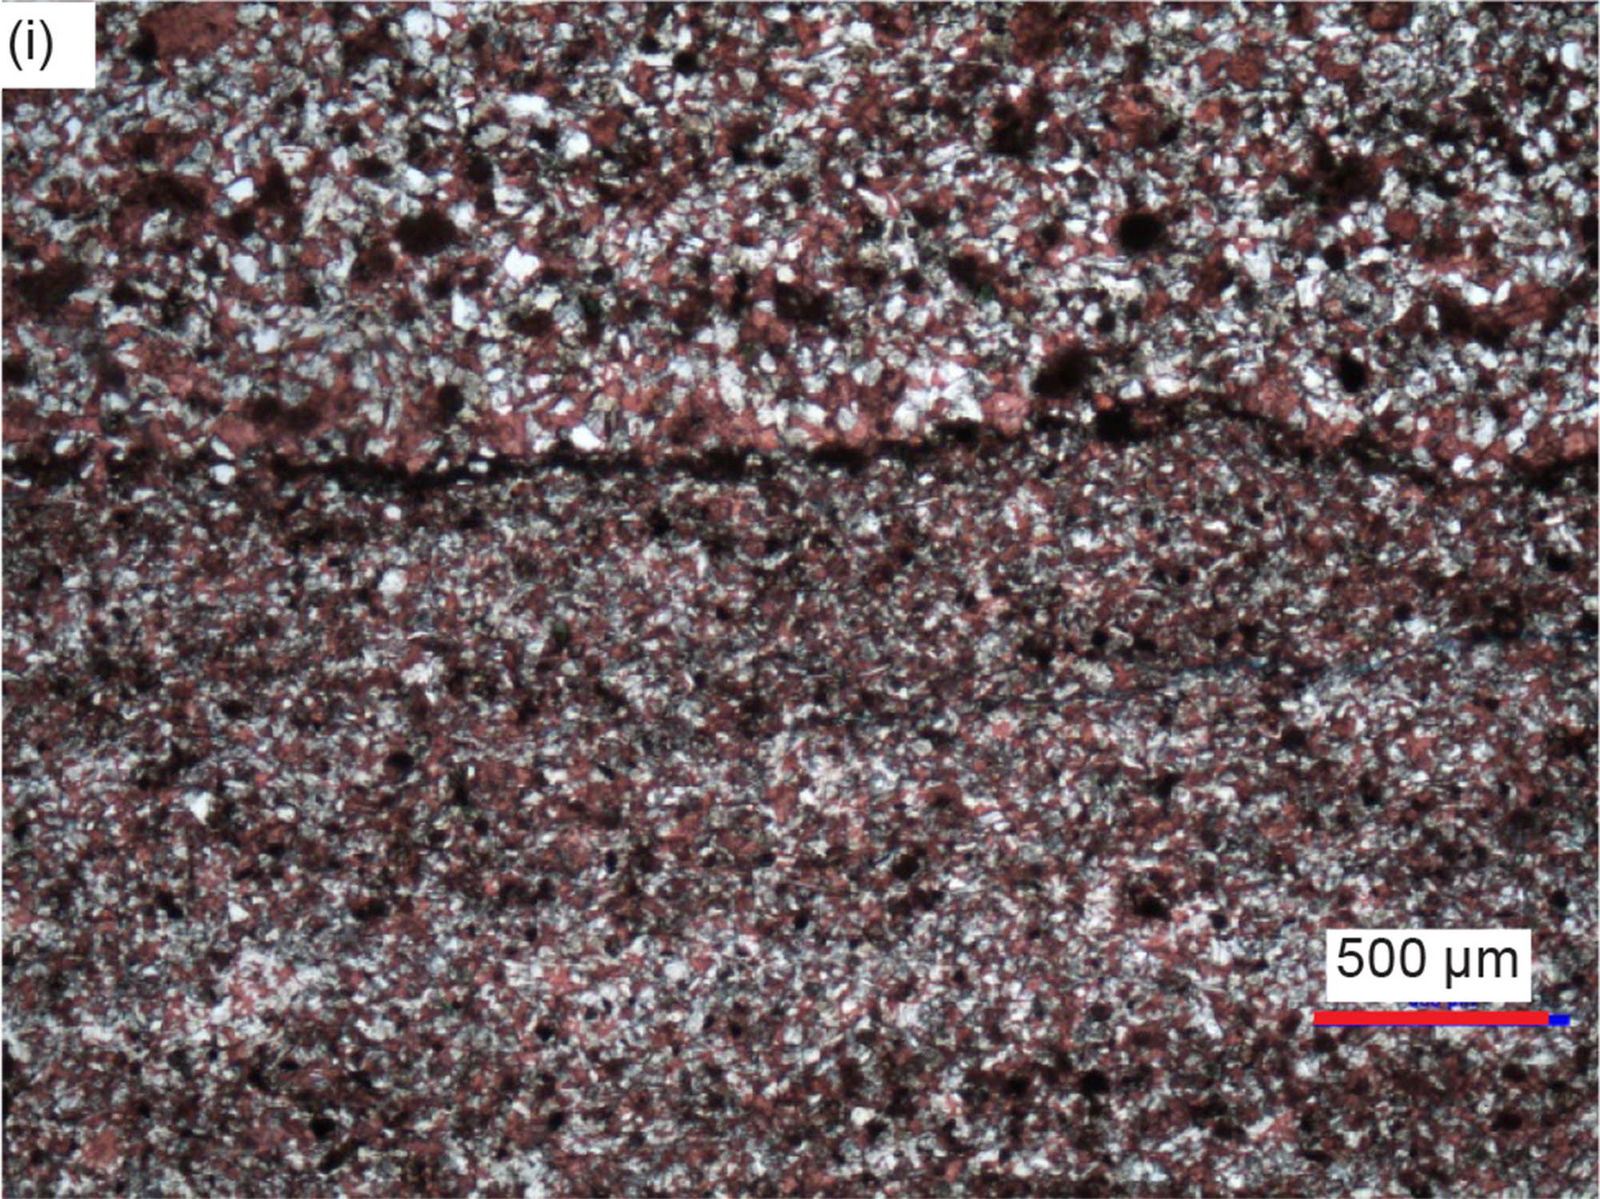
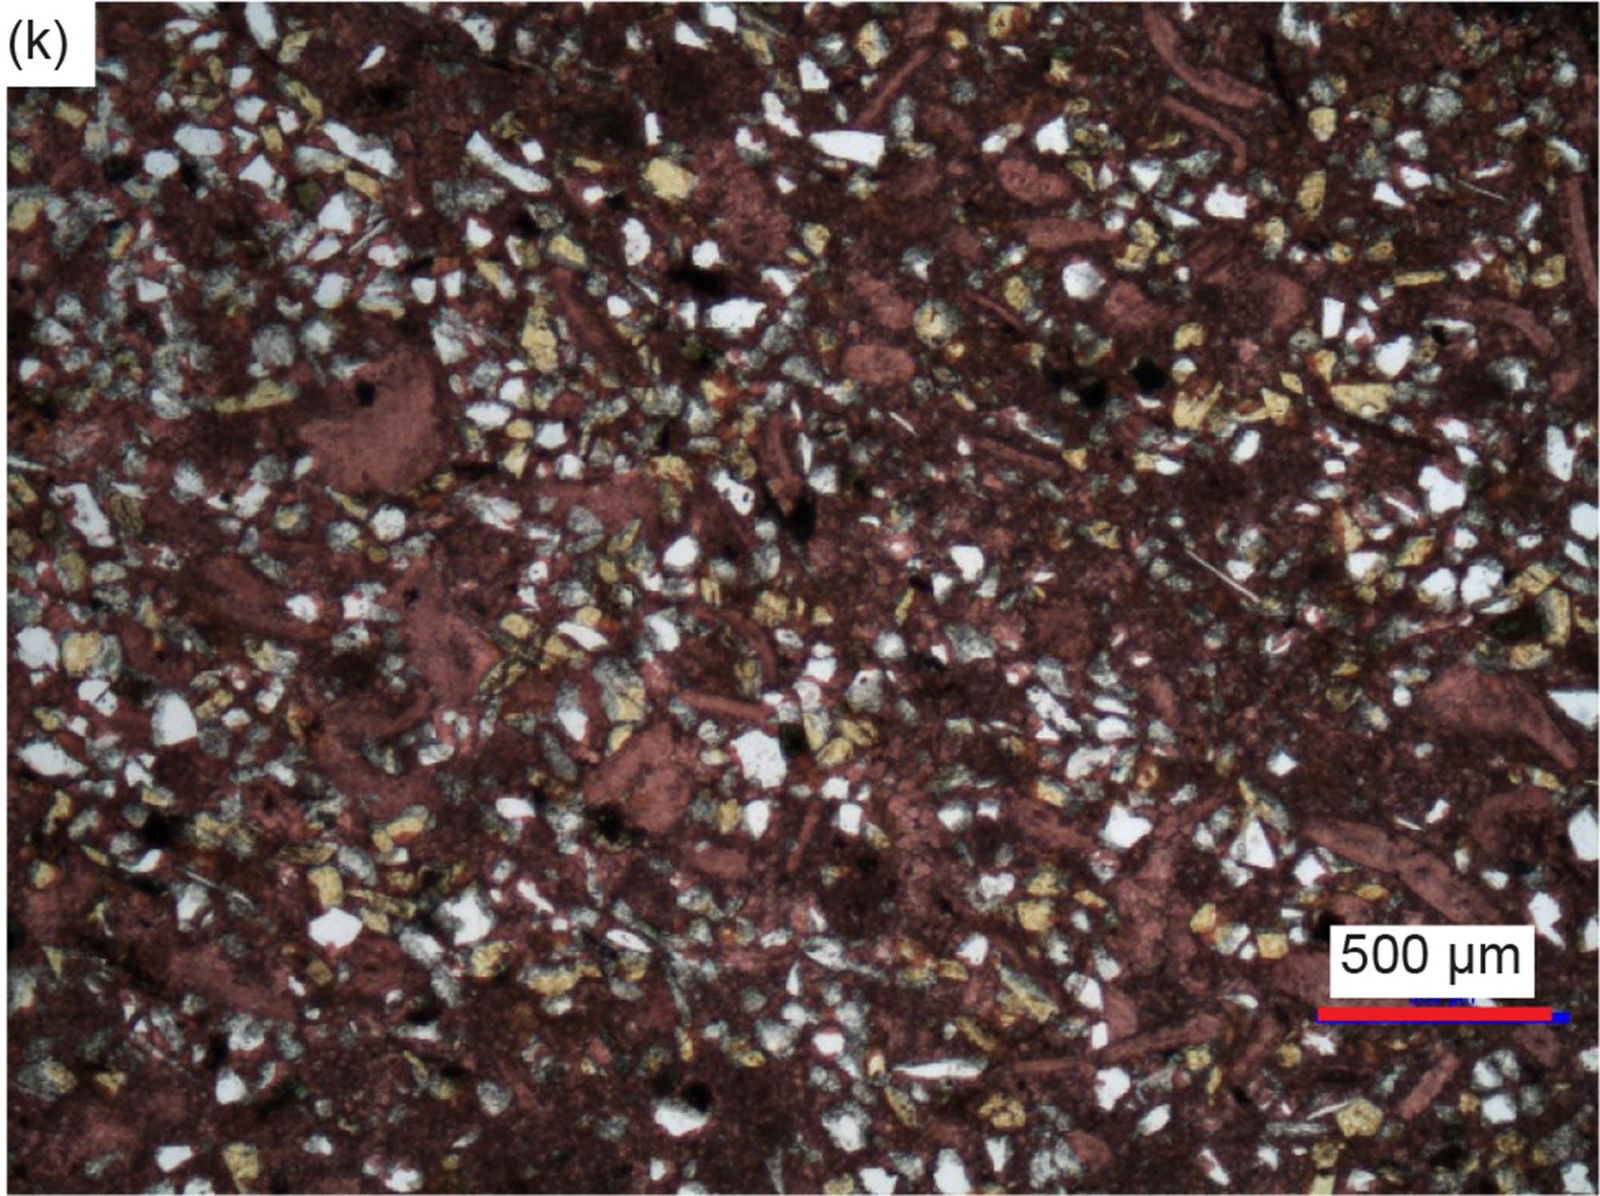
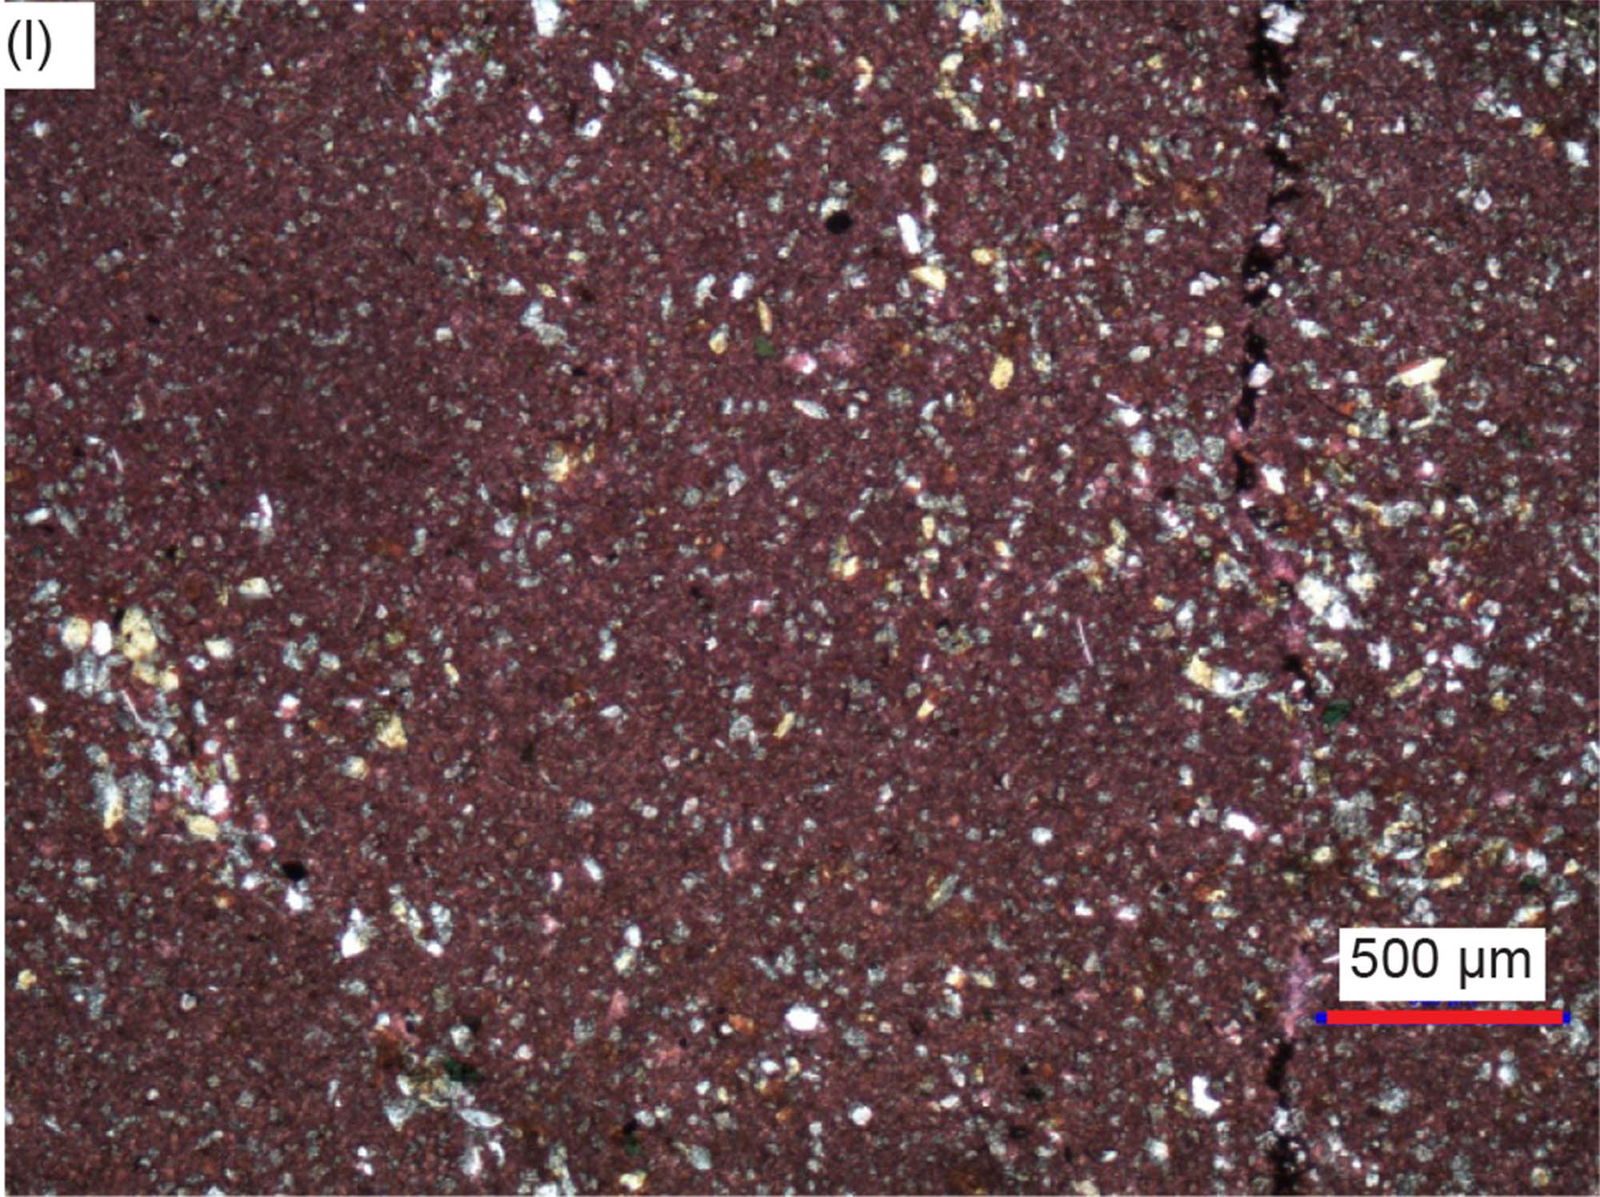
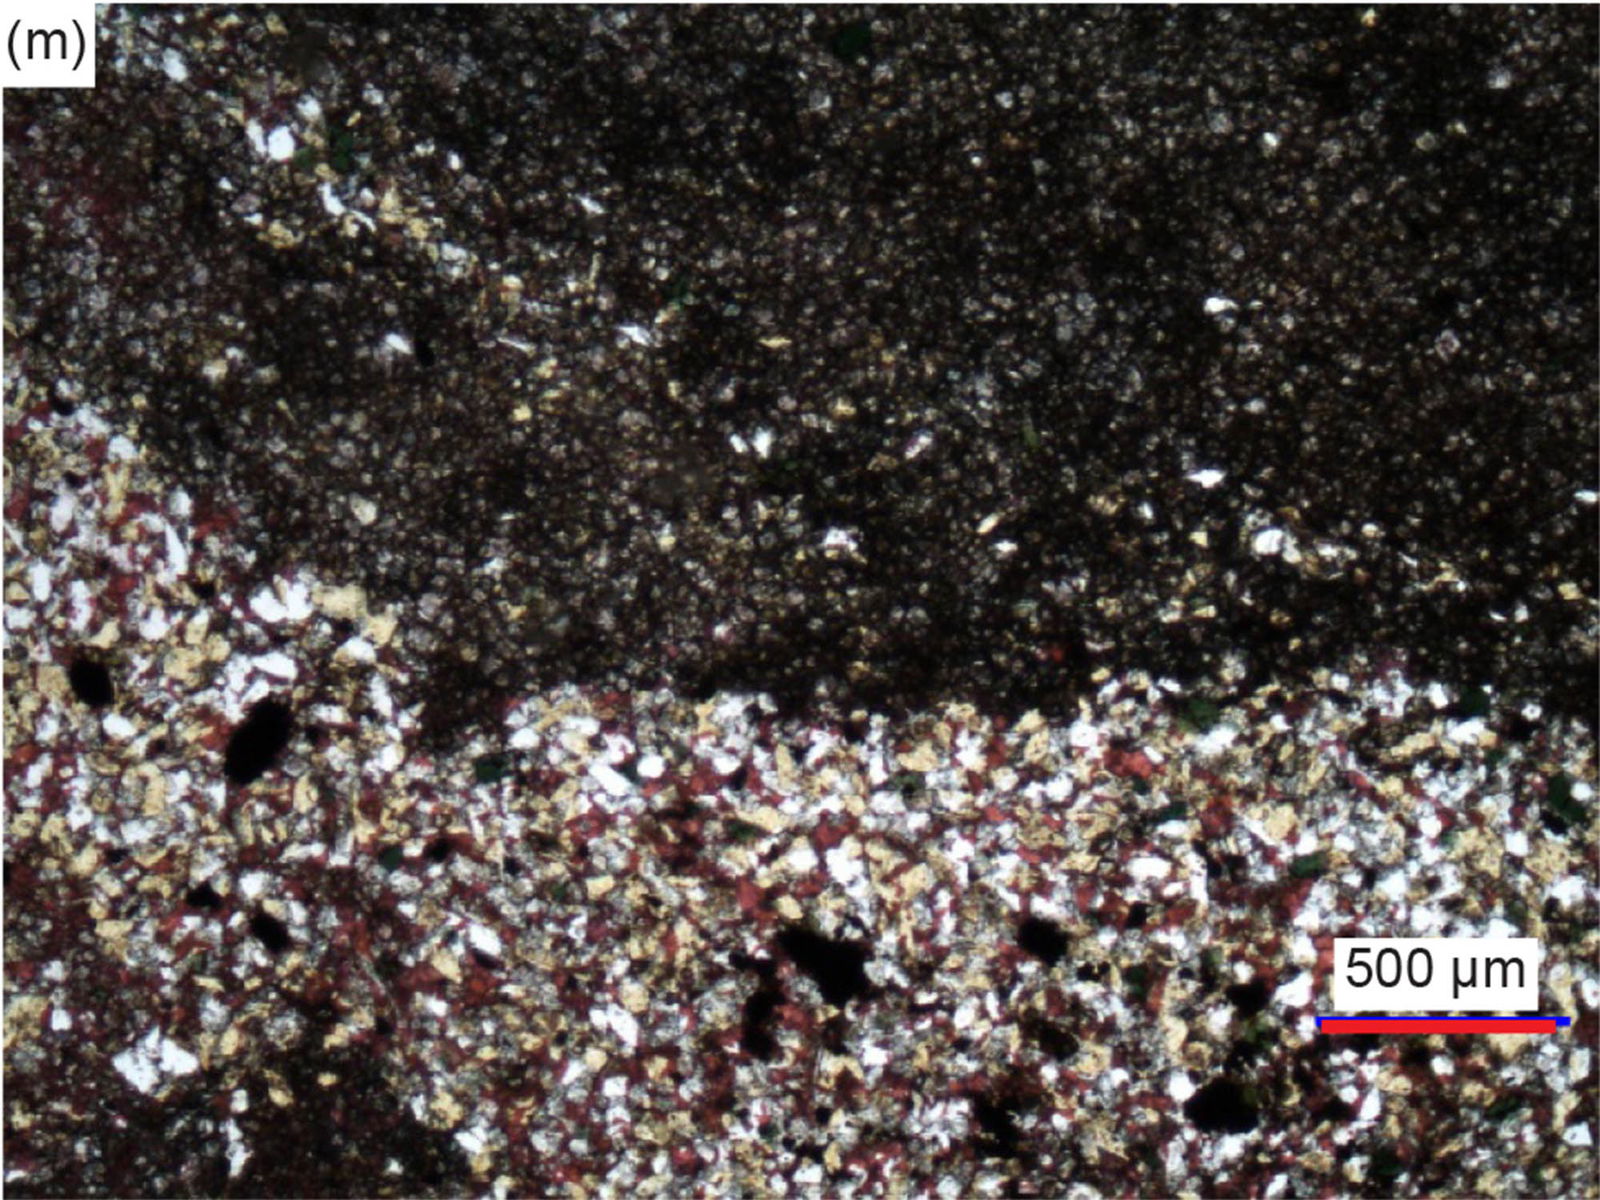
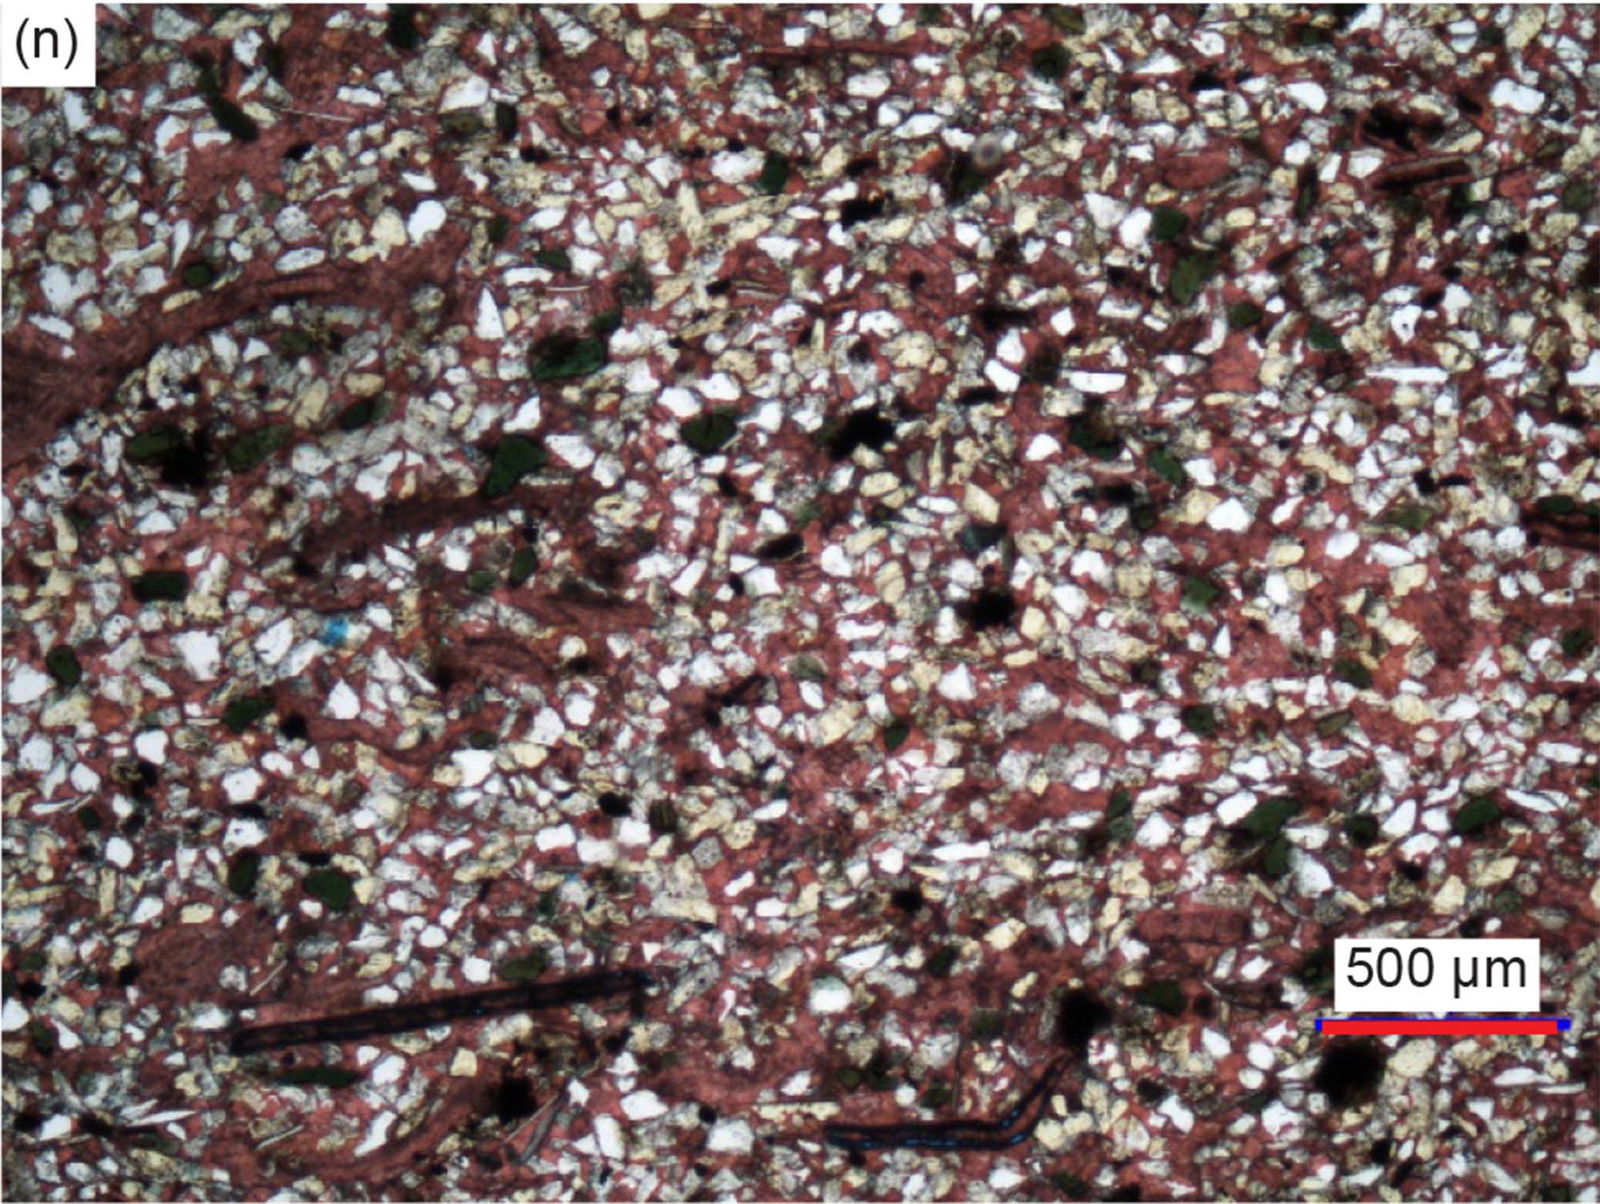
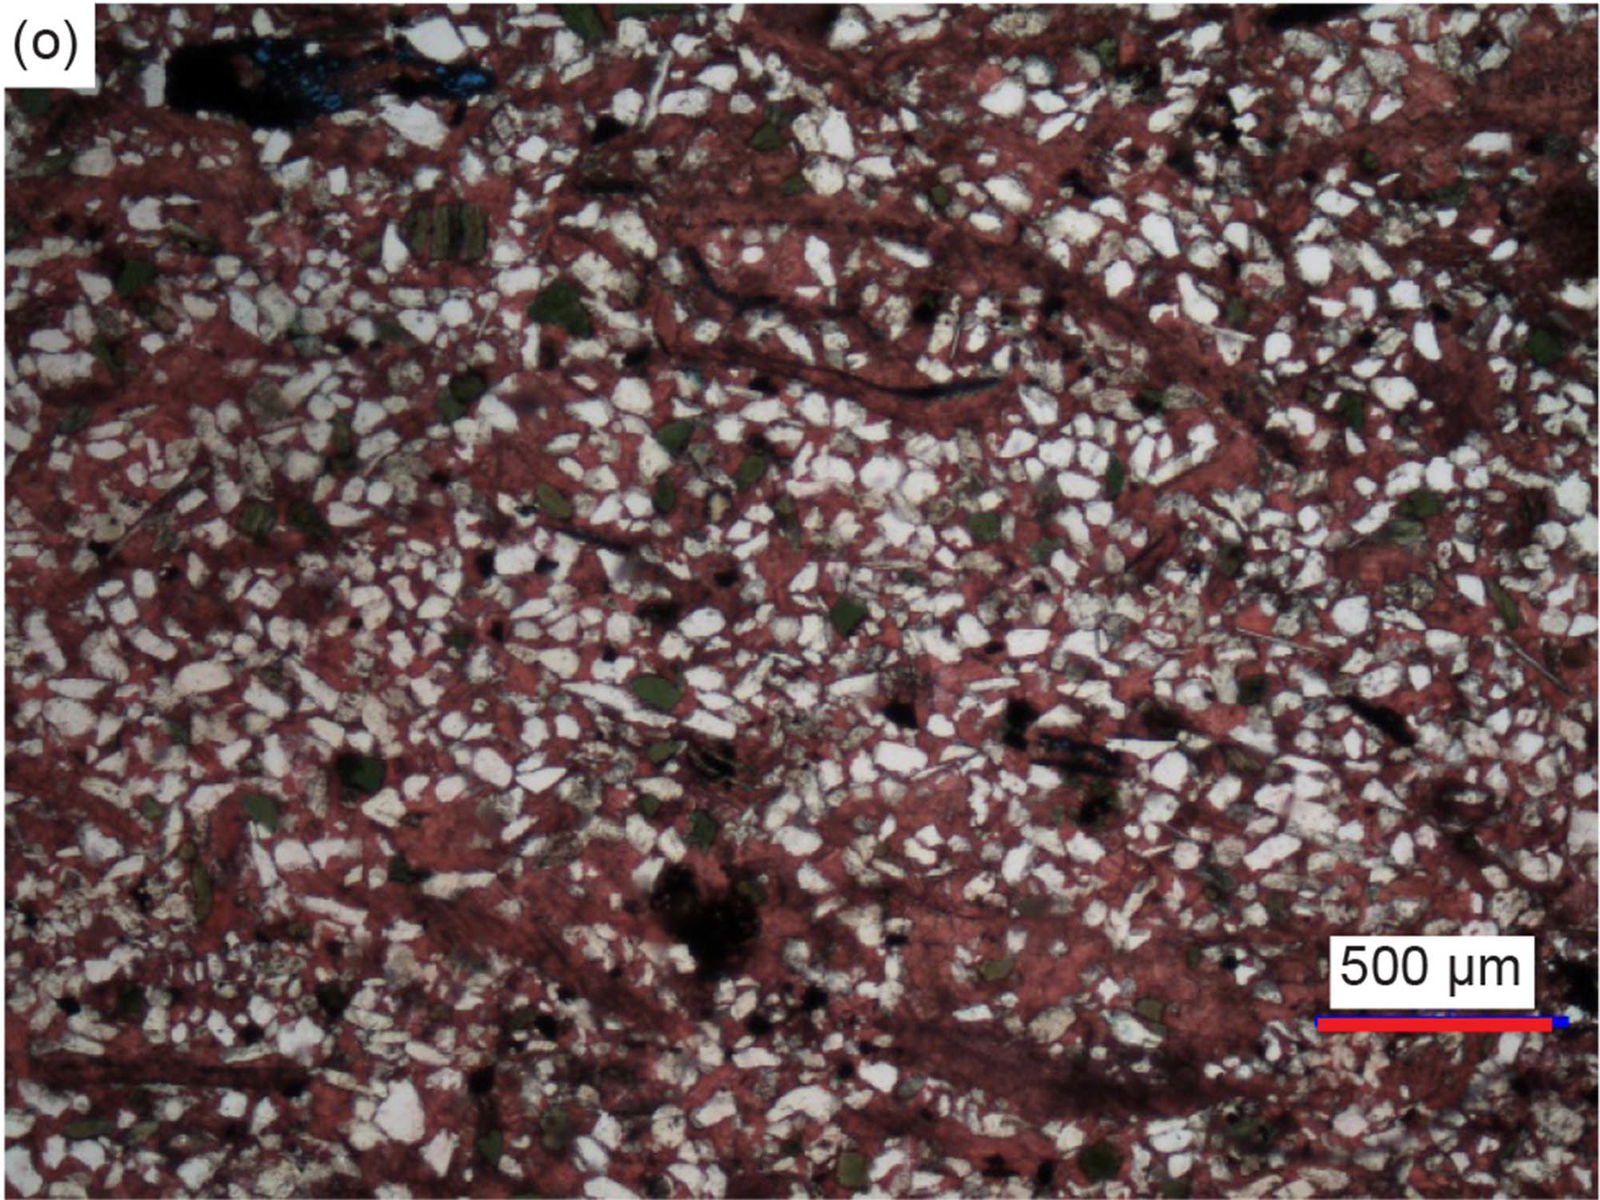
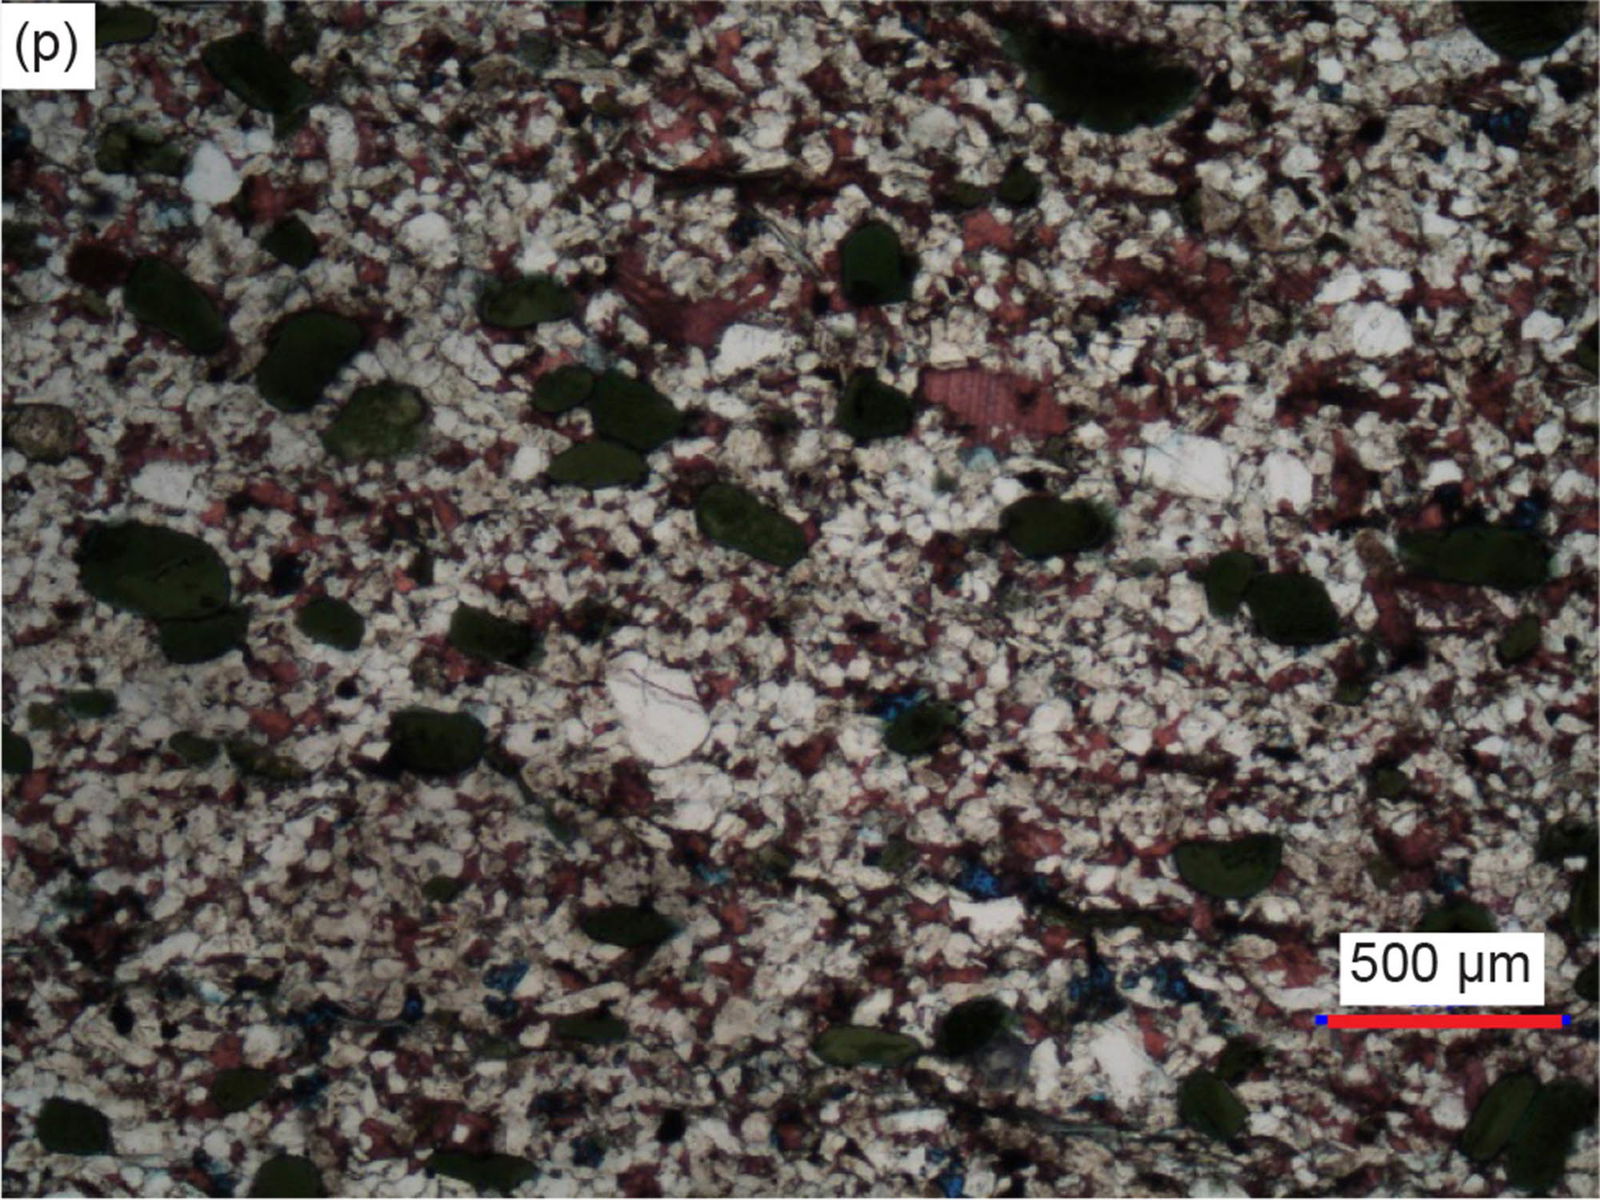
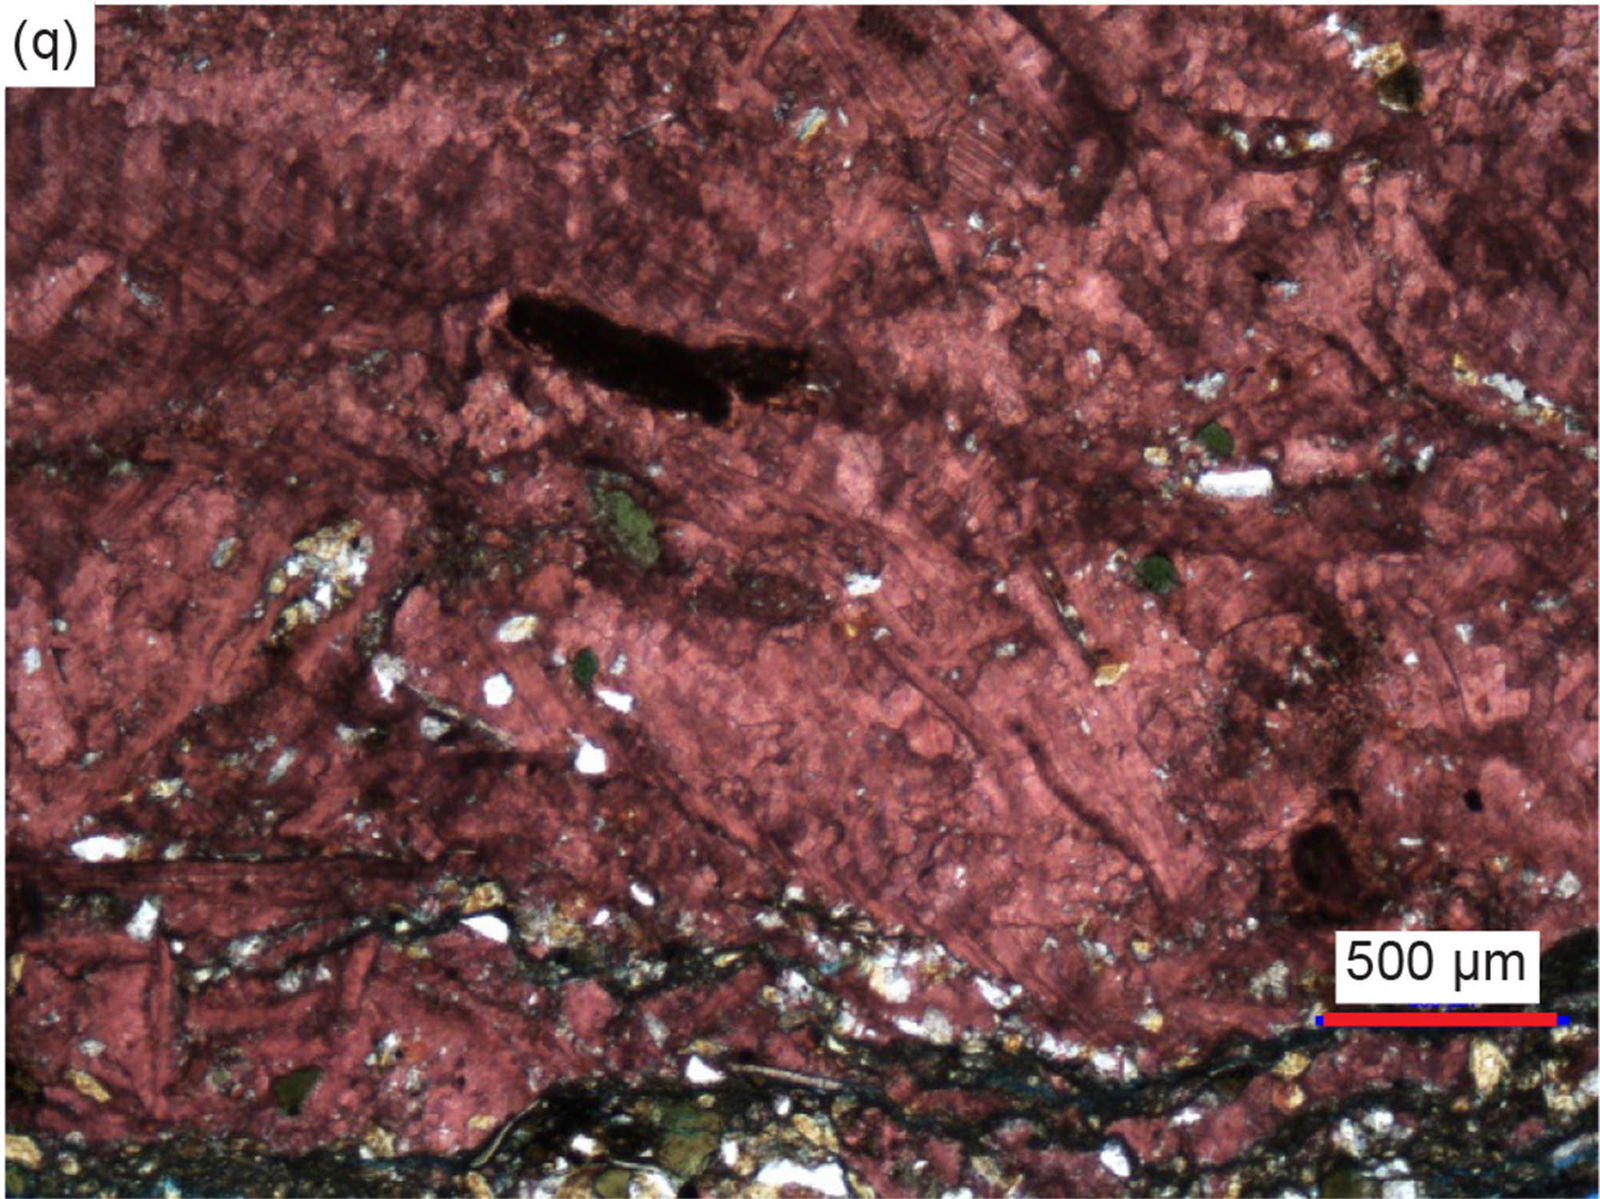
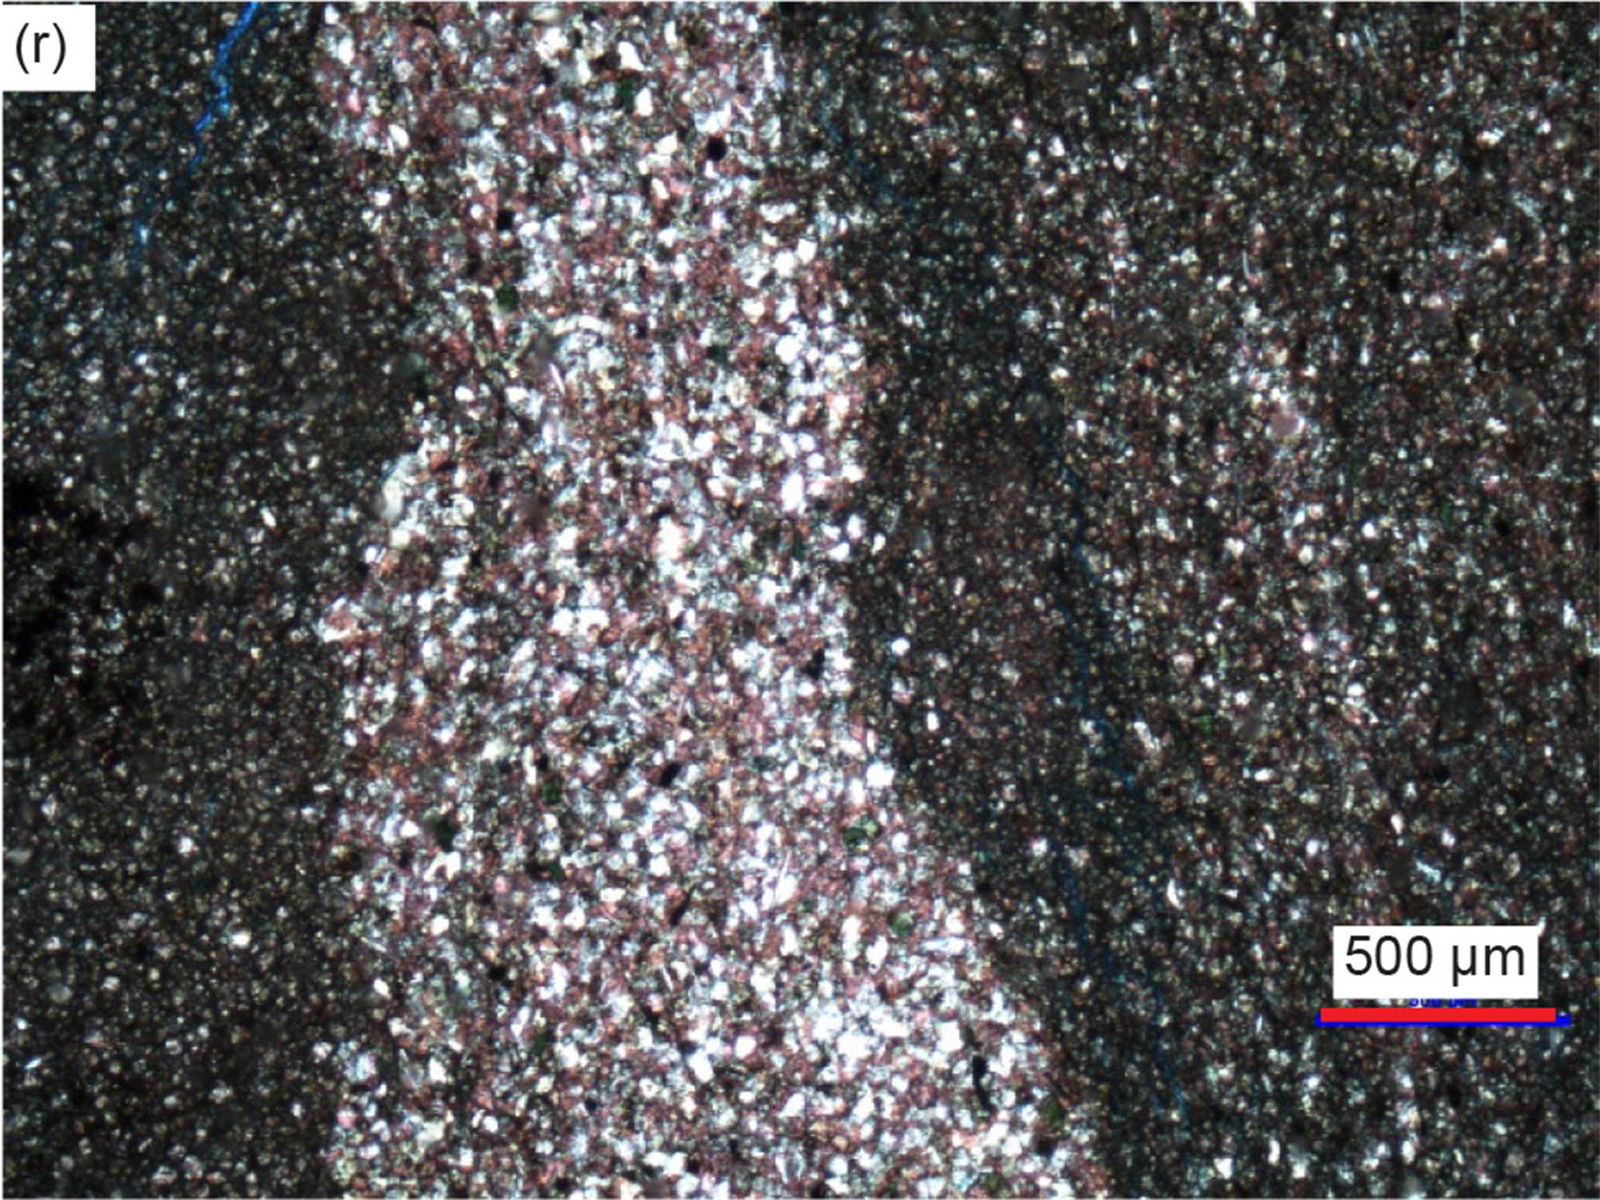
Fig. 24. A representative set of photomicrographs all at the same scale (as indicated) showing the variations in textures in the samples from the Muav Formation. Distal samples: (a) MLS-01, (b), (c) MLS-02, (d) MLS-03. Matkatamiba fold samples: (e), (f) MFML-01, (g) MFML-02, (h) MFML-03, (i) MFML-04, (j) MFML-05, (k) MFML-06, (l), (m) MFTB-01, (n) MFTB-02, (o) MFTB-03, (p) MFTB-04, (q) MFTB-05, and (r) MFTB-06.
Snelling (2022a) also reported that whereas all 15 samples were described as limestones in outcrop, in thin section silicate mineral grains are visible in all of them. In five of the samples, silicates (primarily quartz and K-feldspar grains) constitute >50% of their content, which overall ranges from 3.9% to 78.6% (see the last two columns in table 2). The quartz grains usually predominate in quantity over the K-feldspar grains, though in some samples their contents are about equal, or K-feldspar is slightly more dominant than quartz. These silicate mineral grains mostly range in size from medium and coarse silt (regarded as mud) to very fine sand, though a few grains reach fine sand size, using the standard definitions and terminologies for size of Udden (1914), Wentworth (1922) and Folk (1980). These quartz and K-feldspar grains are also mostly sub-angular to sub-rounded, though some are angular, either irregular-shaped or even slivers, and a few are rounded, using the definitions and terminology for shape of Powers (1953) and Folk (1955). A few K-feldspar grains are sub-euhedral former laths. And whether in the high silicate minerals content samples (>45%) where they are evenly scattered (for example, MFML-05 and MFTB-02 and -03, fig. 23h, f and i, respectively) or in the lower silicate minerals content where they are unevenly scattered and sometimes clumped (for example, MLS-02 and MFML-06, fig. 23j and e, respectively), the quartz and K-feldspar grains are poorly sorted with the different sized angular and sub-rounded grains near one another, using the standard definition and terminology for sorting of Folk (1966, 1980) and Pettijohn, Potter, and Siever (1973). Where they are clumped together, the quartz grains sometimes meet at triple points.
The only other silicate minerals present in these limestones are plagioclase grains, muscovite flakes and glauconite grains (Snelling 2022a). The plagioclase grains are isolated and only present in a few samples, being evident due to their multiple twinning under crossed polars. Muscovite flakes are present in the thin sections of all samples but in varying quantities and always seen edge-on as cross-sections of books of thin sheets. They are associated with the quartz and K-feldspar grains between which they usually occur, are mostly subparallel to the bedding, and sometimes are bent around the quartz and K-feldspar grains with split or frayed ends. The glauconite grains are not universally present. In a few samples (for example, MFTB-04, fig, 23l and fig. 24p) they occur as rounded peloids, sometimes with the central “seed” grain present around which the peloid grew. In other samples the glauconite appears to be due to illite alteration of K-feldspar grains.
Snelling (2022a) found that these silicate grains and flakes in most samples are “floating” in a matrix of mud-sized calcite grains (micrite). The calcite content varies between 4.3% and 92.8%, these extremes being in adjacent samples only 6 m apart at the same stratigraphic level at the base of the Havasu Member (MFTB-05 and -06, fig. 23o and c, respectively). Some calcite has recrystallized into larger grains, while some later calcite fills cross-cutting veins. Also, often present is micro-crystalline calcite in cross-sections of fossil shell fragments of various sizes and shapes, likely representing mostly brachiopods and lesser bivalves (fig. 24b, d, f, k, and o). Dolomite is present in all but one sample, ranging from 1.5% to 81.9%, and while usually being subordinate to calcite it is the dominant carbonate in two samples (MFML-02 and MFTB-06, fig. 23g and c, respectively). The dolomite grains are generally mud to fine sand sized, but often there are larger rhombs with growth zones marked by linings of iron oxides. The dolomite appears to have replaced calcite, as would the siderite present (0.8%) in one sample (table 2).
Even though there is such a wide variation in the contents of these samples, the total carbonates ranging from 21.4% to 96.1% (table 2), Snelling (2022a) concluded that texturally they are very similar. Due to their silicate minerals contents as silt and fine sand sized clasts, these could be called silty limestones or carbonate siltstones. According to Folk (1959, 1962) these limestones would be classified based on transported and authigenic constituents as medium crystalline, very fine to fine calcarenites, or alternately as fossiliferous intramicrudites where the micro-crystalline matrix or allochems are >10% and the intraclasts are >25%, and as fossiliferous intraclast-bearing micrite, though these names do not consider the occasional peloids or oolites. Less confusing classification terminology was adopted by Dunham (1962) and slightly revised by Wright (1992). Accordingly, these rocks are classified as mostly wackstones where the >10% silicate grains are calcite mud-supported, but as calcareous mudstones where in a few samples the silicate grains are <10%, and as packstones in those few samples where the >50% silicate grains support the rock fabric. These are regarded as primarily depositional textural terms that likewise do not consider the occasional peloids or oolites. Scholle and Ulmer-Scholle (2003) noted that the Dunham (1962) classification has the advantage of its worldwide use due to its partially quantifiable, descriptive (objective) terminology.
Snelling (2022a) also reported that in most of the 12 samples collected from the topmost Gateway Canyon Member and the basal Havasu Member in the Matkatamiba fold closely-spaced fine and parallel laminations are clearly evident and even some cross-laminations, often marked by the alignment of the silicate mineral clasts (for example, MFML-02, -03 and MFTB-02, -03 and -04, fig. 23g, k, f, i, and l, respectively). In one instance (MFML-04, fig. 23n) these laminations are grouped into thin alternating beds, some of which are graded, of fine-grained calcareous siltstone and of micrite. This indicates the original depositional structures in the limestone have been preserved and remain undisturbed by the deformation that produced the fold.
Scanning Electron Microscope (SEM) Examination
The scanning electron microscope (SEM) used in the laboratory at Calgary Rock and Materials Services, Inc. is an Amray 1820i instrument equipped with a 4pi digital control and image acquisition system and is used in its secondary mode. Energy Dispersive Spectrometry (EDS) spectra are acquired using a Gresham Titan near-windowless piezo-cooled detector.
Samples as supplied in vertical orientation were first fractured/broken vertically. This ensured that the horizontal bedding is not the major feature of the sample examination process. Samples were glued using five-minute adhesive to 10 mm aluminium stubs, maintaining the vertical fracture orientation. After curing, the samples were gently blown clear of debris using dry air. Following this, the samples were placed in a Polaron sputter coating unit for application of gold coating used to ensure good surface conductivity. This unit is equipped with a piezo-cooled stage to assist in preventing thermal damage to the sample. Additionally, coating was done in a burst mode—one minute on, one minute off, continued for a total coating time of five minutes for each sample.
Following coating, samples were individually and sequentially placed into the Amray 1820i for analysis. Image sequences from low magnification to high magnification were taken and reviewed for significant features. Bulk EDS is normally run on the low magnification scanned surface in order to get a composite elemental analysis. Beam accelerating voltage is normally held at 30 kV in order to provide the best resolution and least beam distortion. This also assists in providing the best EDS response over the emission range of interest.
Results
The focus of this study was to investigate the microstructures in the sediment grains and the textures within the rock samples to ascertain whether the original sedimentary rock grains and textures had been changed by the deformation in the fold, particularly the hinge zones, compared to those samples collected from the fold limbs and those distant from the fold. The detailed petrographic descriptions of all 15 samples (three regional samples distant from the fold and 12 samples from the Matkatamiba fold) are available in the appendix in the Supplementary material.
Grains and Textures
Several observations are very evident, being uniformly and ubiquitously present in all samples, both those collected from the fold hinges and limbs, and those collected from the locations distant to the fold. However, there are really no significant features that are different in the samples from the fold compared to the distal samples.
Ubiquitous original detrital quartz grains are present in all the samples (fig. 25), ranging from 2.7% to 55.8% (table 2). Invariably the quartz grains are tiny to very small, although in some samples there are also a few scattered small to medium grains. They are mostly sub-angular to sub-rounded, though some are angular and even irregularly-shaped fragments, and a few are rounded. These variously sized and shaped quartz grains are usually mixed and interspersed with one another, indicative of poor sorting, and are usually scattered and “floating” in the micrite (fine-grained calcite mud) matrix. In several instances, tiny quartz fragments have been included in dolomite rhombs patches, which is consistent with the dolomite being post-depositional replacement of the calcite matrix in which the quartz grains were originally deposited. Furthermore, in one sample some of the glauconite peloids have internal/central inclusions of tiny quartz grains around which the glauconite was deposited.
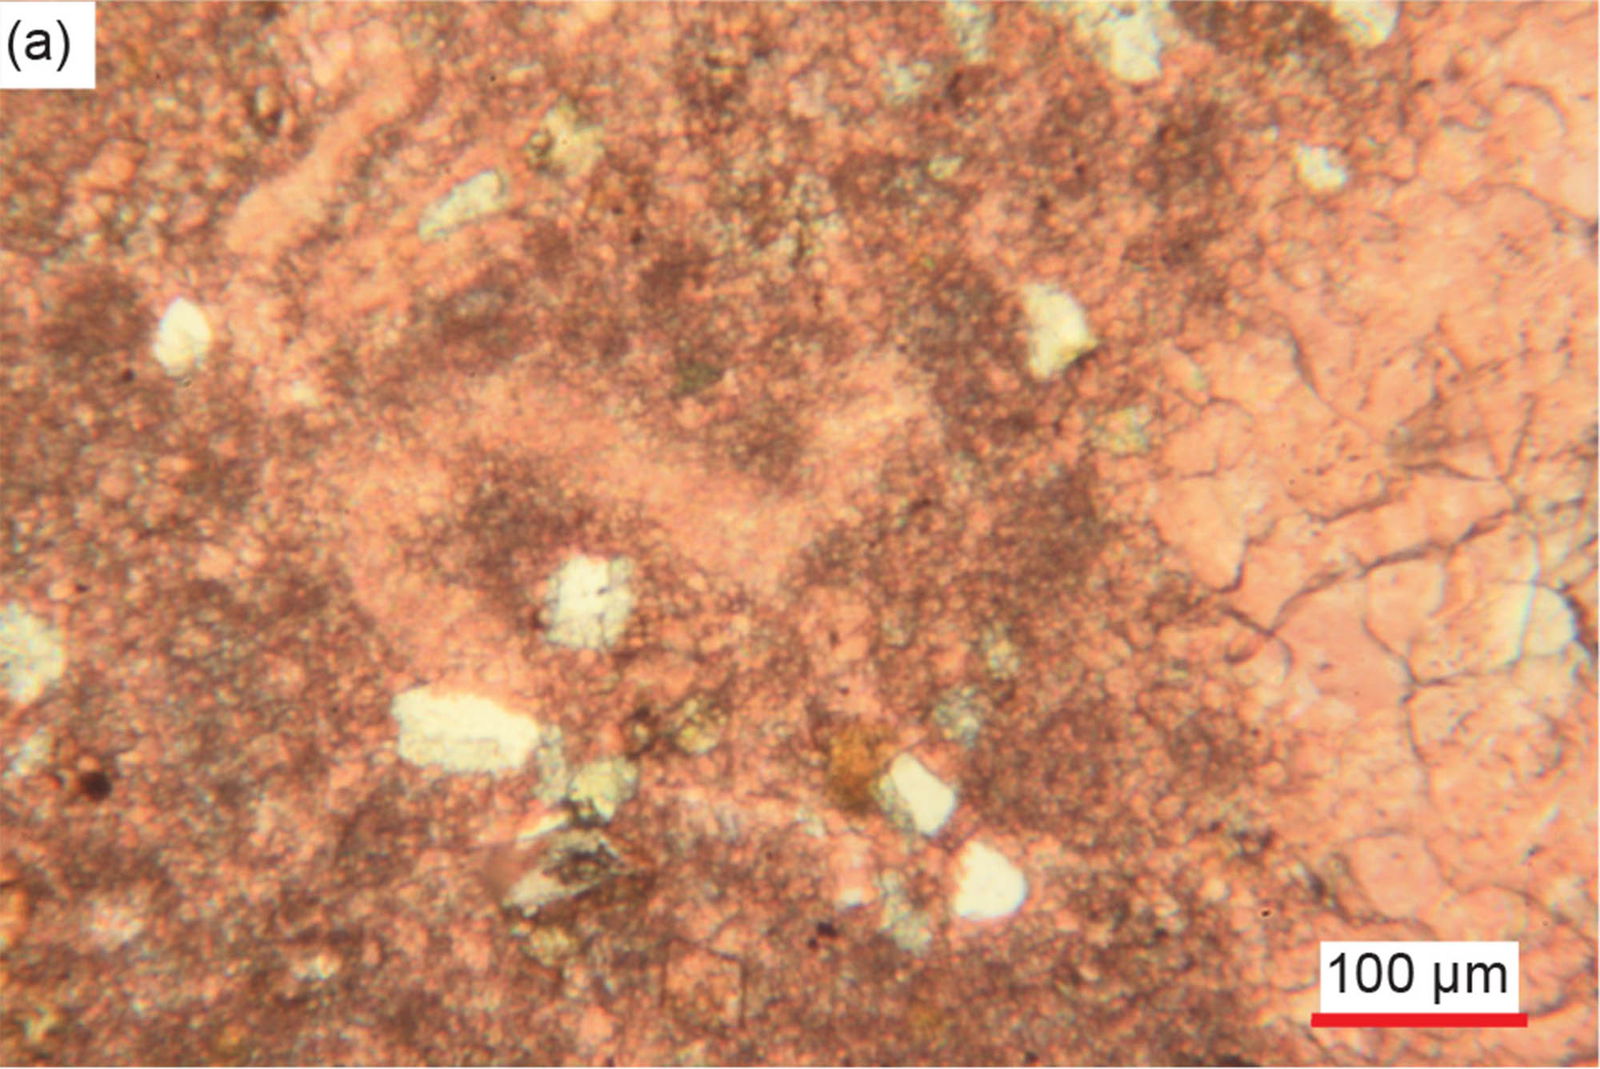
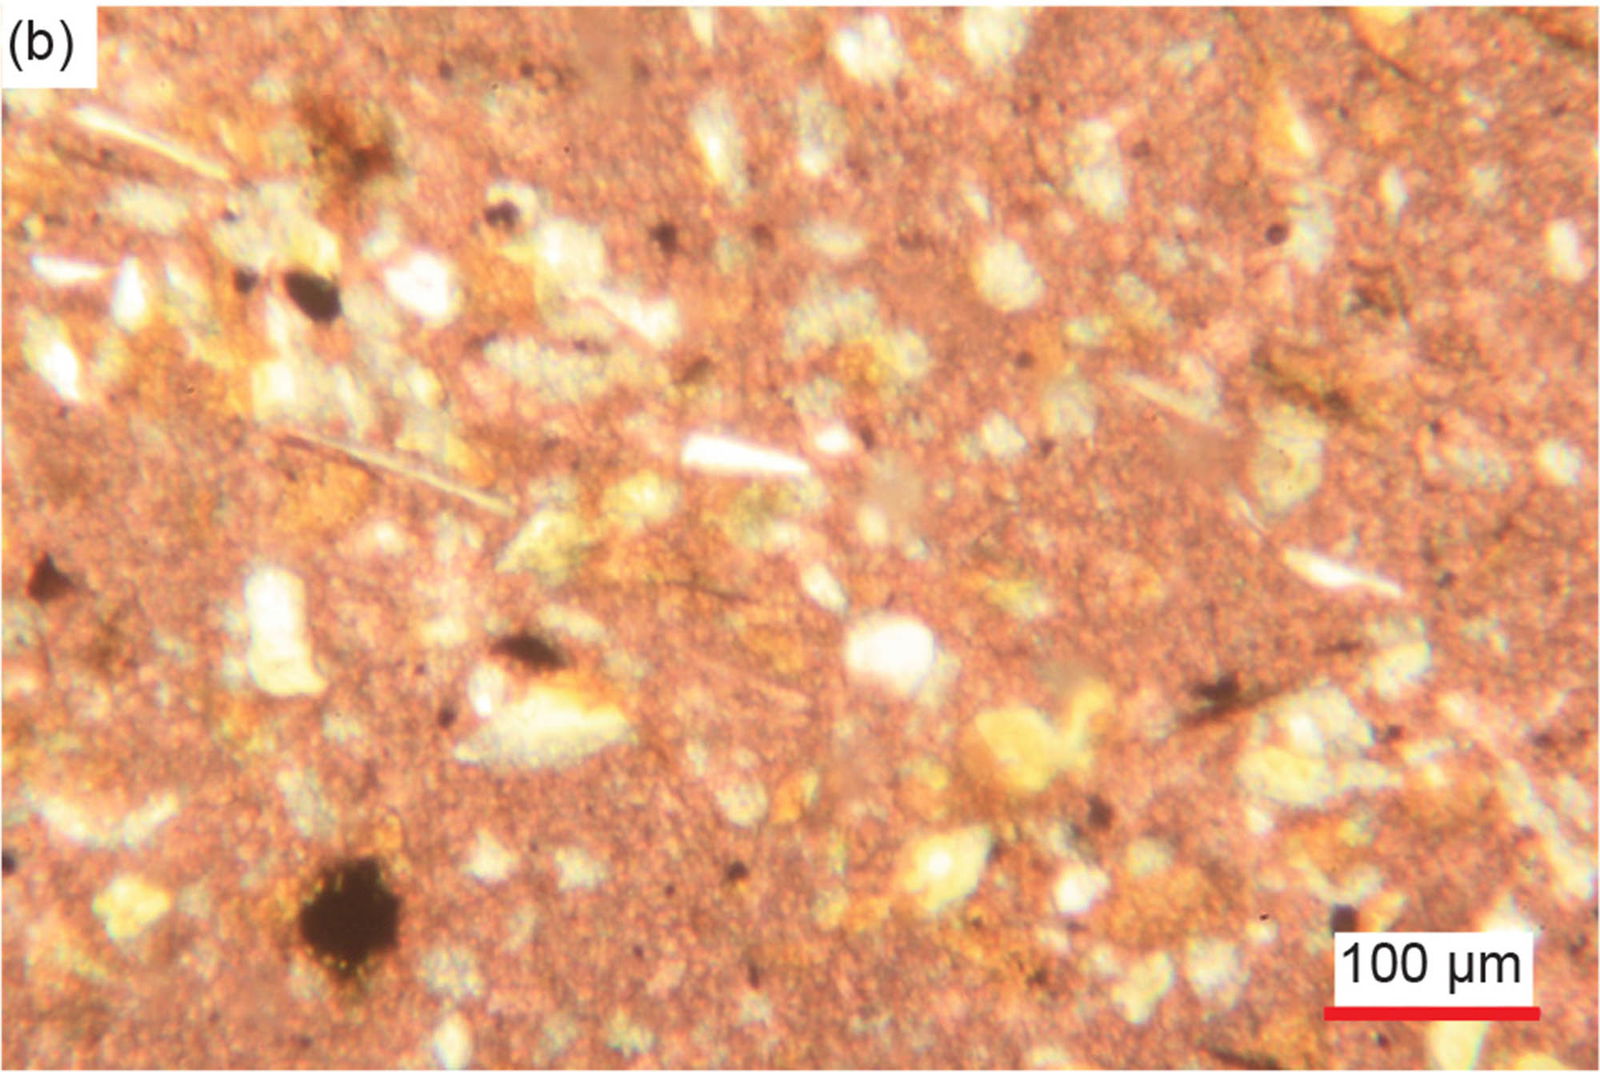
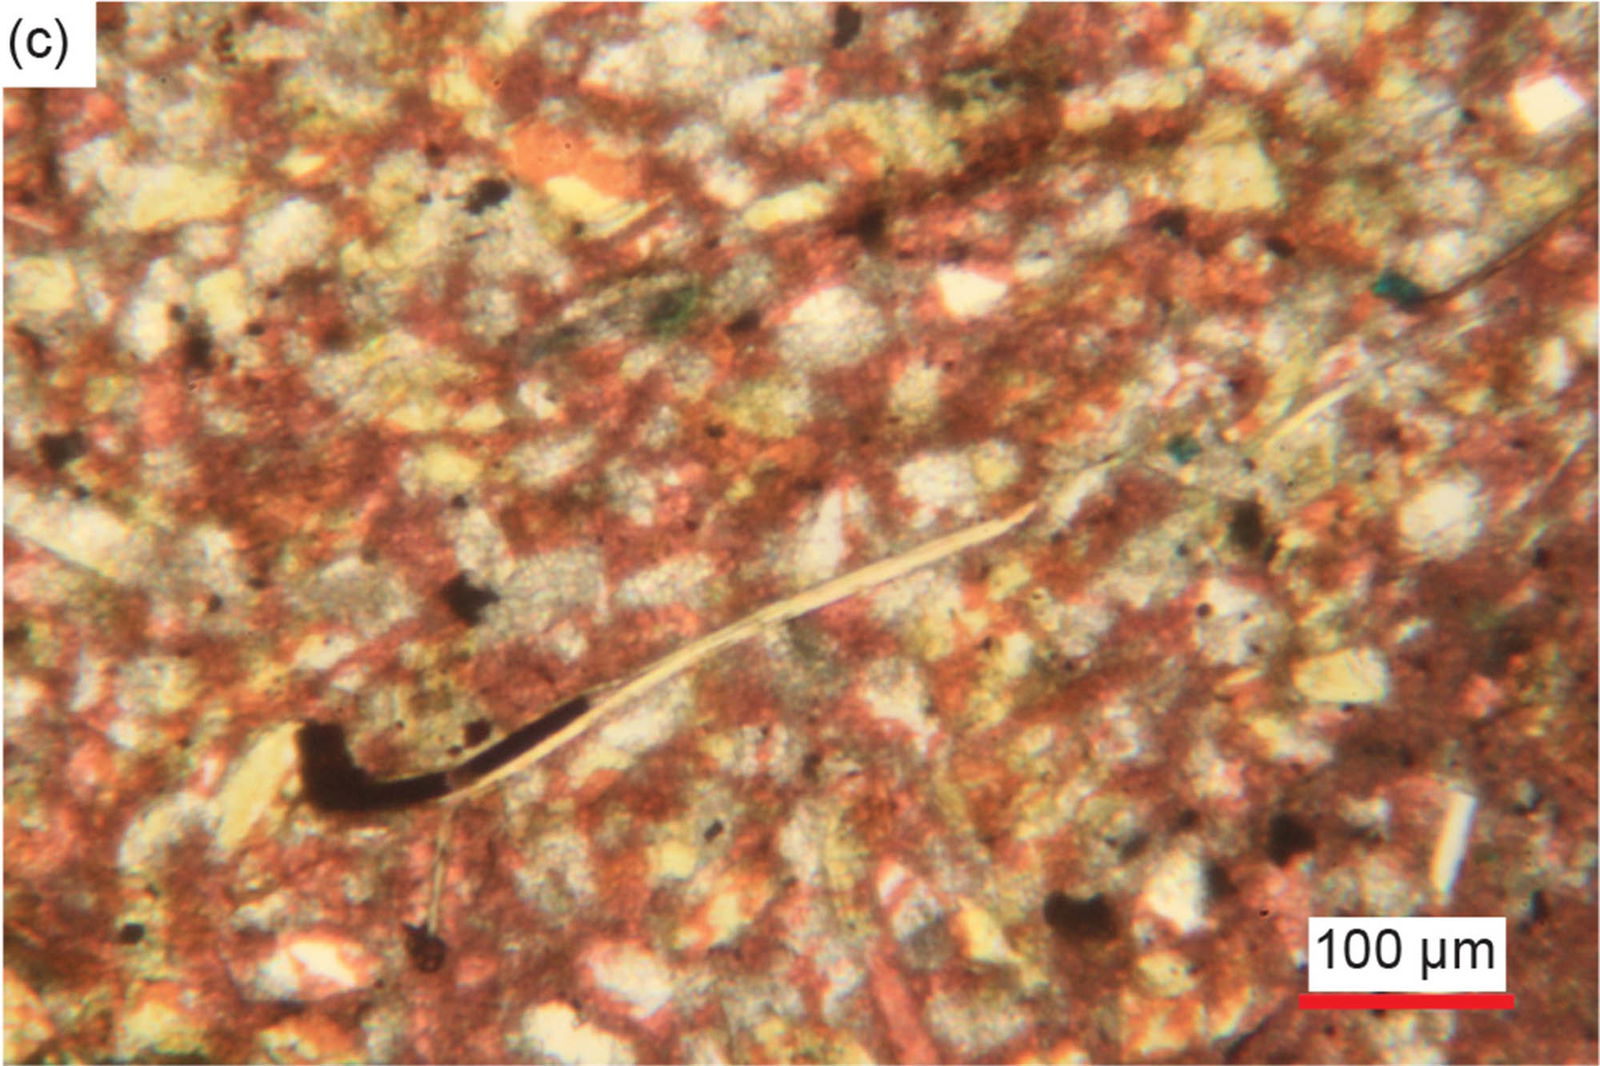
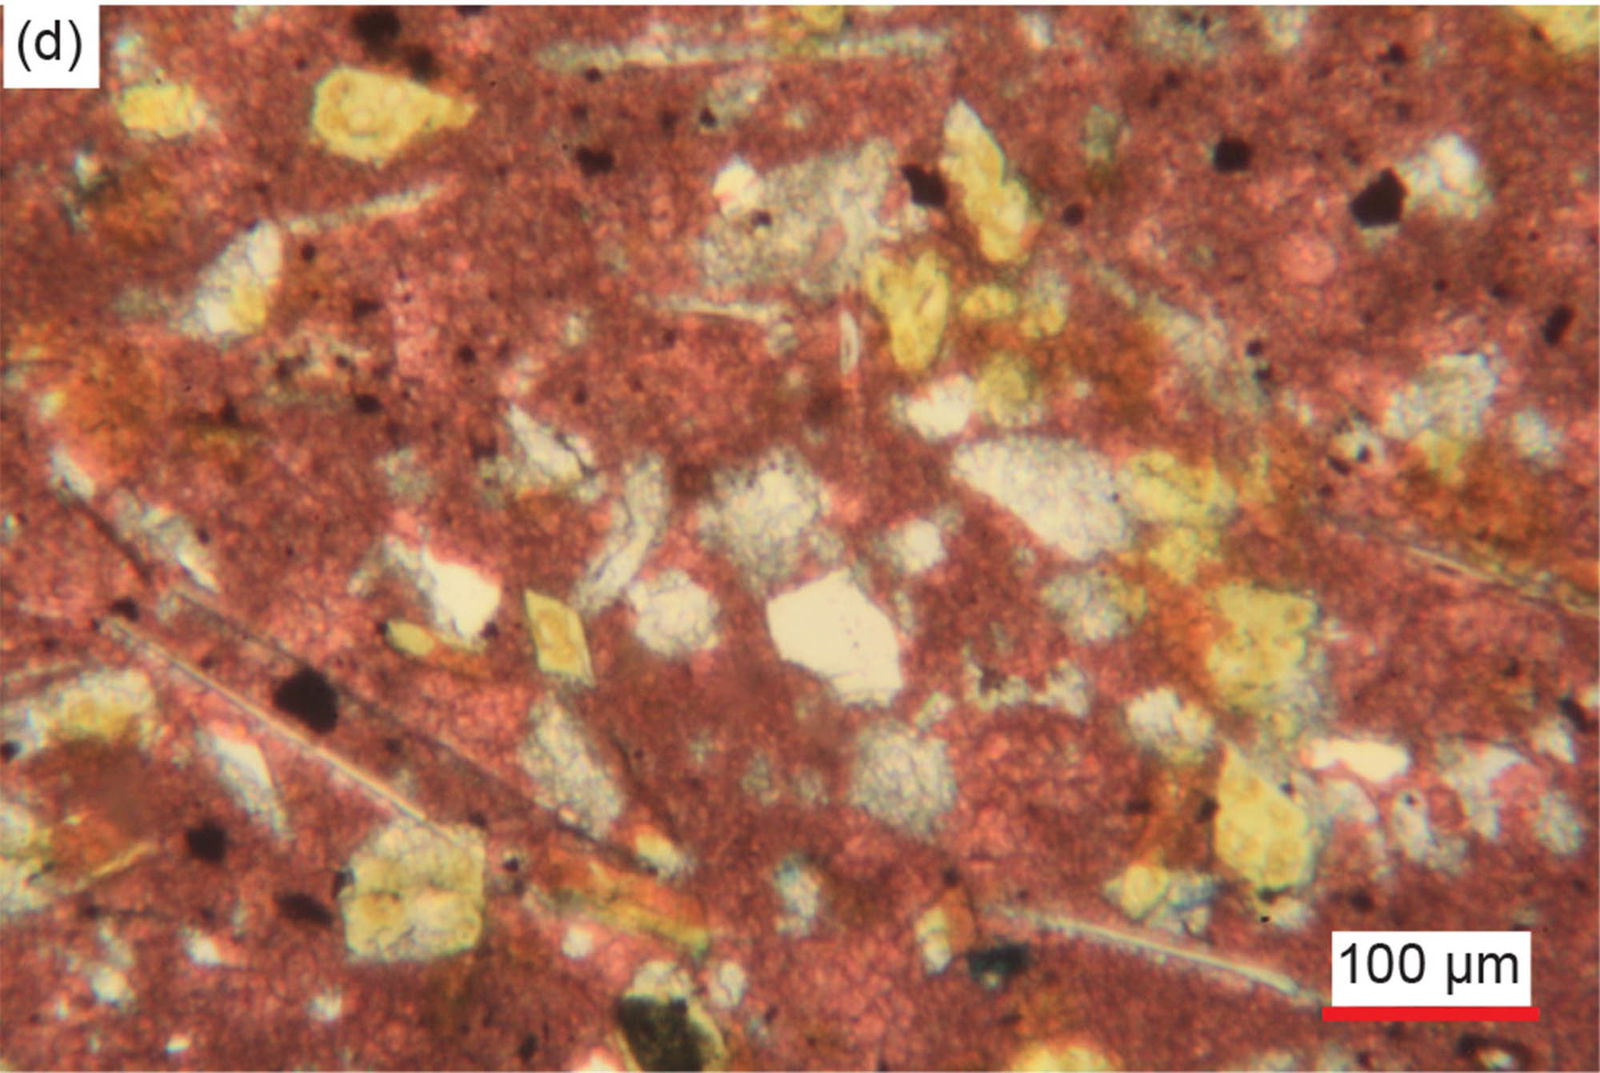
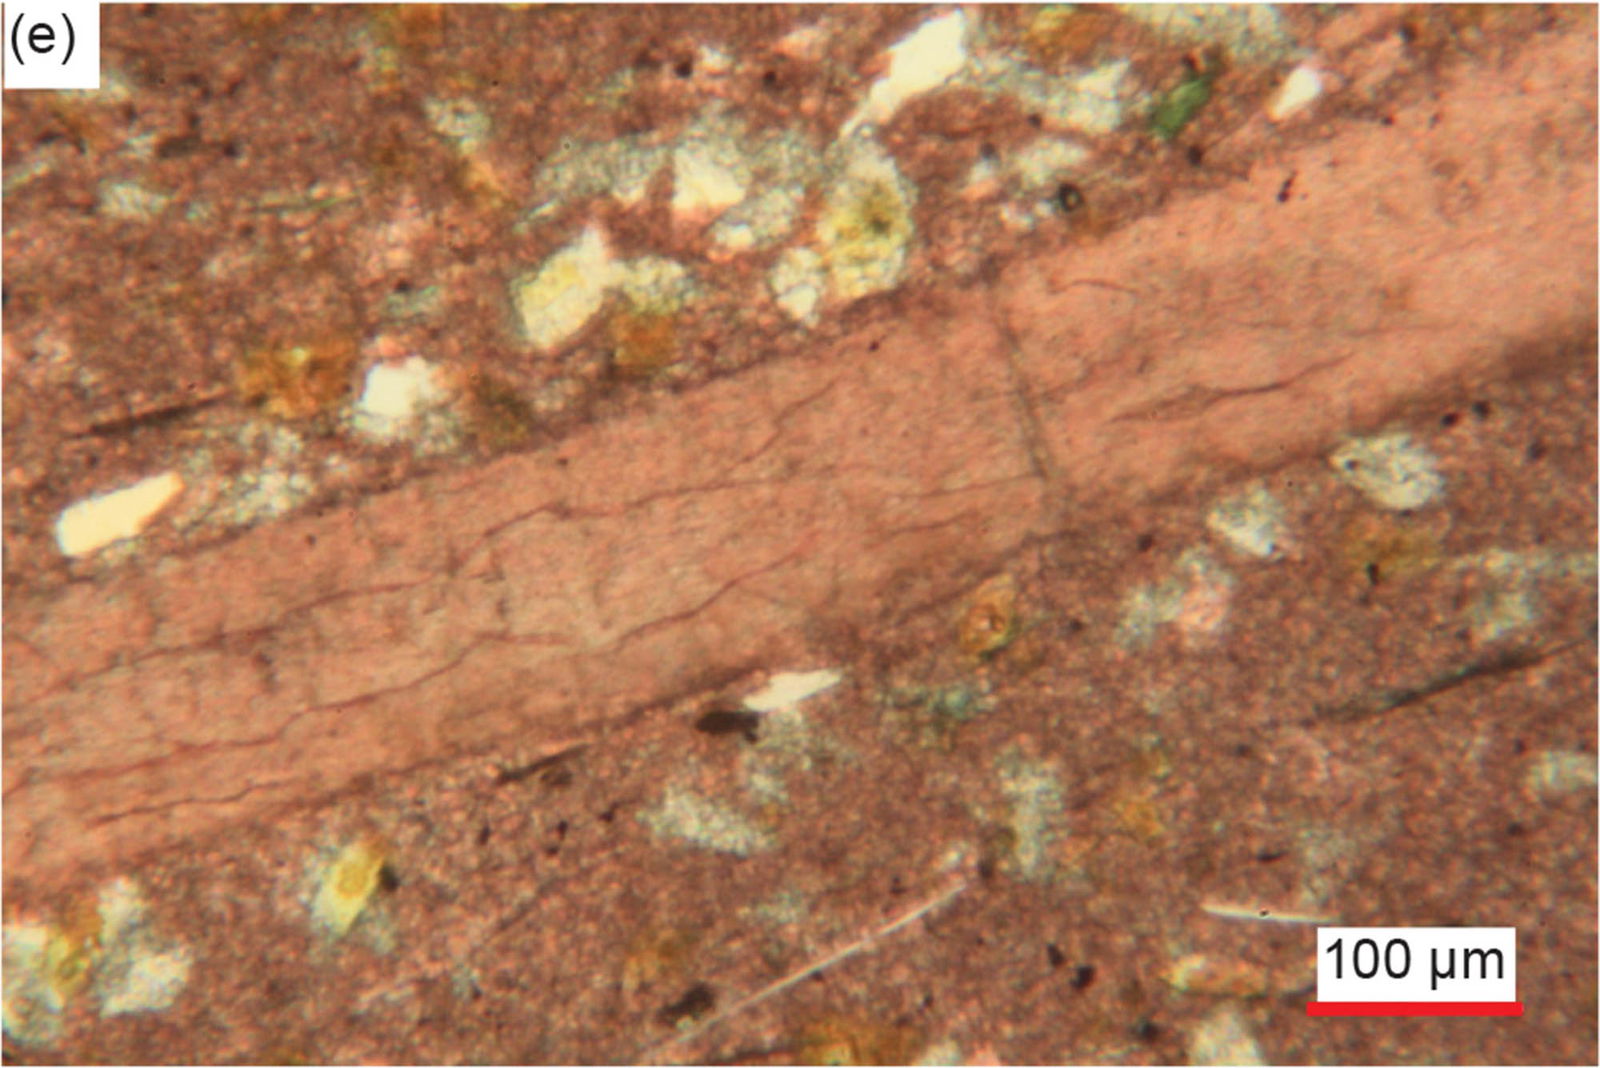
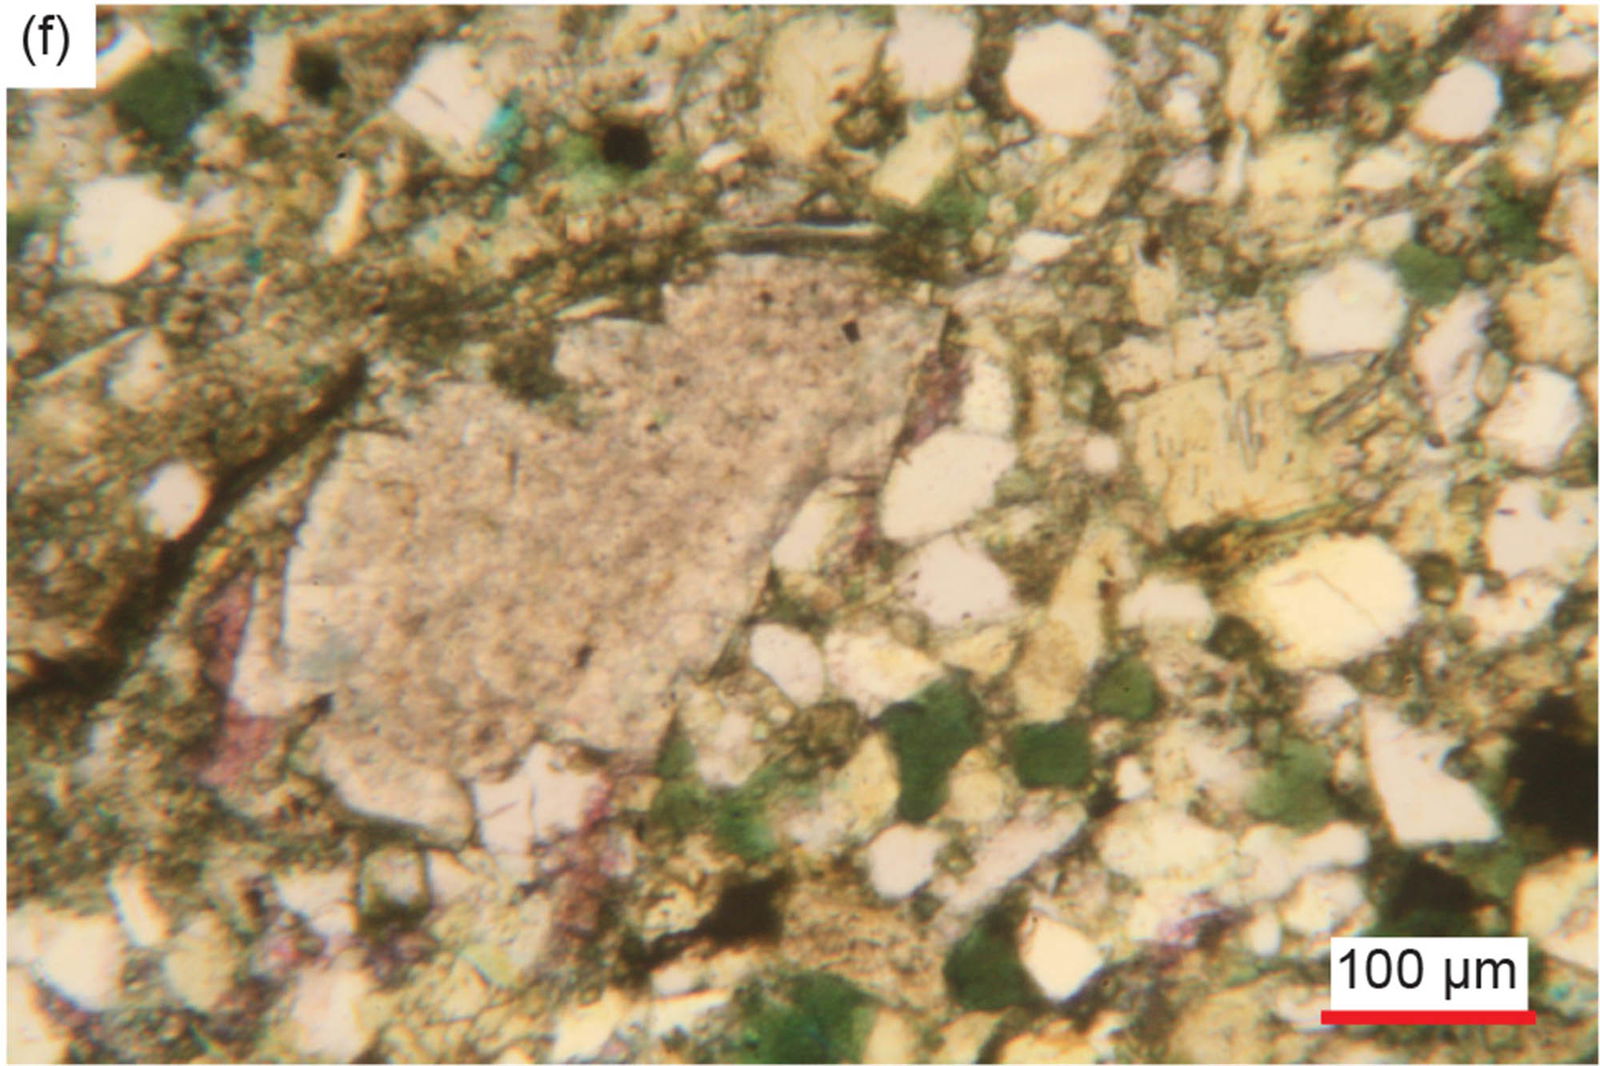
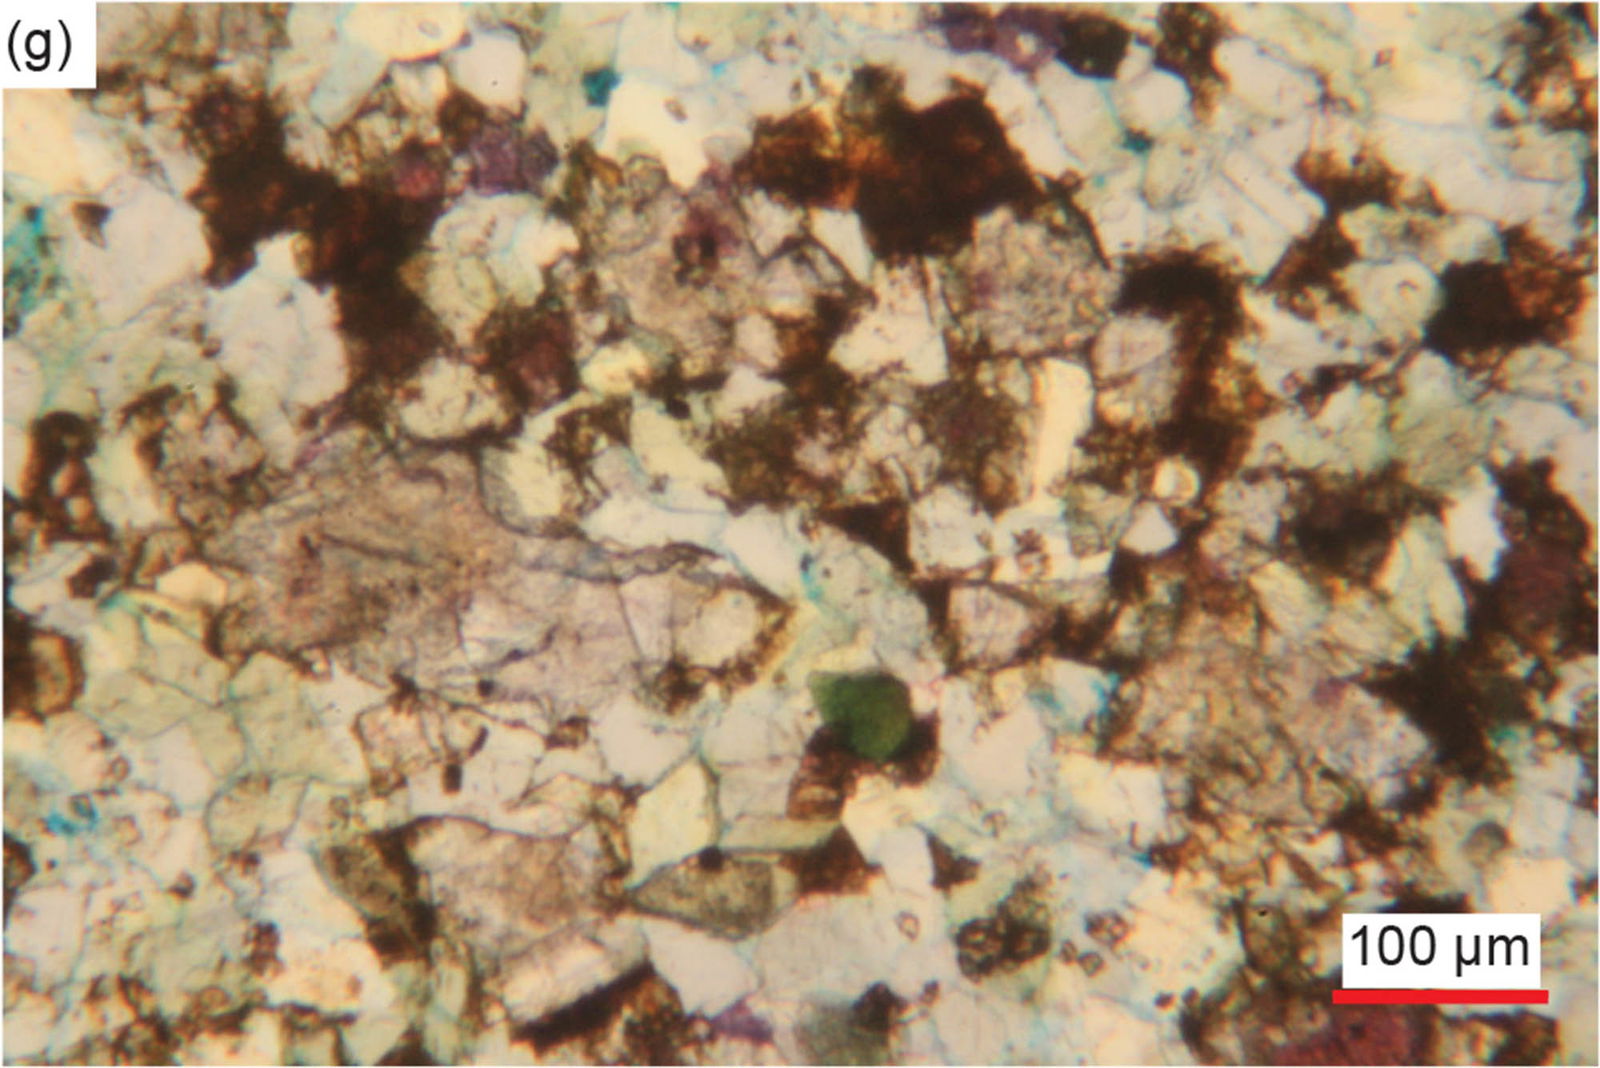
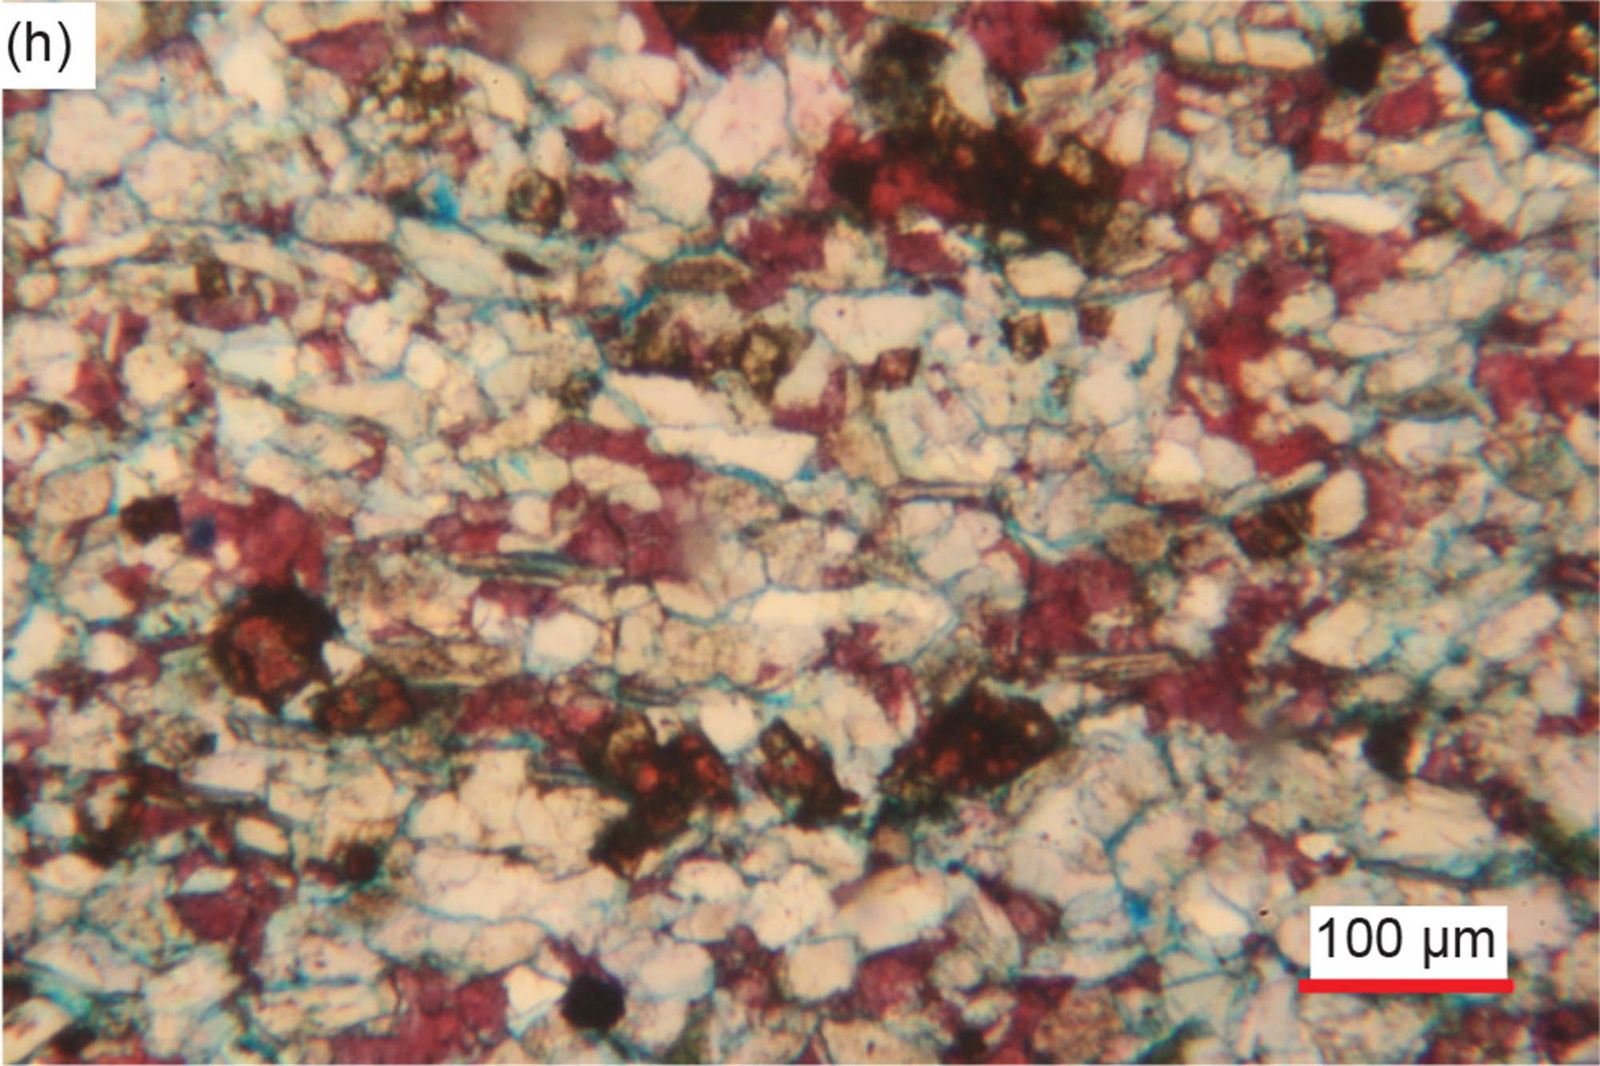
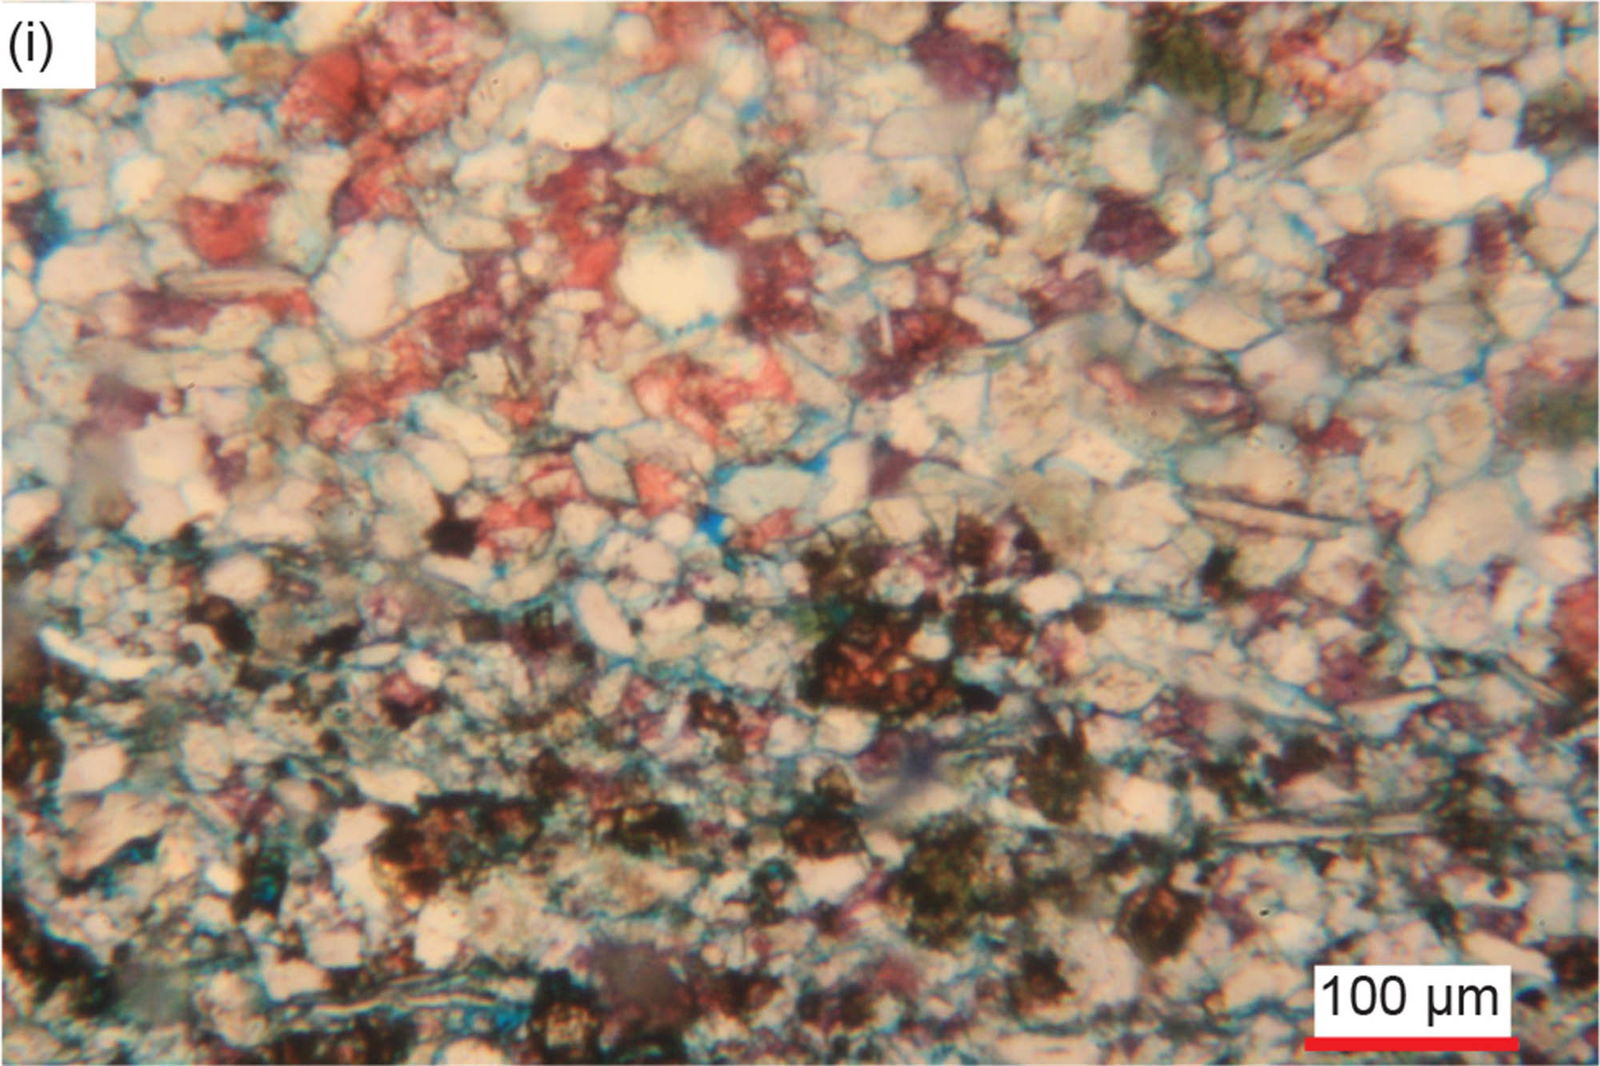
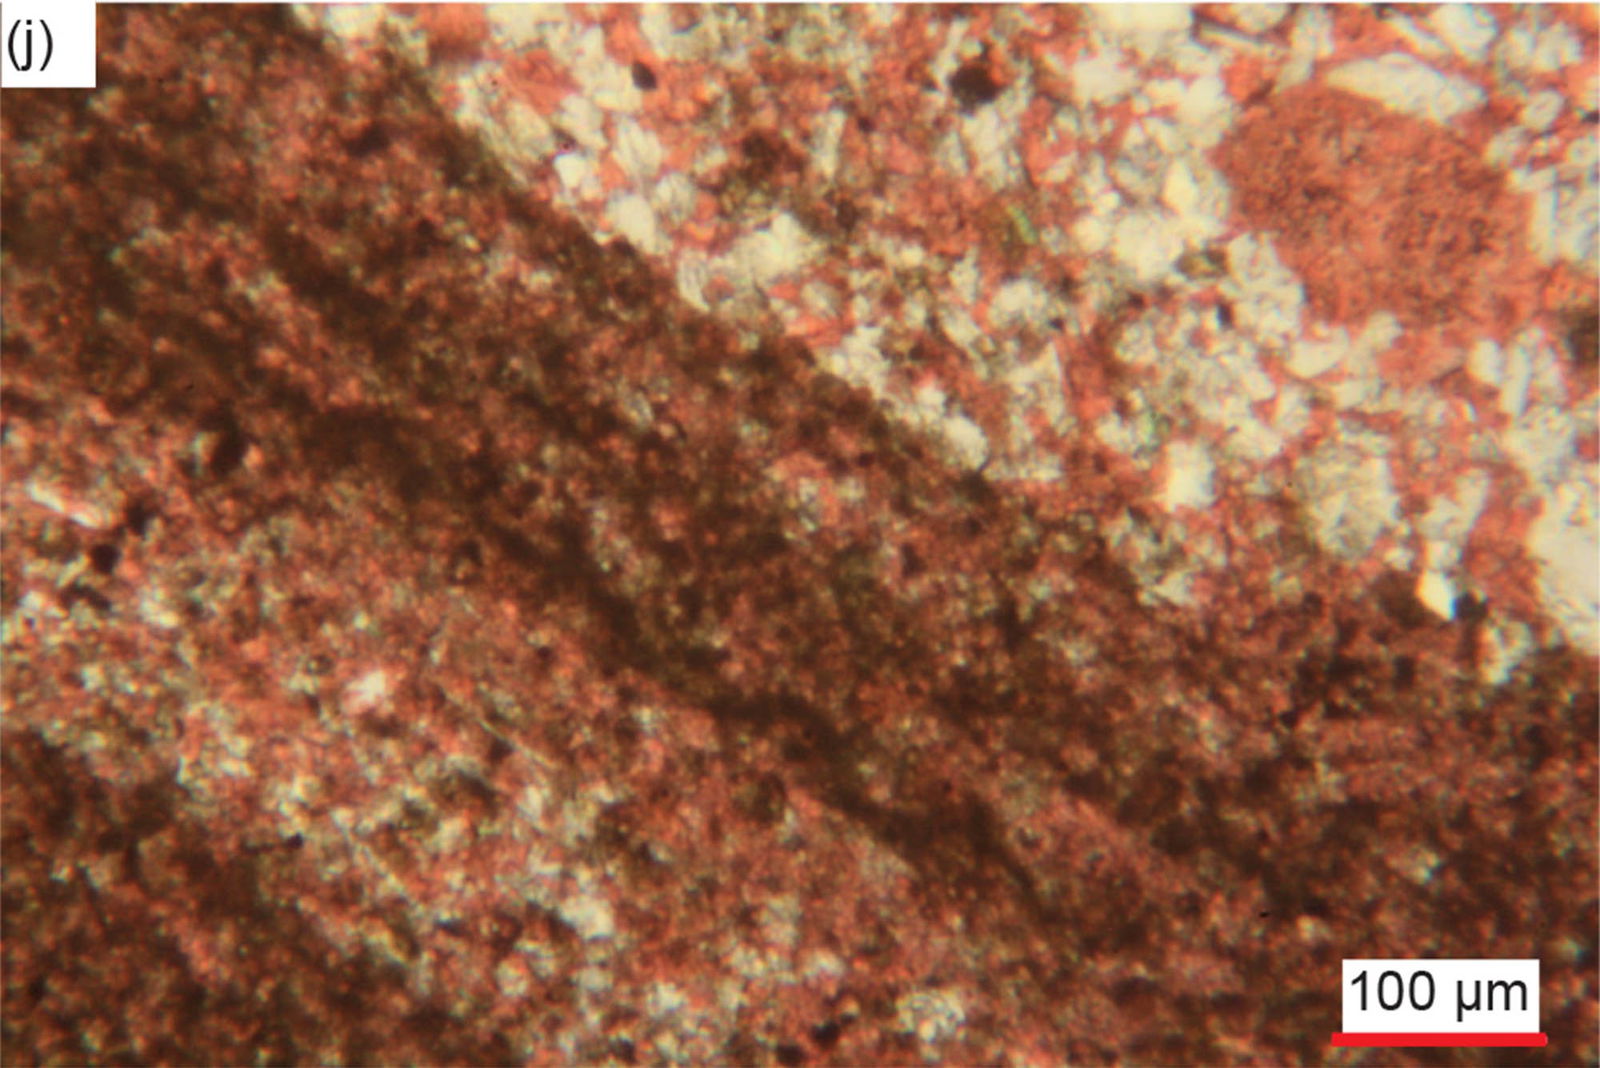
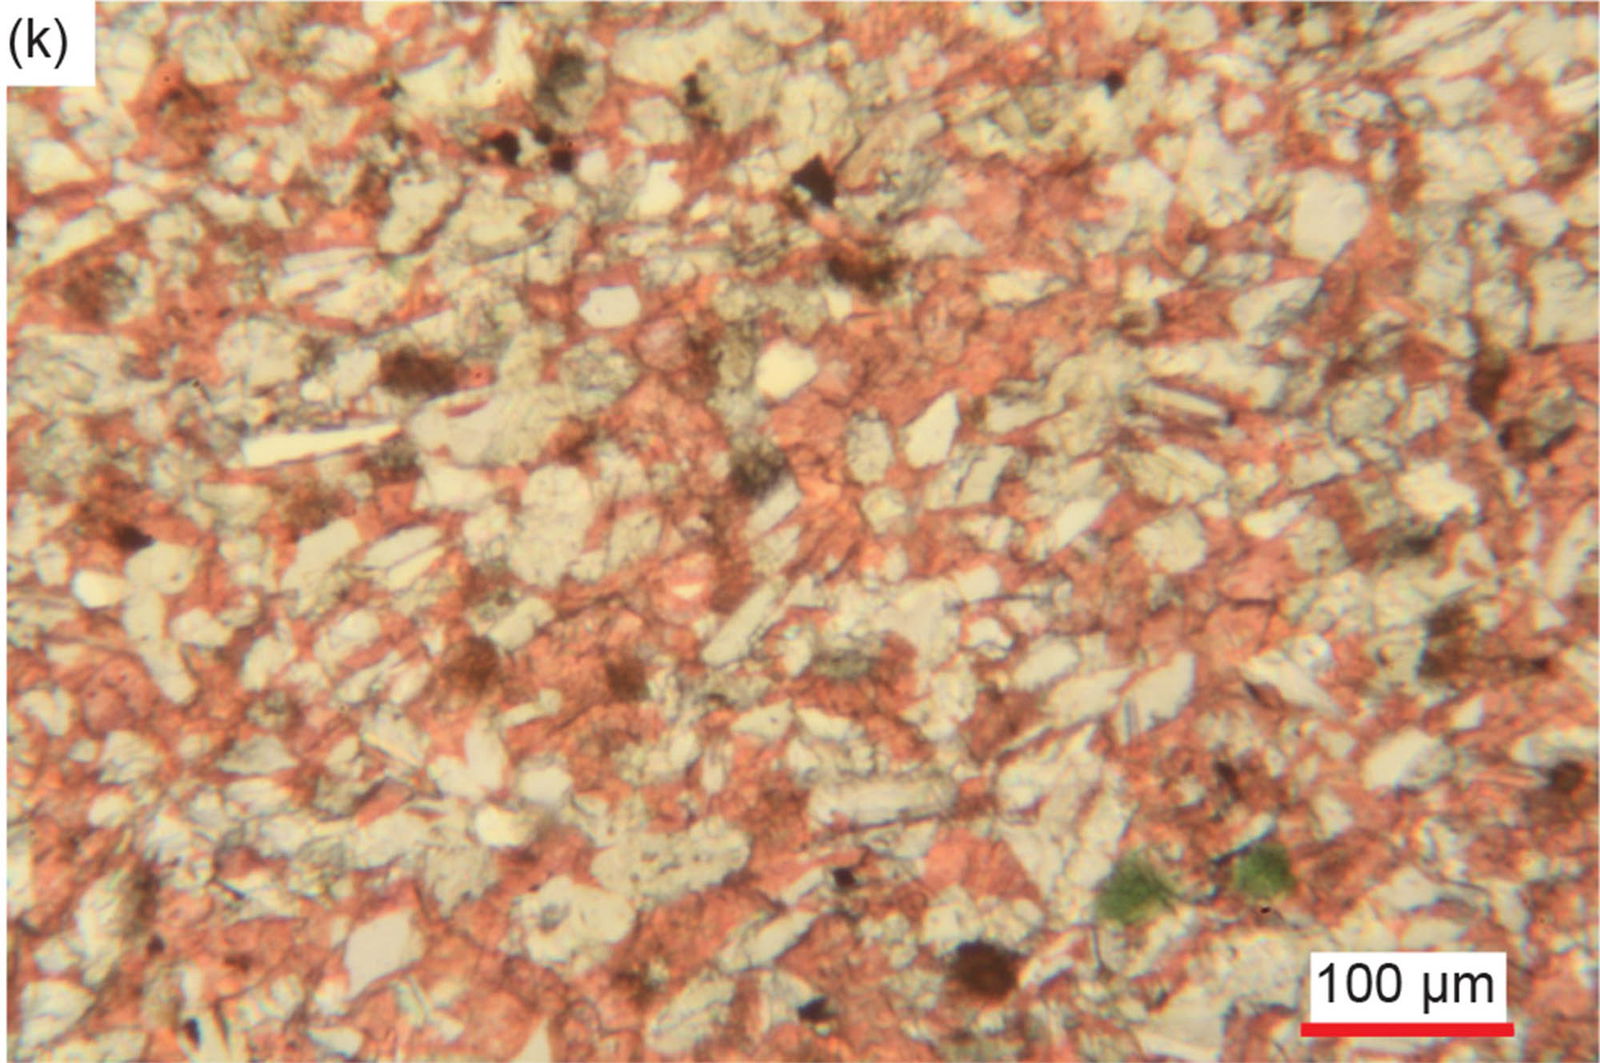
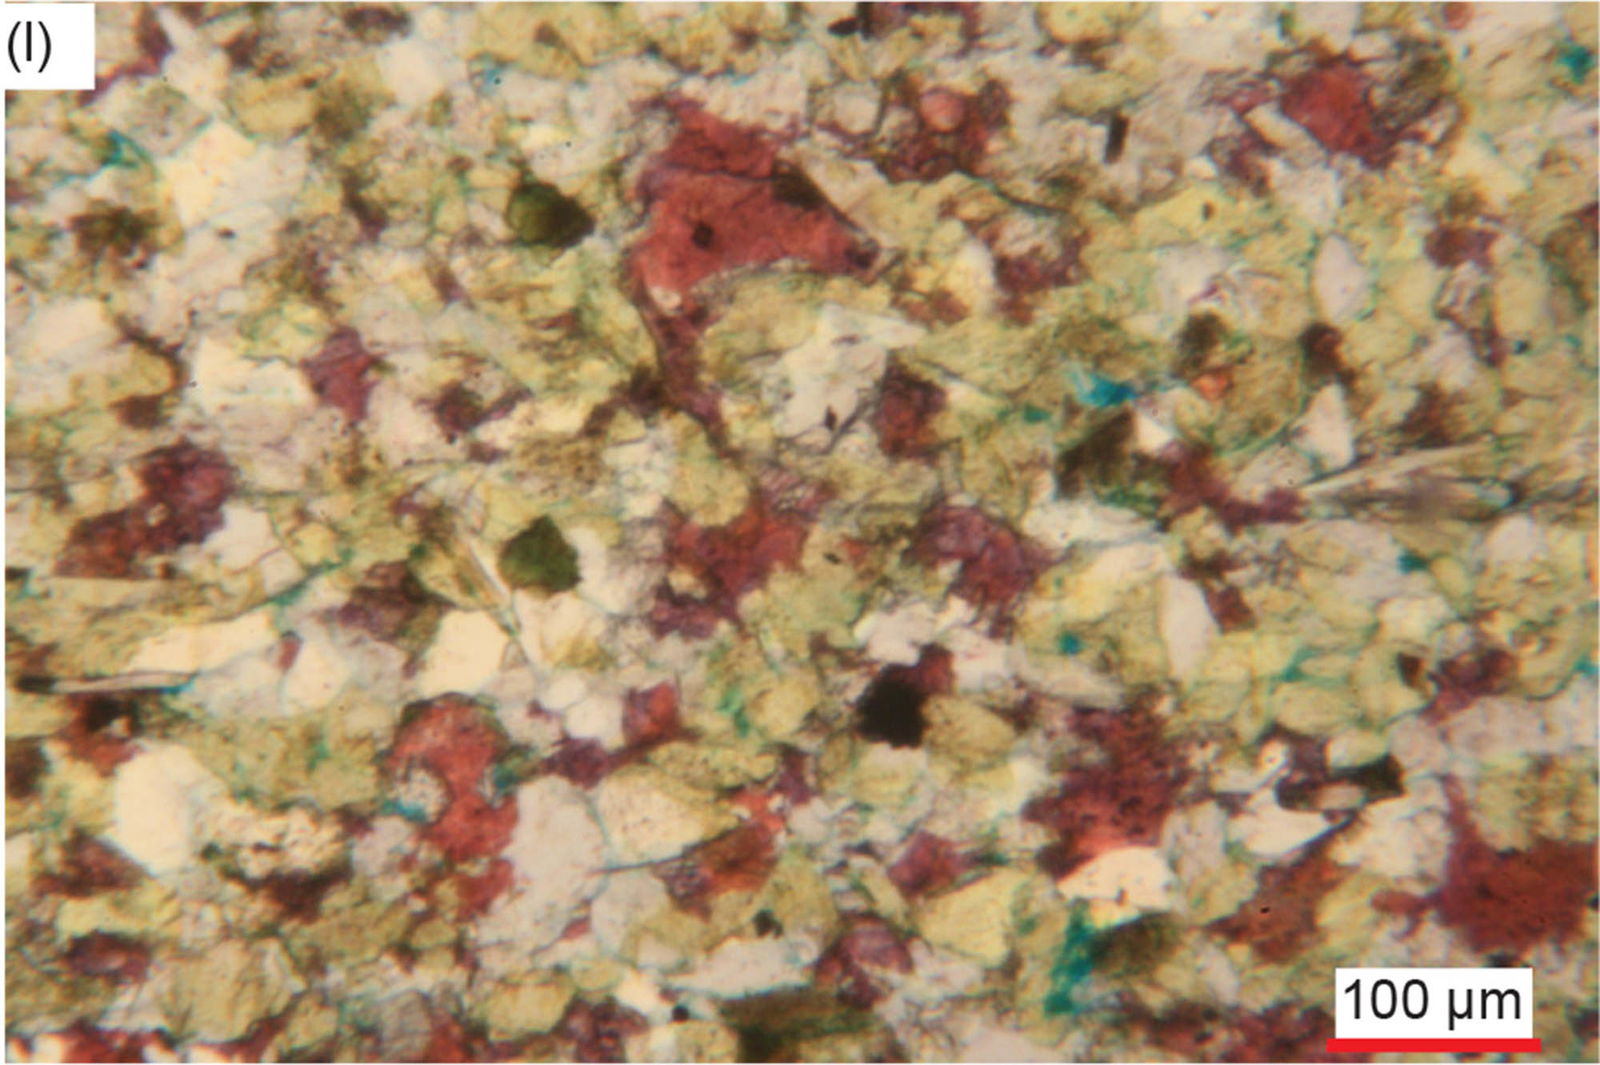
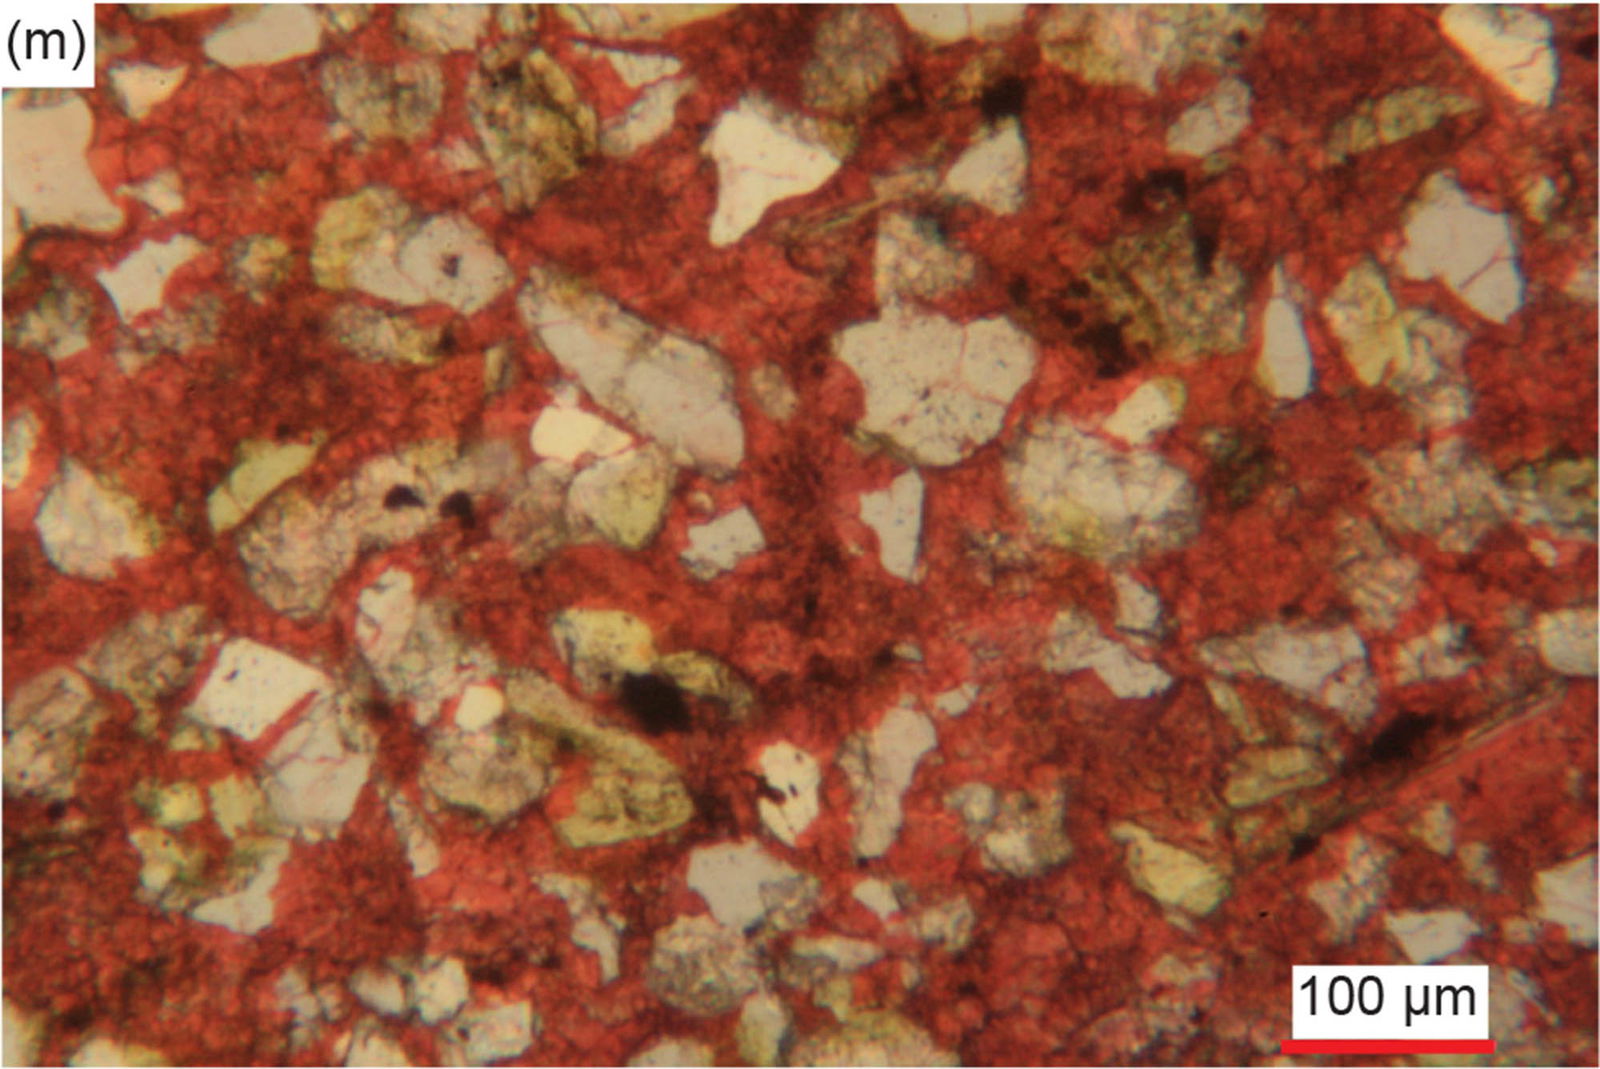
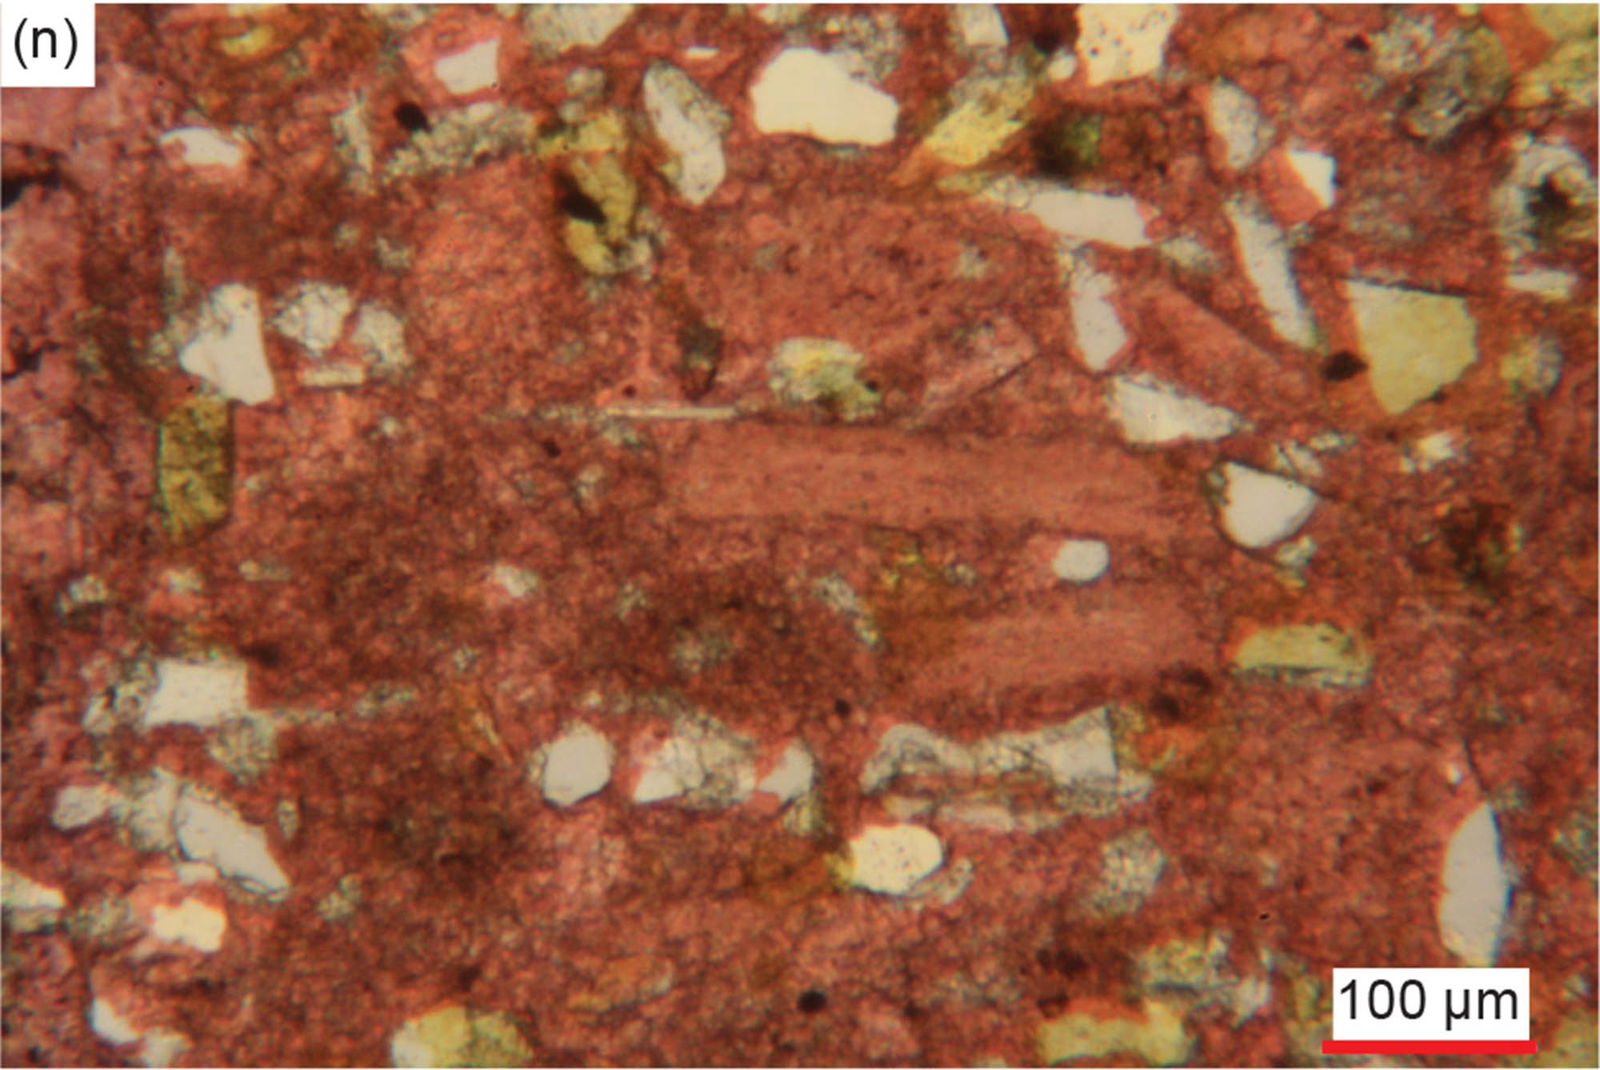
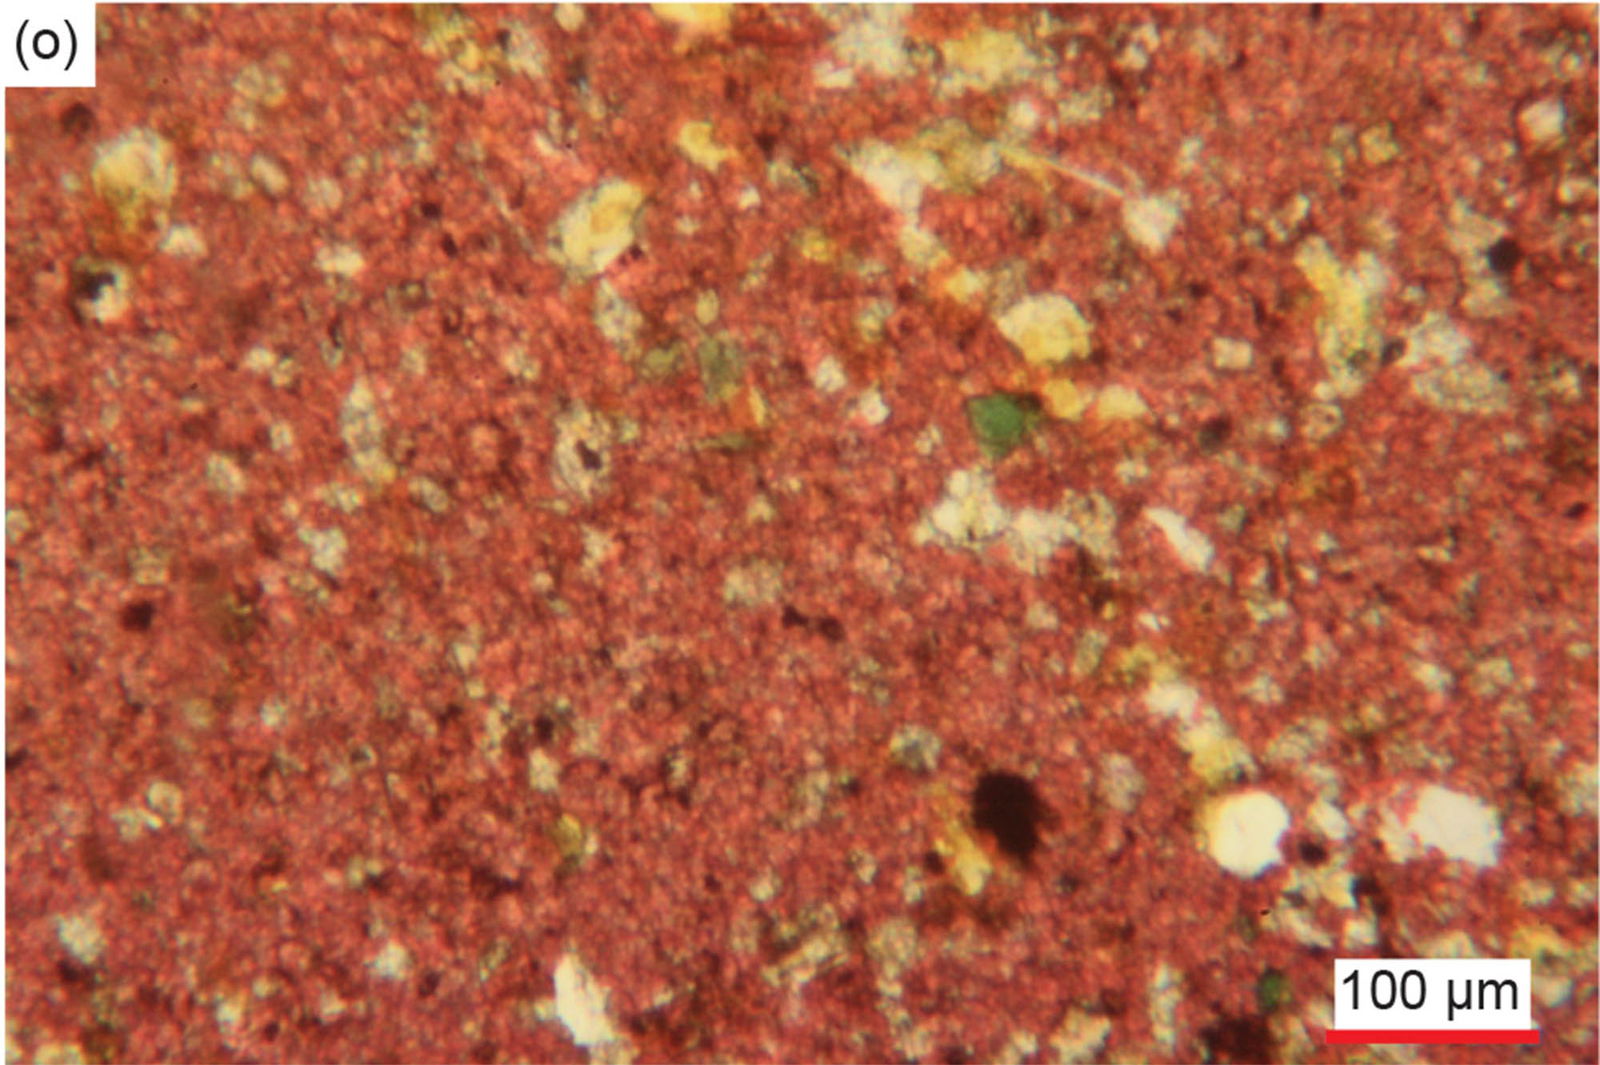
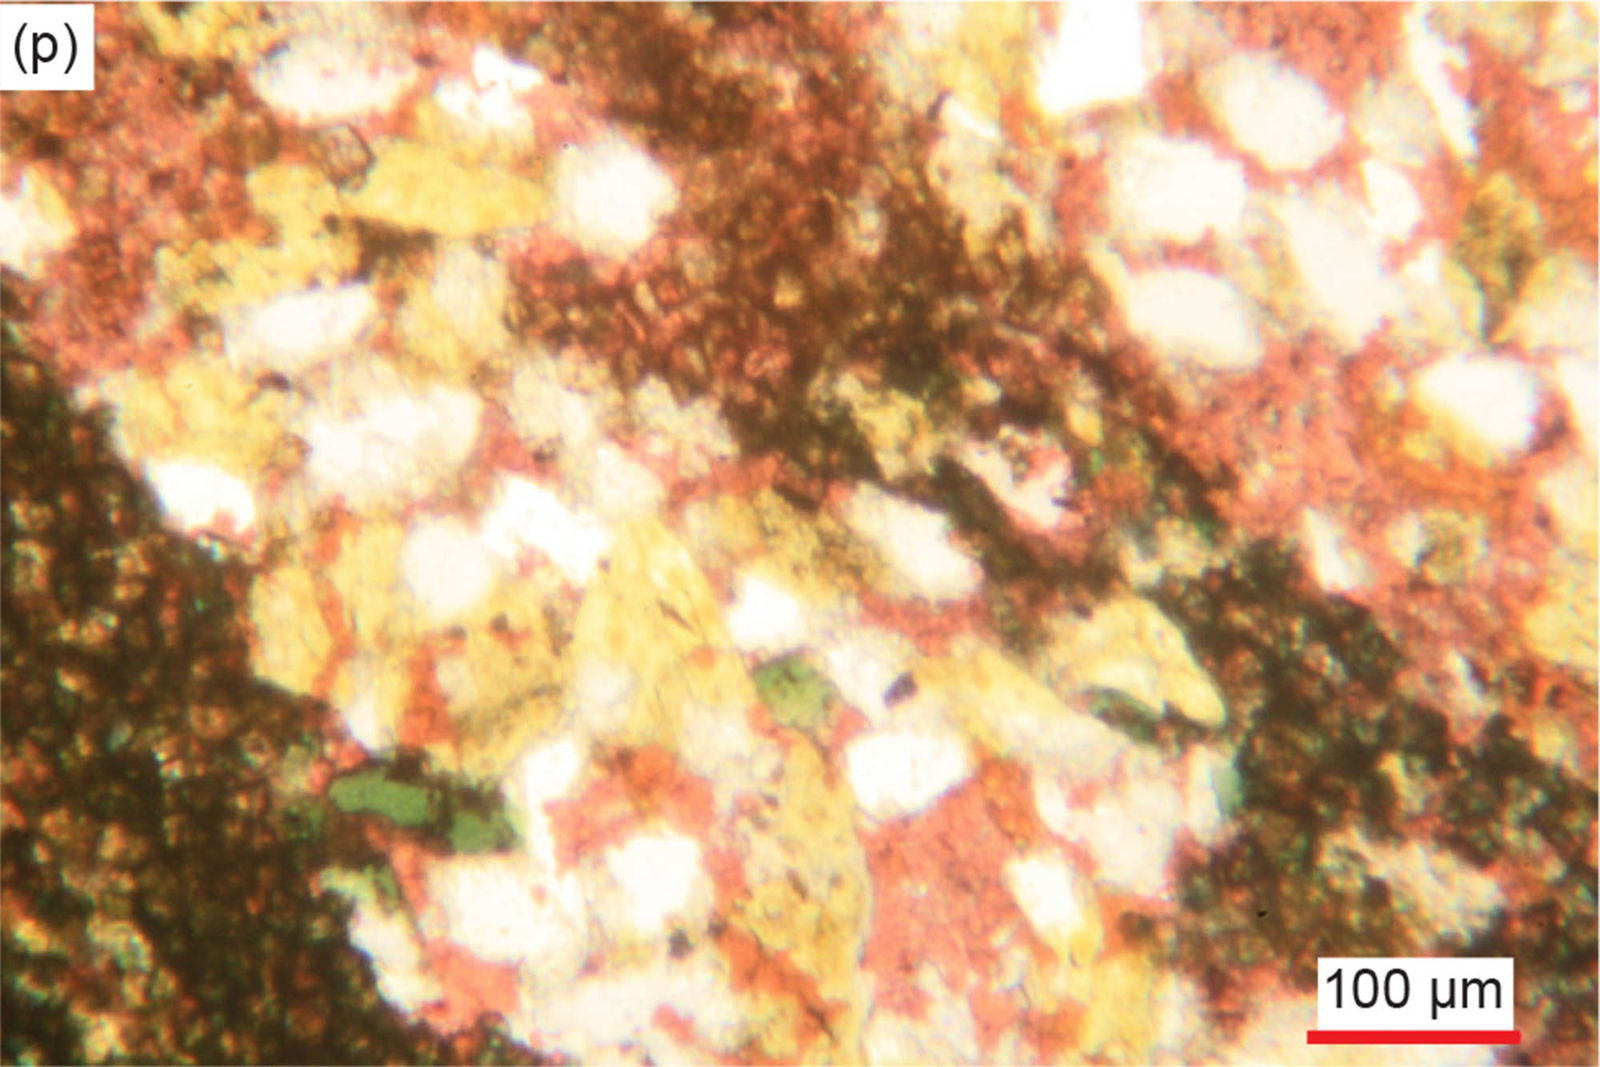
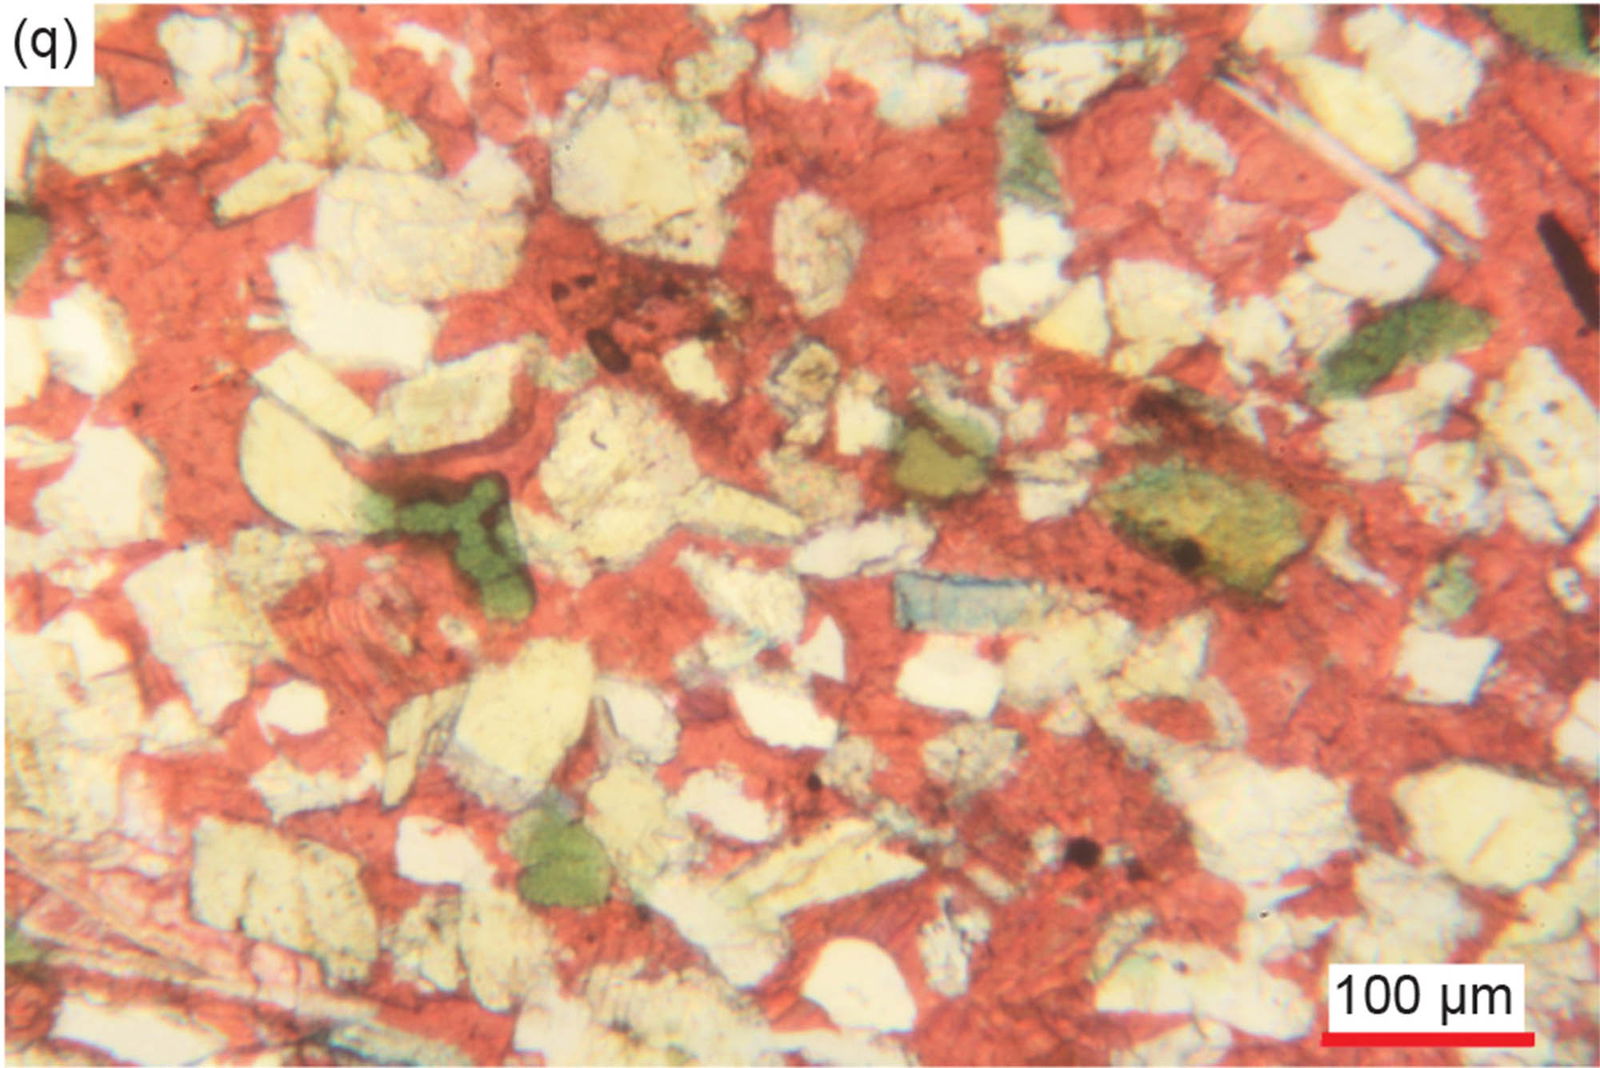
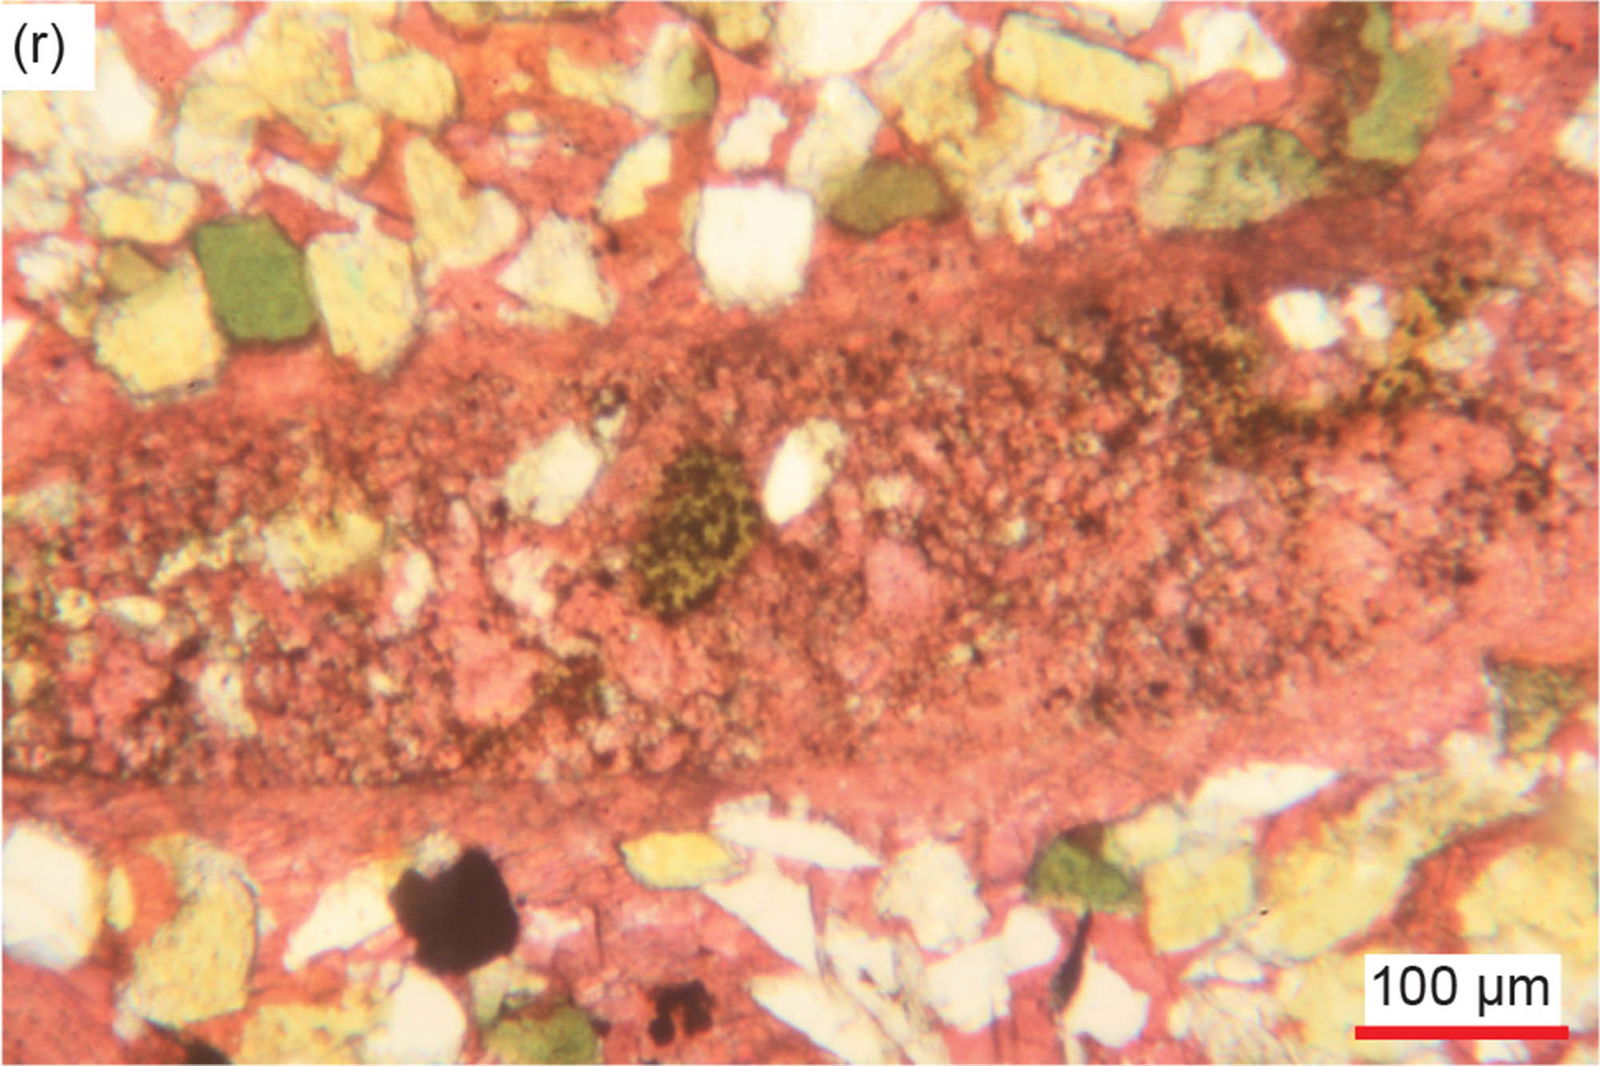
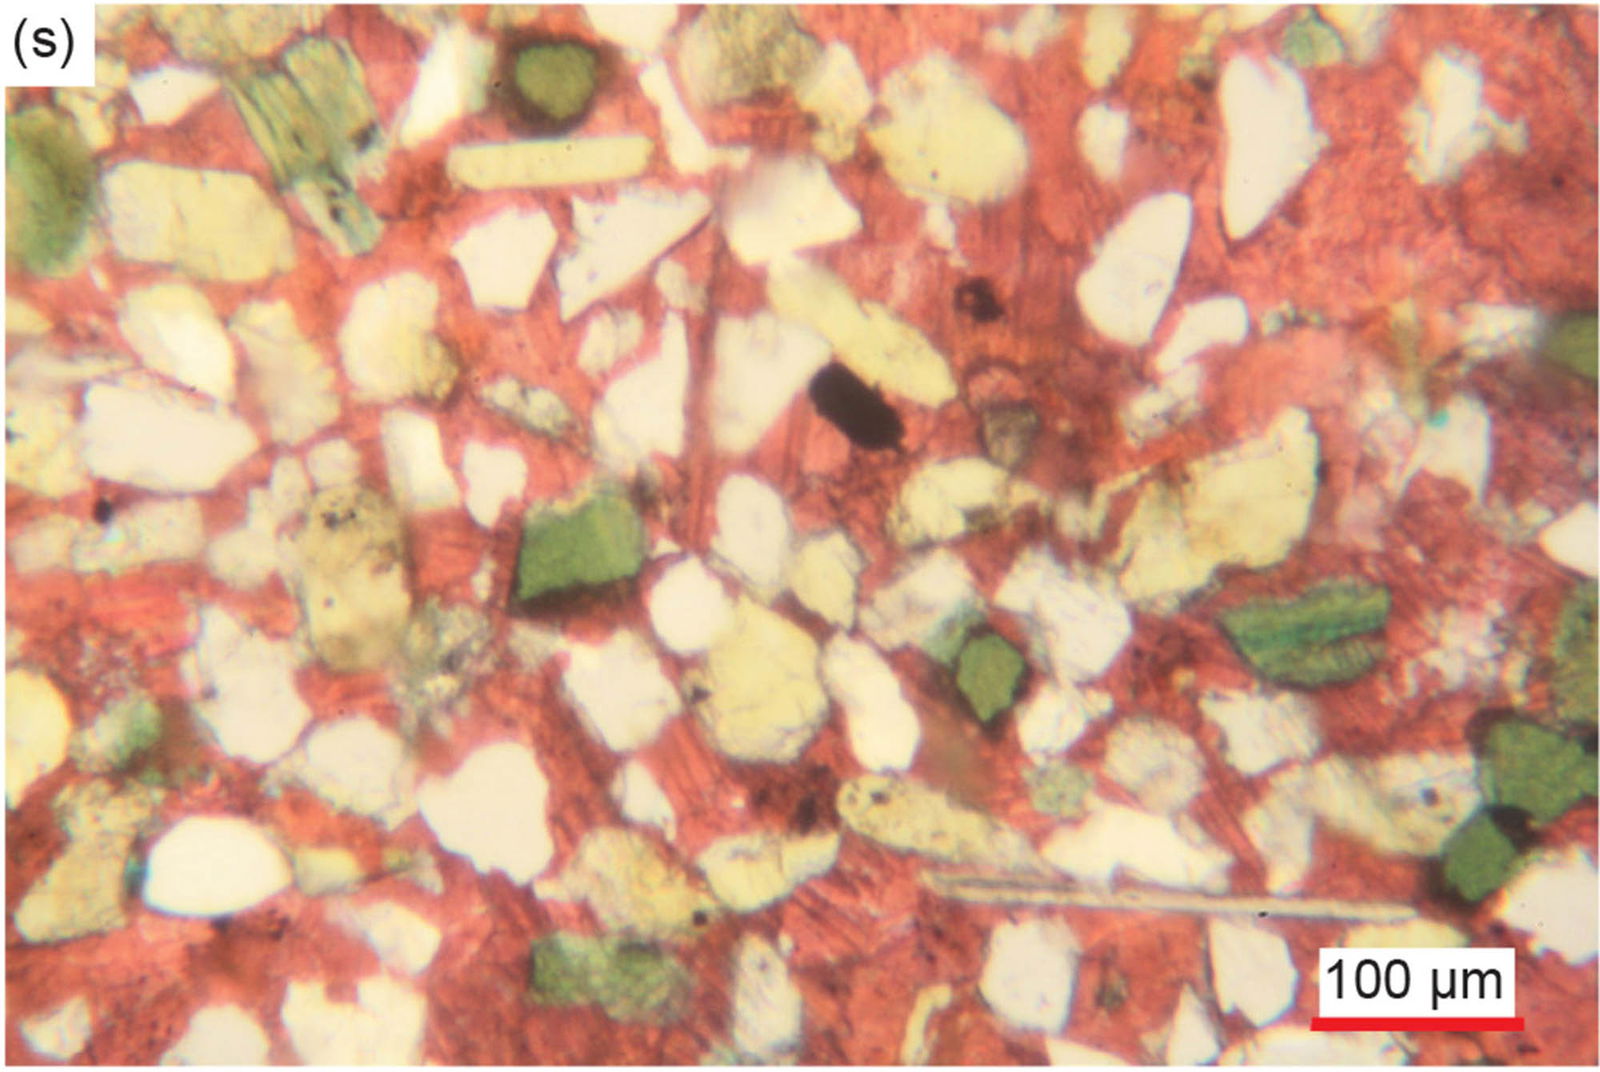
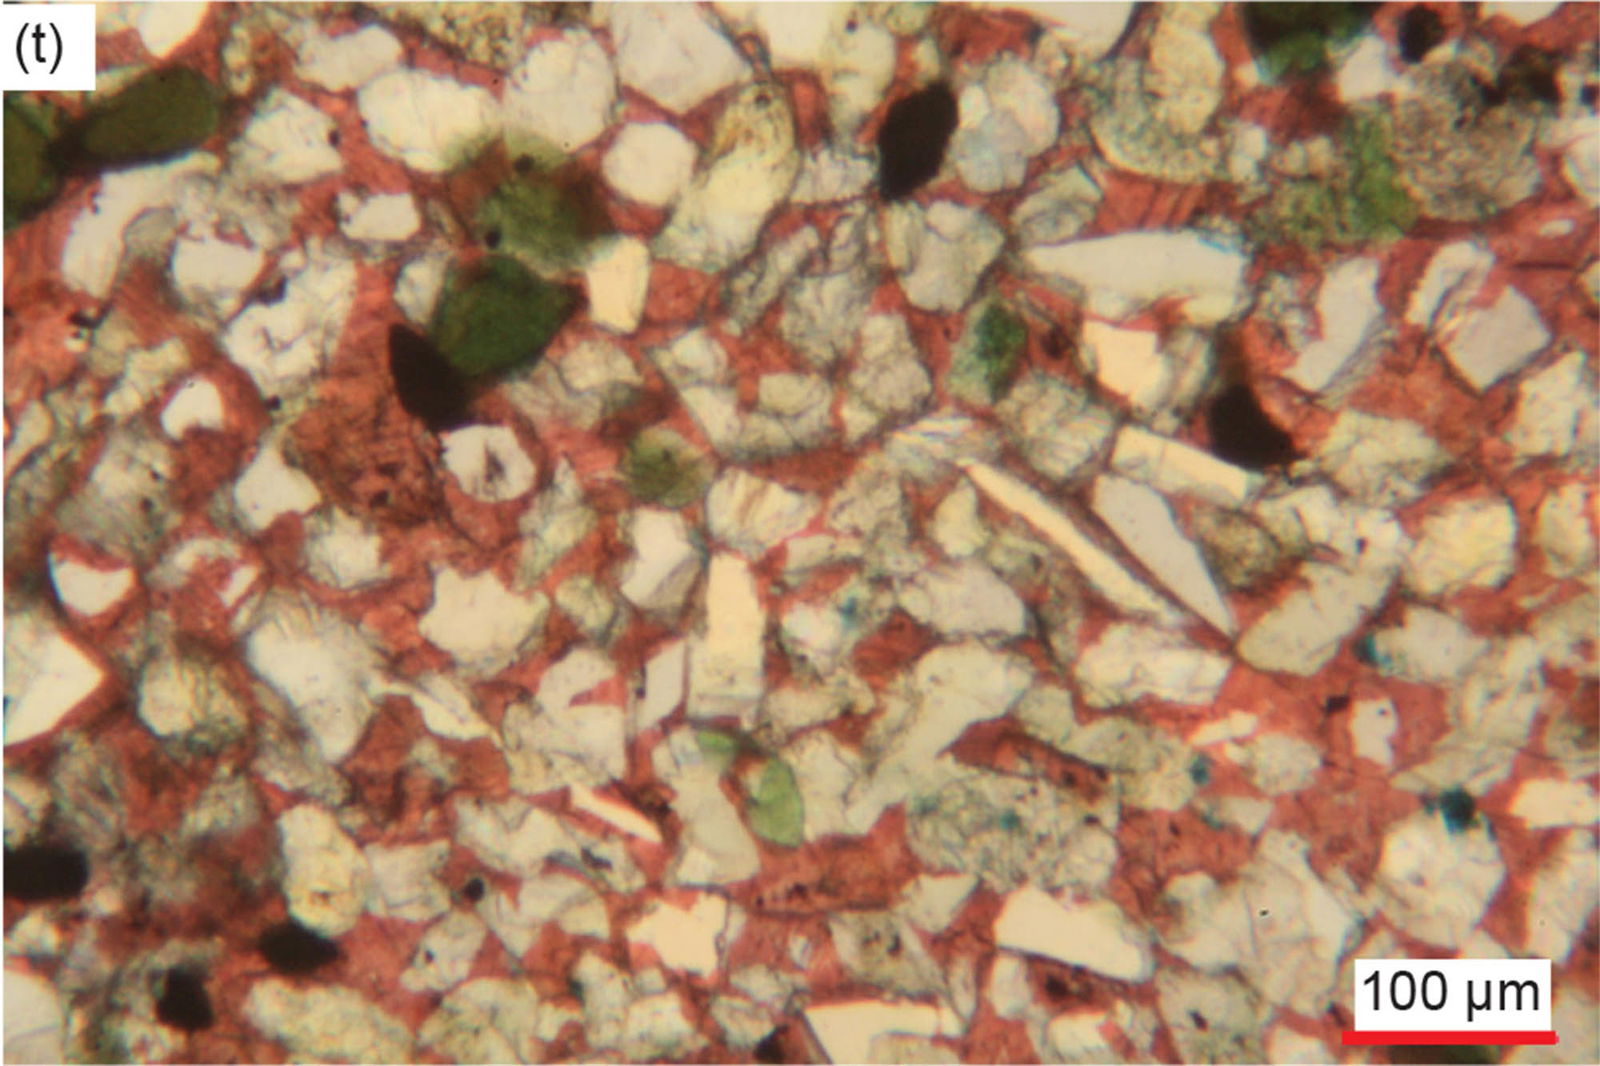
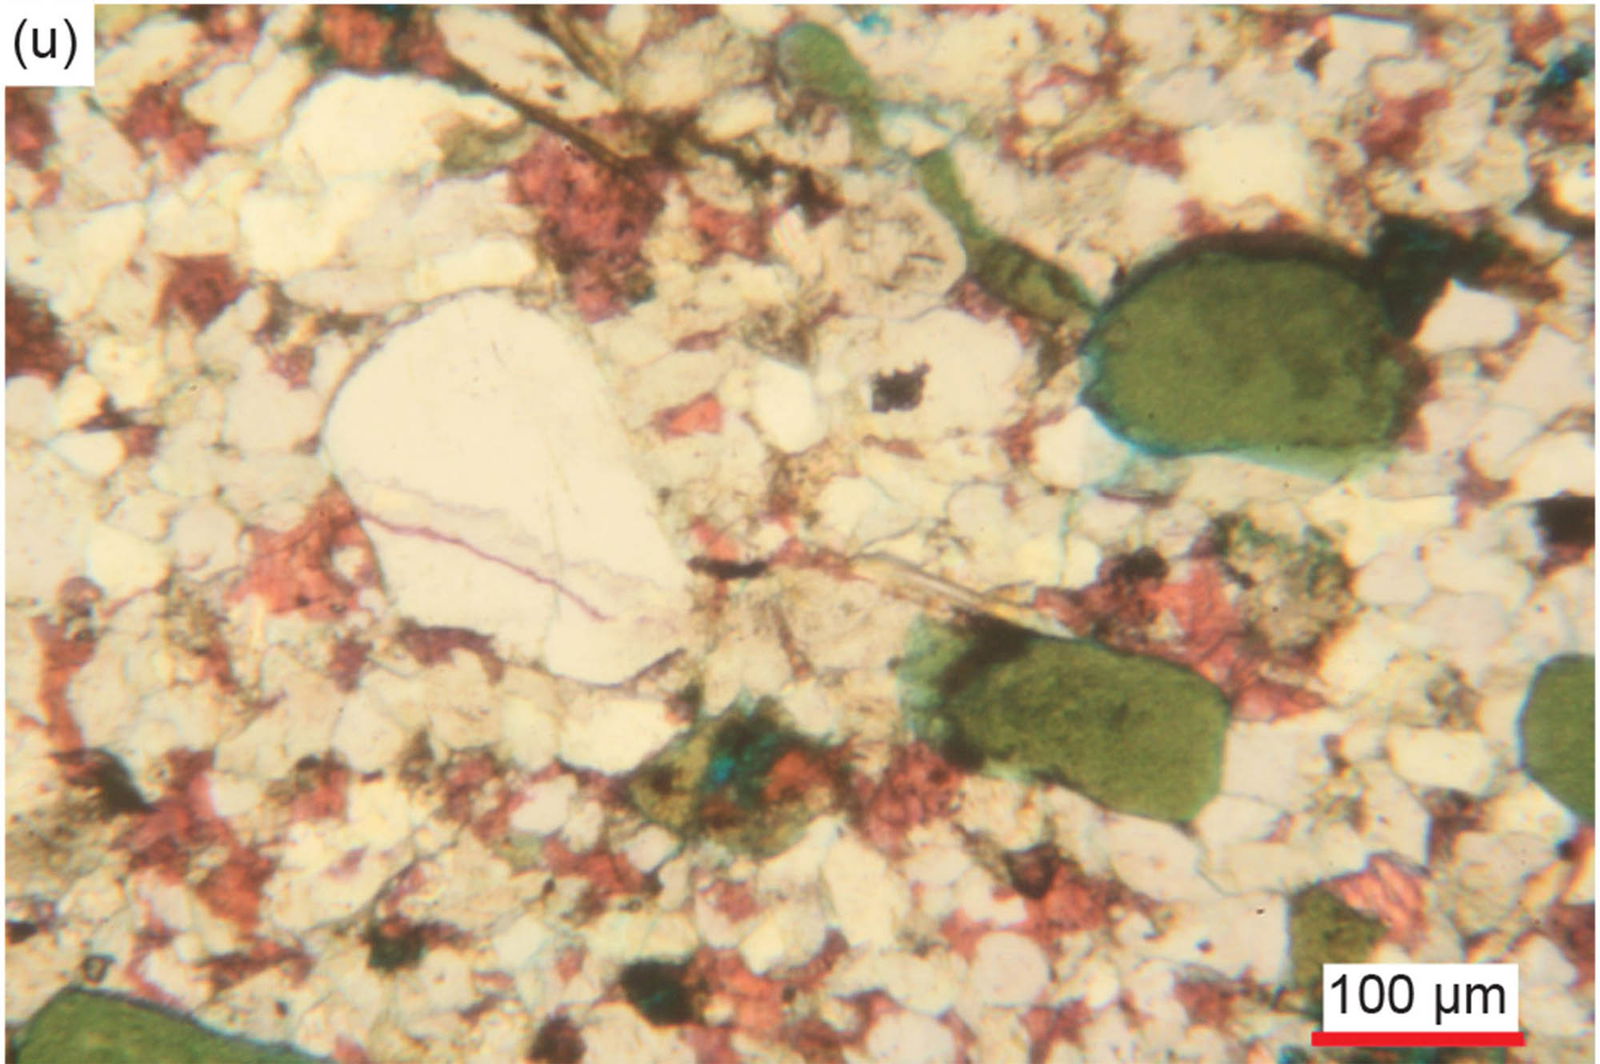
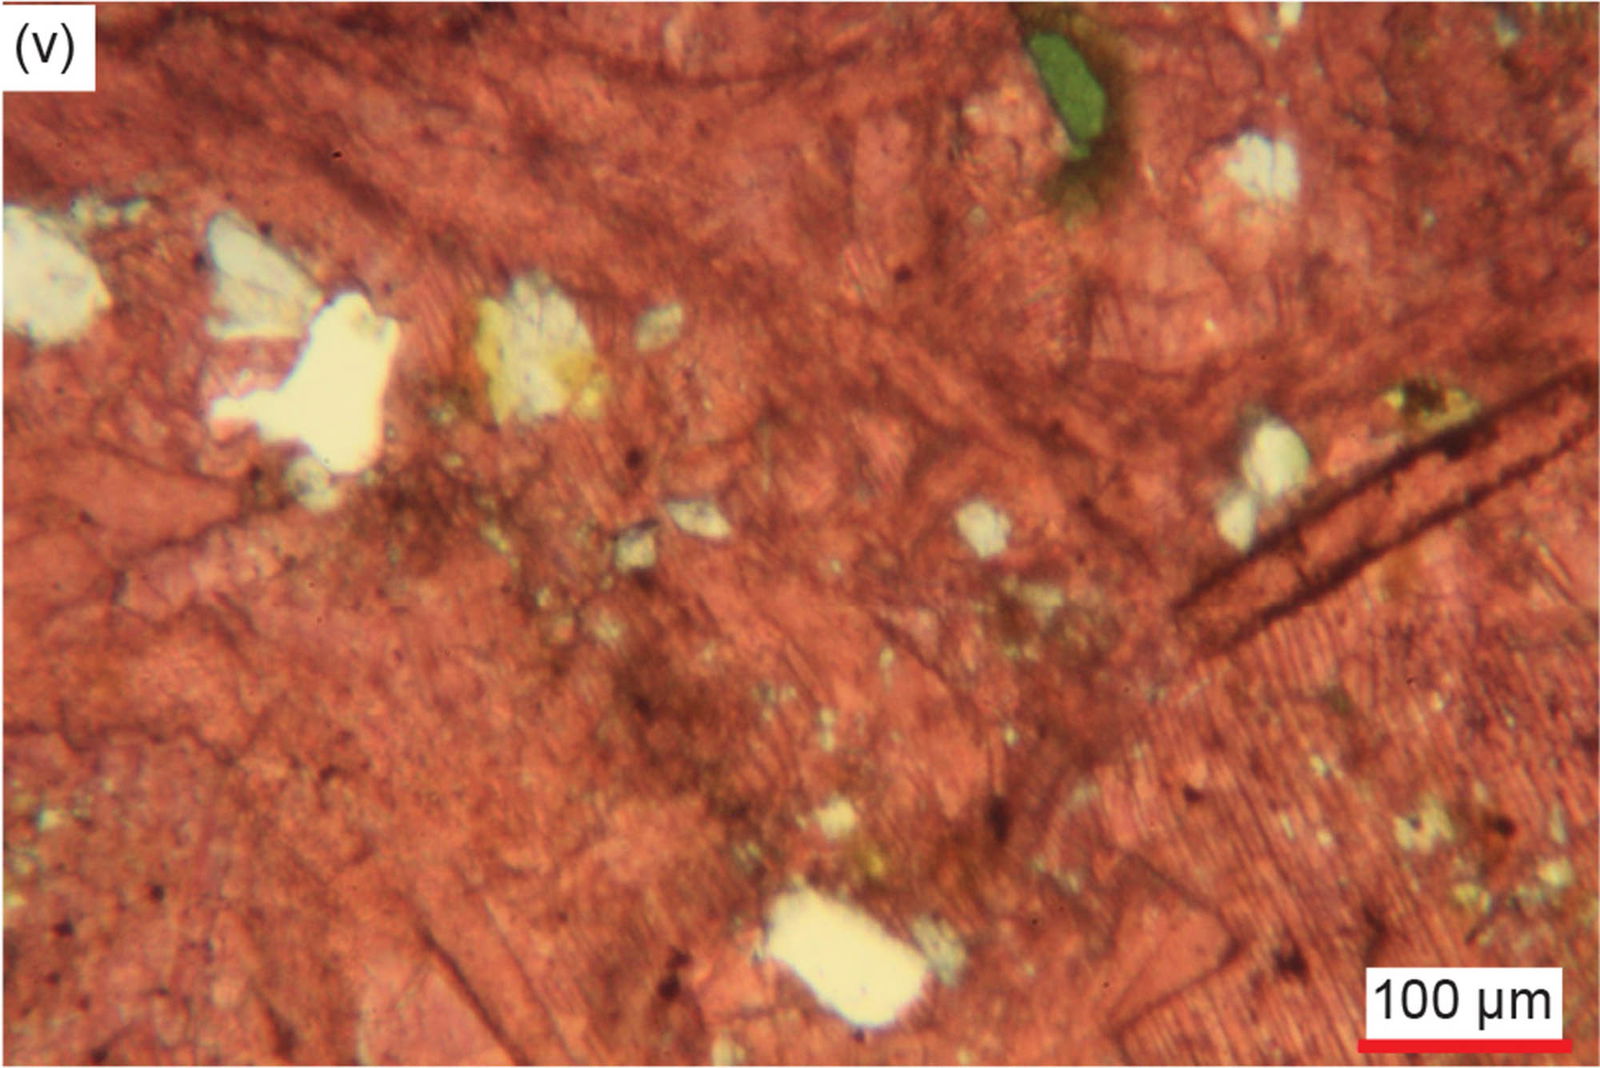
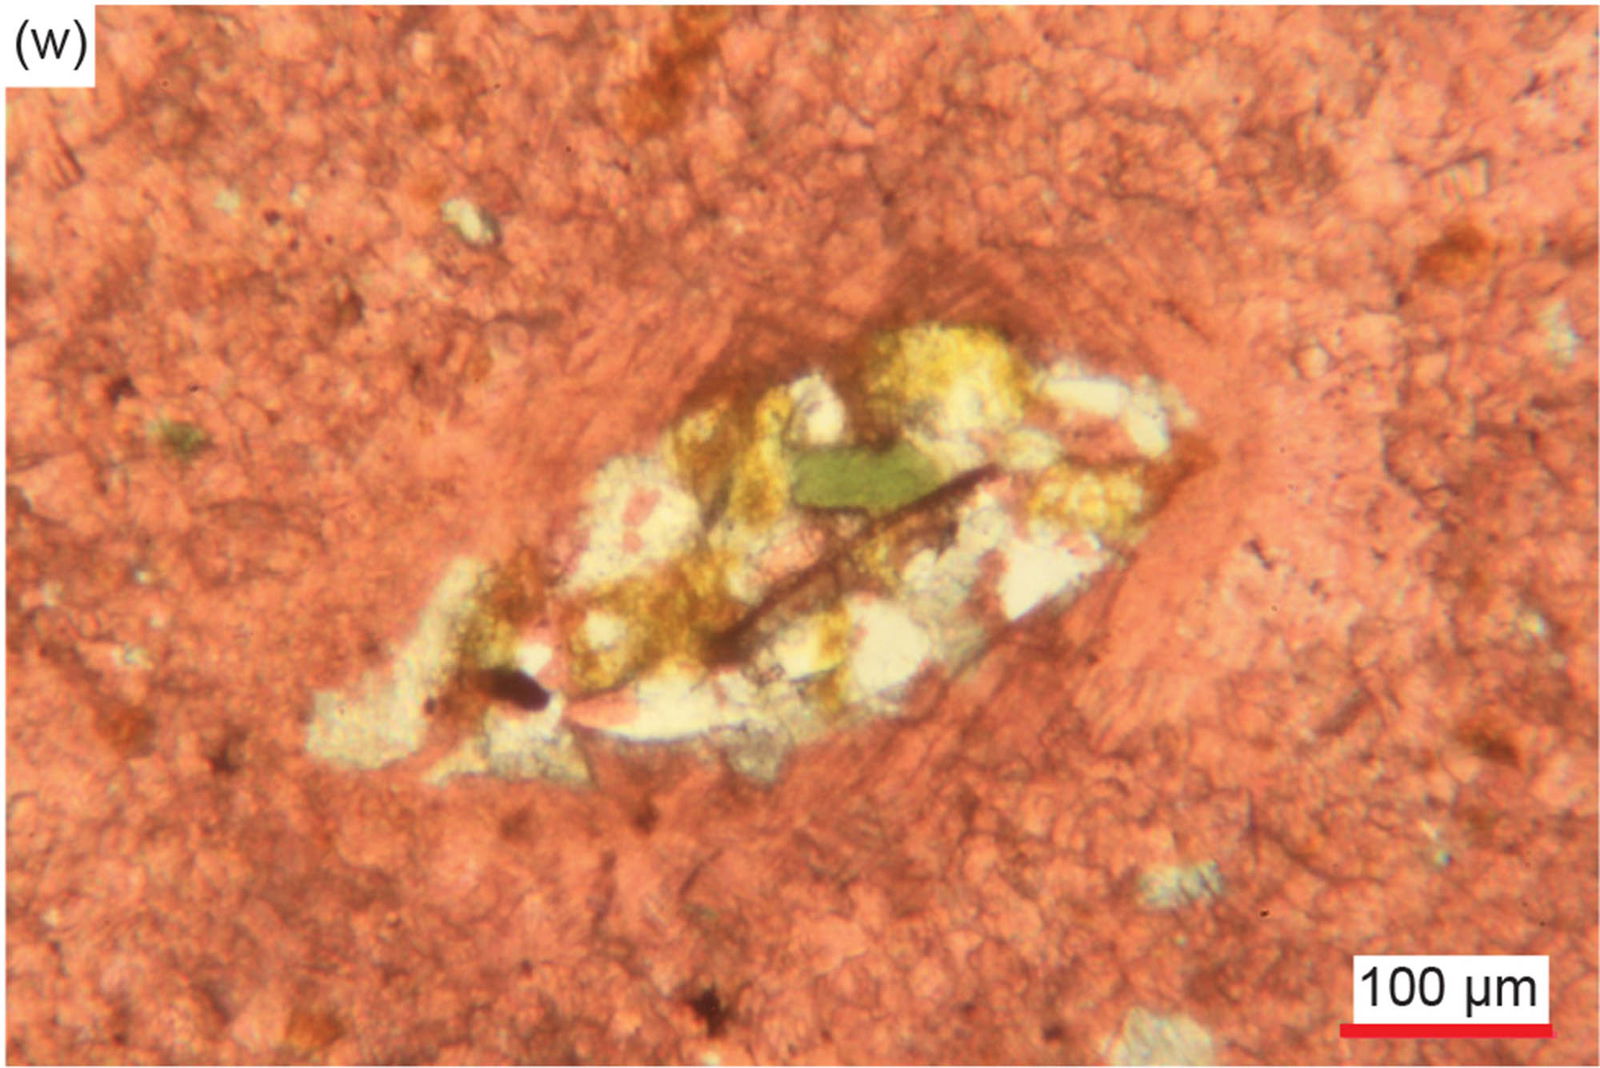
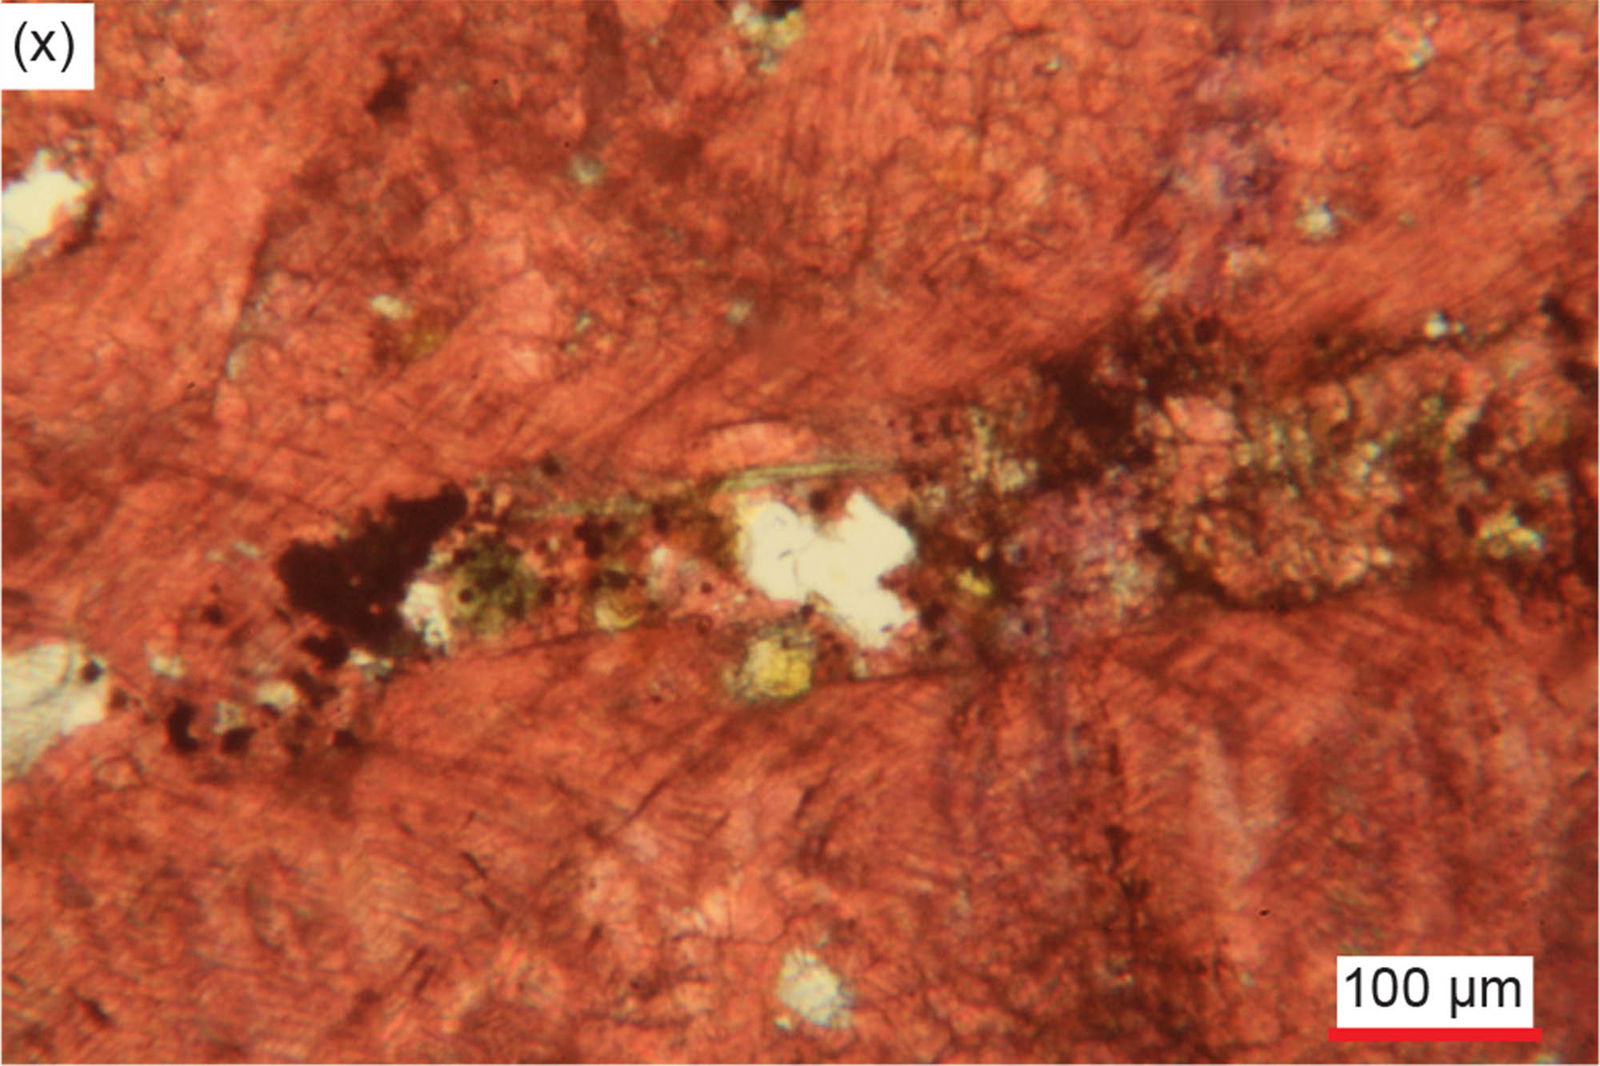
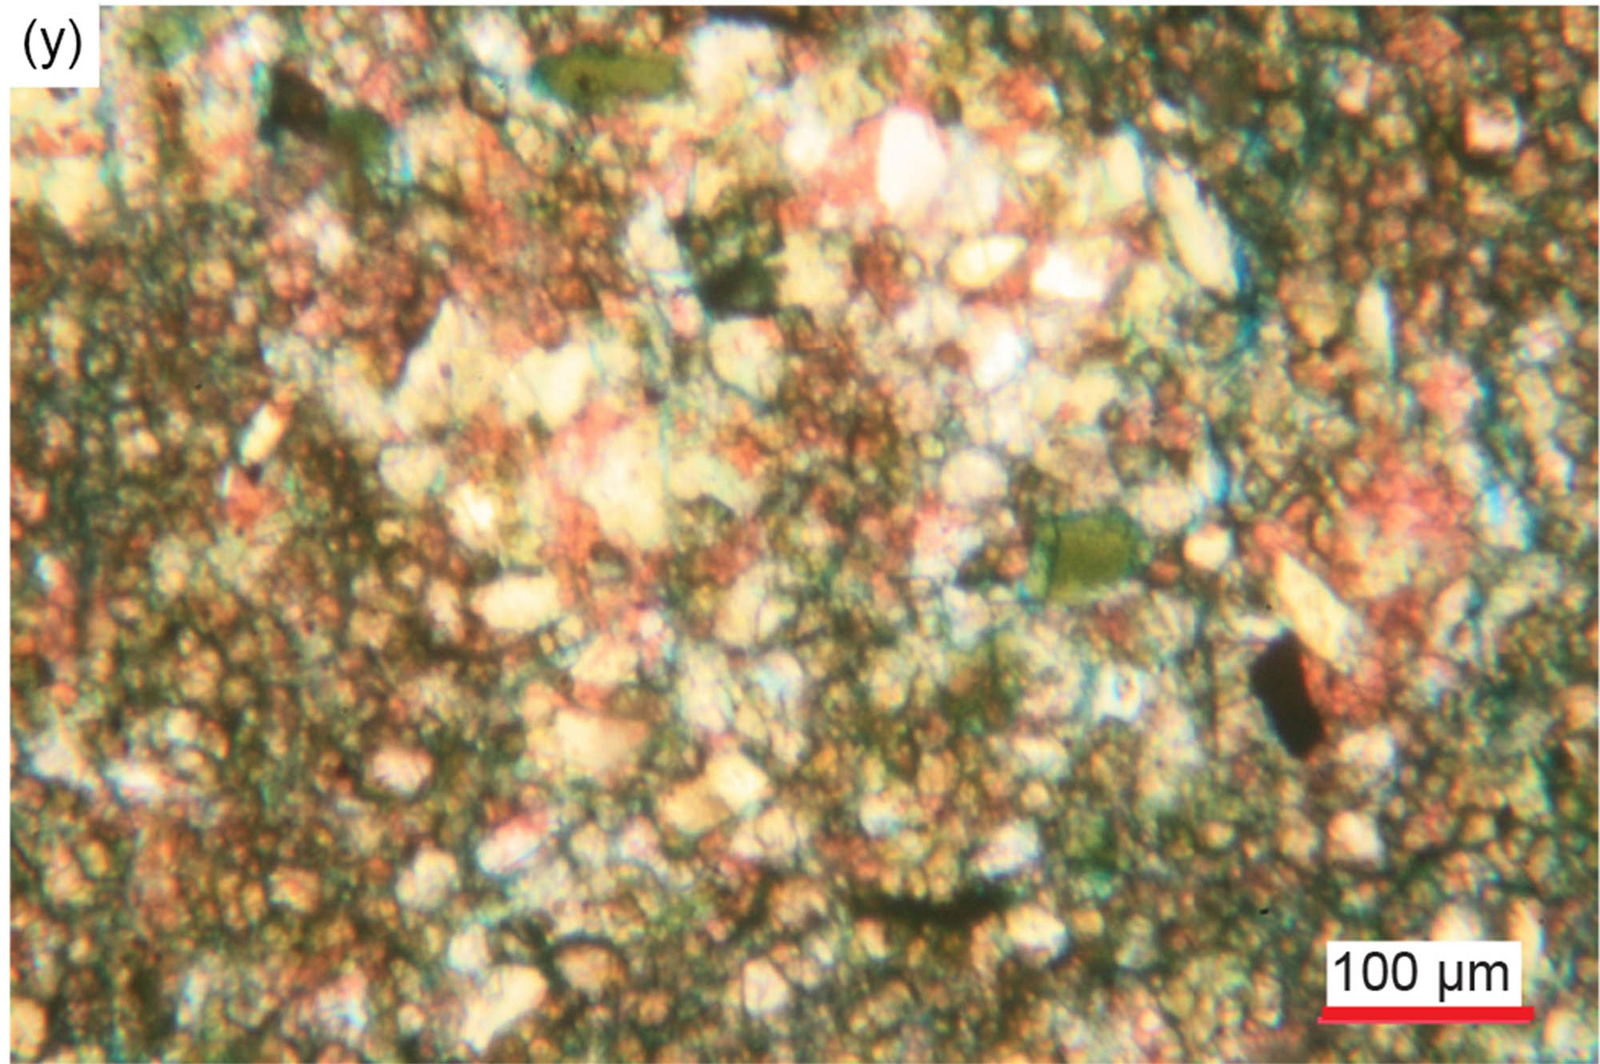
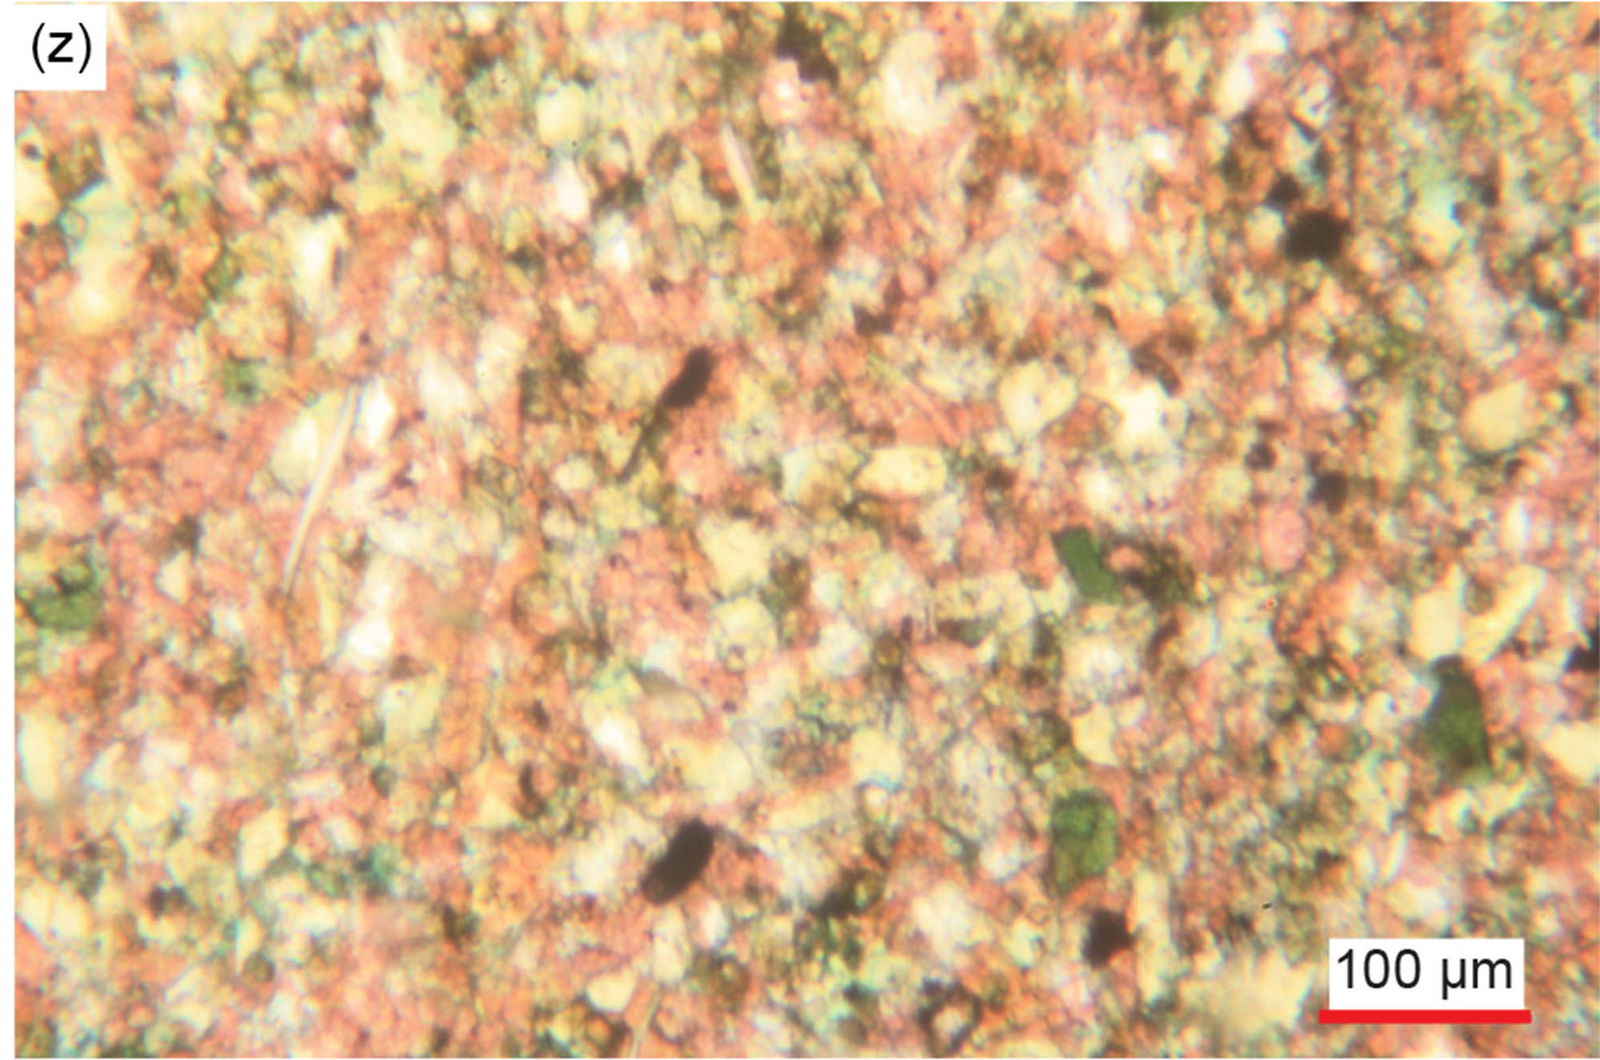
Fig. 25. A representative set of photomicrographs at various scales (as indicated) showing the detrital quartz grains within the Muav Formation samples. Distal samples: (a) MLS-01, (b), (c) MLS-02, and (d), (e) MLS-03. Matkatamiba fold samples: (f) MFML-01, (g) MFML-02, (h), (i) MFML-03, (j), (k) MFML-04, (l) MFML-05, (m), (n) MFML-06, (o), (p) MFTB-01, (q), (r) MFTB-02, (s), (t) MFTB-03, (u) MFTB-04, (v)–(x) MFTB-05, and (y), (z) MFTB-06.
Sometimes the variously sized quartz grains are concentrated or more densely packed with accompanying K-feldspar grains in thin laminae and occasionally are clumped together, with some or many of the quartz grains meeting at triple points (fig. 26). Sometimes the tightly-clumped quartz grains have faint edges, so they look like single very large grains. These clumps of grains meeting at triple points could either indicate post-depositional silica cementing of adjoining, in-contact detrital quartz grains, or the clumps are themselves detrital, the triple point cementing have occurred in the source rocks prior to their erosion. The former option is clearly evident in some samples where some of the clumped quartz grains have internal “ghost” outlines of faint iron oxides that suggests original detrital grains were overgrown by silica in optical continuity cementing adjoining quartz and K-feldspar grains into those clumps before or at the same time as calcite cementation occurred.
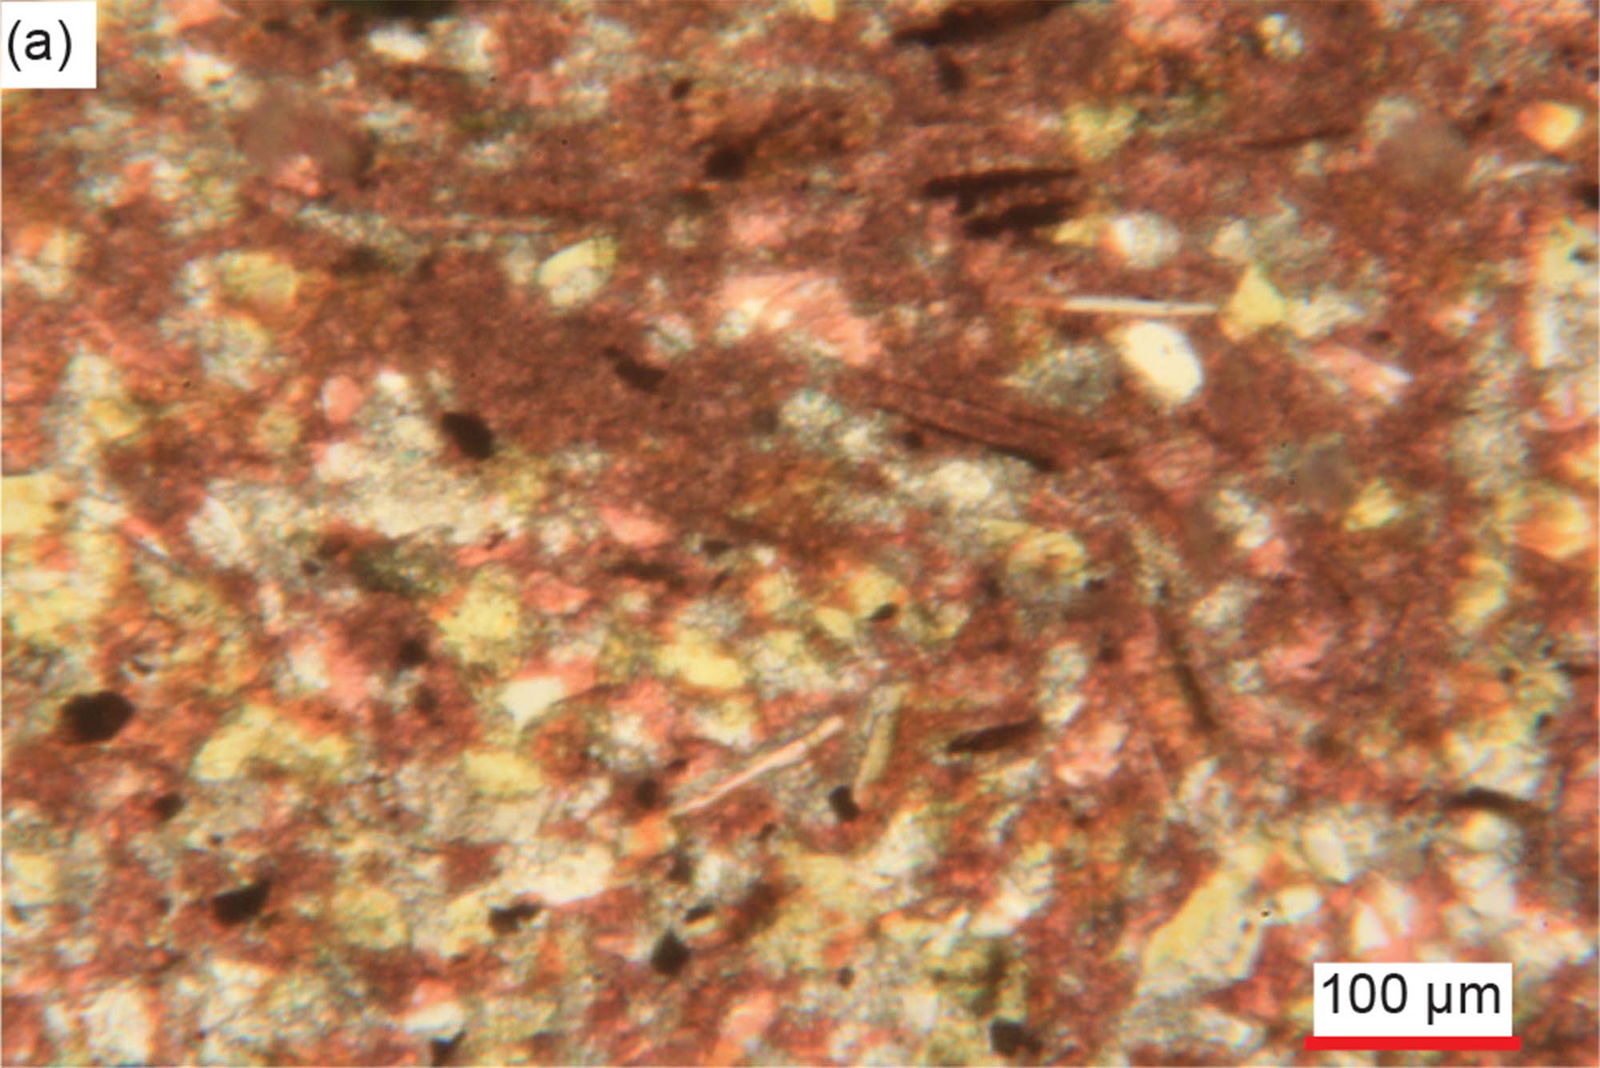
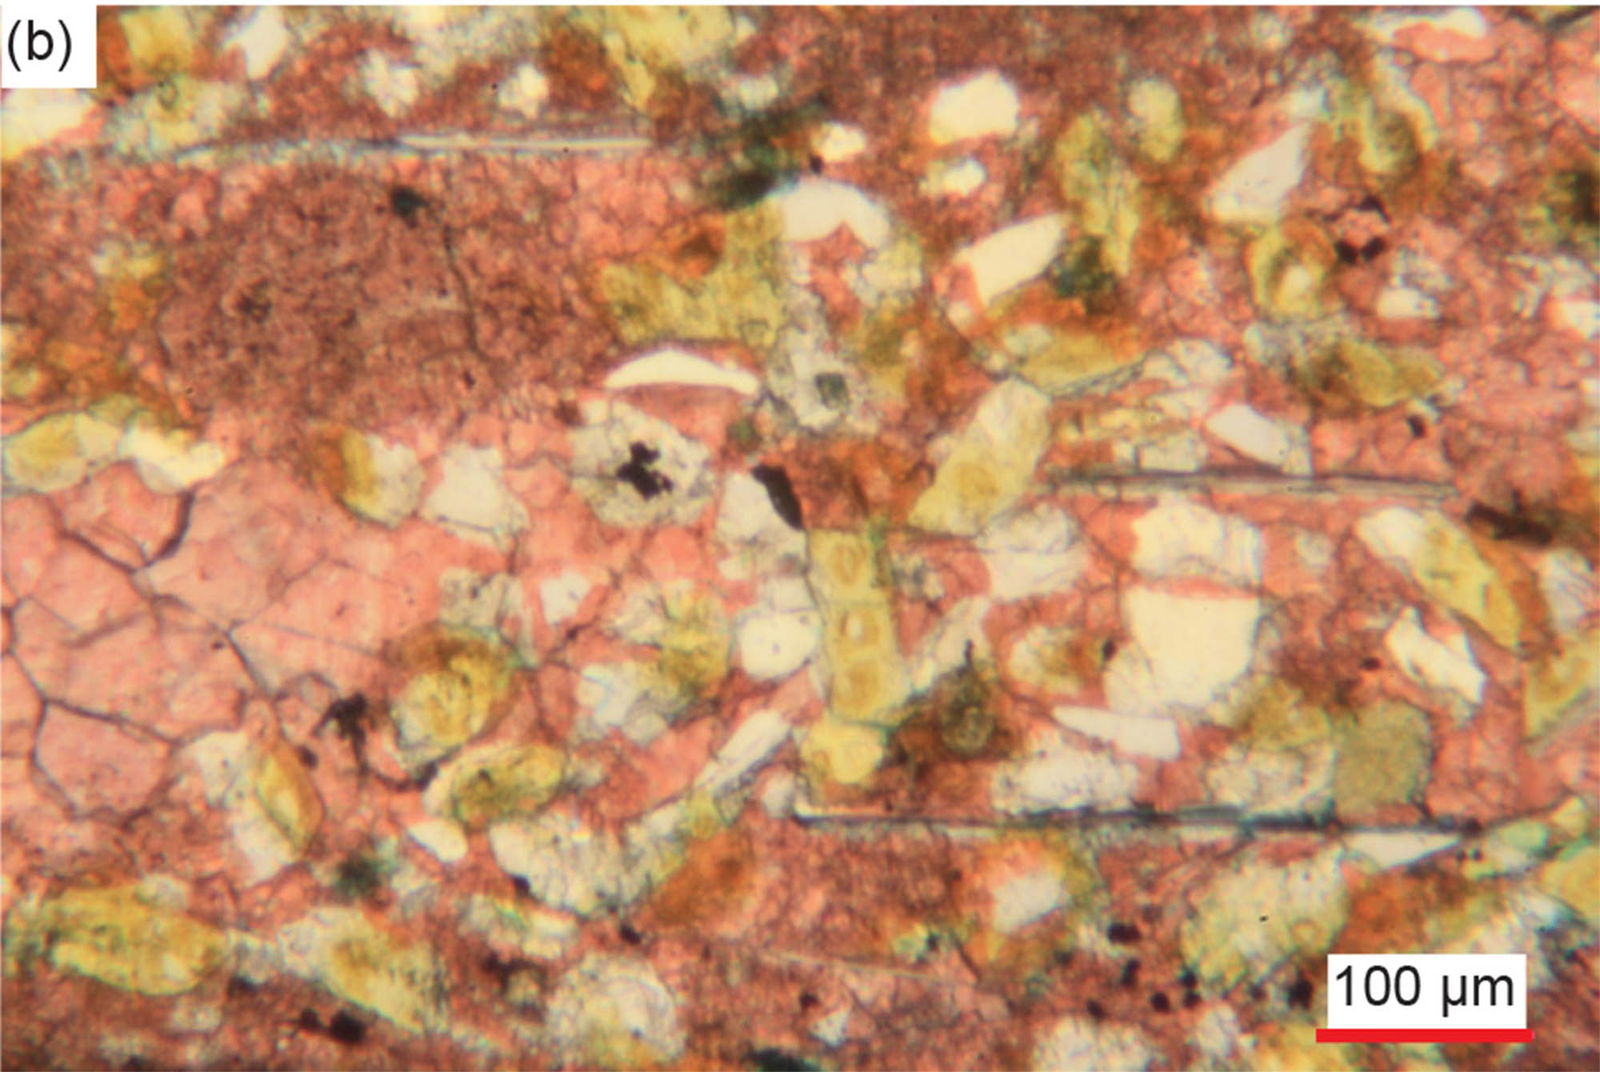
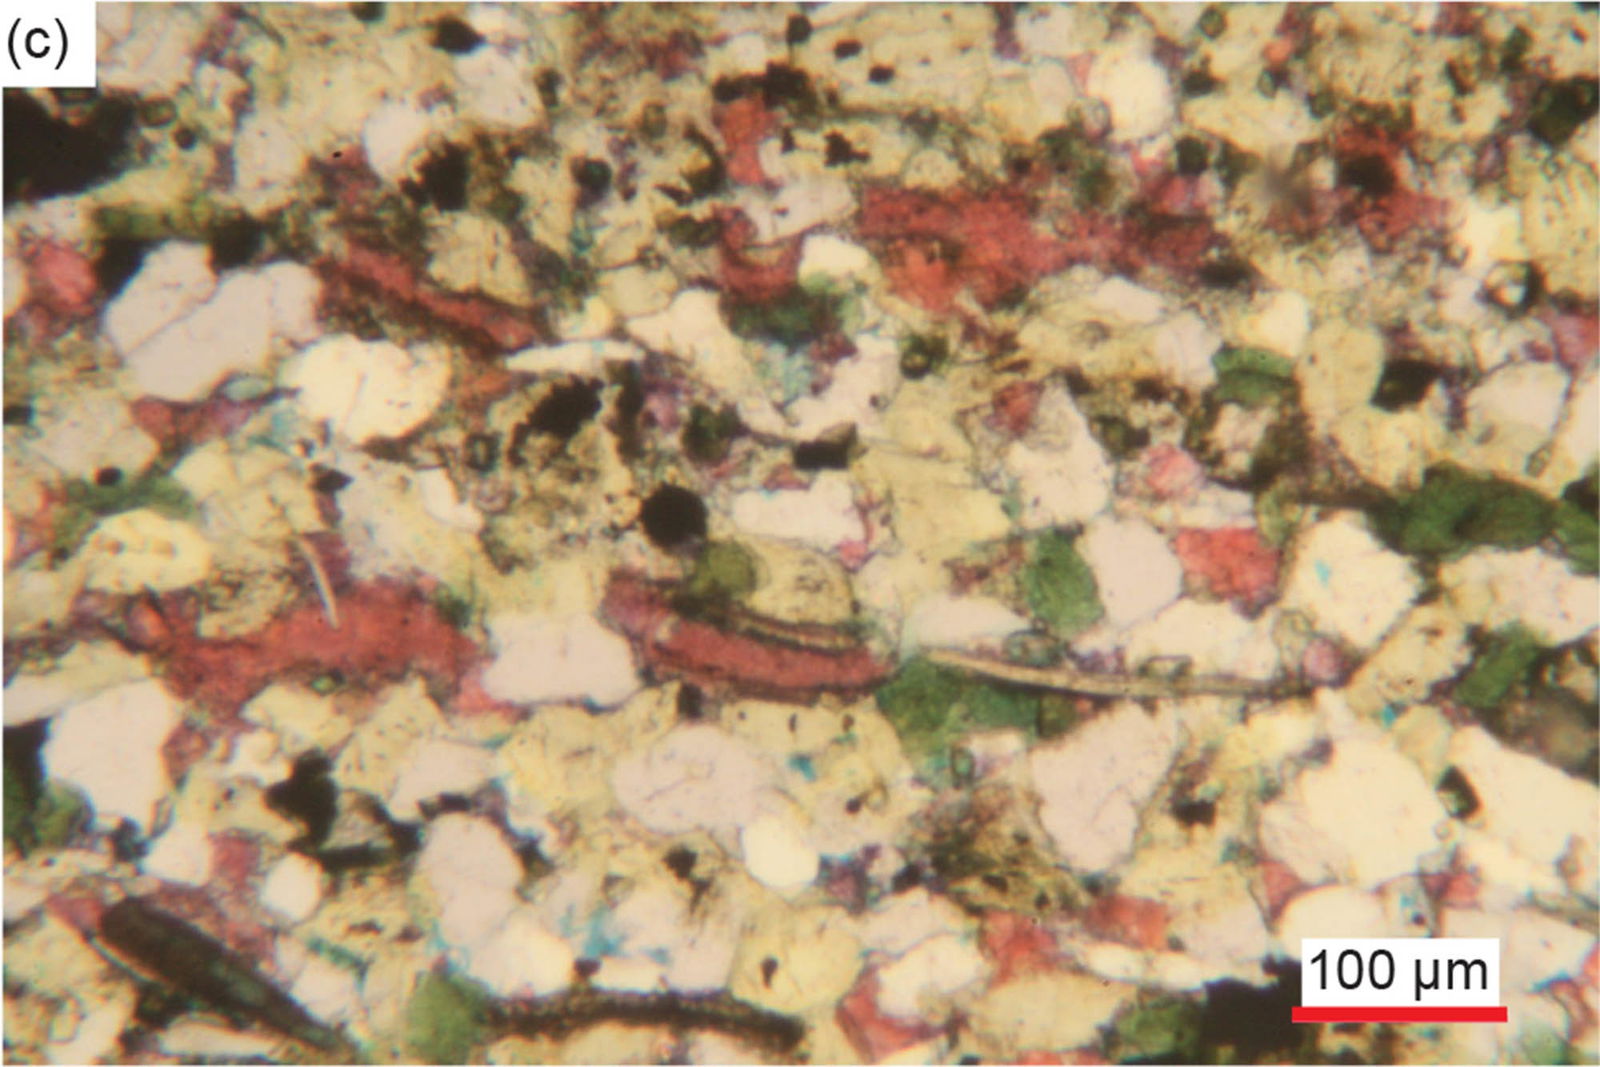
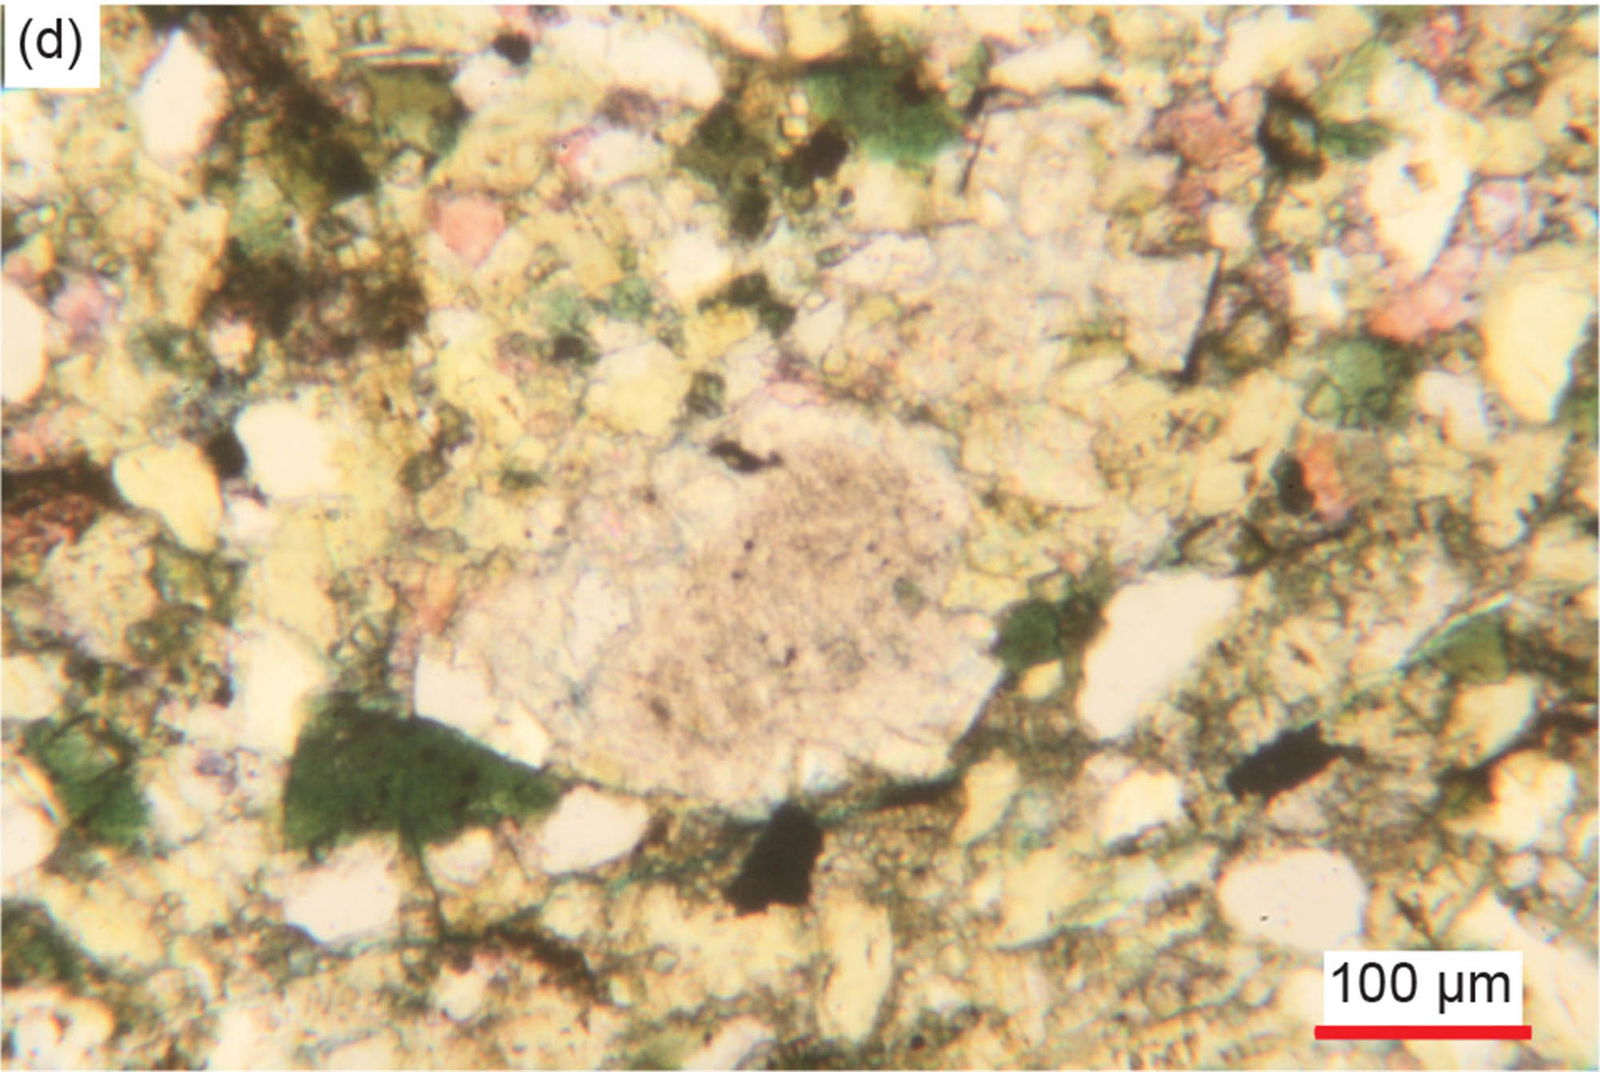
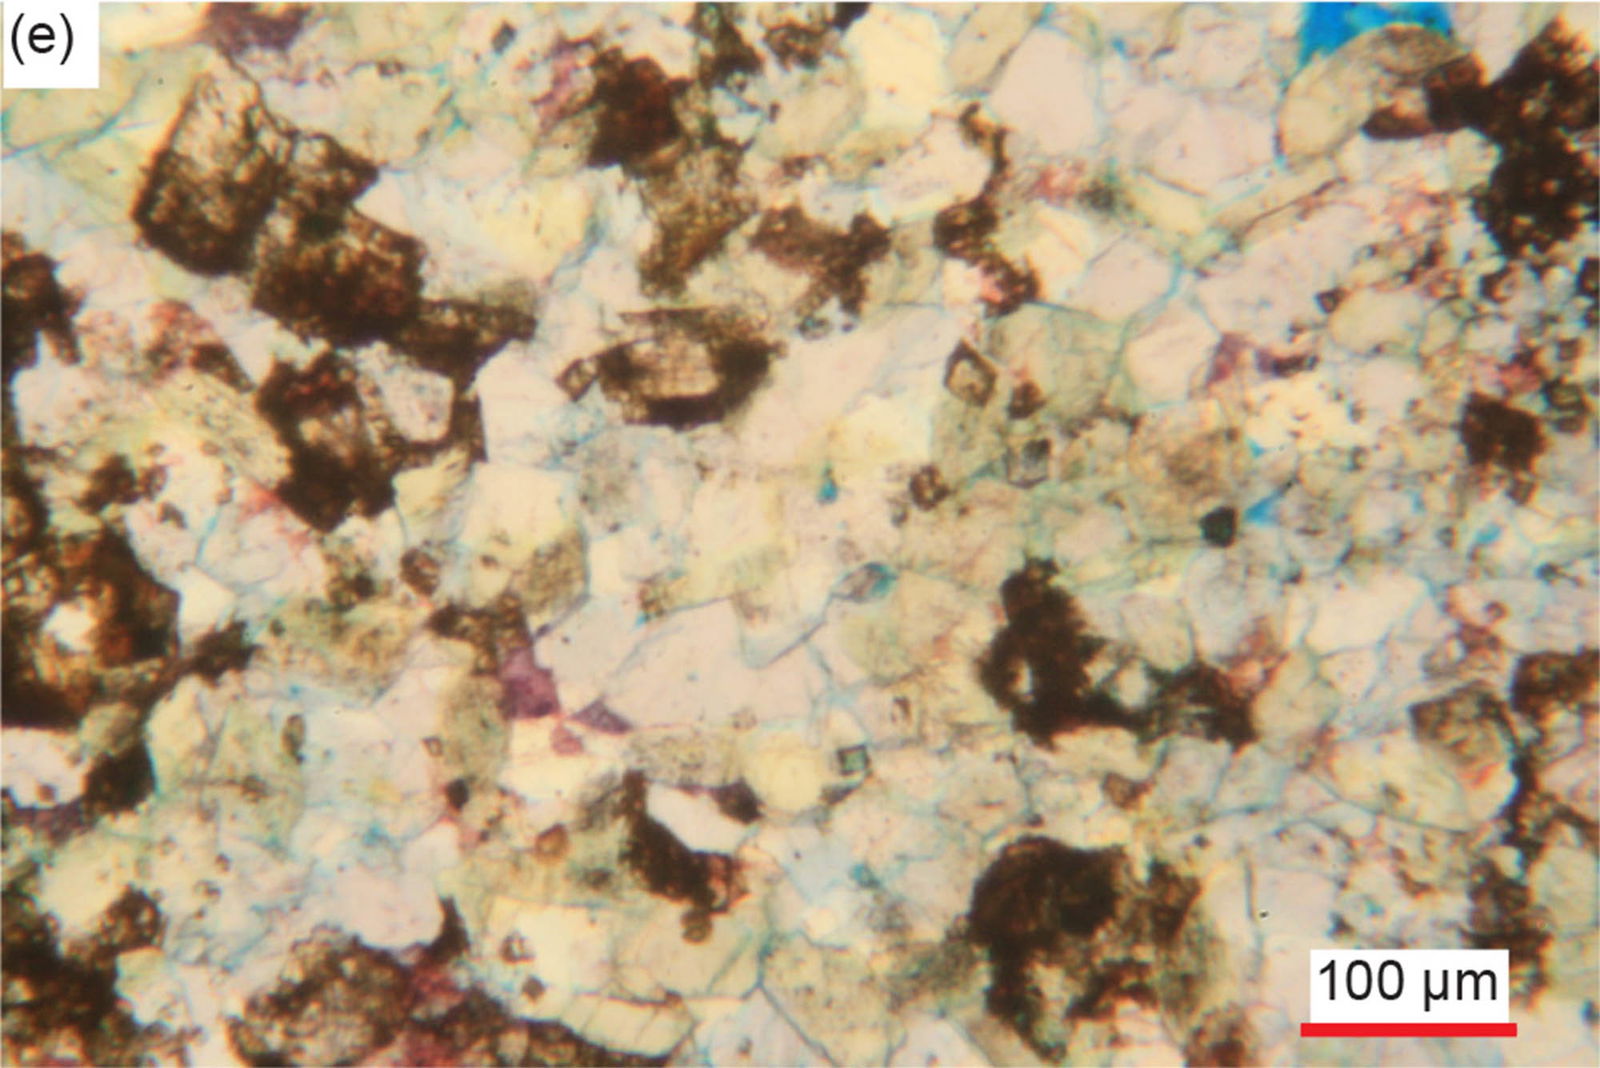
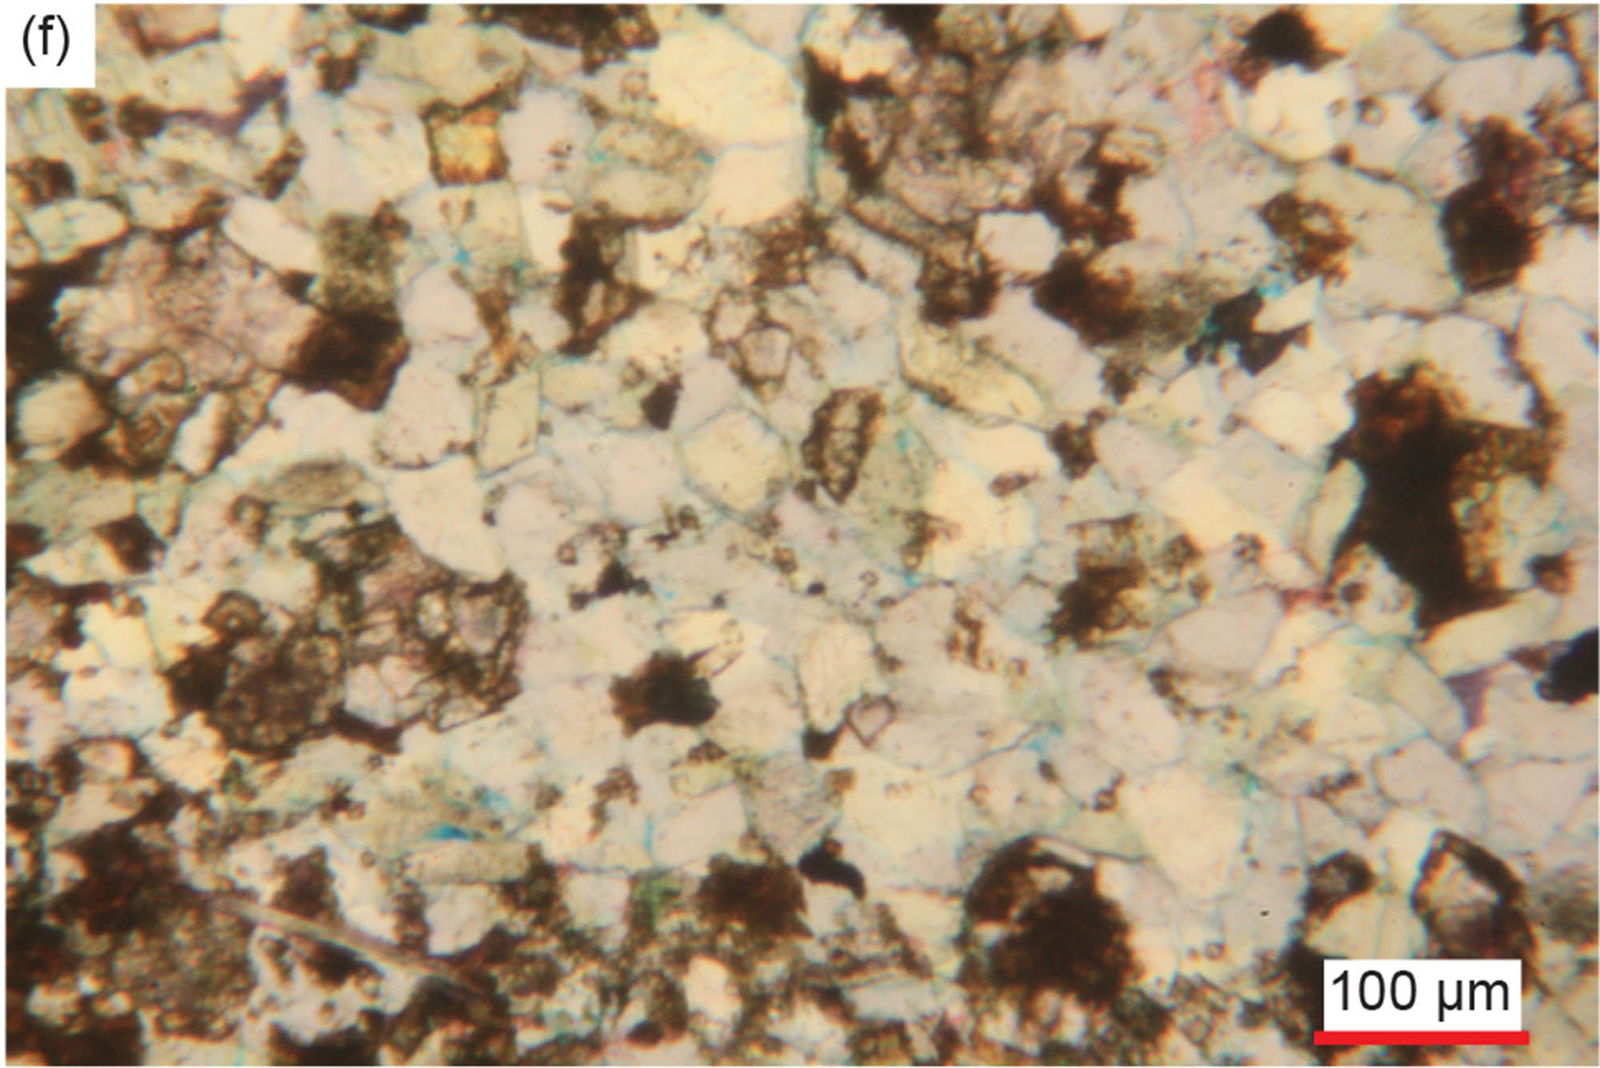
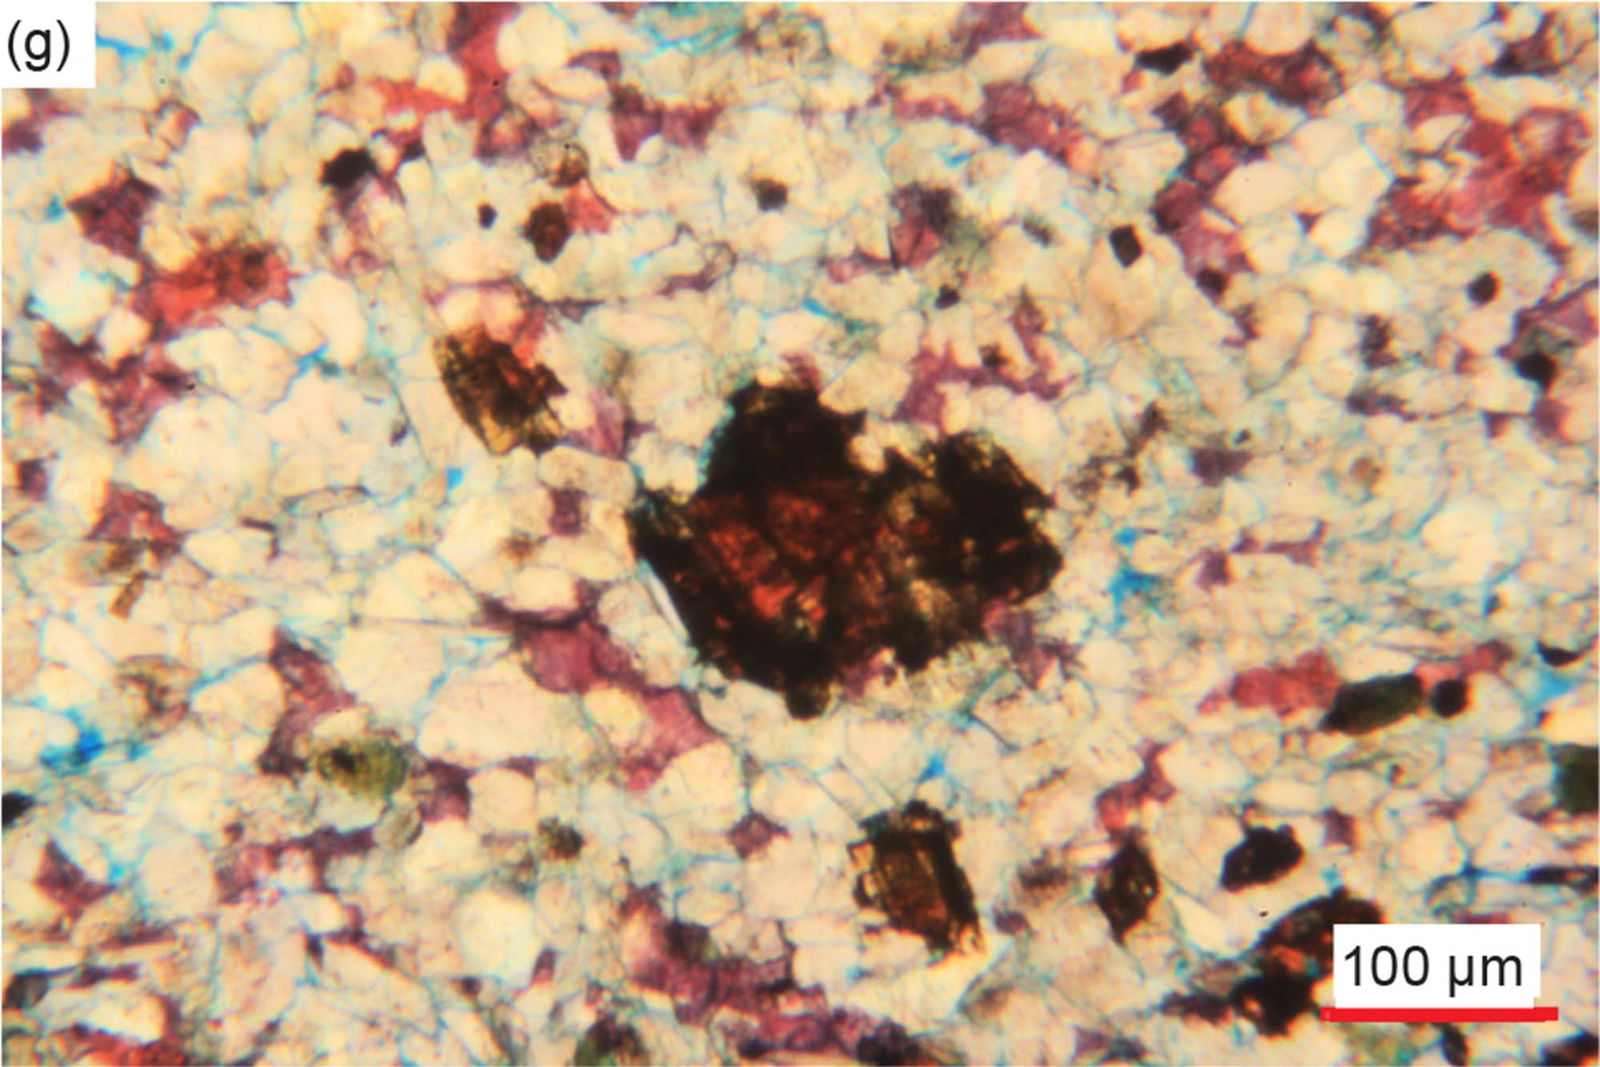
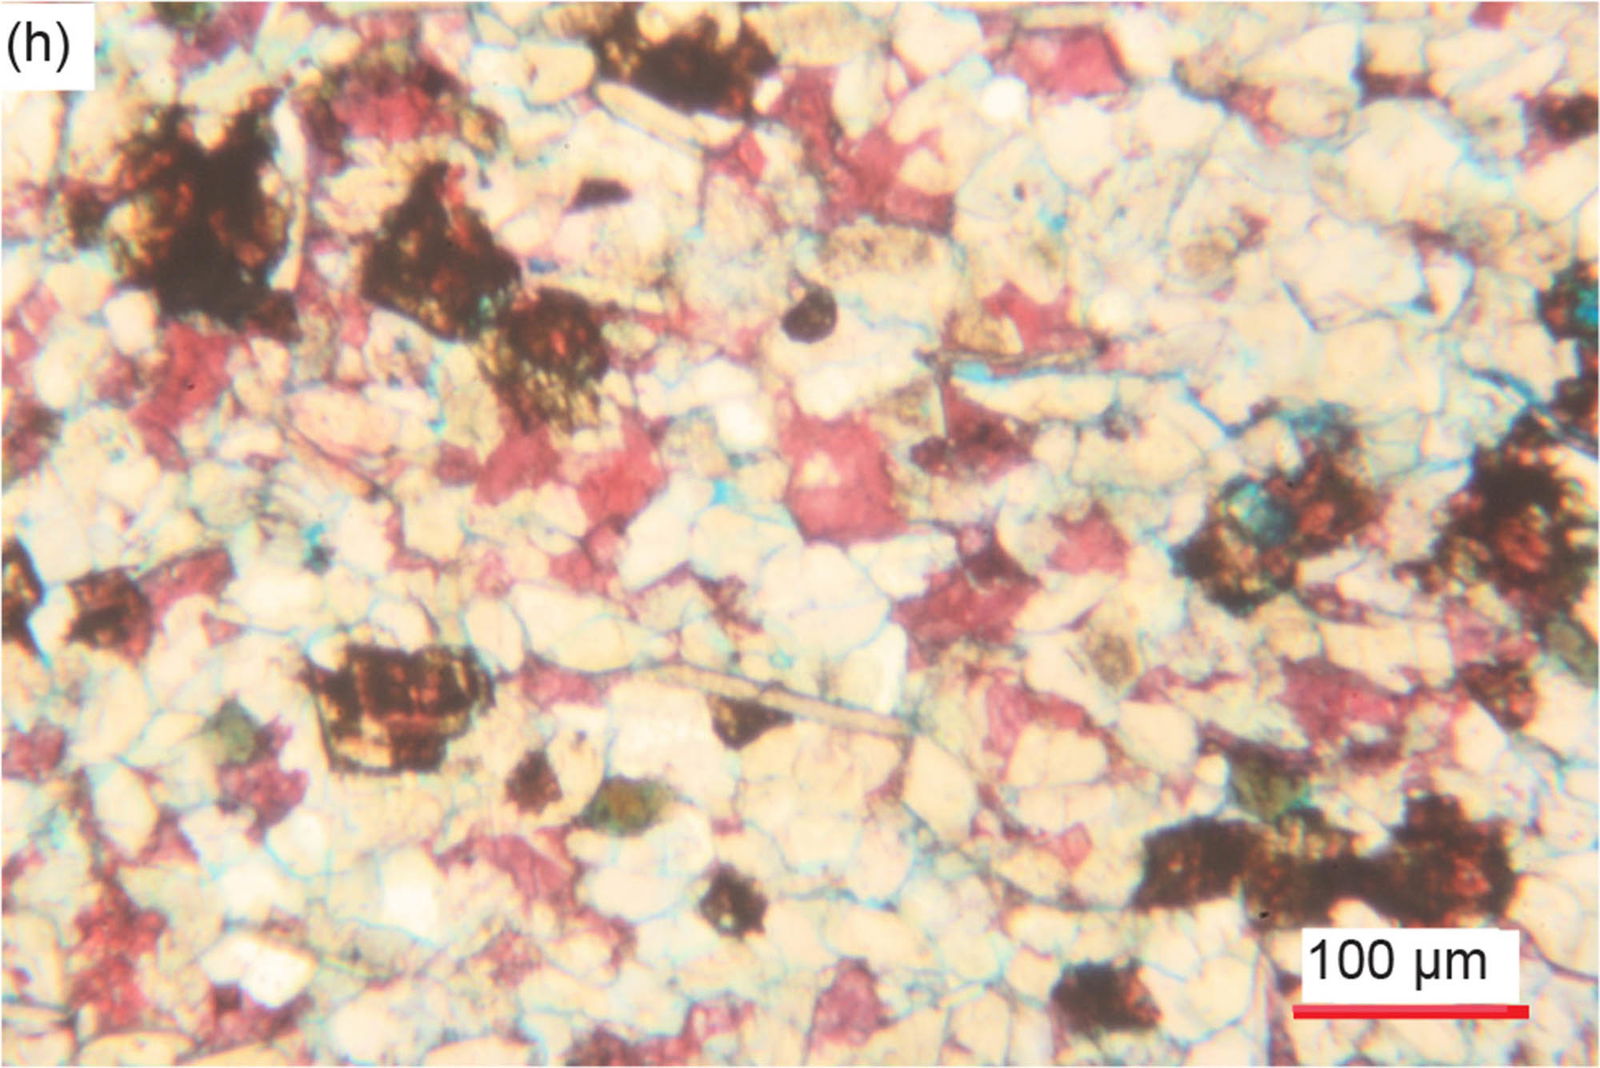
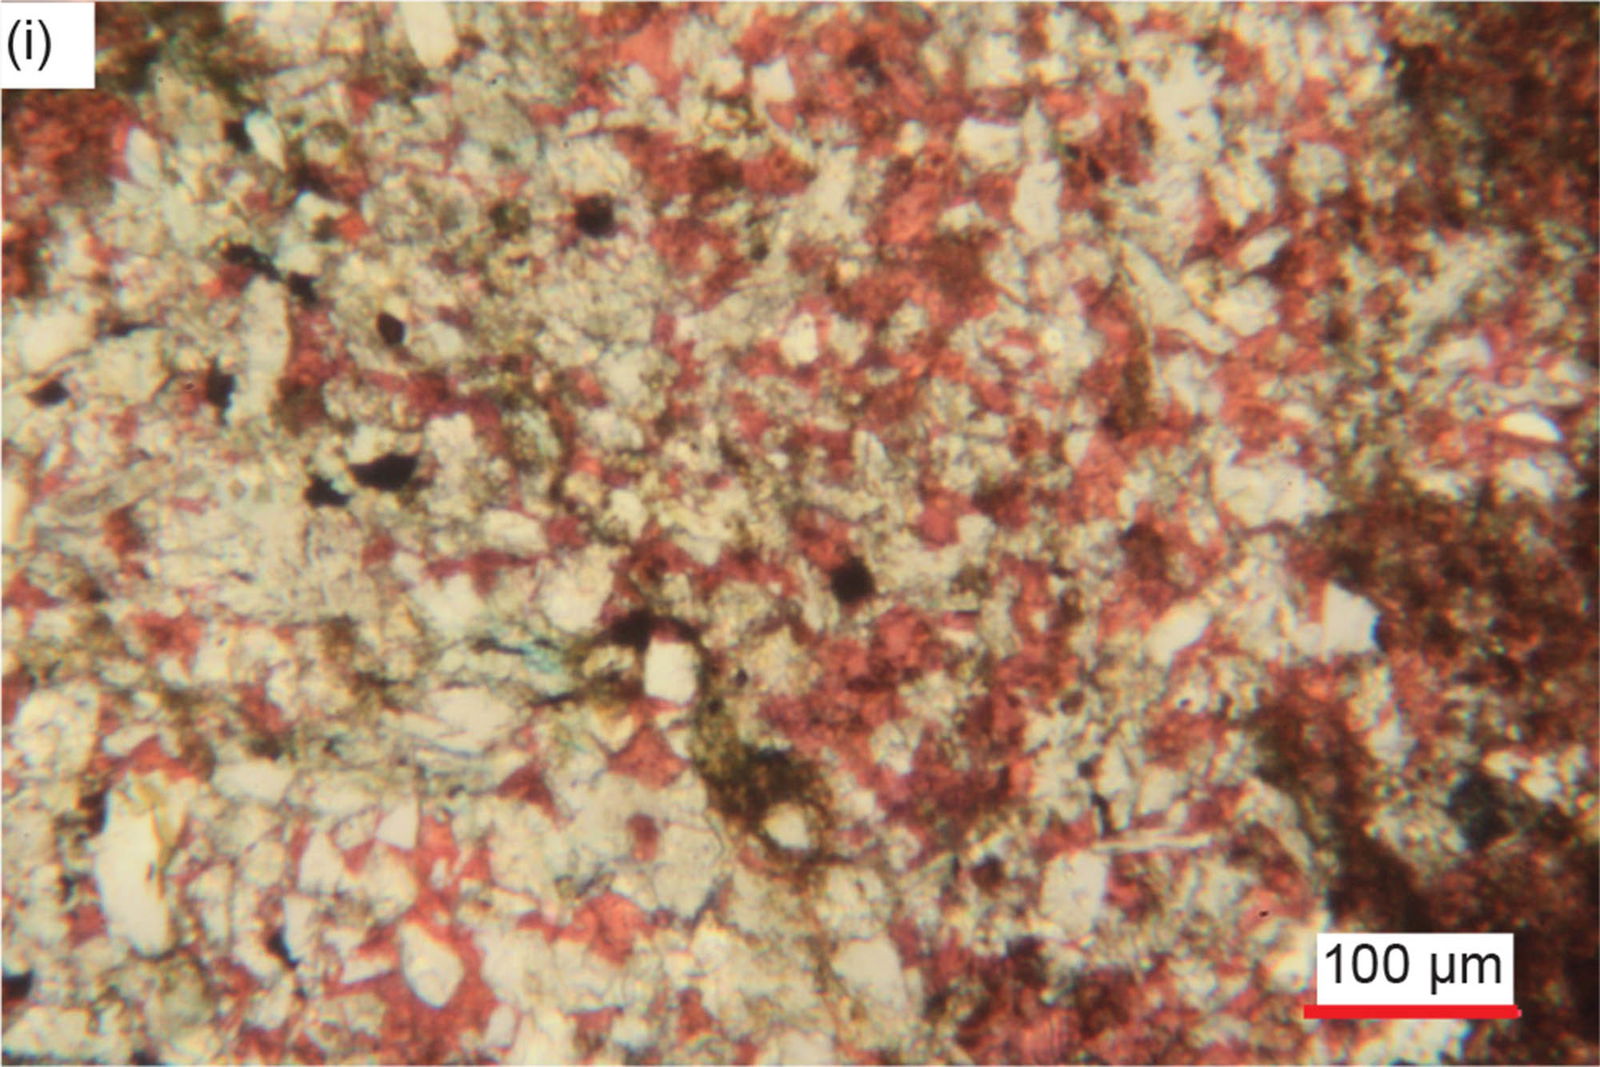
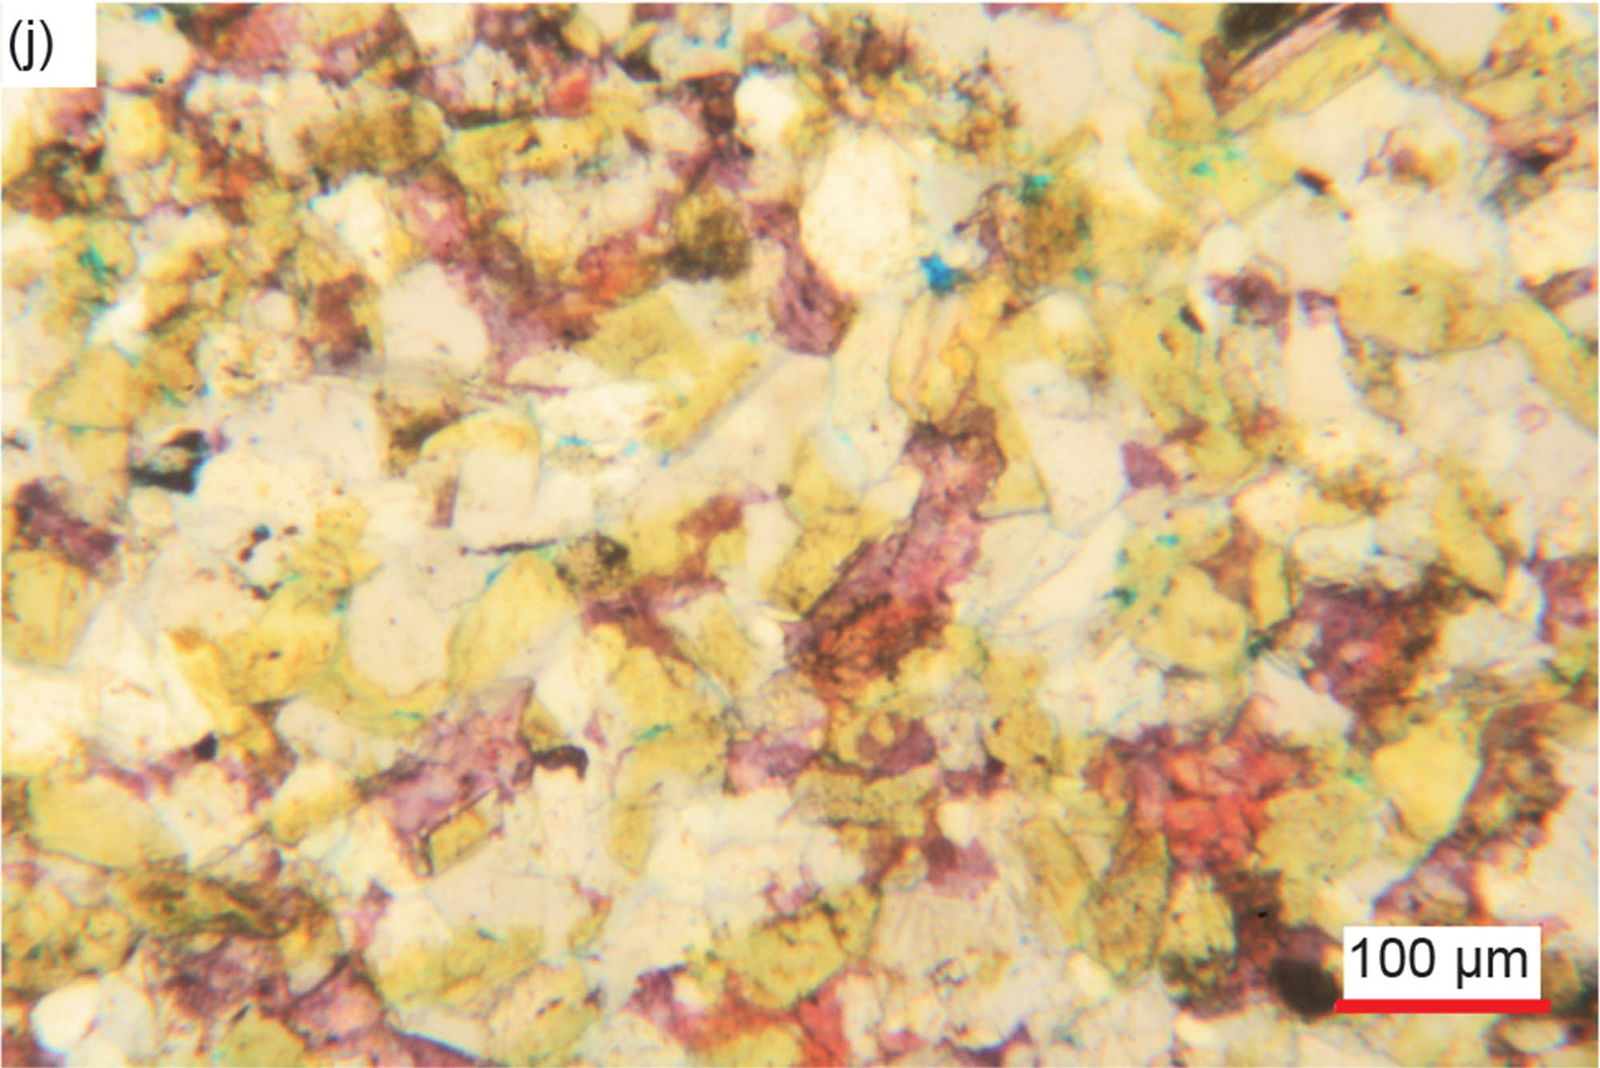
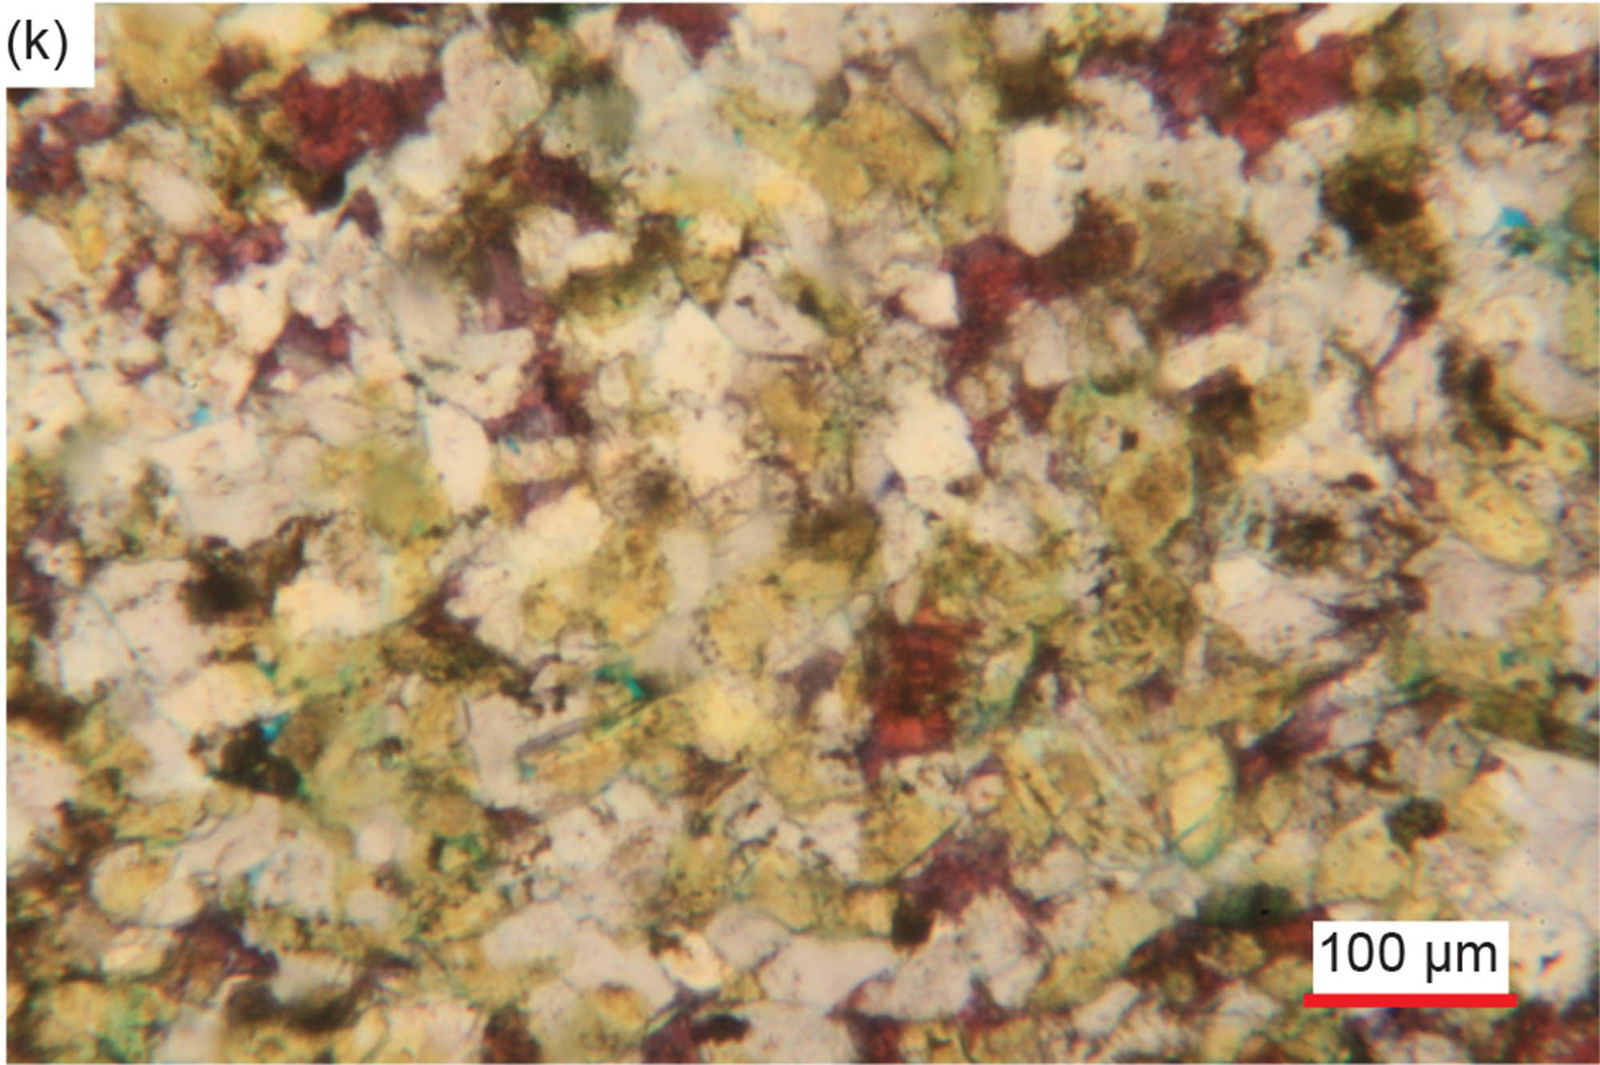
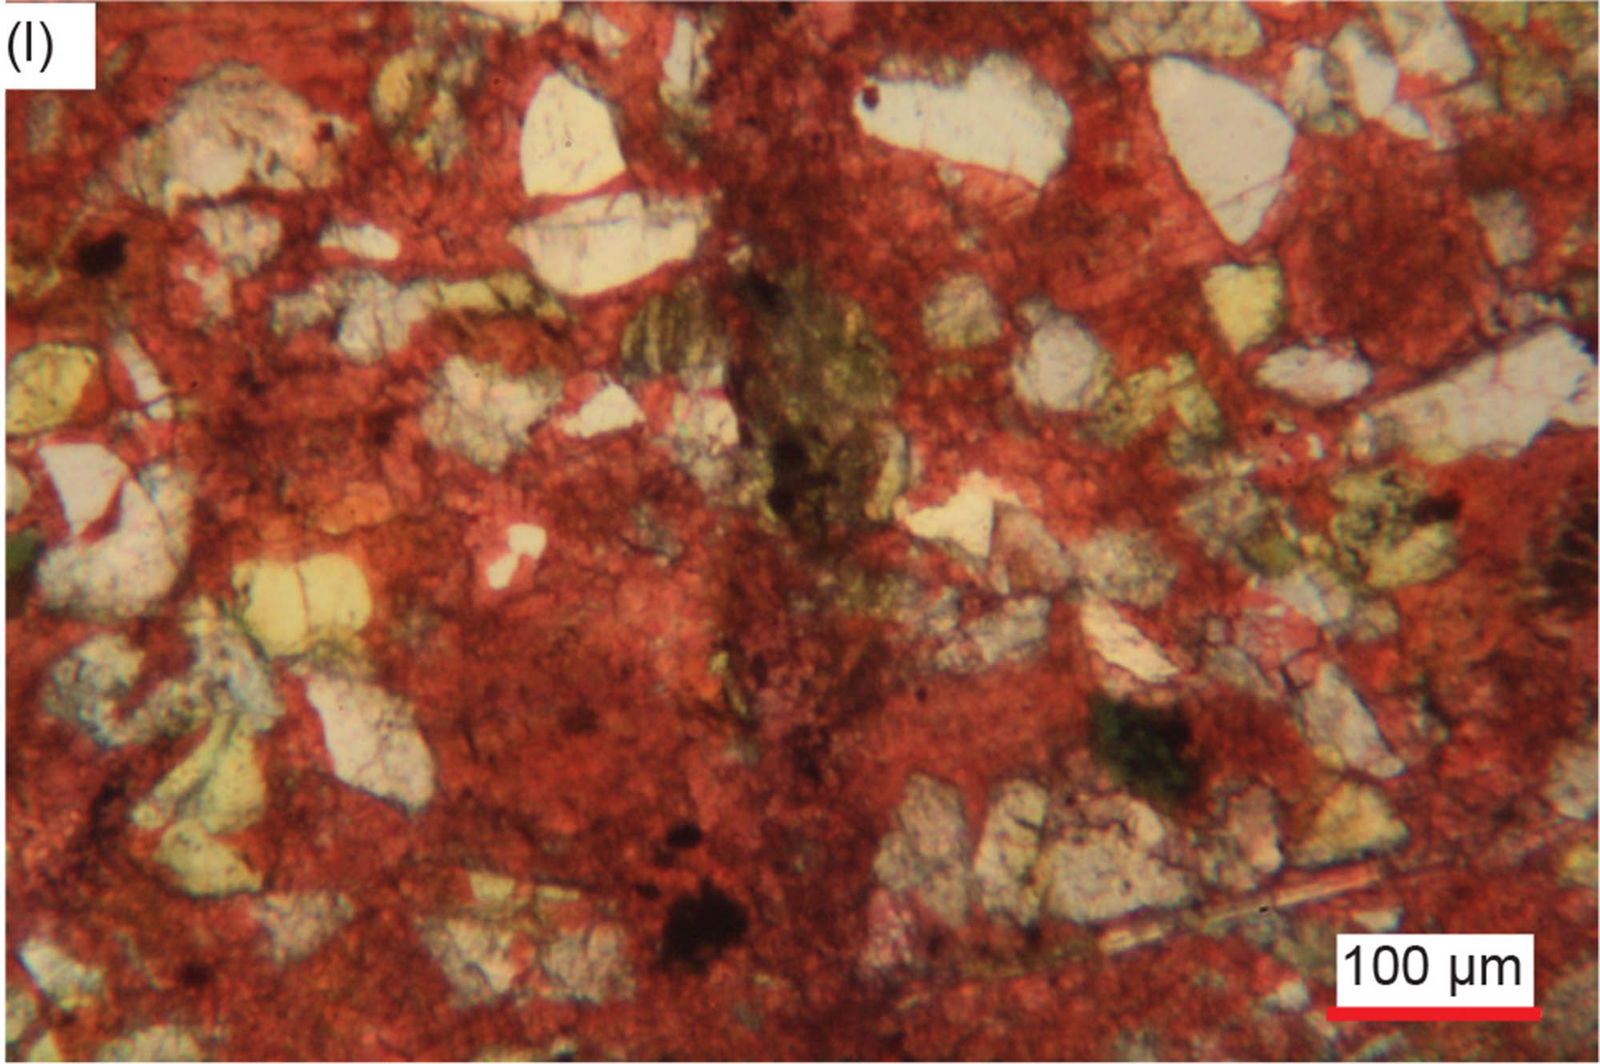

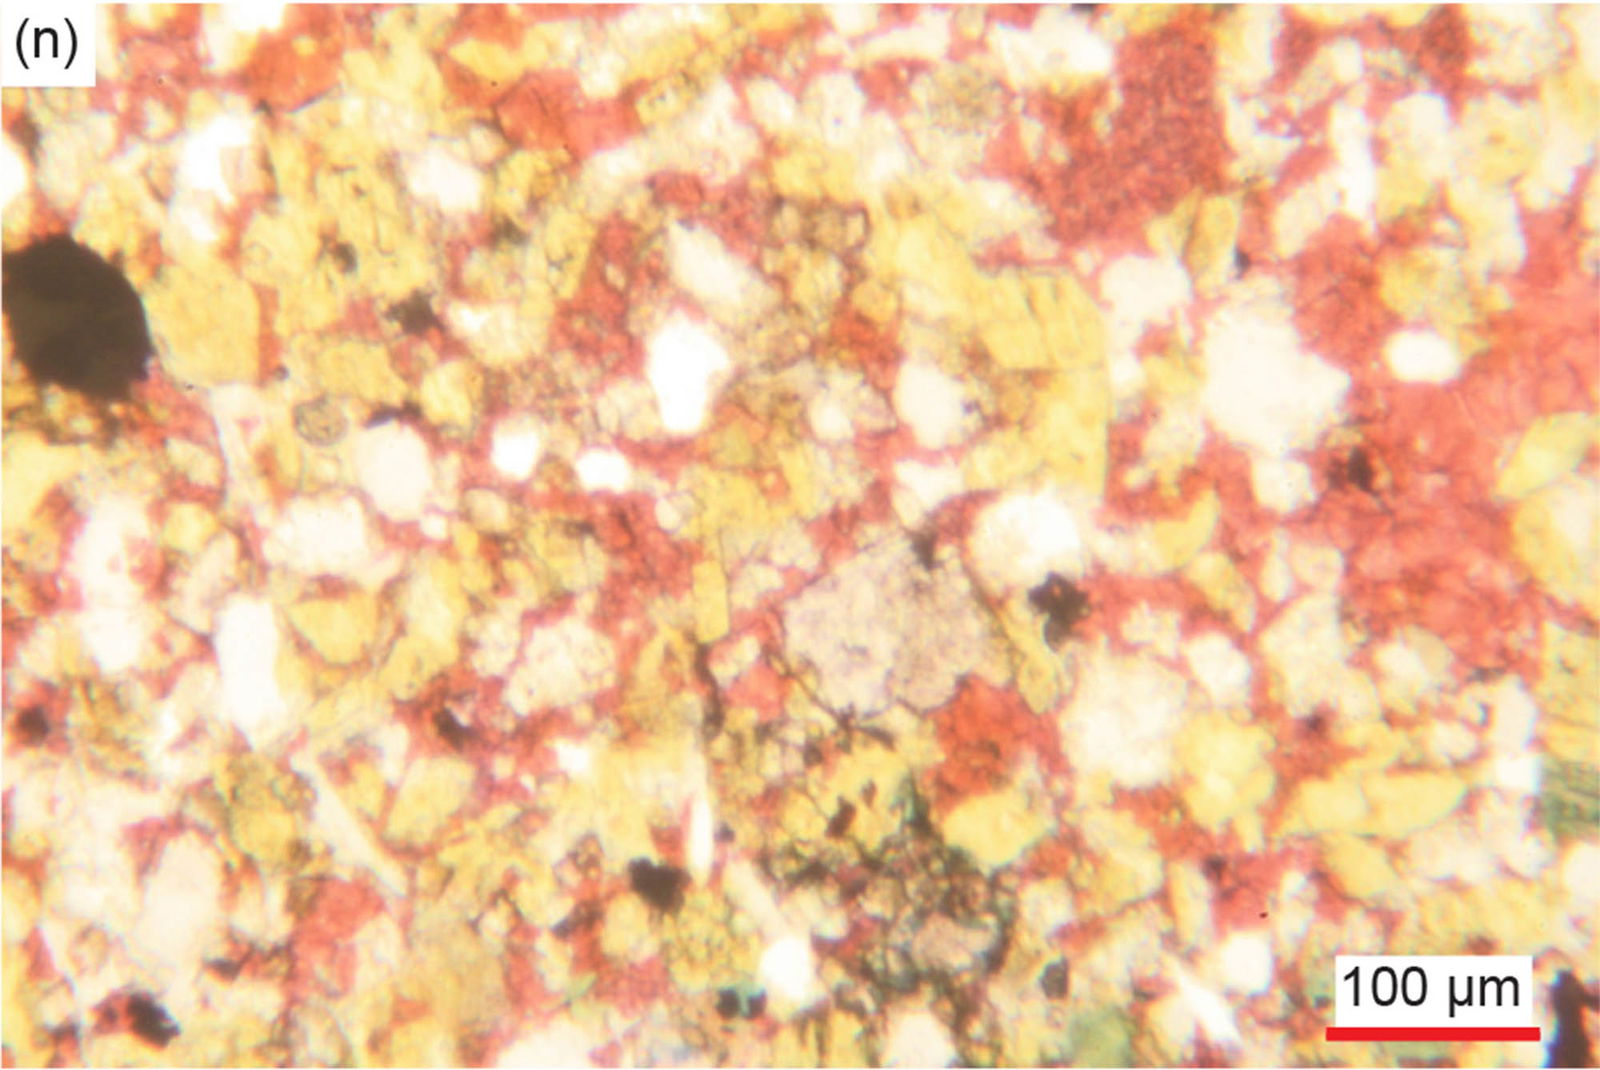
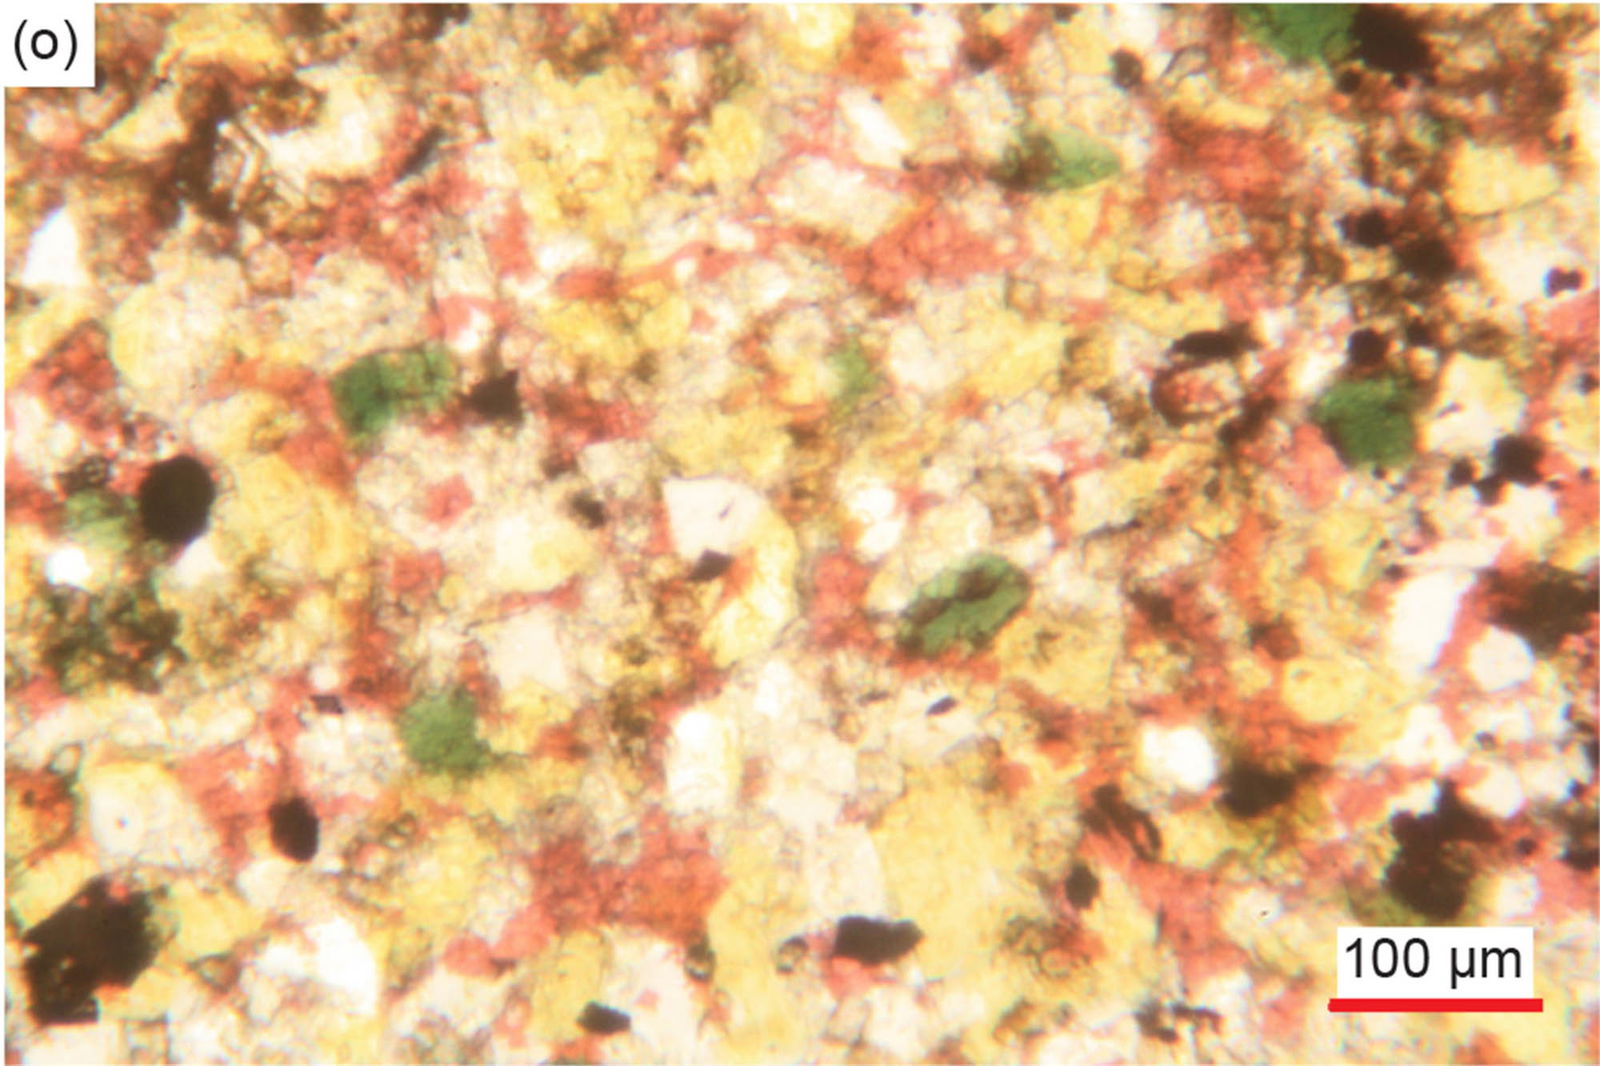
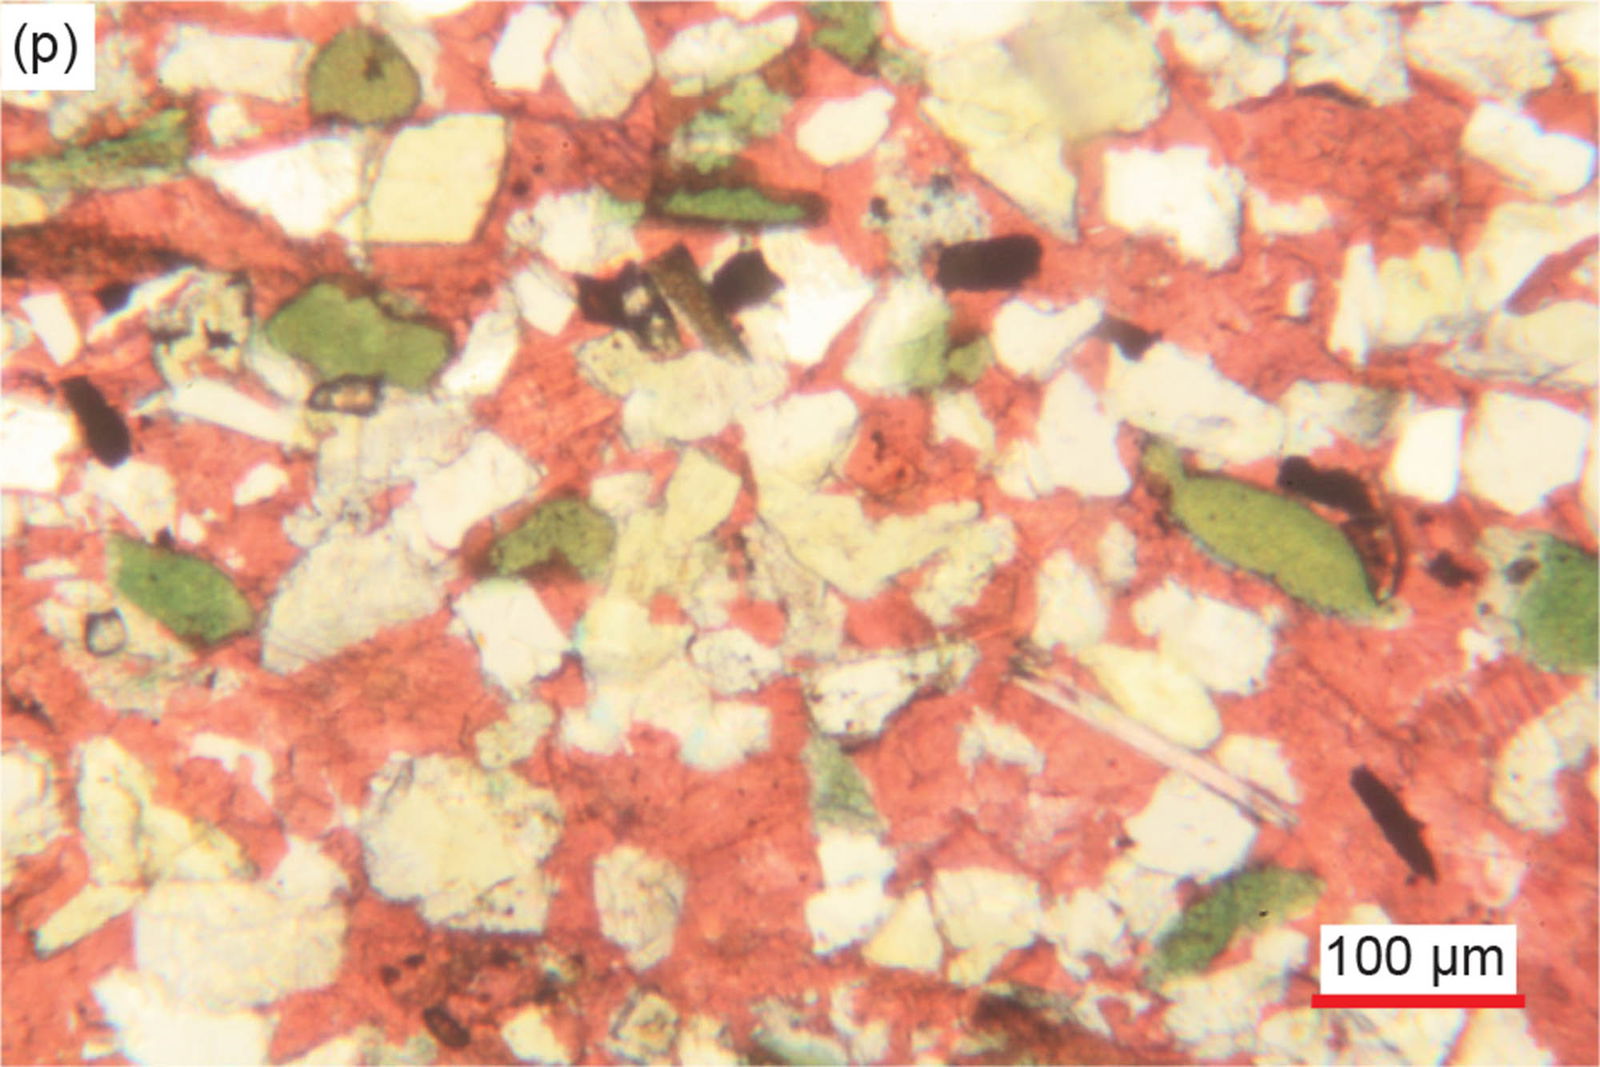
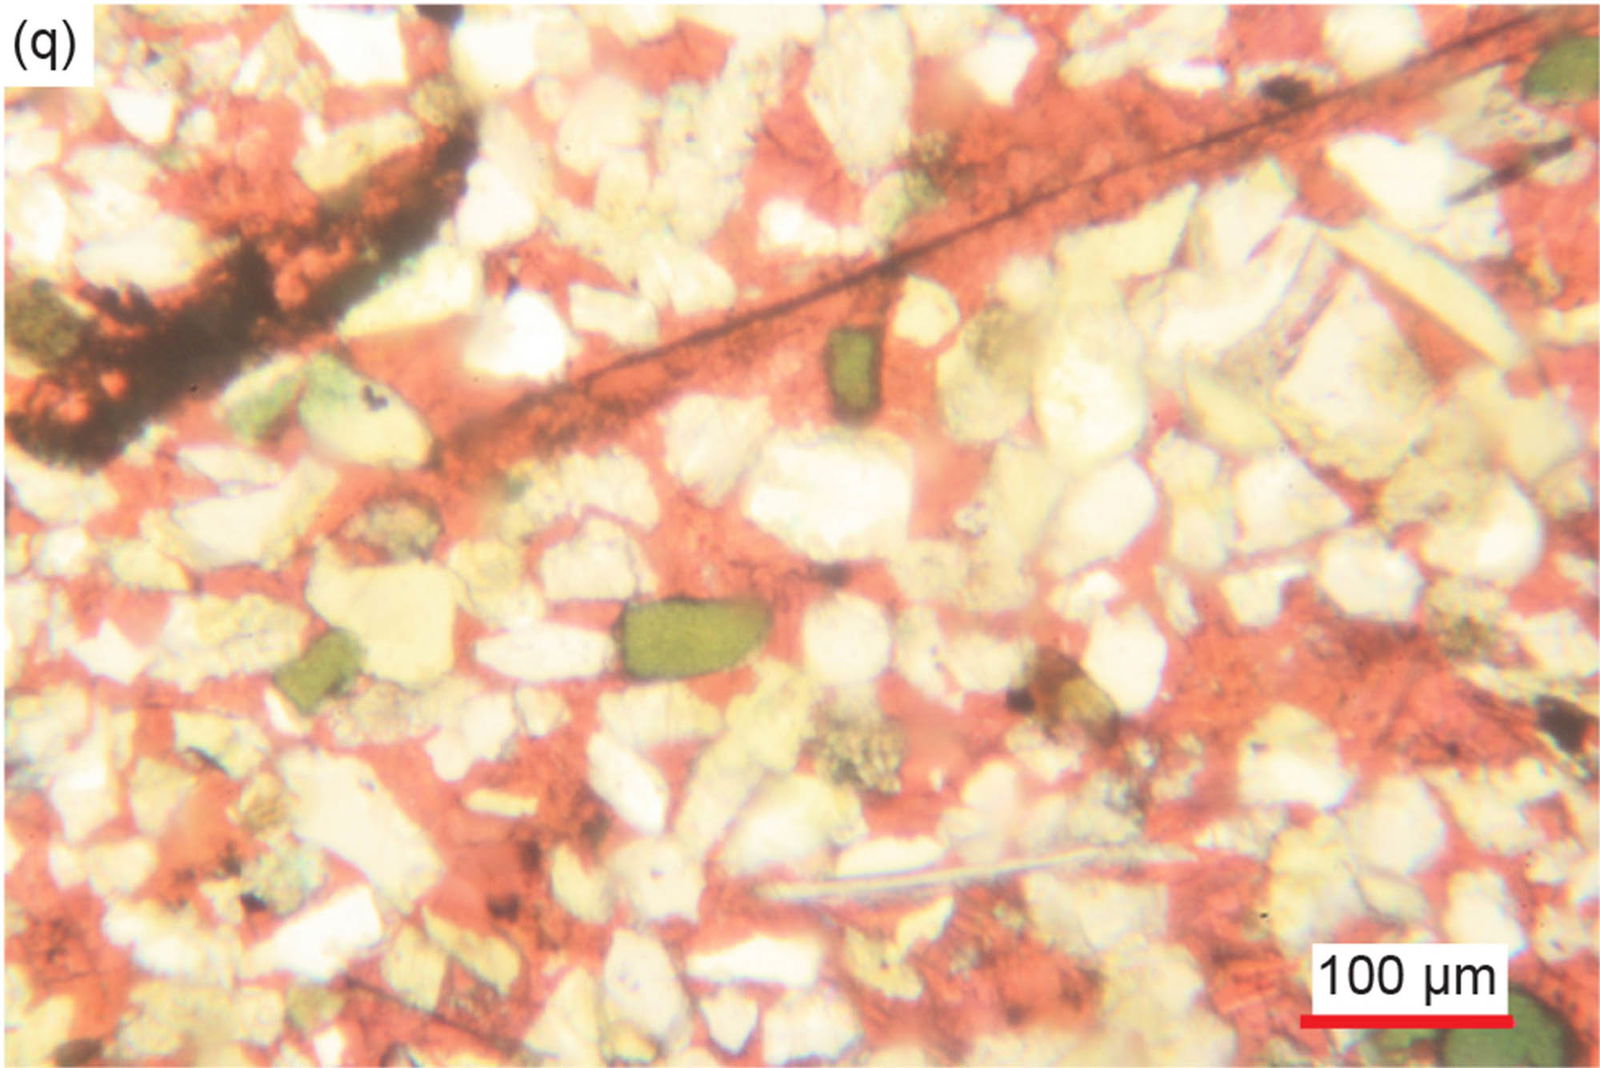
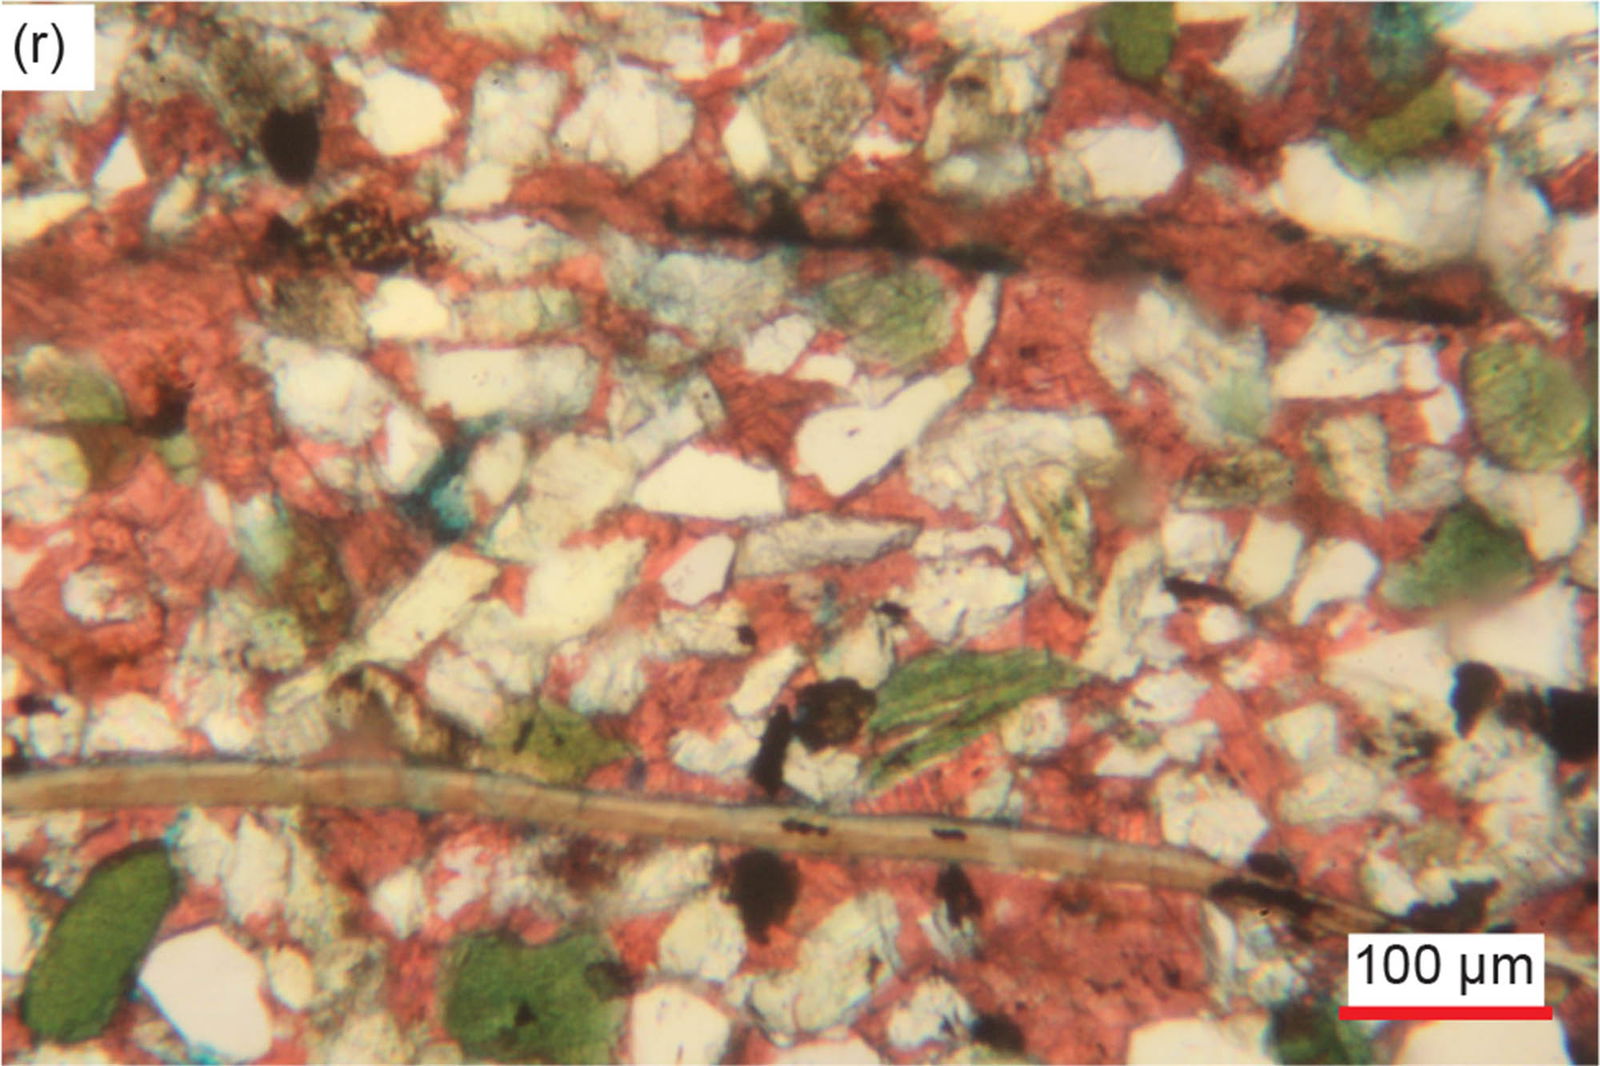
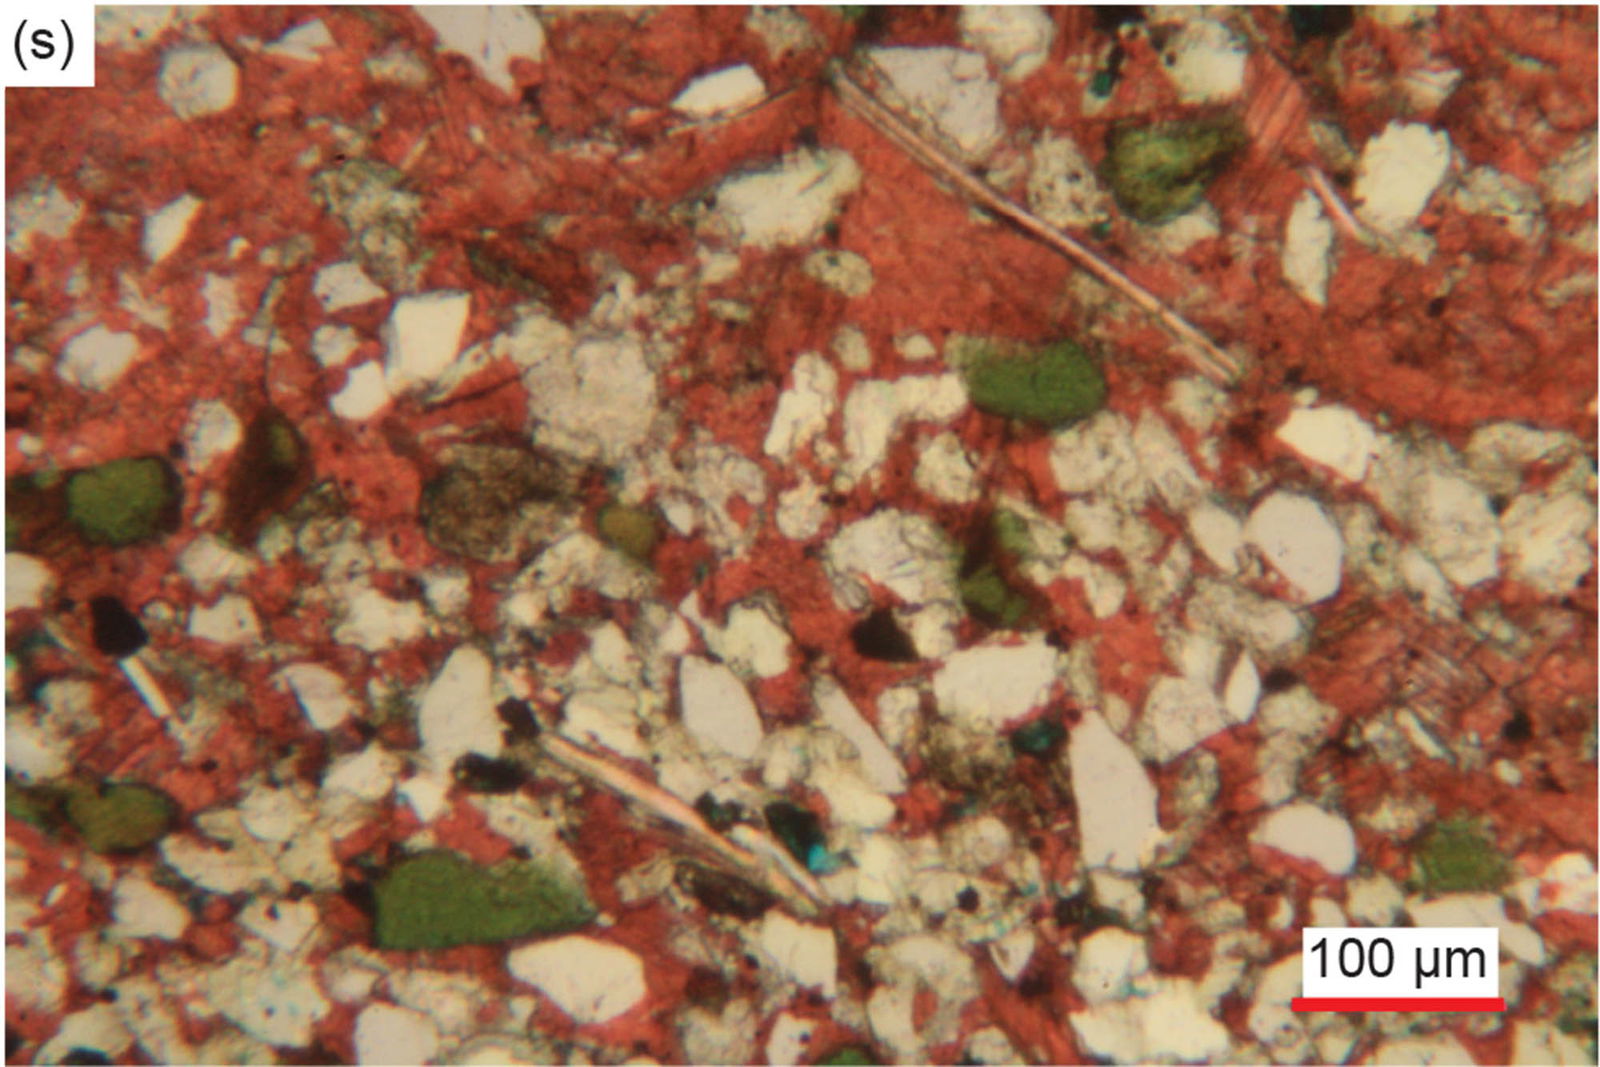
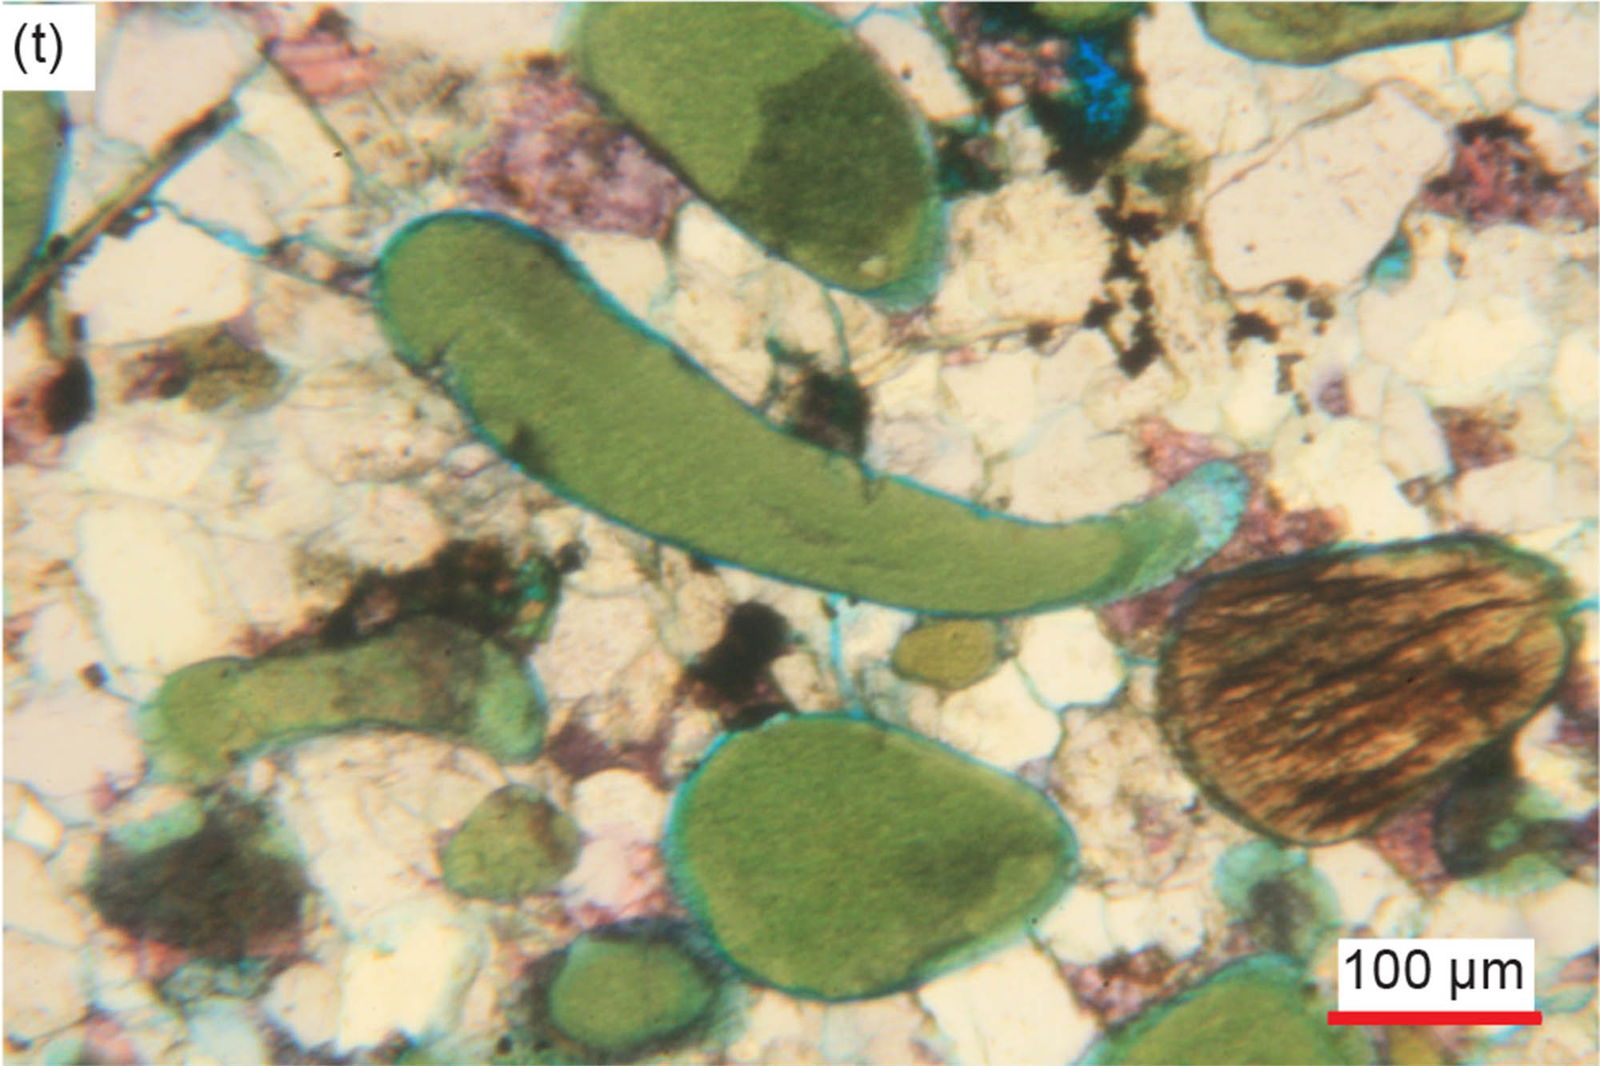
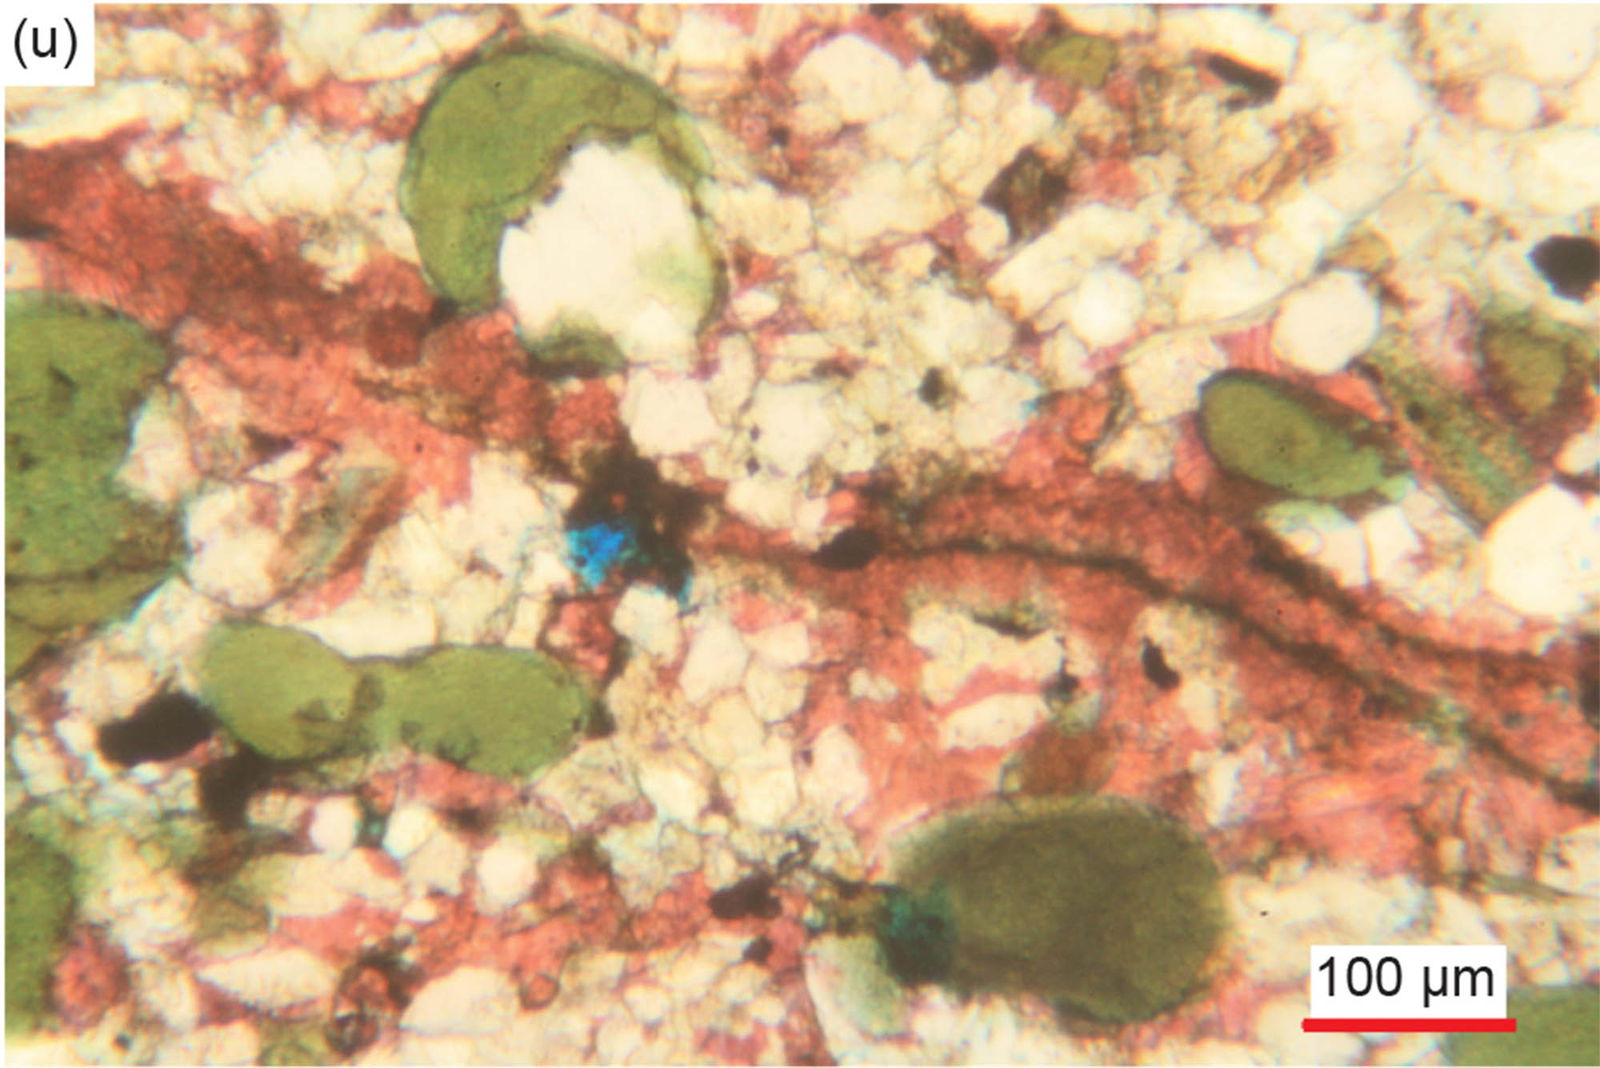
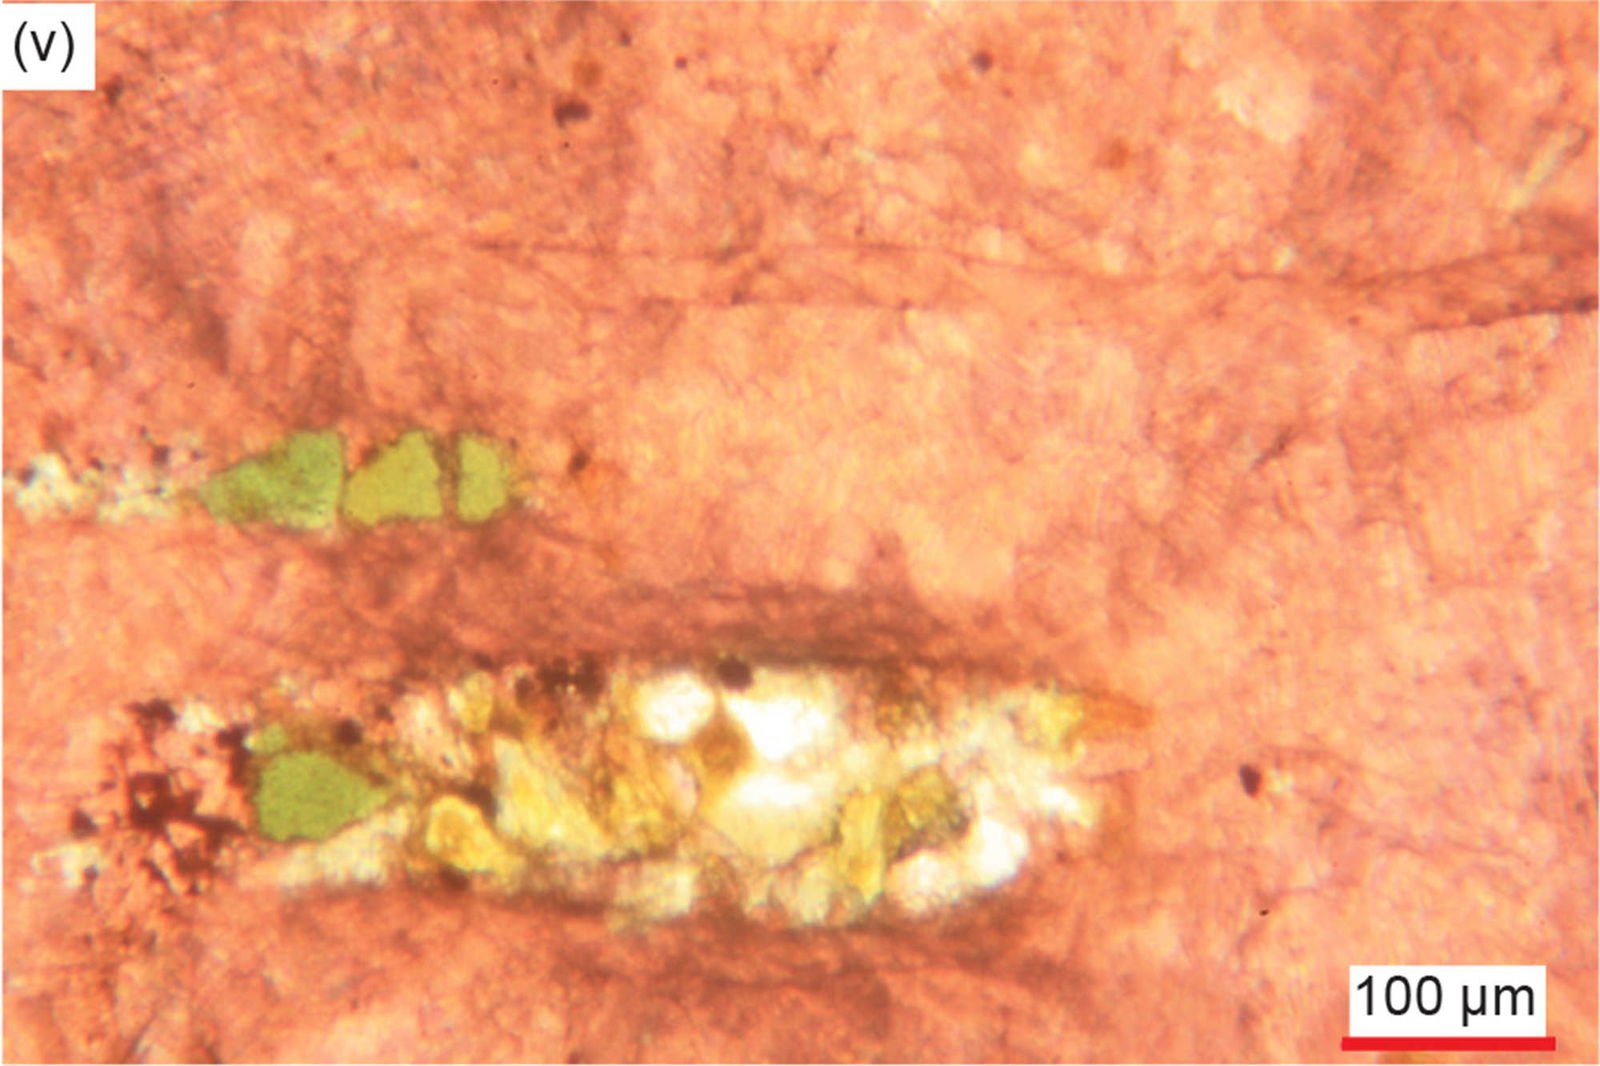
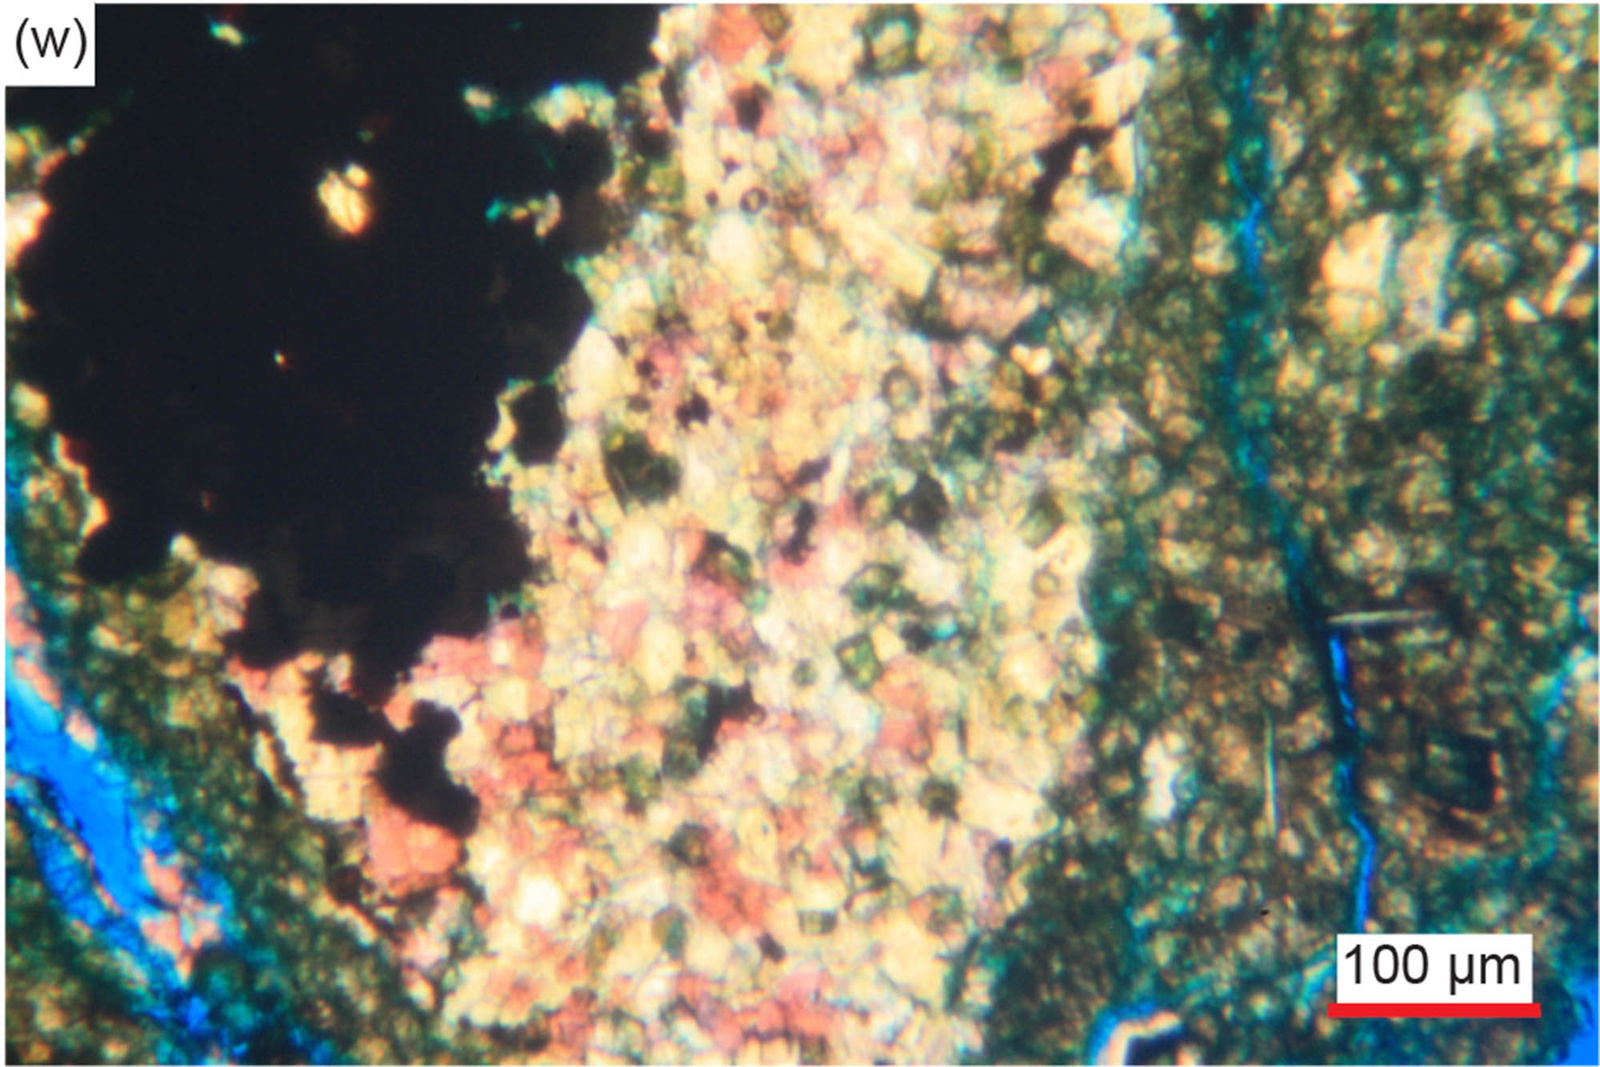
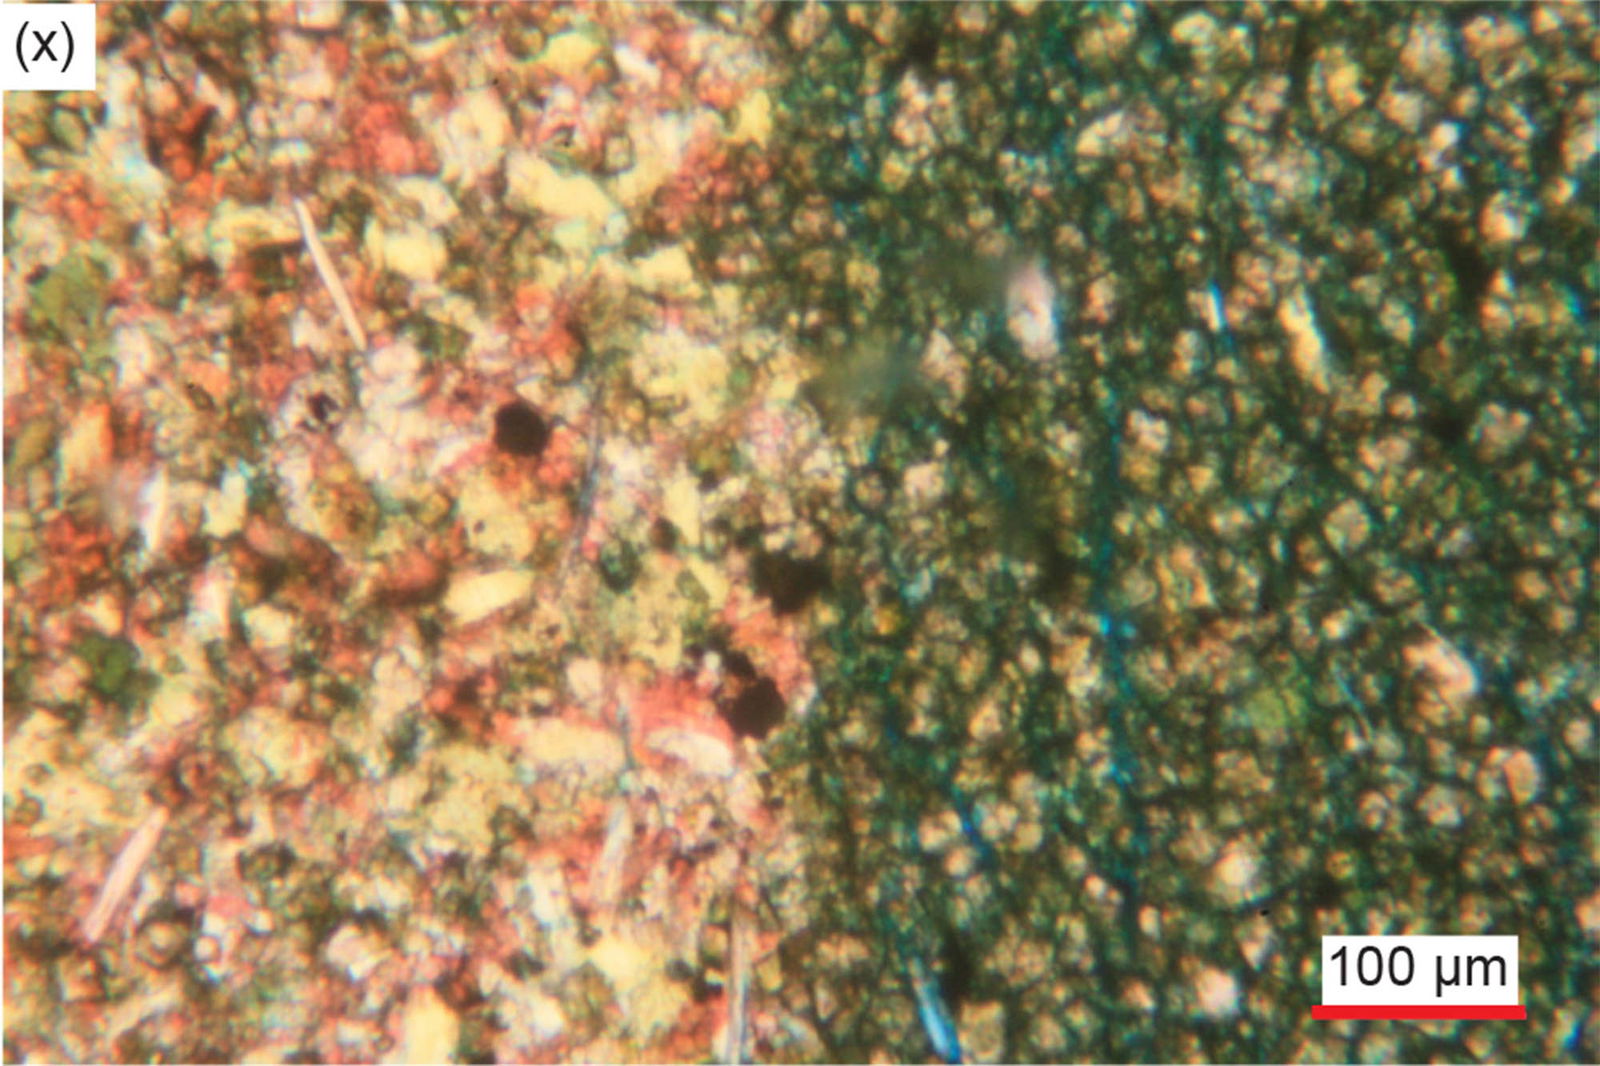
Fig. 26. A representative set of photomicrographs at various scales (as indicated) showing the quartz grains meeting at triple points within the Muav Formation samples. Distal samples: (a) MLS-02, and (b) MLS-03. Matkatamiba fold samples: (c), (d) MFML-01, (e), (f) MFML-02, (g), (h) MFML-03, (i) MFML-04, (j), (k) MFML-05, (l), (m) MFML-06, (n), (o) MFTB-01, (p), (q) MFTB-02, (r), (s) MFTB-03, (t), (u) MFTB-04, (v) MFTB-05, and (w), (x) MFTB-06.
Almost all the quartz grains display uniform extinction under crossed polars (fig. 27). The quartz grains generally do not show signs of any undulose extinction under crossed polars, nor are any deformation lamellae or deformation kink bands present. Admittedly the size of the quartz grains can make it difficult to assess them, but where there might be an appearance of slightly undulose extinction, it could be an artifact in the original quartz grains of the source rocks. They were probably derived from the metamorphic schists below the Great Unconformity, any slight undulose extinction being then retained unchanged in these deposited clasts. On the other hand, there is no indication or even any hint of any deformation lamellae or deformation kink bands in any of the quartz grains in these samples, including the samples from the hinge zones of the fold.
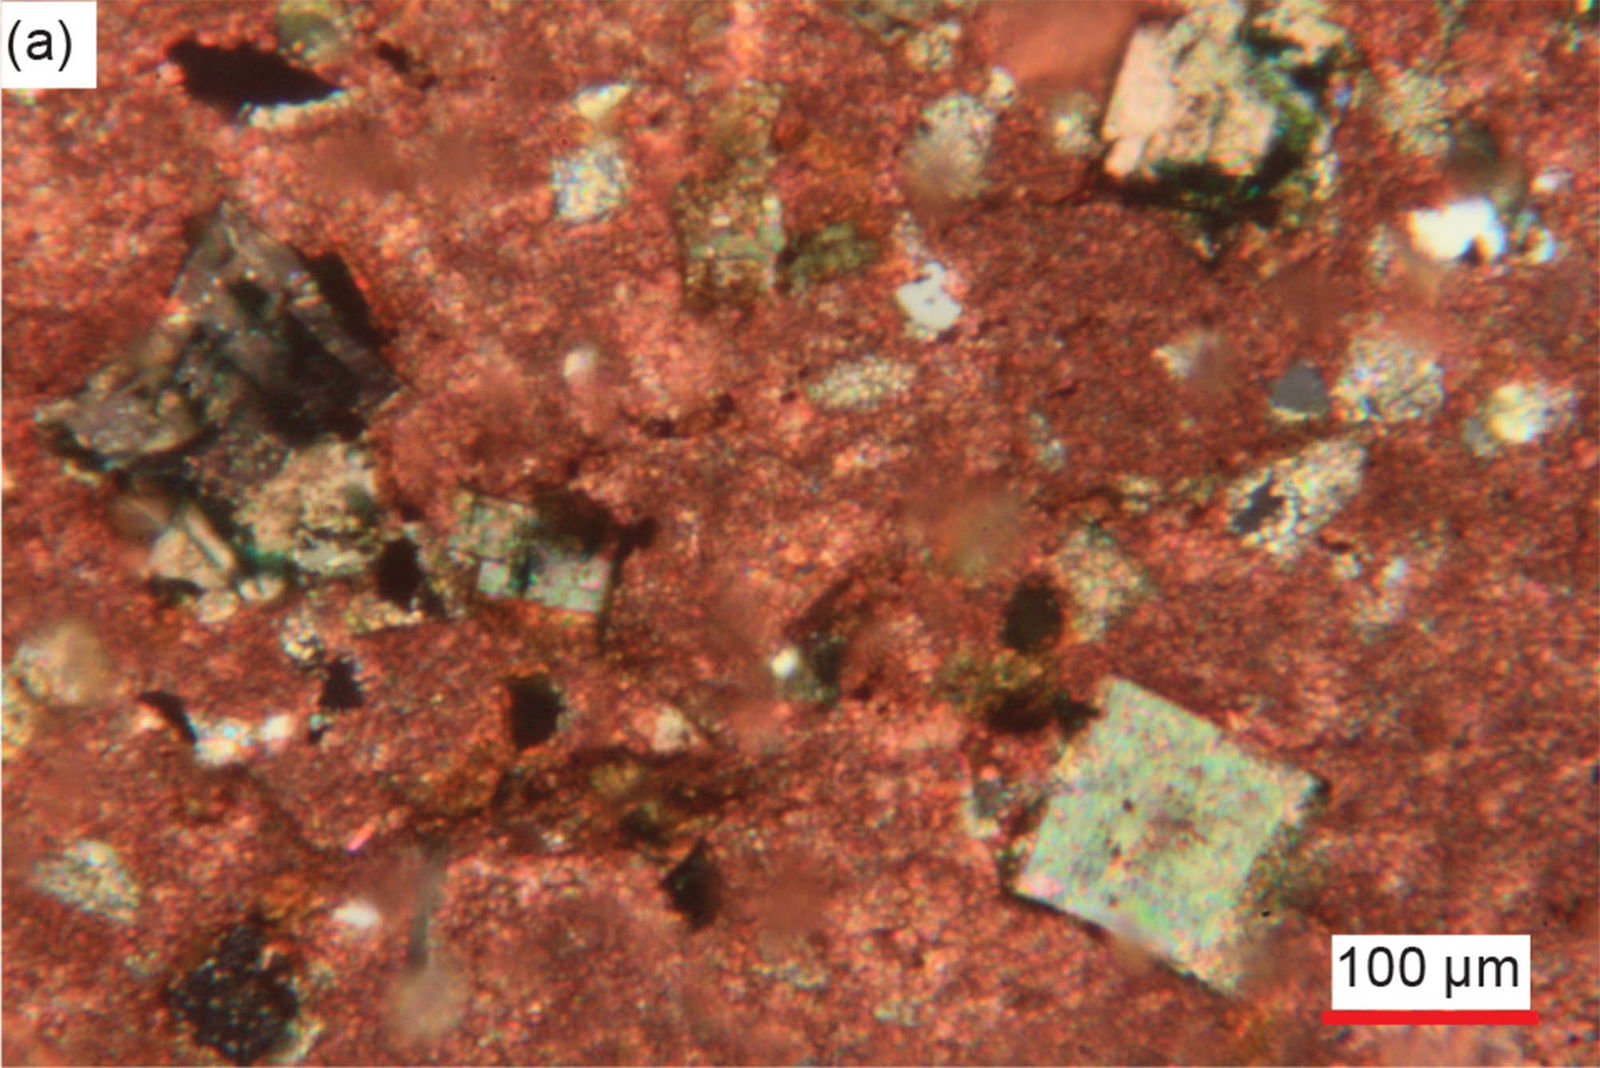
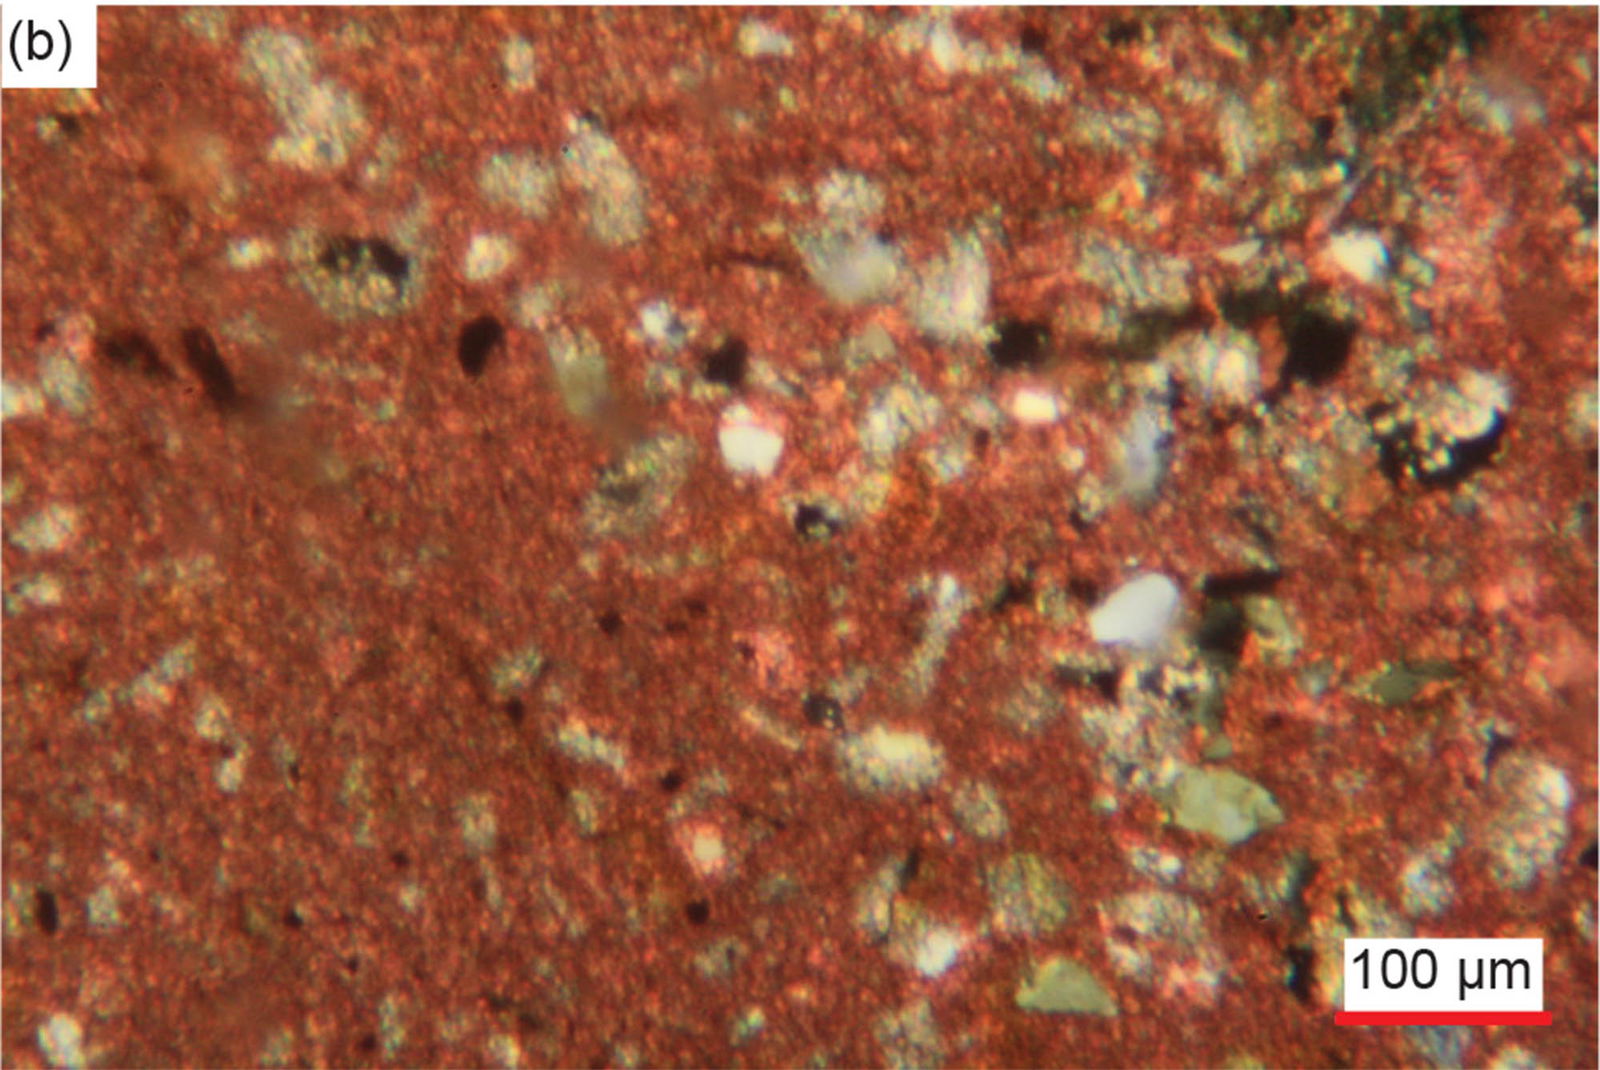
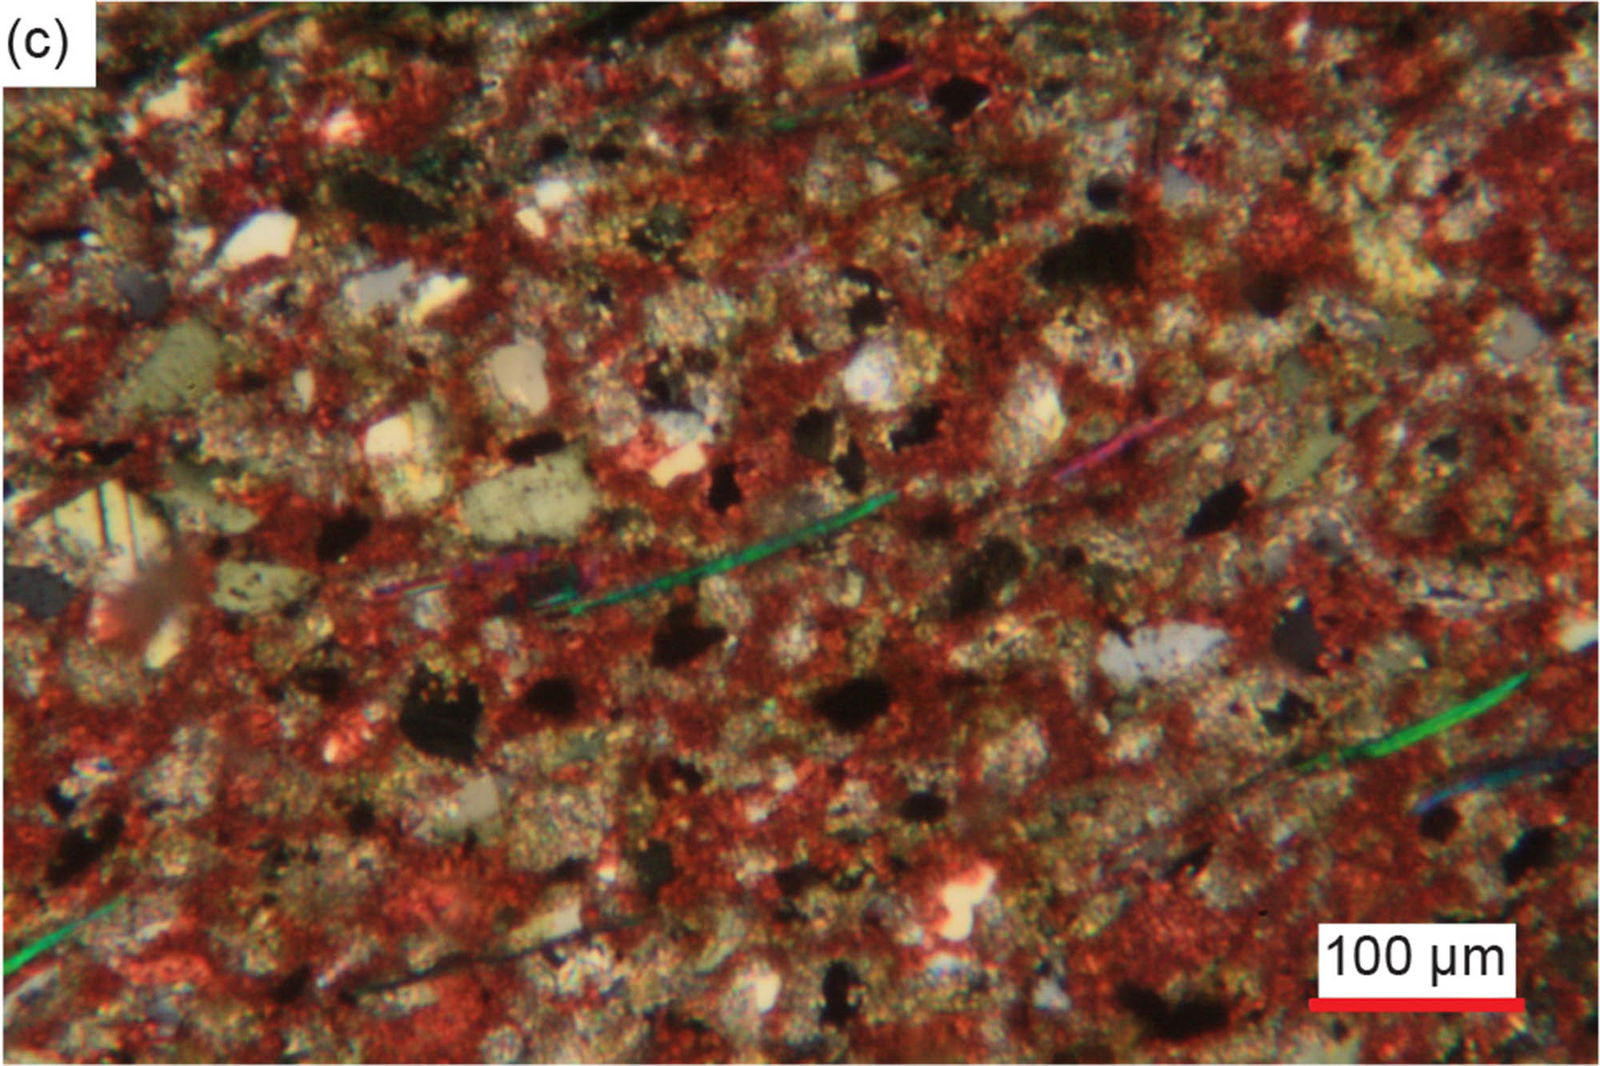
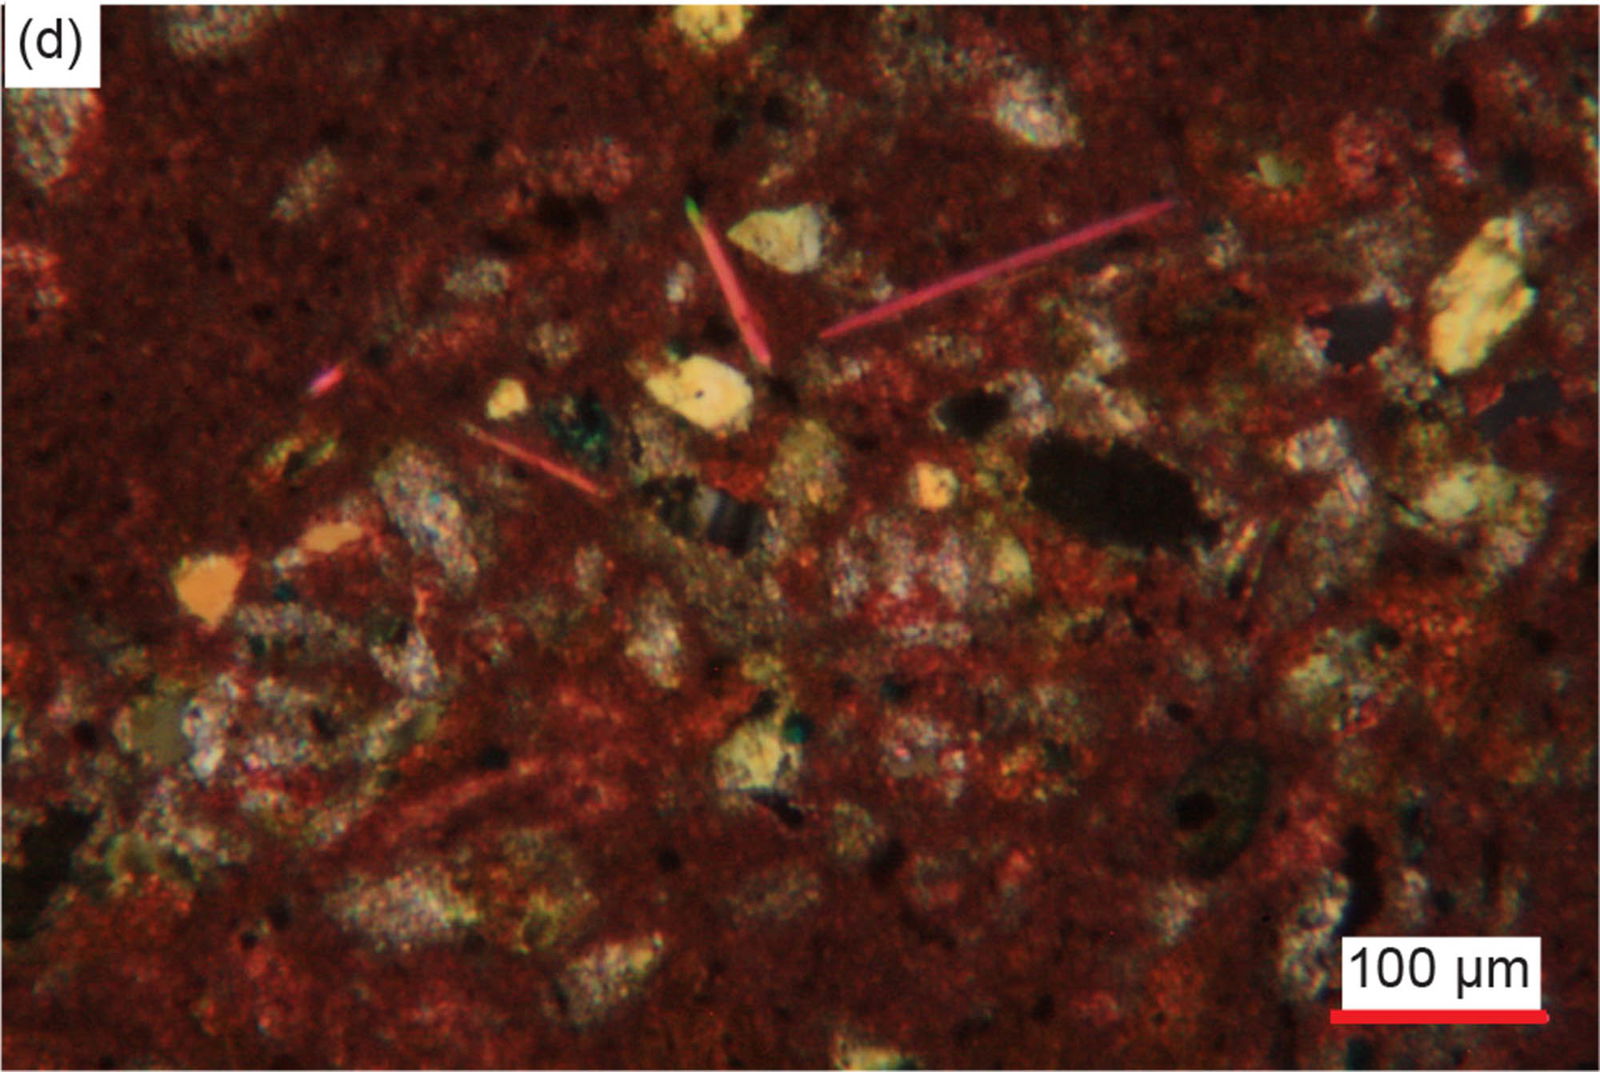
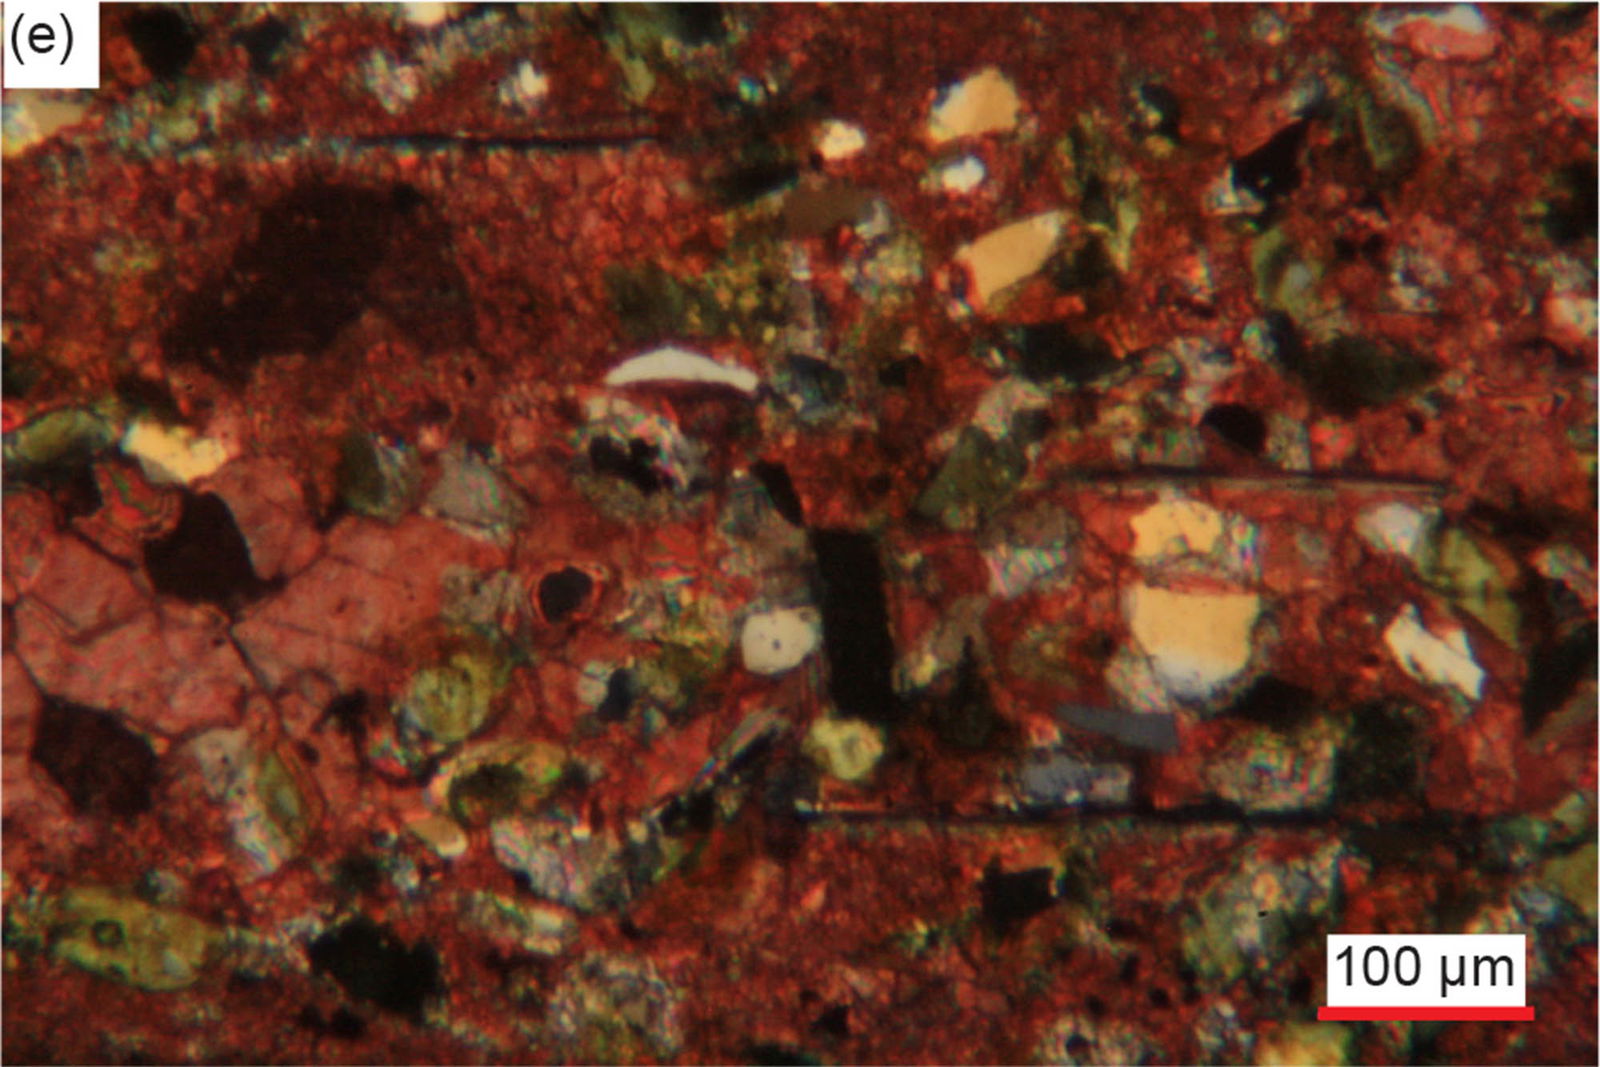
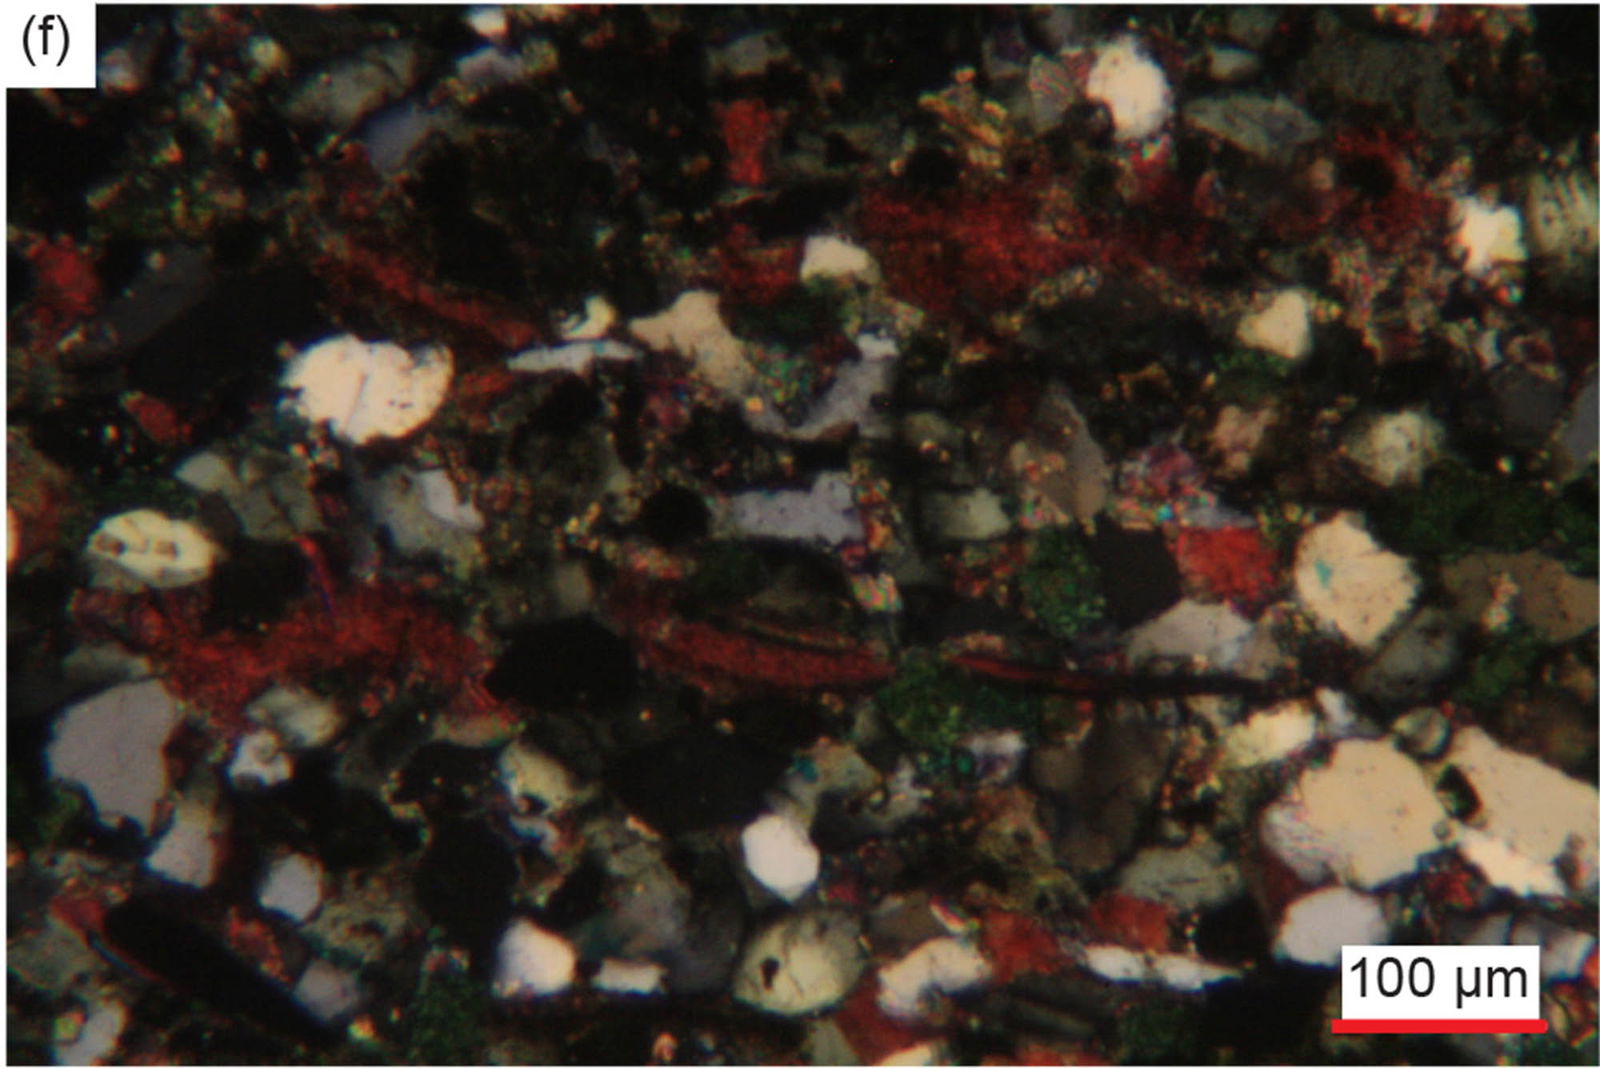
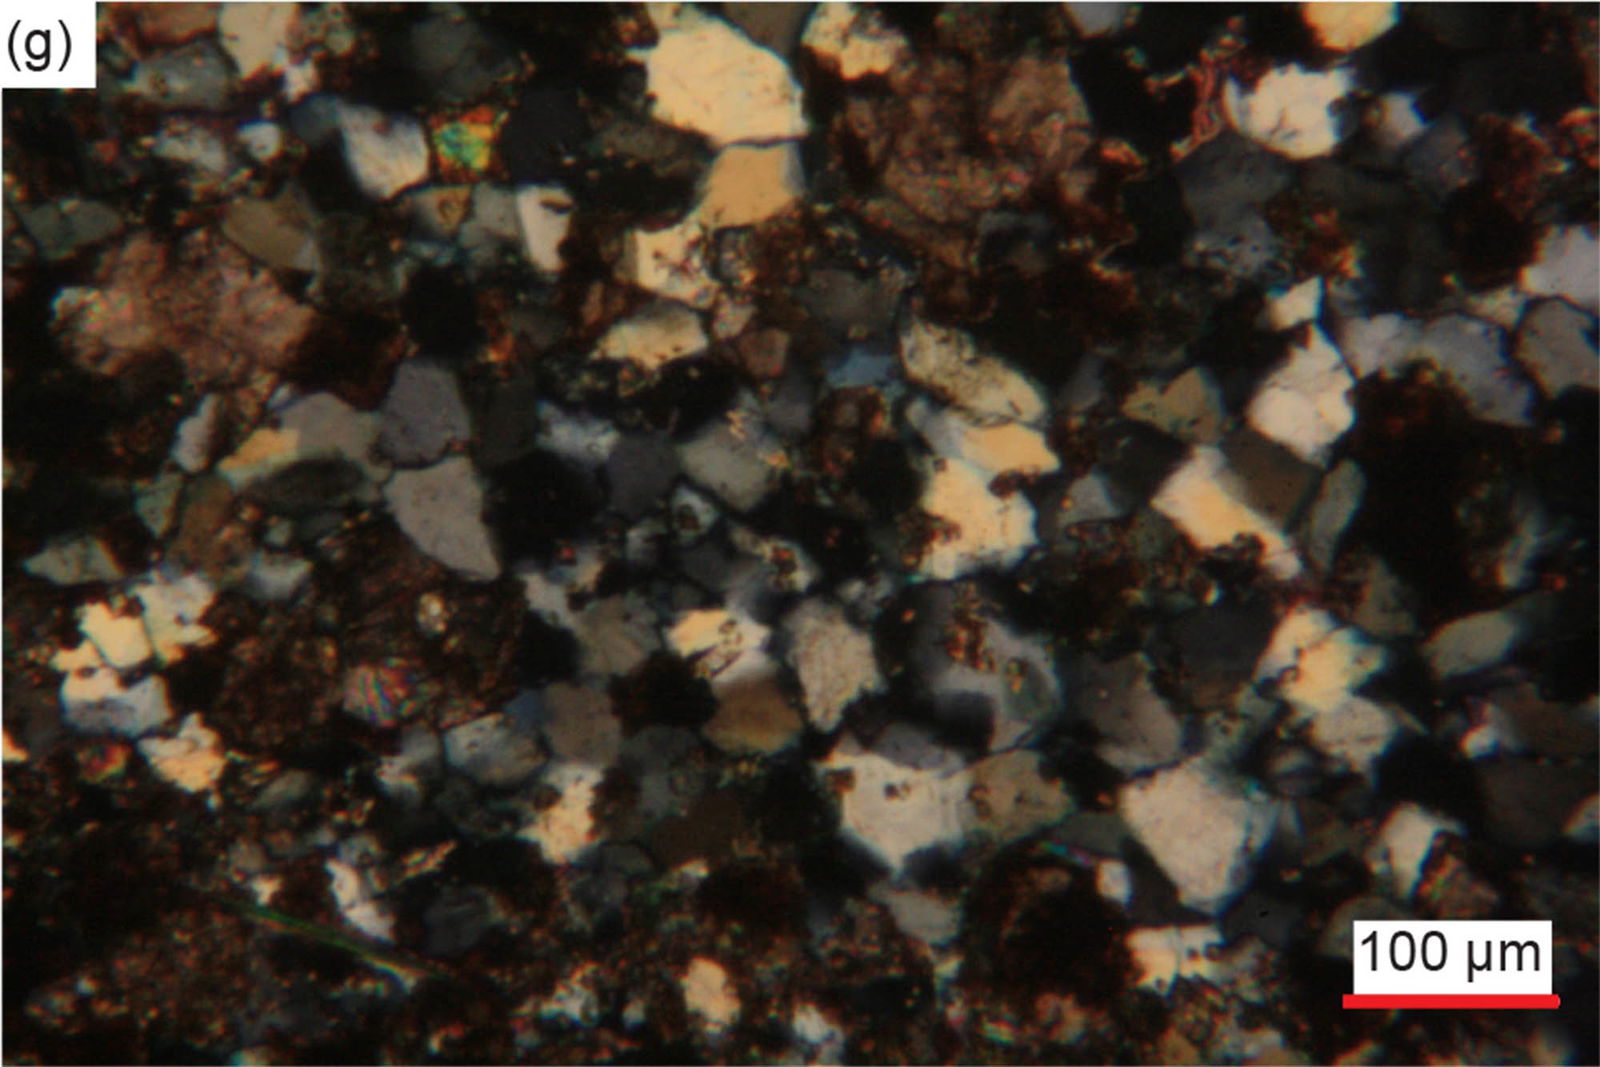
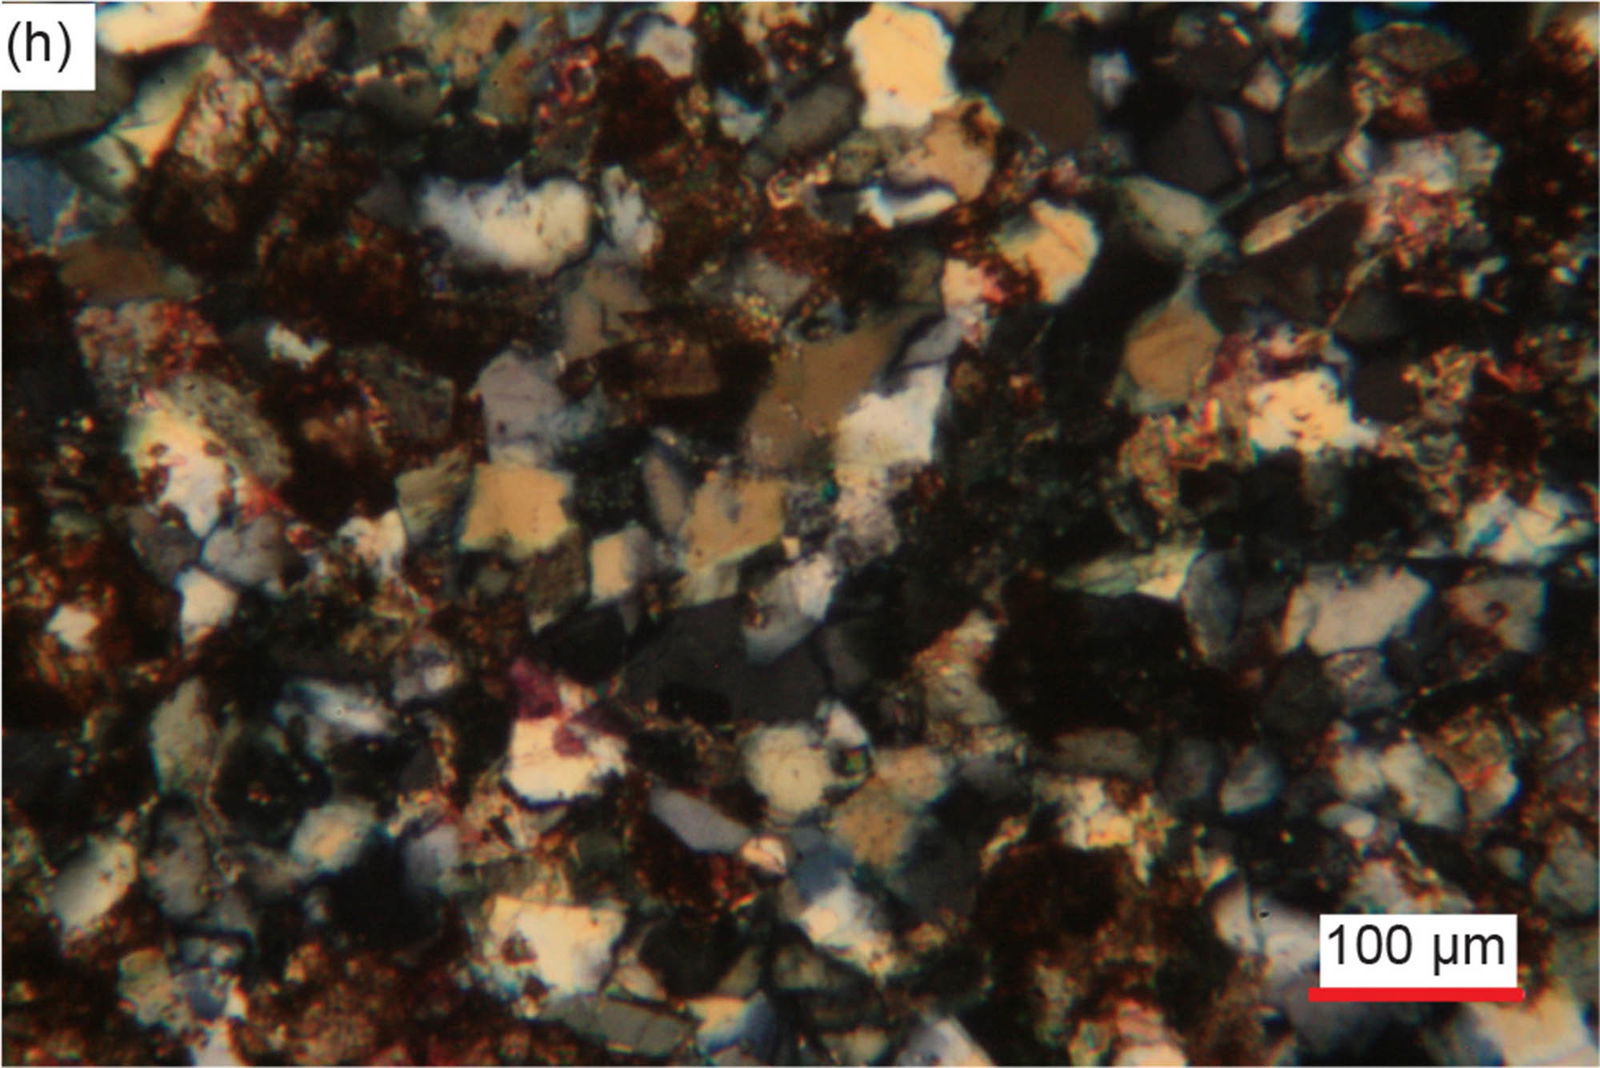
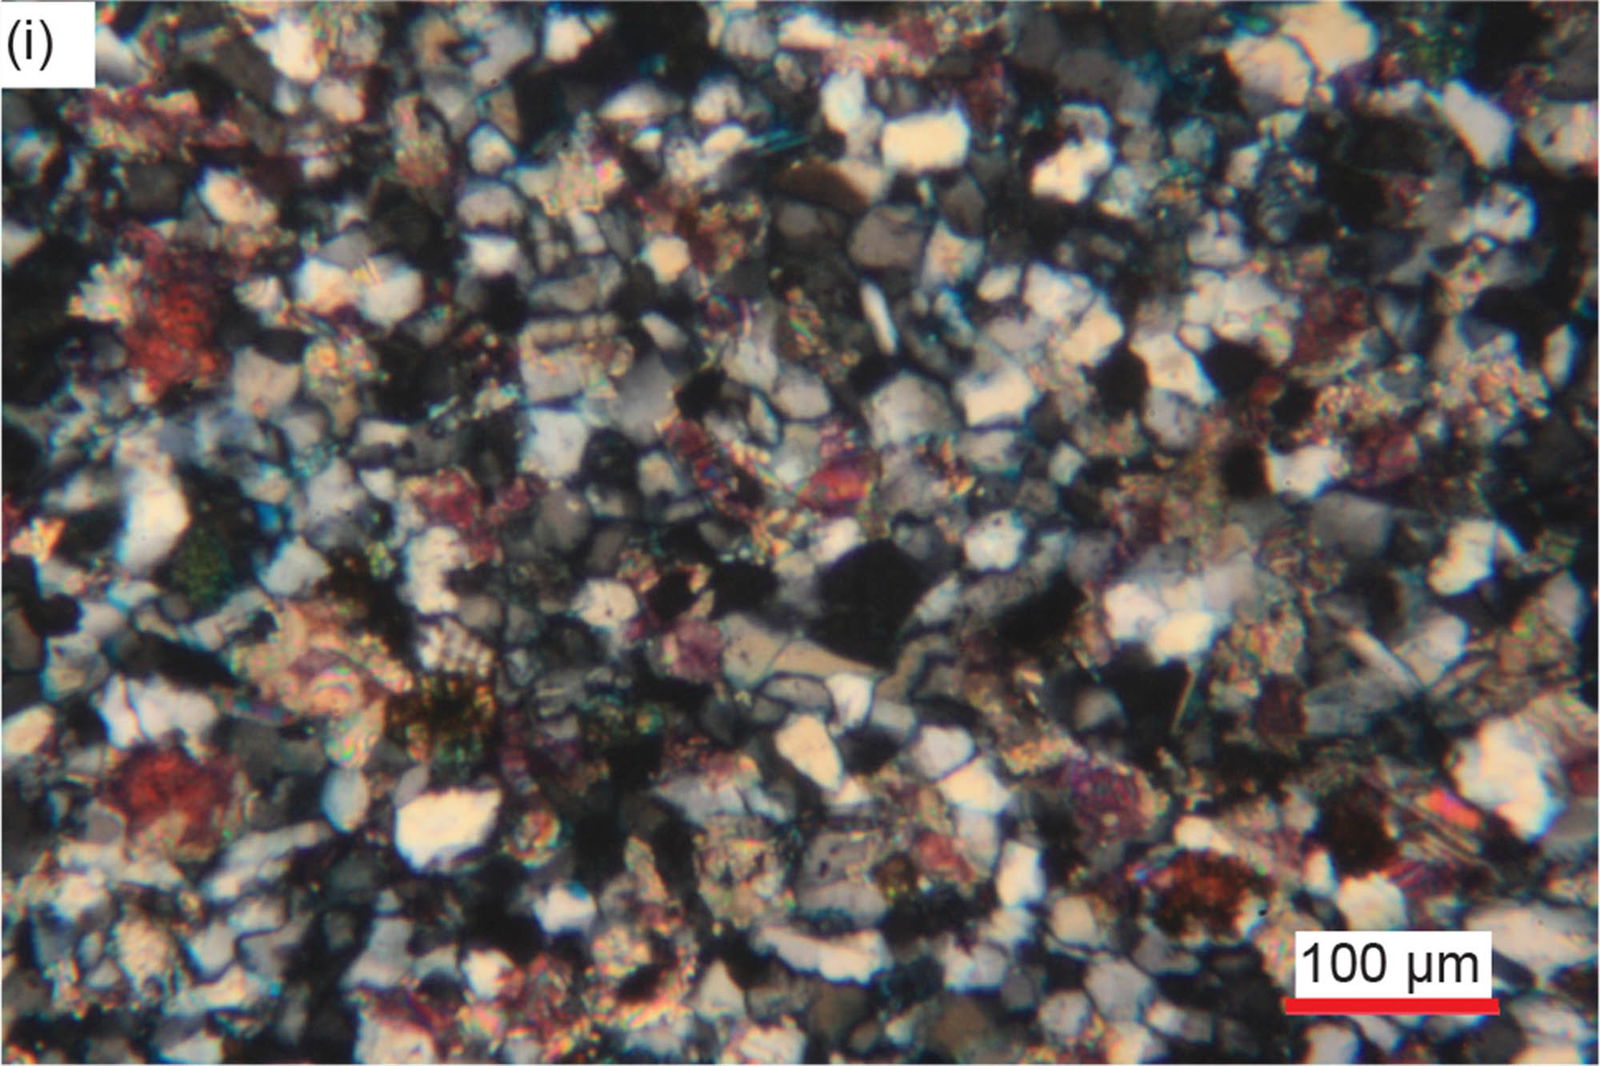
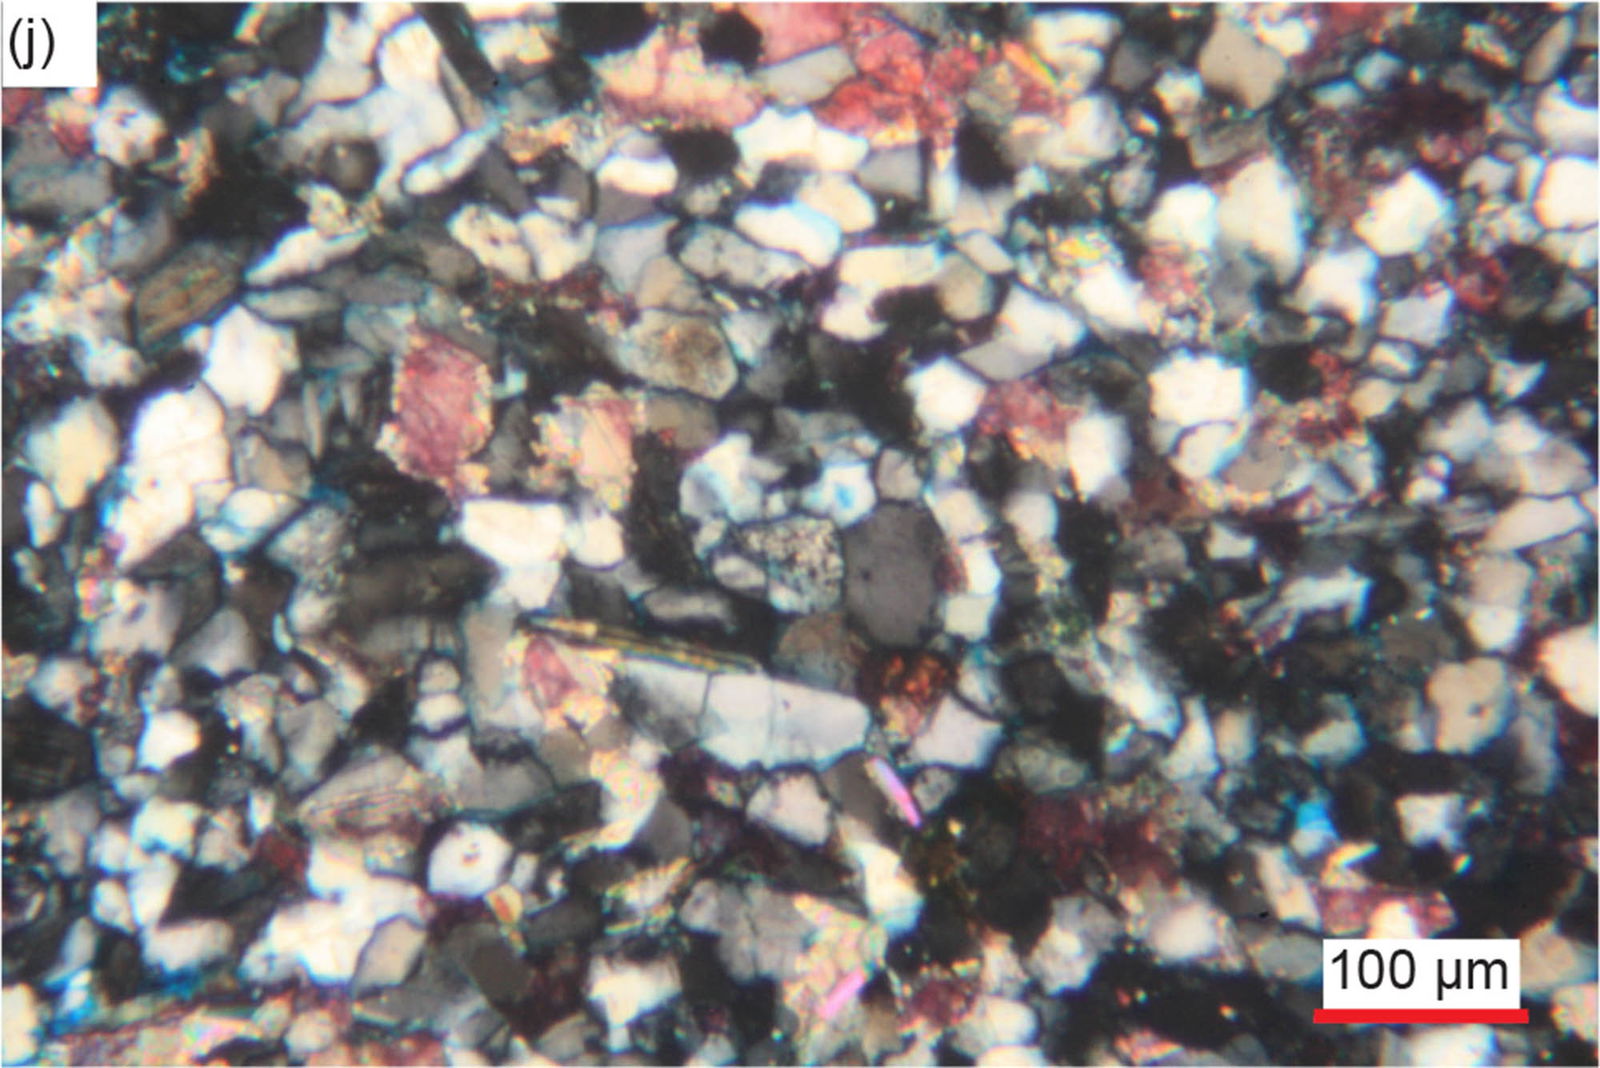
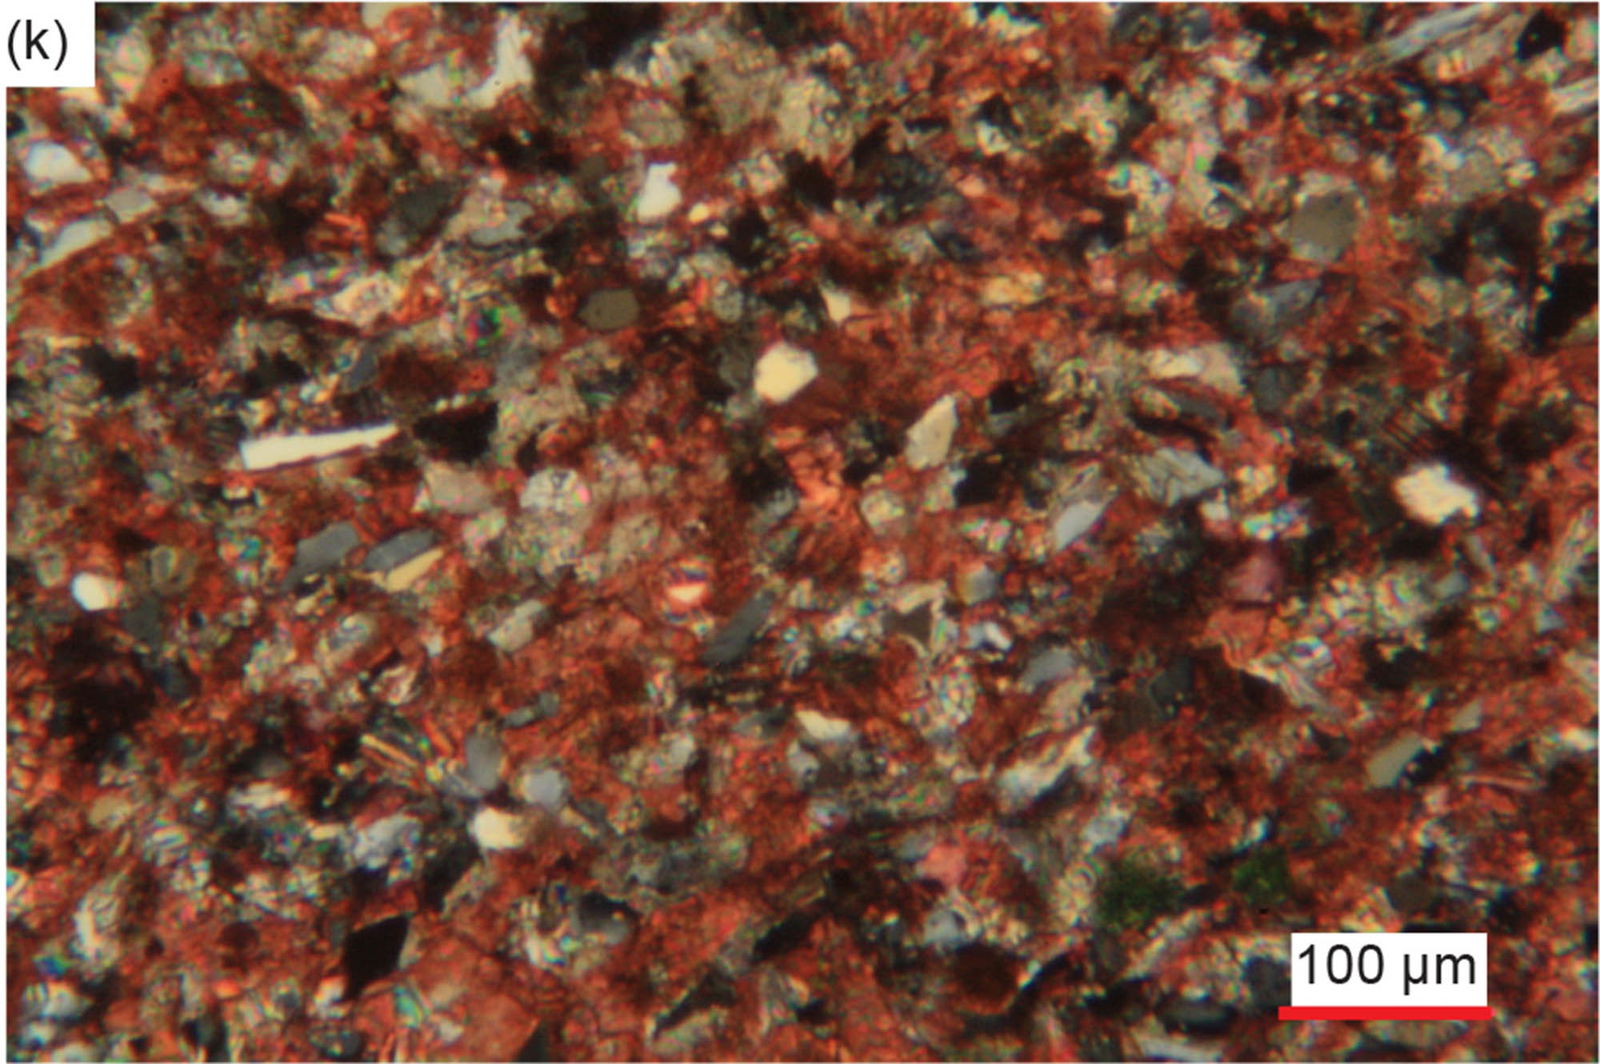
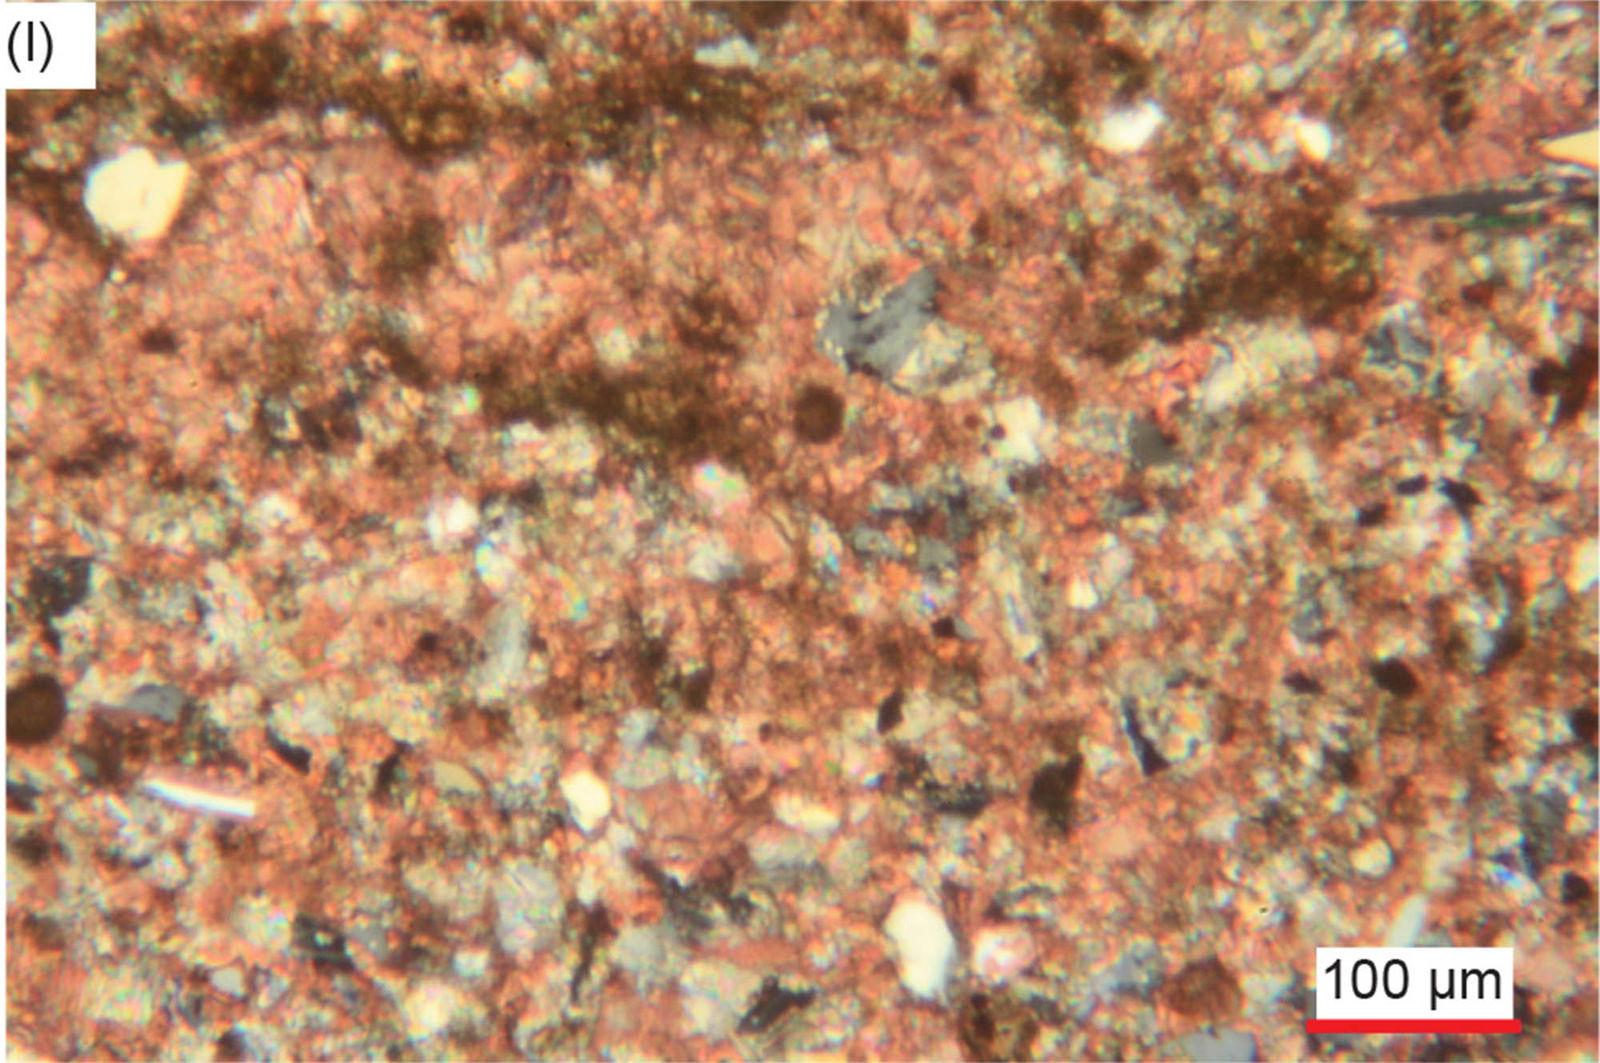
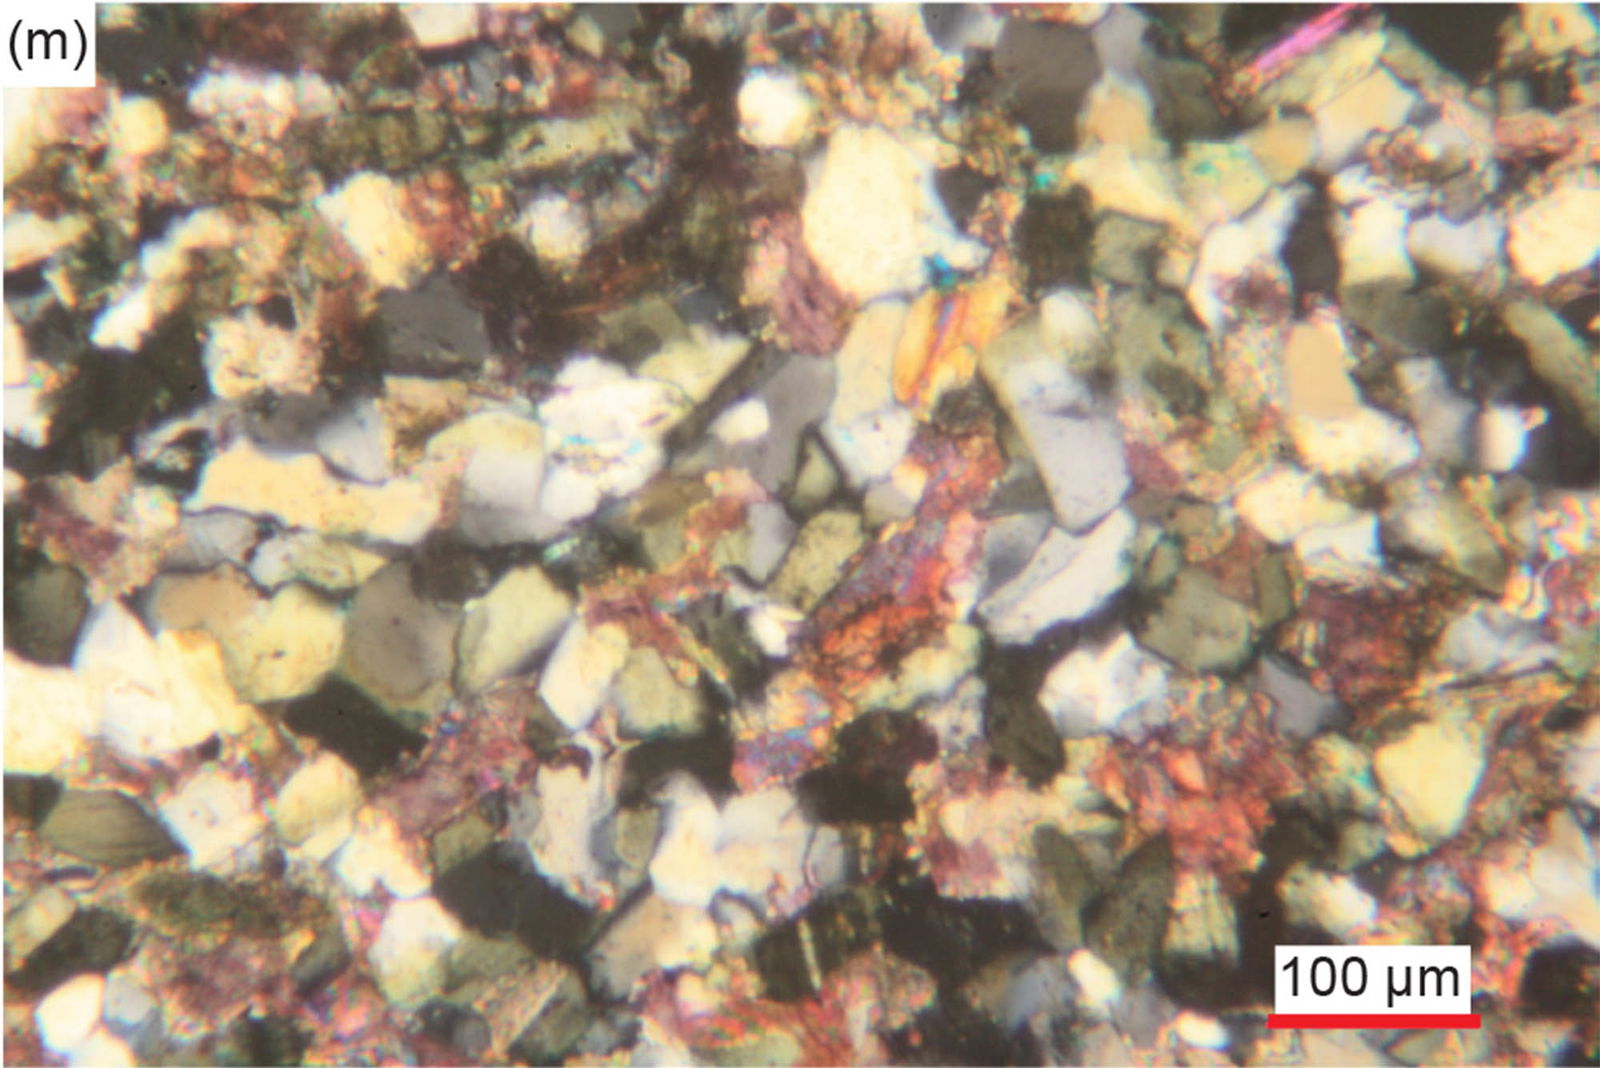
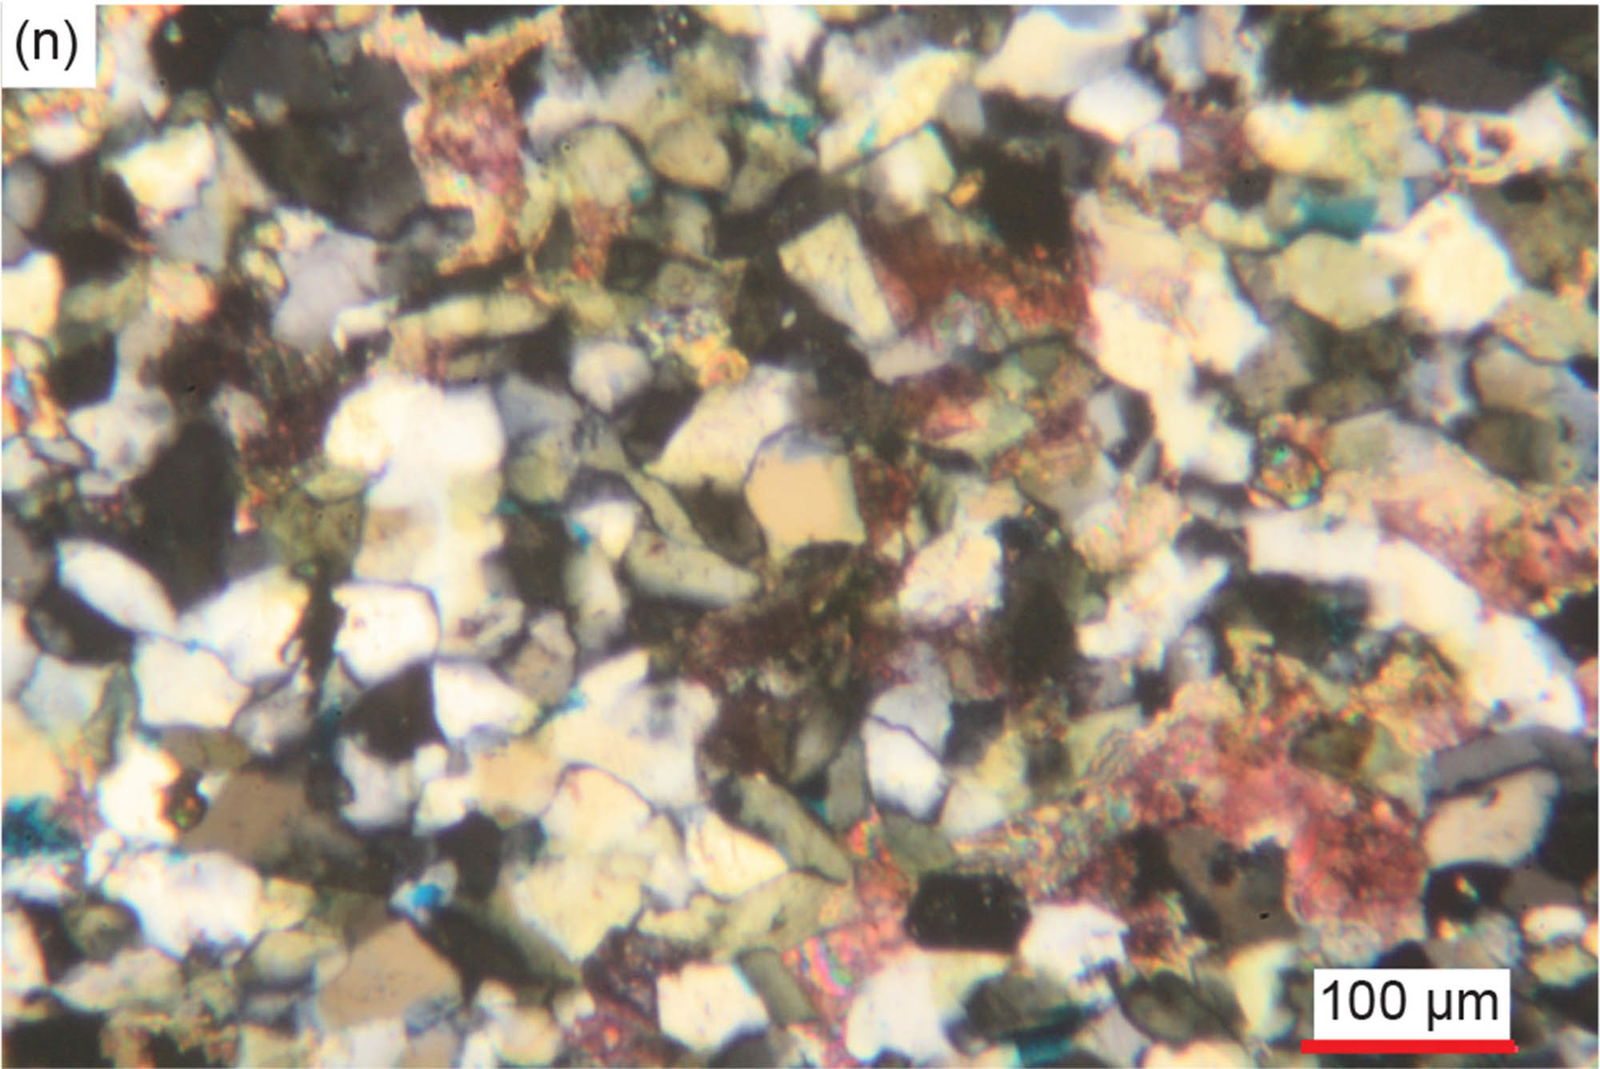
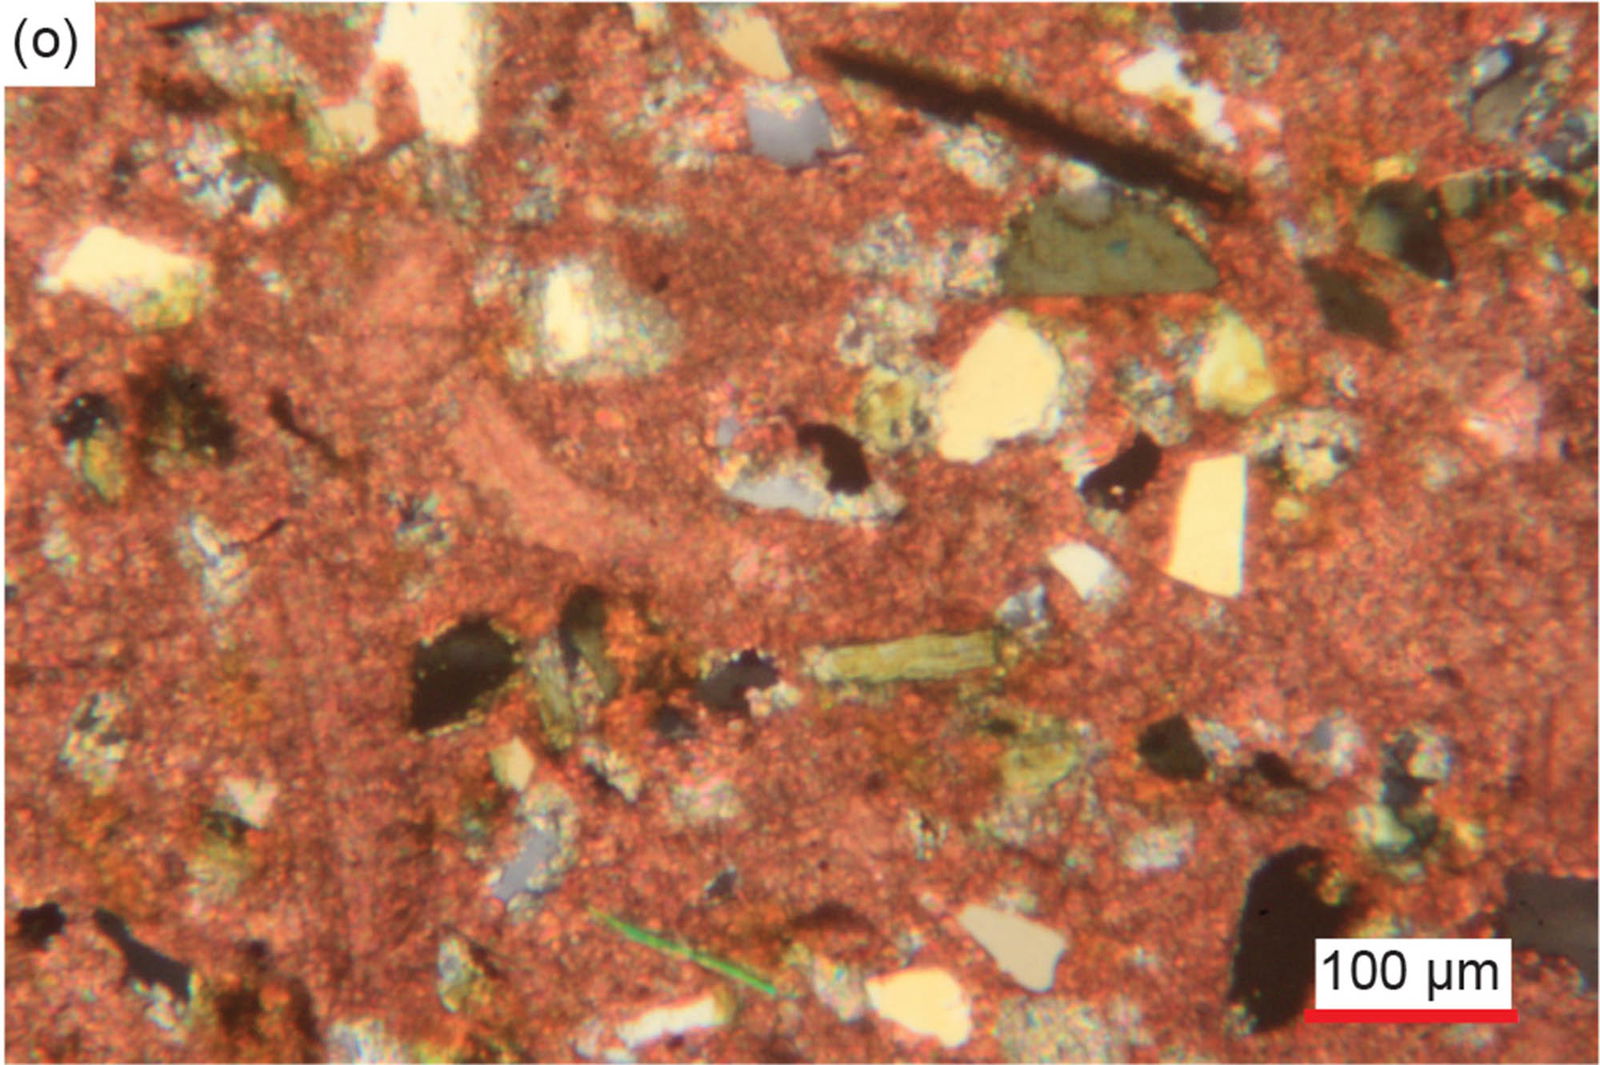
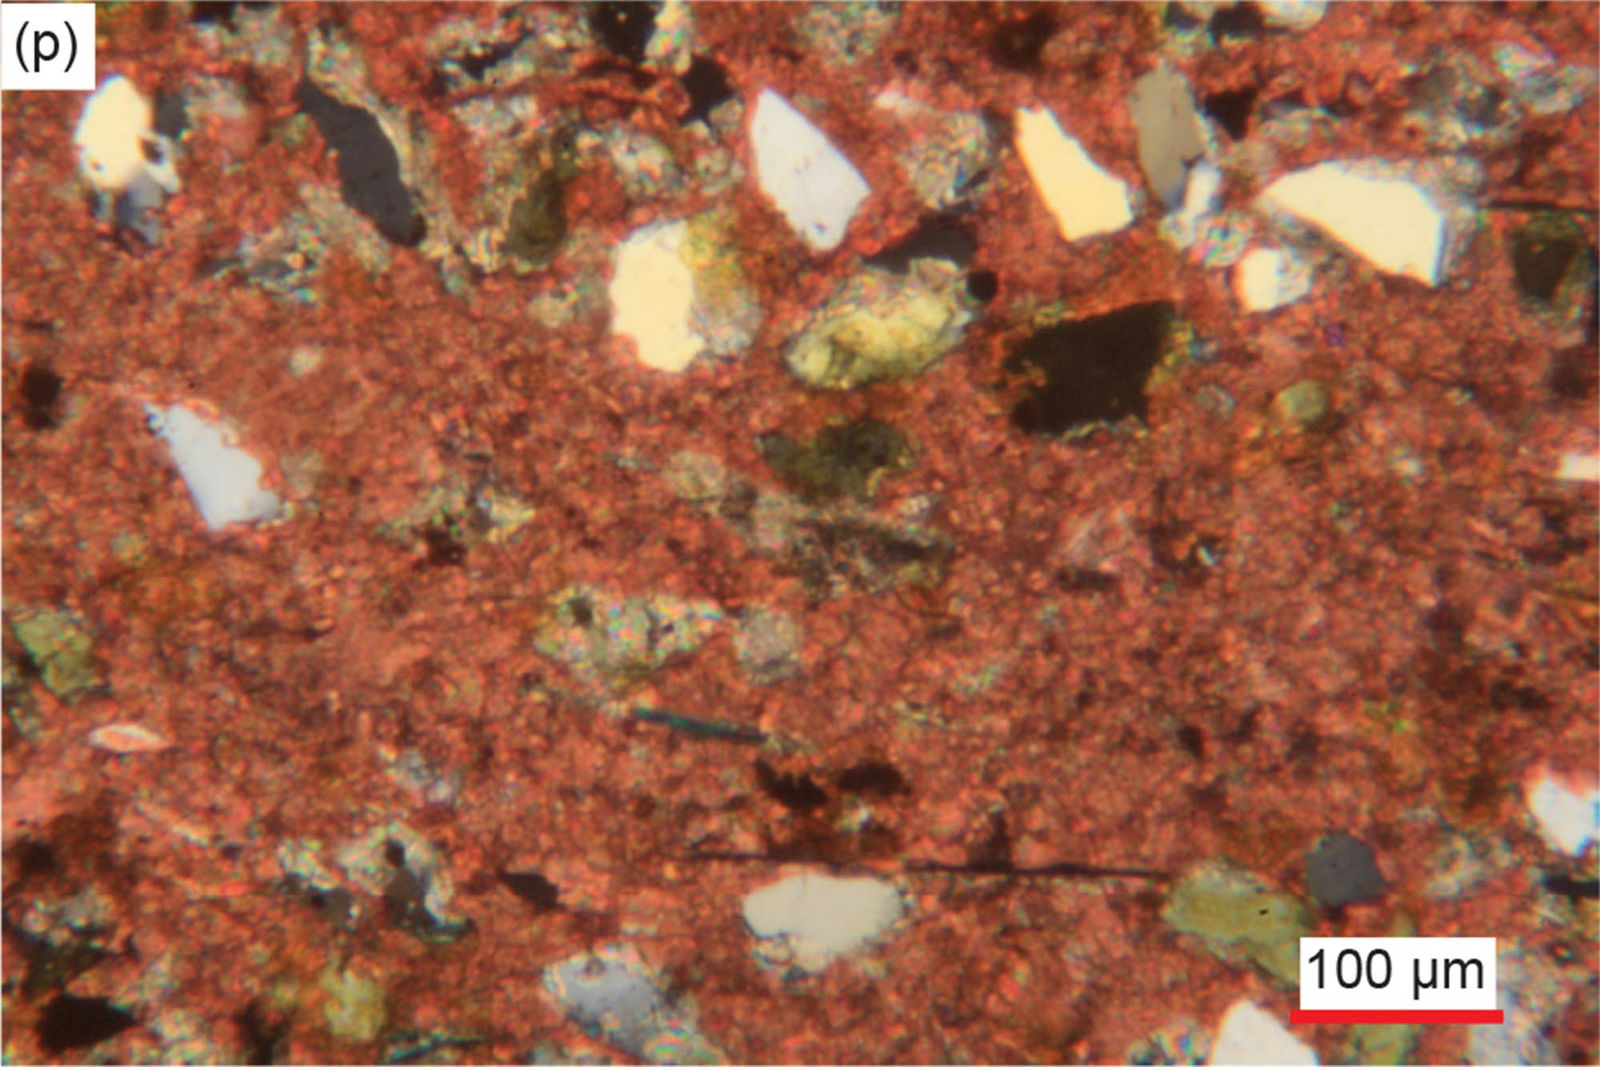
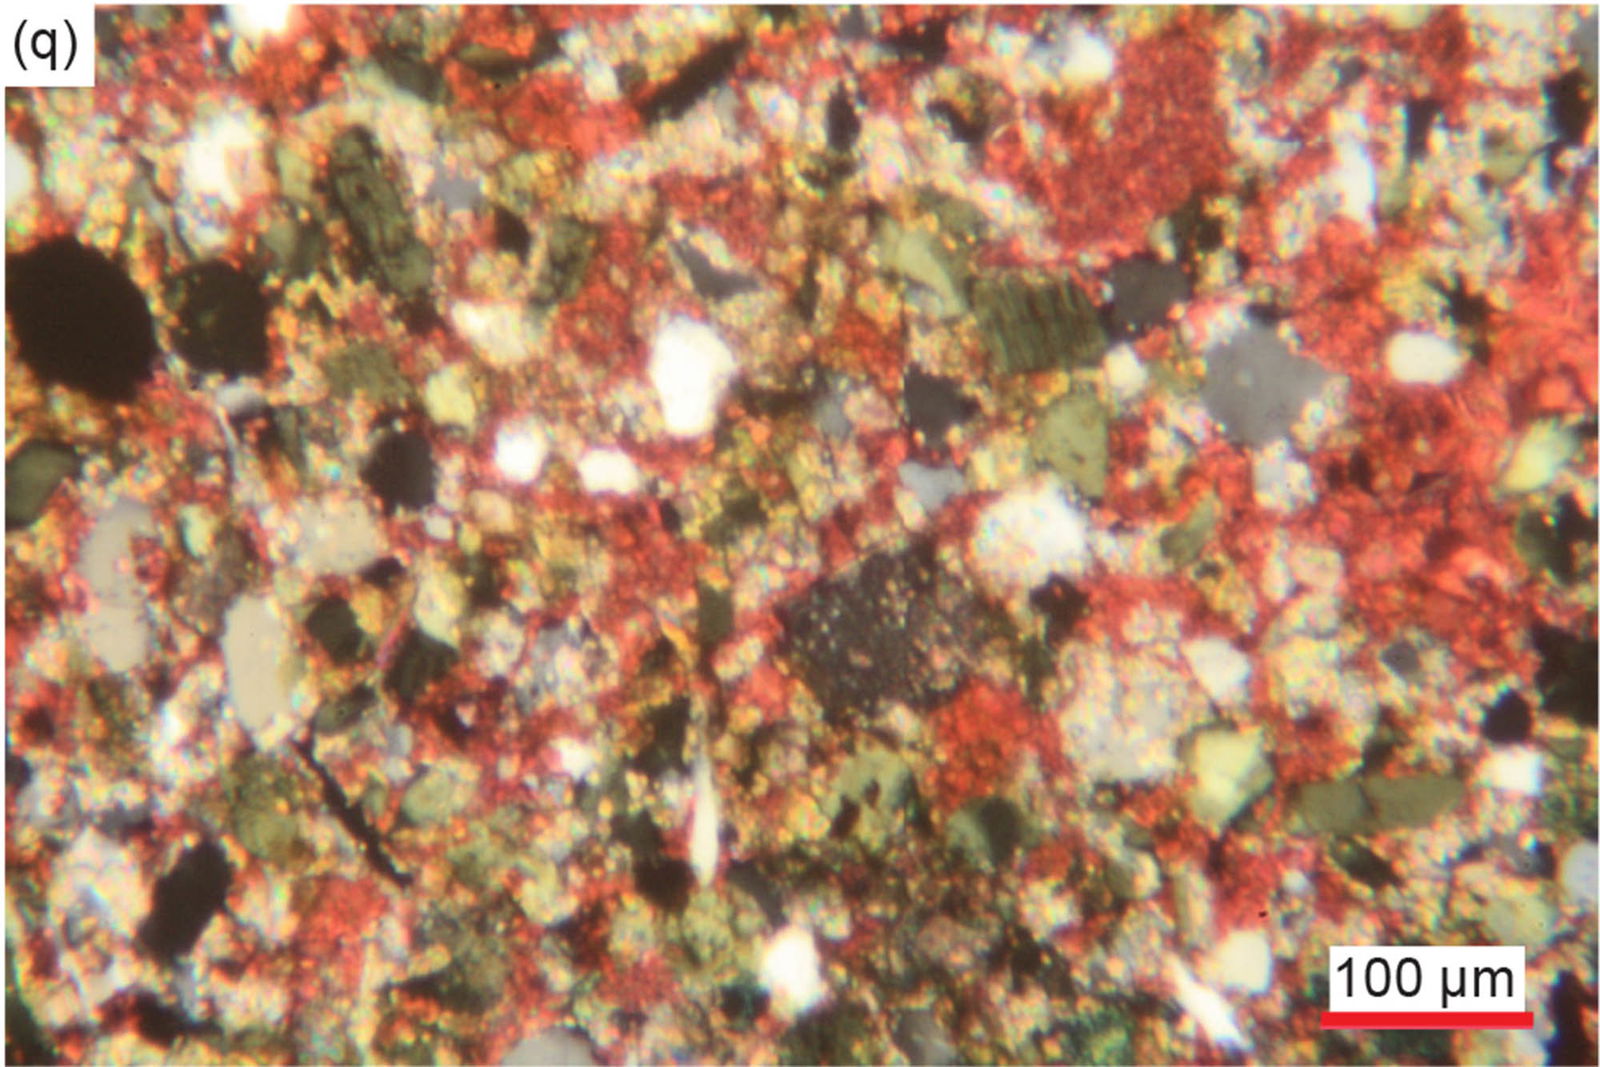
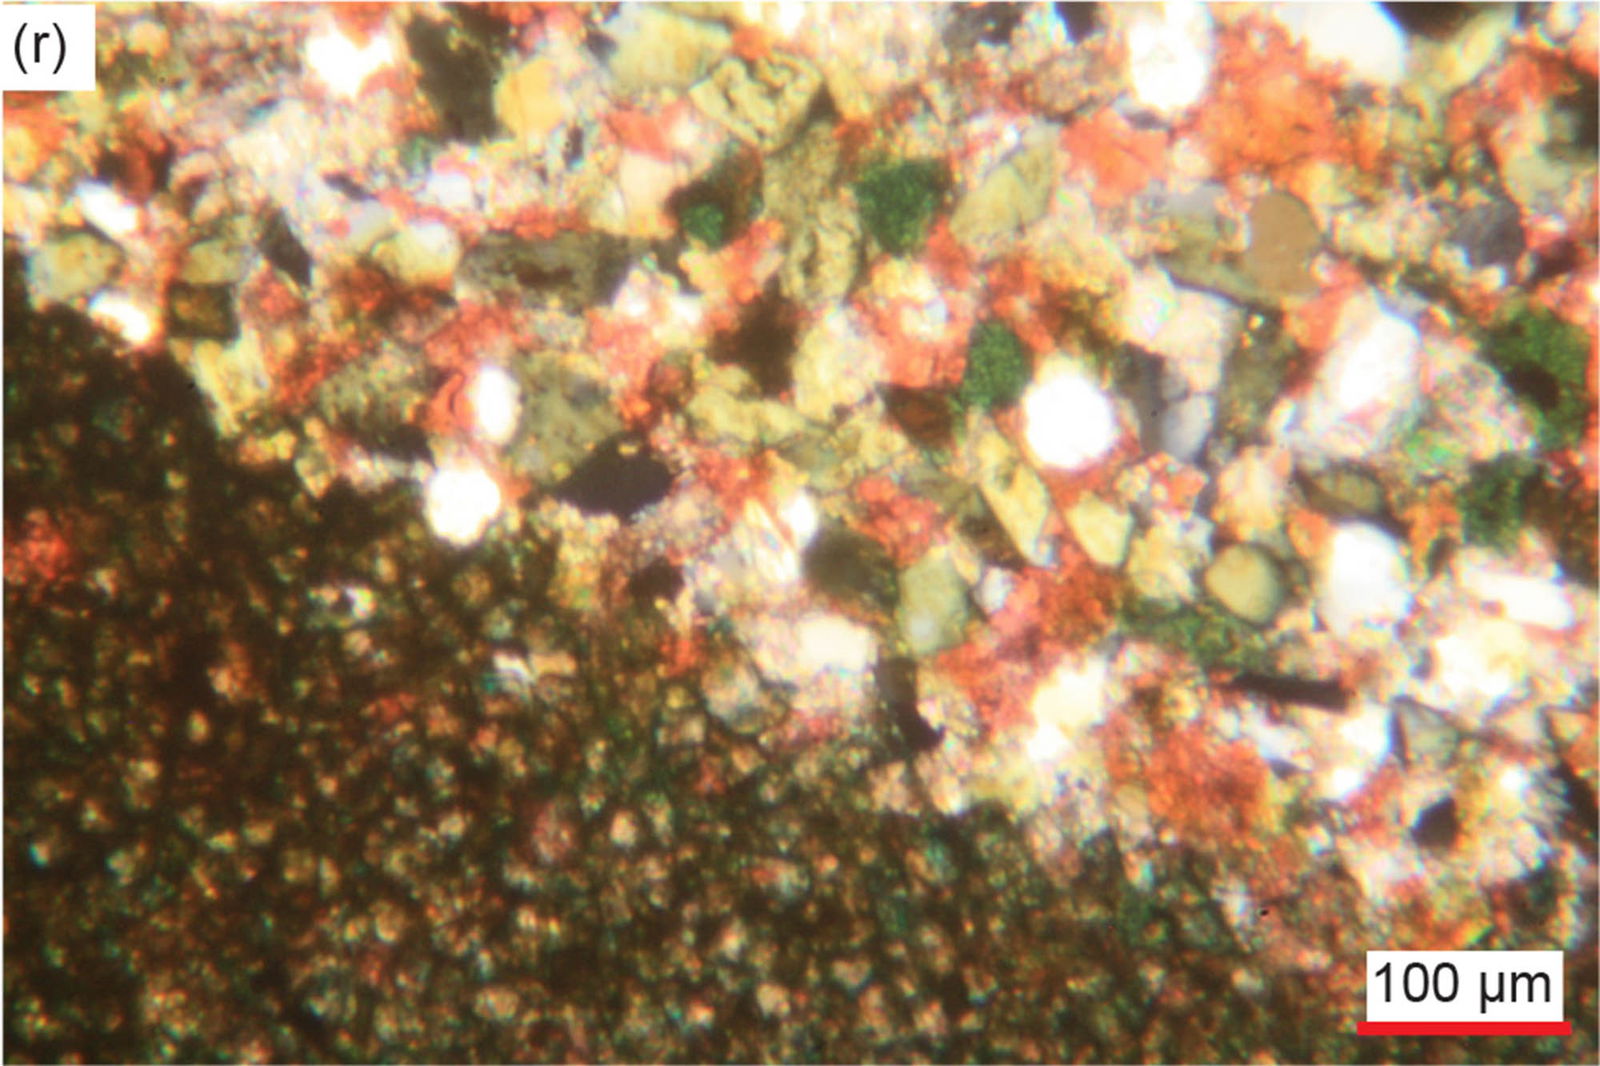
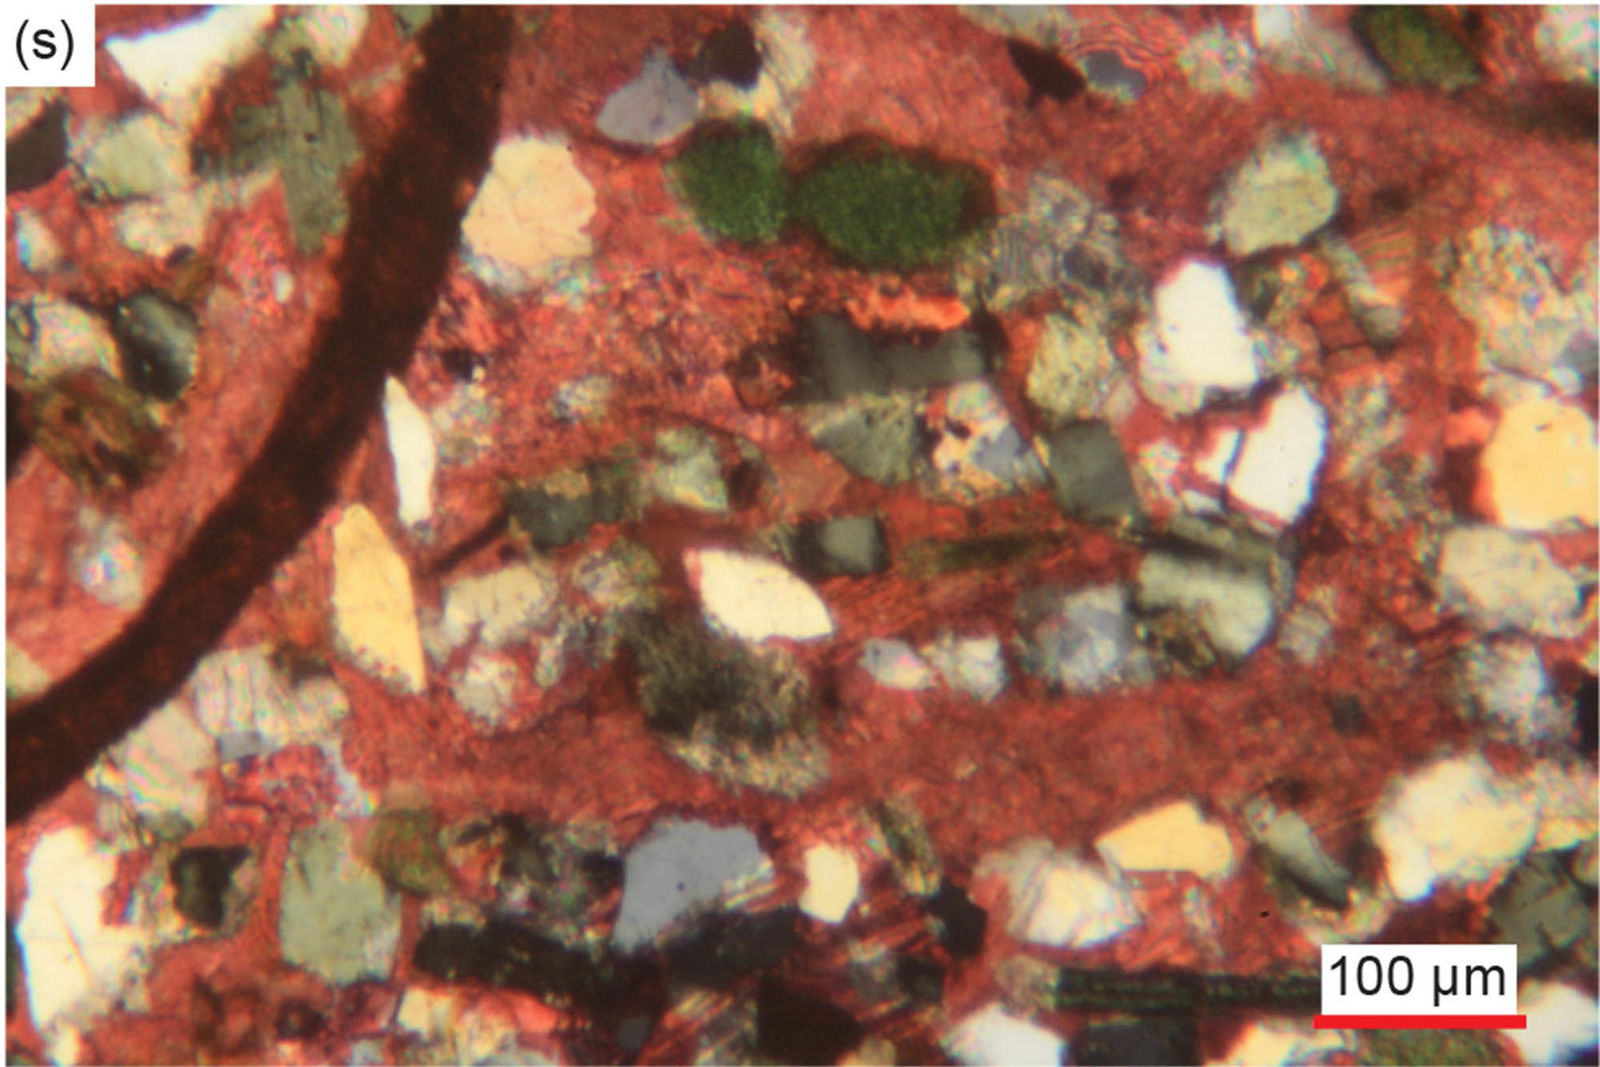
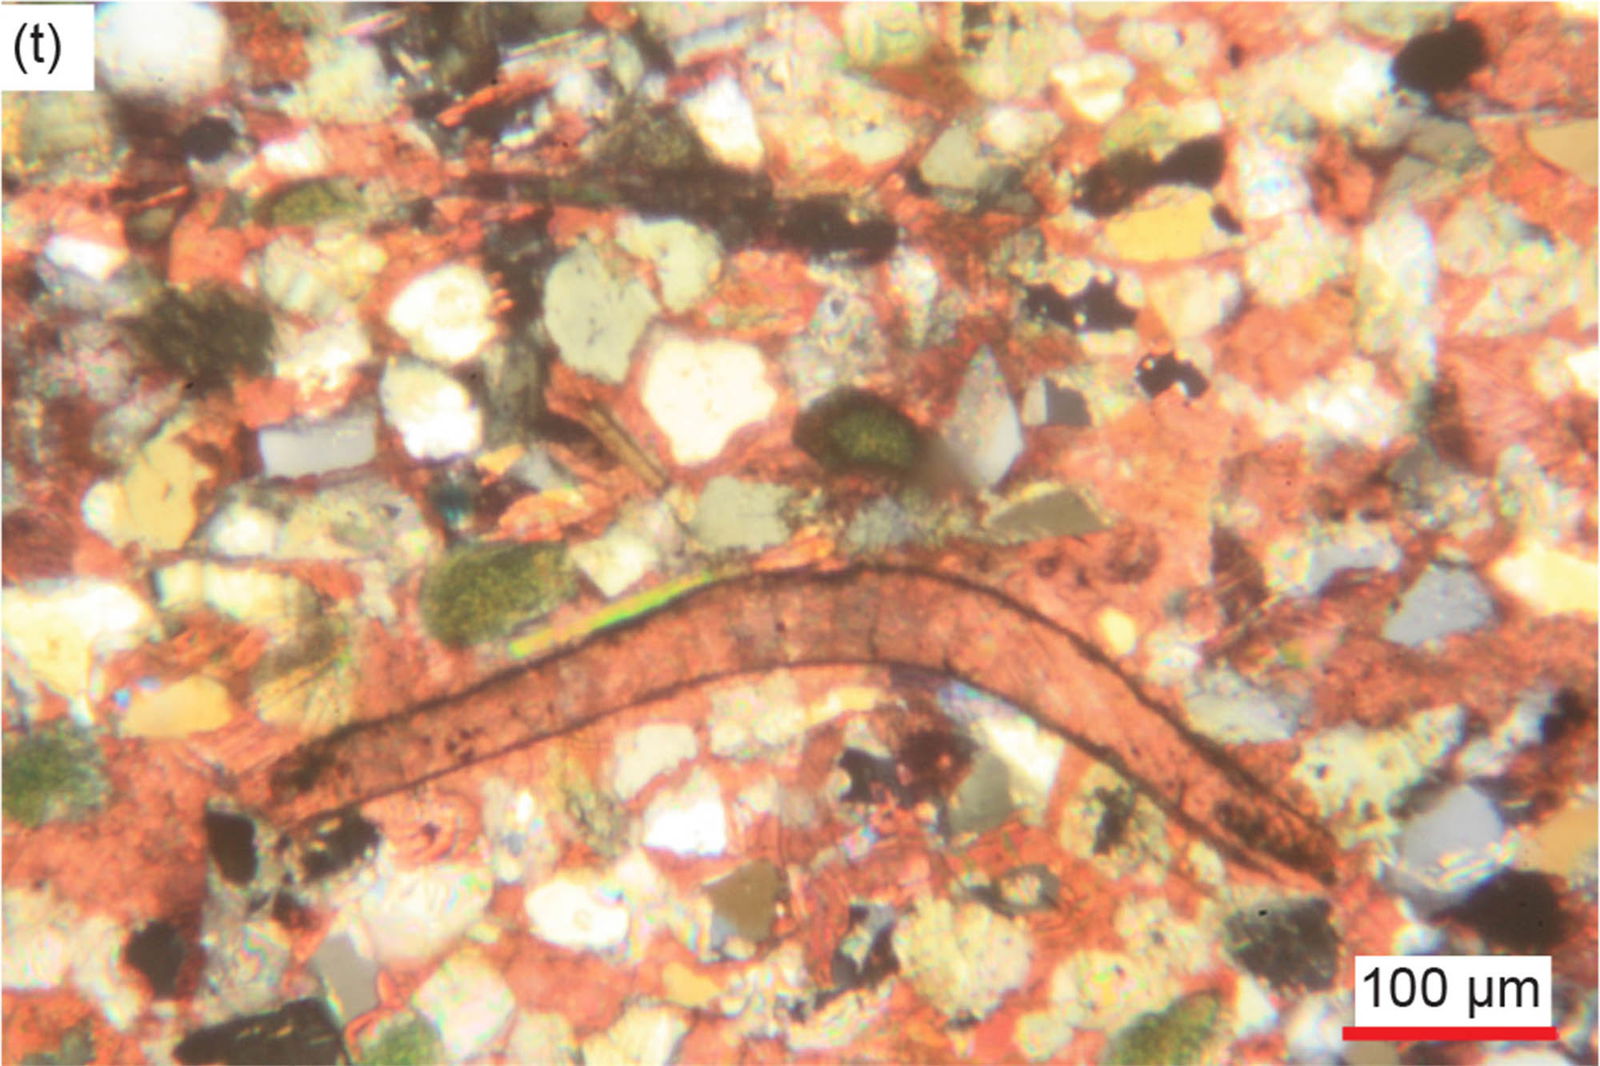
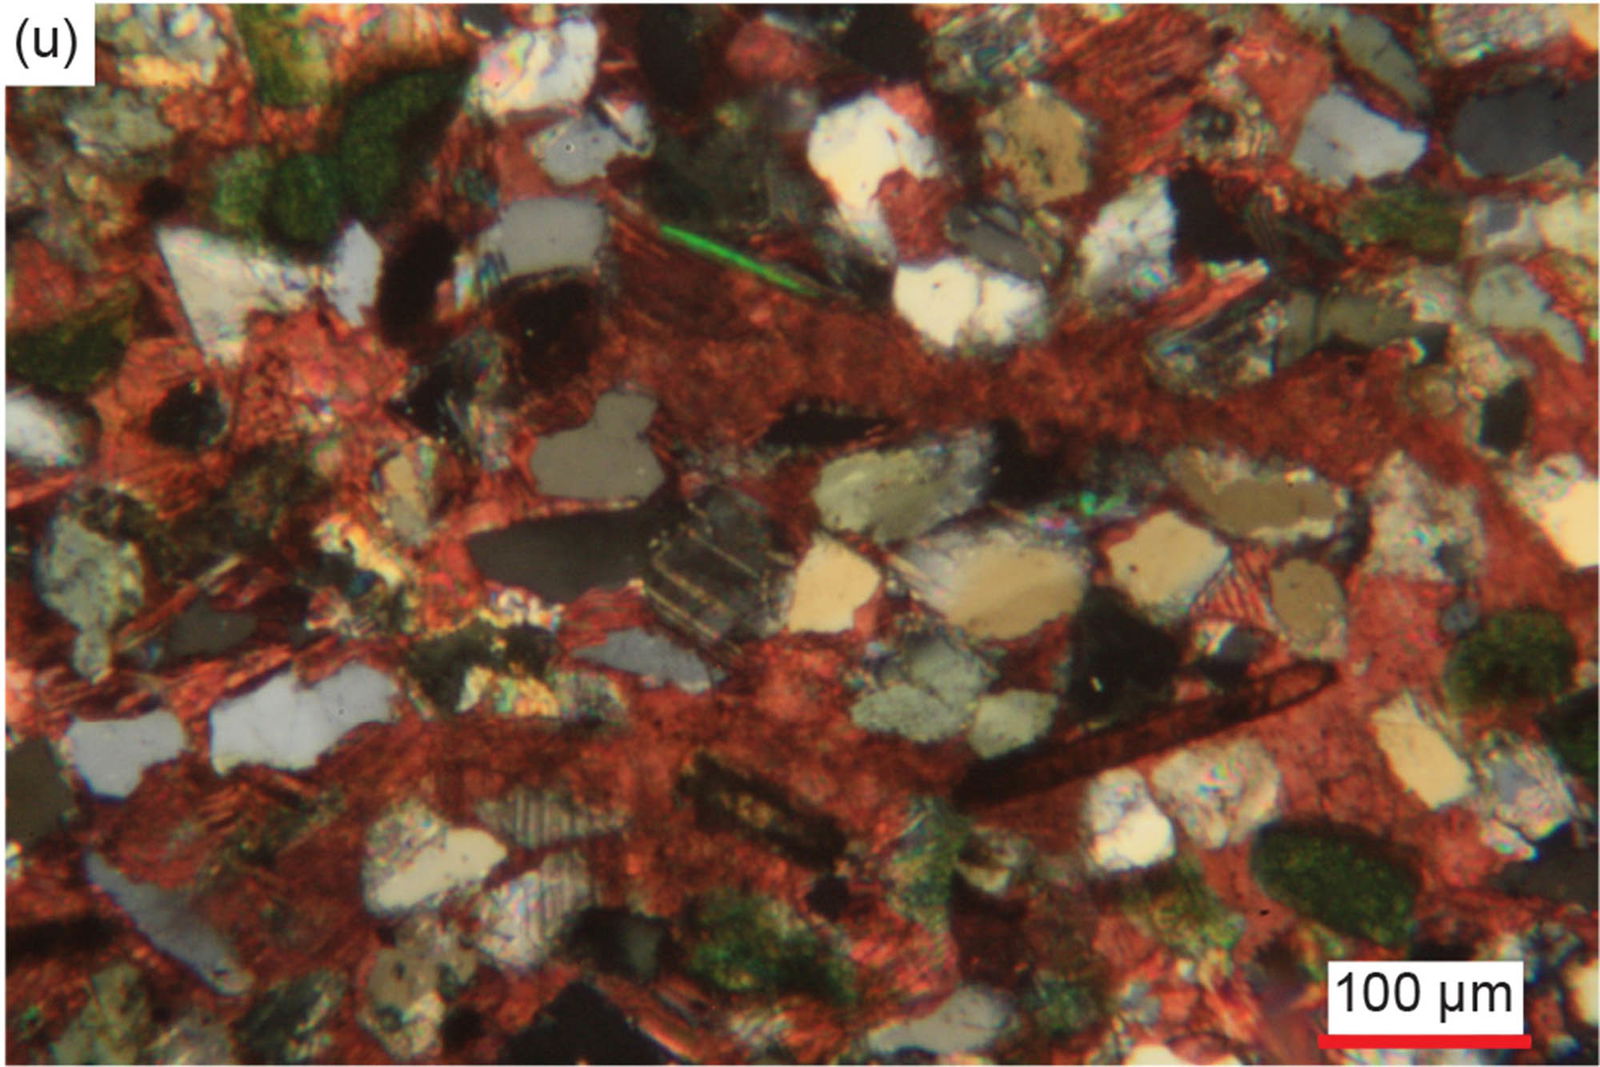
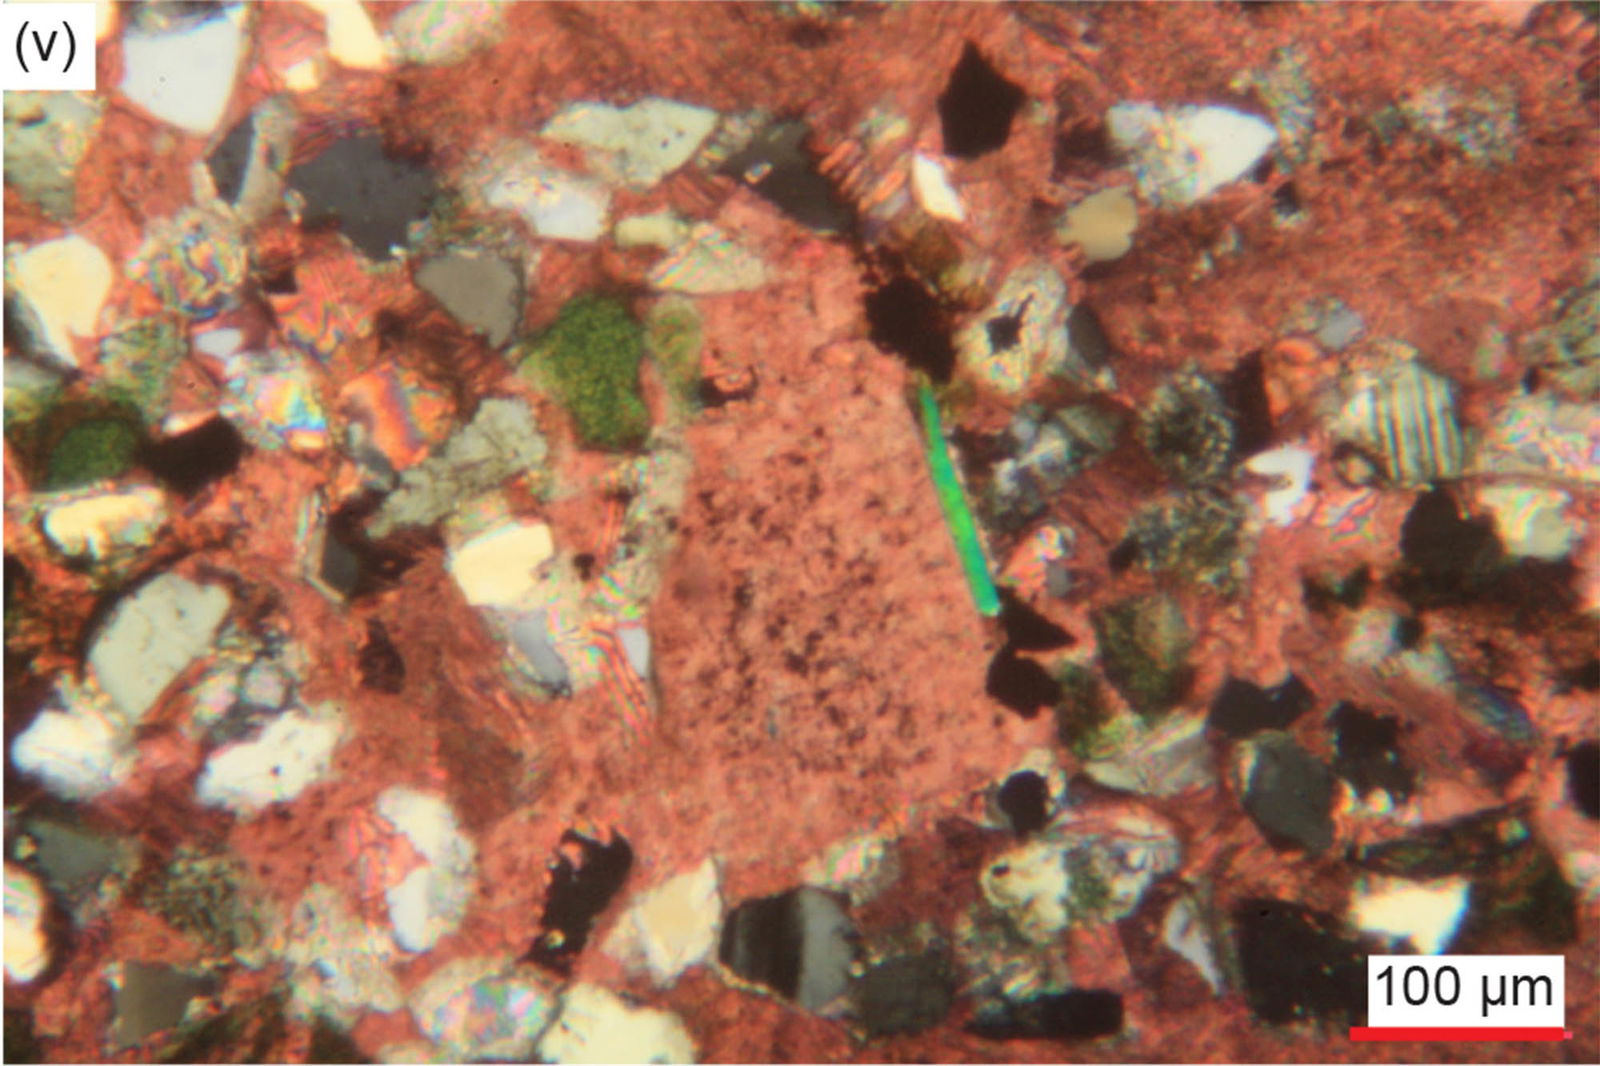
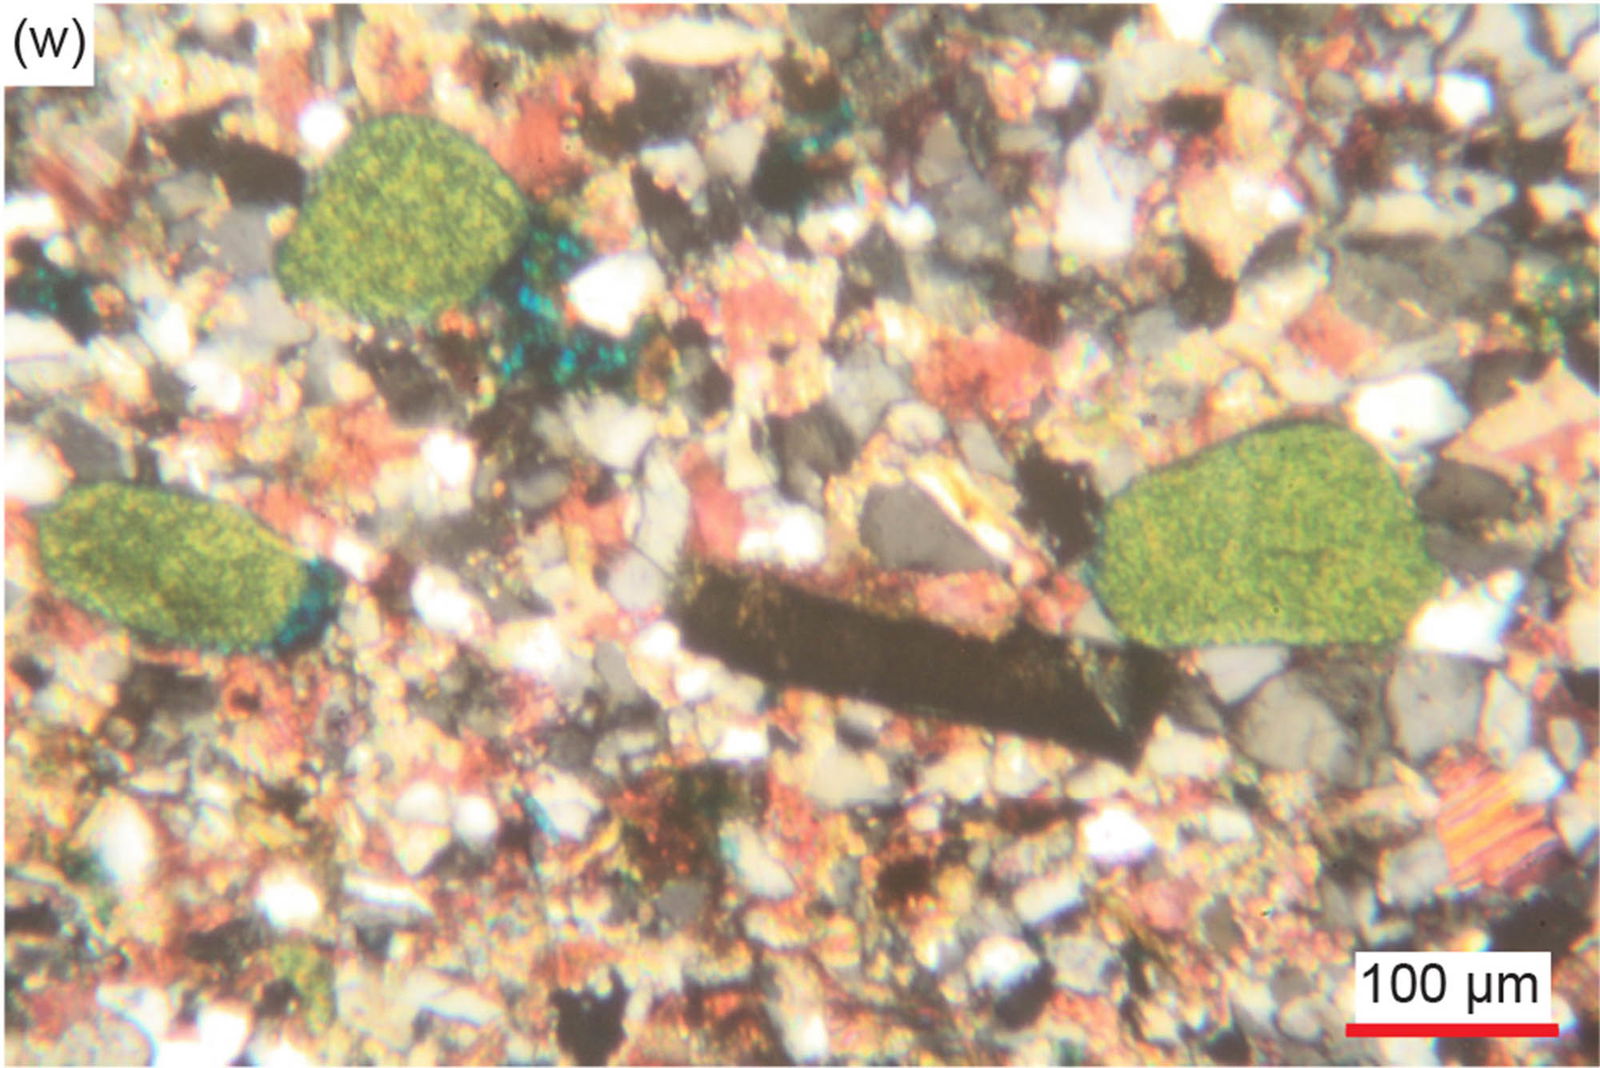
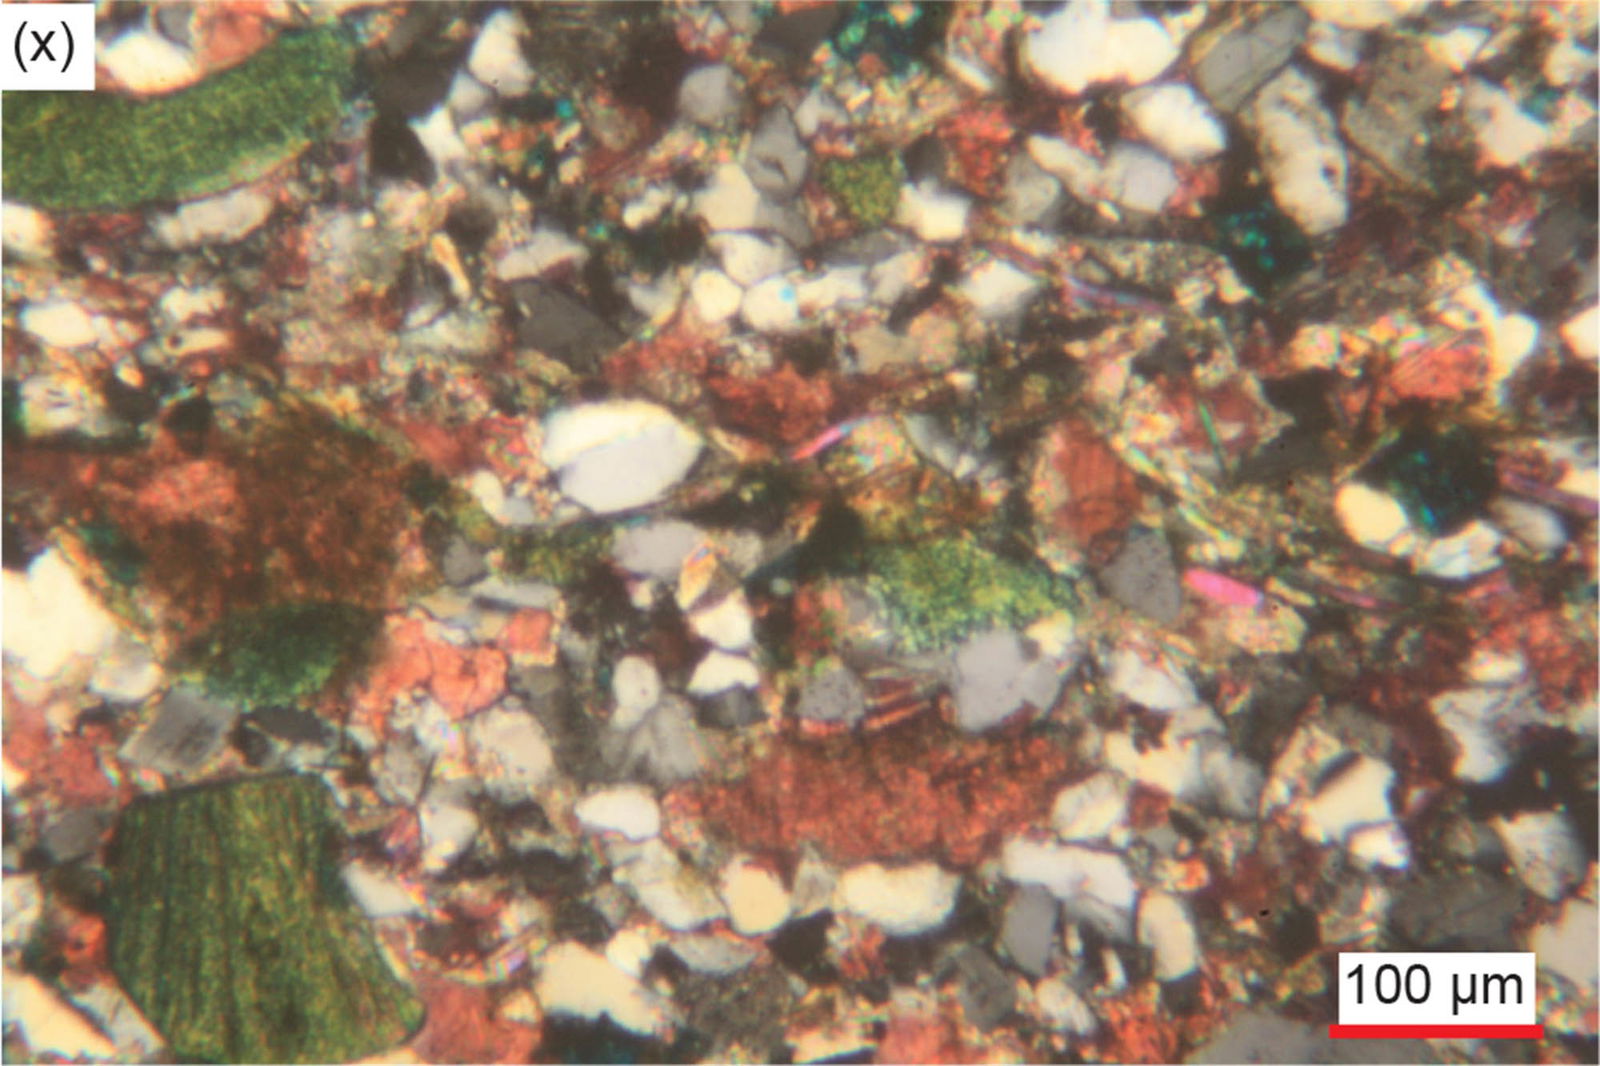
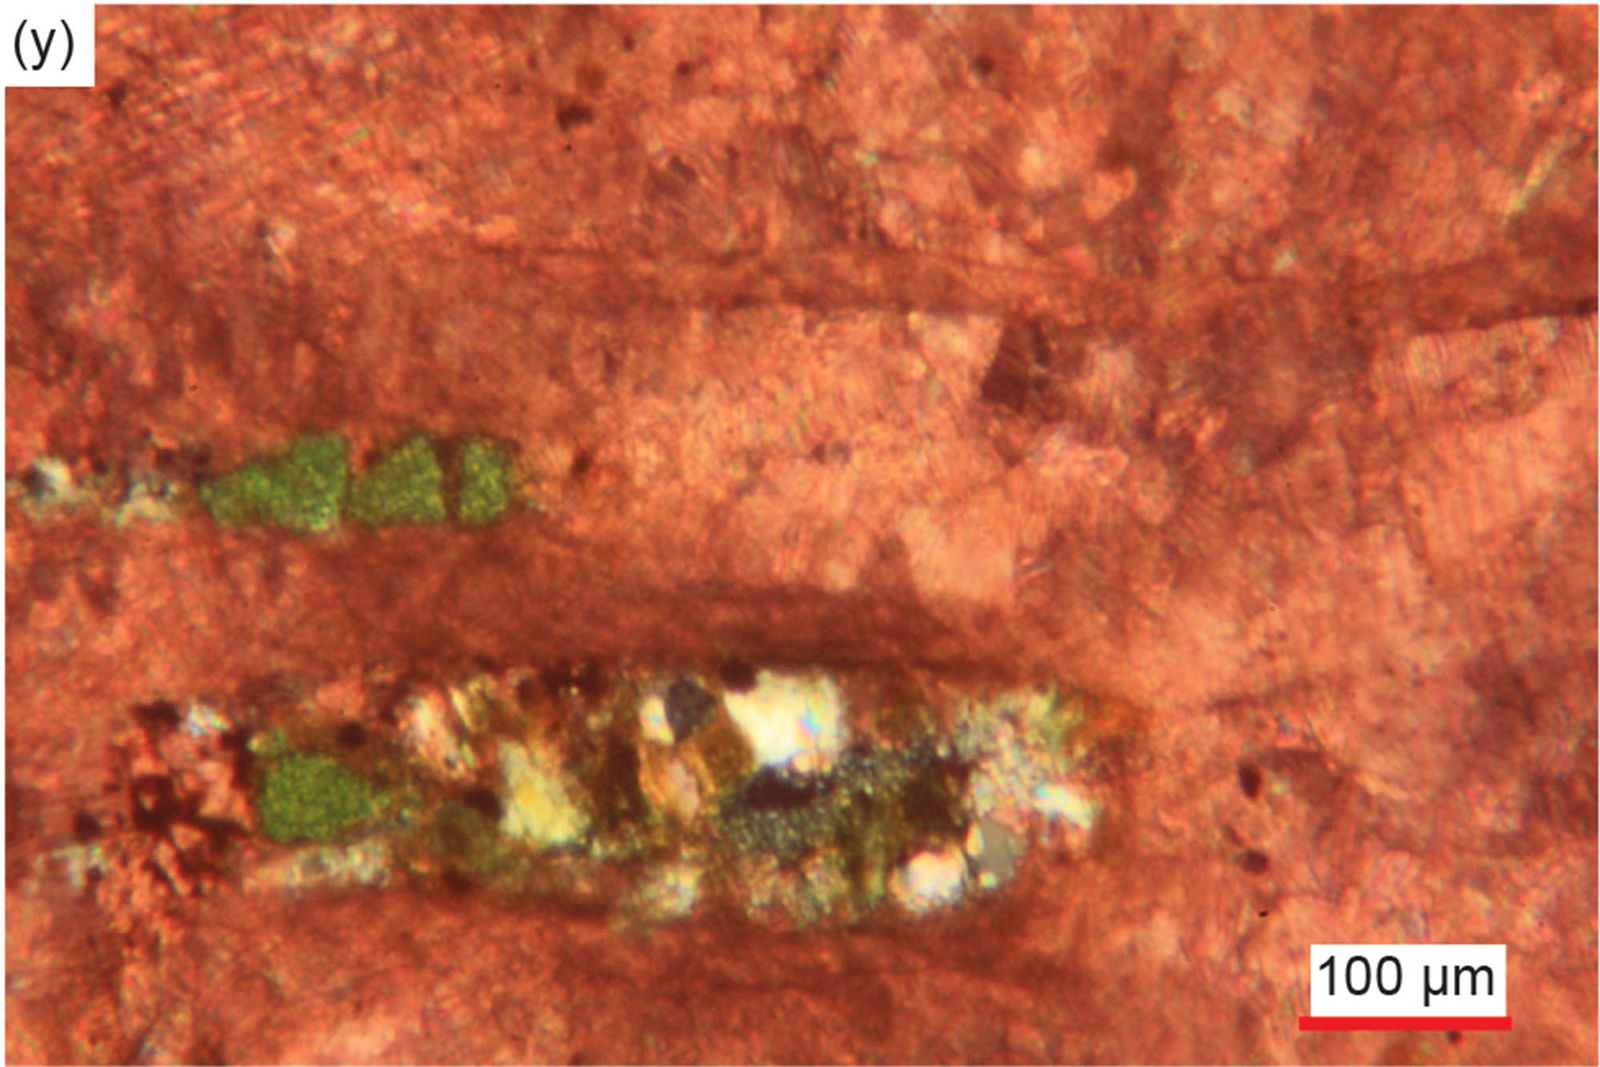
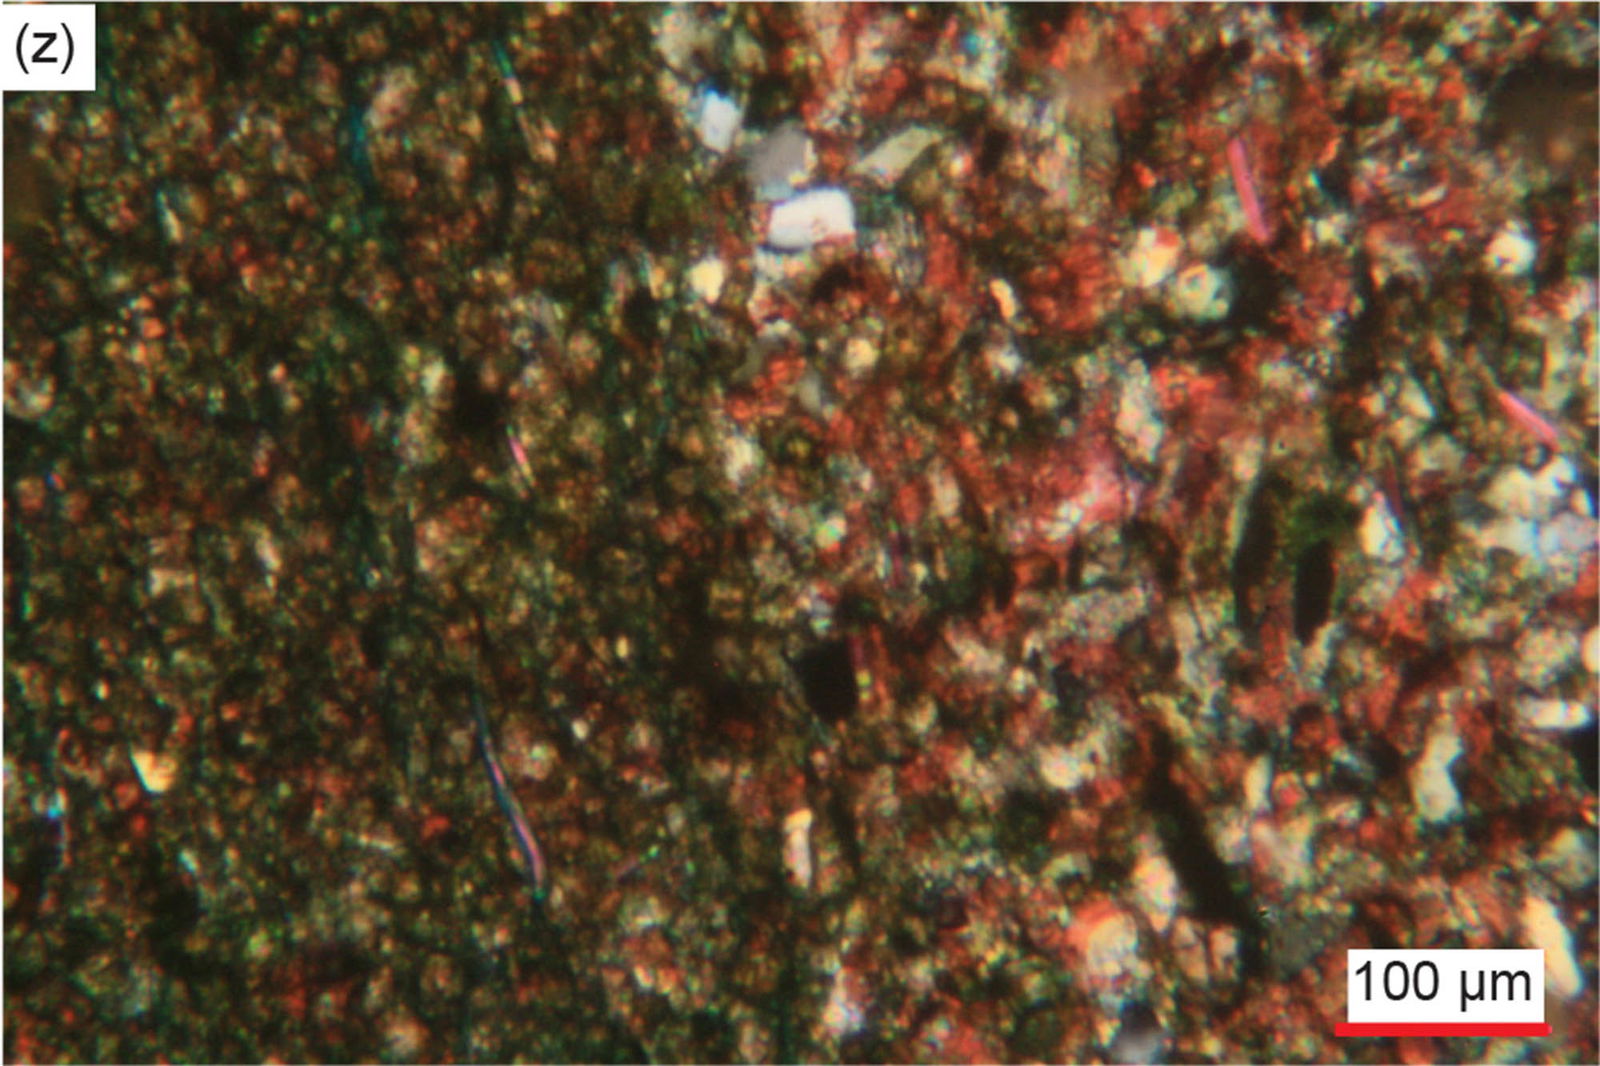
Fig. 27. The extinction under crossed polars within quartz grains of the Muav Formation samples, showing how so few grains have even trivial undulose extinction. Distal samples: (a) MLS-01, (b), (c) MLS-02, (d), (e) MLS-03. Matkatamiba fold samples: (f) MFML-01, (g), (h) MFML-2, (i), (j) MFML-03, (k), (l) MFML-04, (m), (n) MFML-05, (o), (p) MFML-06, (q), (r) MFTB-01, (s), (t) MFTB-02, (u), (v) MFTB-03, (w), (x) MFTB-04, (y) MFTB-05, and (z) MFTB-06.
Original detrital K-feldspar grains are also present in all the samples (fig. 28), ranging from 0.9% to 26.3% (table 2). They are generally tiny to very small, though in some samples there are also some small grains. They are mostly sub-angular to sub-rounded, though a few are rounded, and some are angular fragments or sub-euhedral former laths. Sometimes the K-feldspar grains exhibit cross-hatched twinning under crossed polars that is characteristic of microcline, while the others exhibit either striped simple-twinning or a uniform appearance that is characteristic of orthoclase. These variously sized and shaped K-feldspar grains are usually mixed and interspersed with quartz grains, indicative of poor sorting, and are usually scattered and “floating” in the micrite matrix. Where the variously-sized K-feldspar grains are concentrated or more densely-packed with accompanying quartz grains in thin bands and laminae or occasionally are similarly clumped together, the K-feldspar grains are irregularly-shaped and sometimes form triple point junctions with the quartz grains or other K-feldspar grains, likely due to overgrown silica forming a cement in optical continuity with the quartz grains. Some K-feldspar grains have diffuse edges due either to encroaching calcite or illite alteration, while a few of the tiny and very small sub-angular to sub-rounded K-feldspar grains and sub-euhedral former laths appear to be altered by illite to greenish glauconite. Furthermore, in one sample some of the glauconite peloids have internal/central inclusions of tiny K-feldspar grains around which the glauconite was deposited.
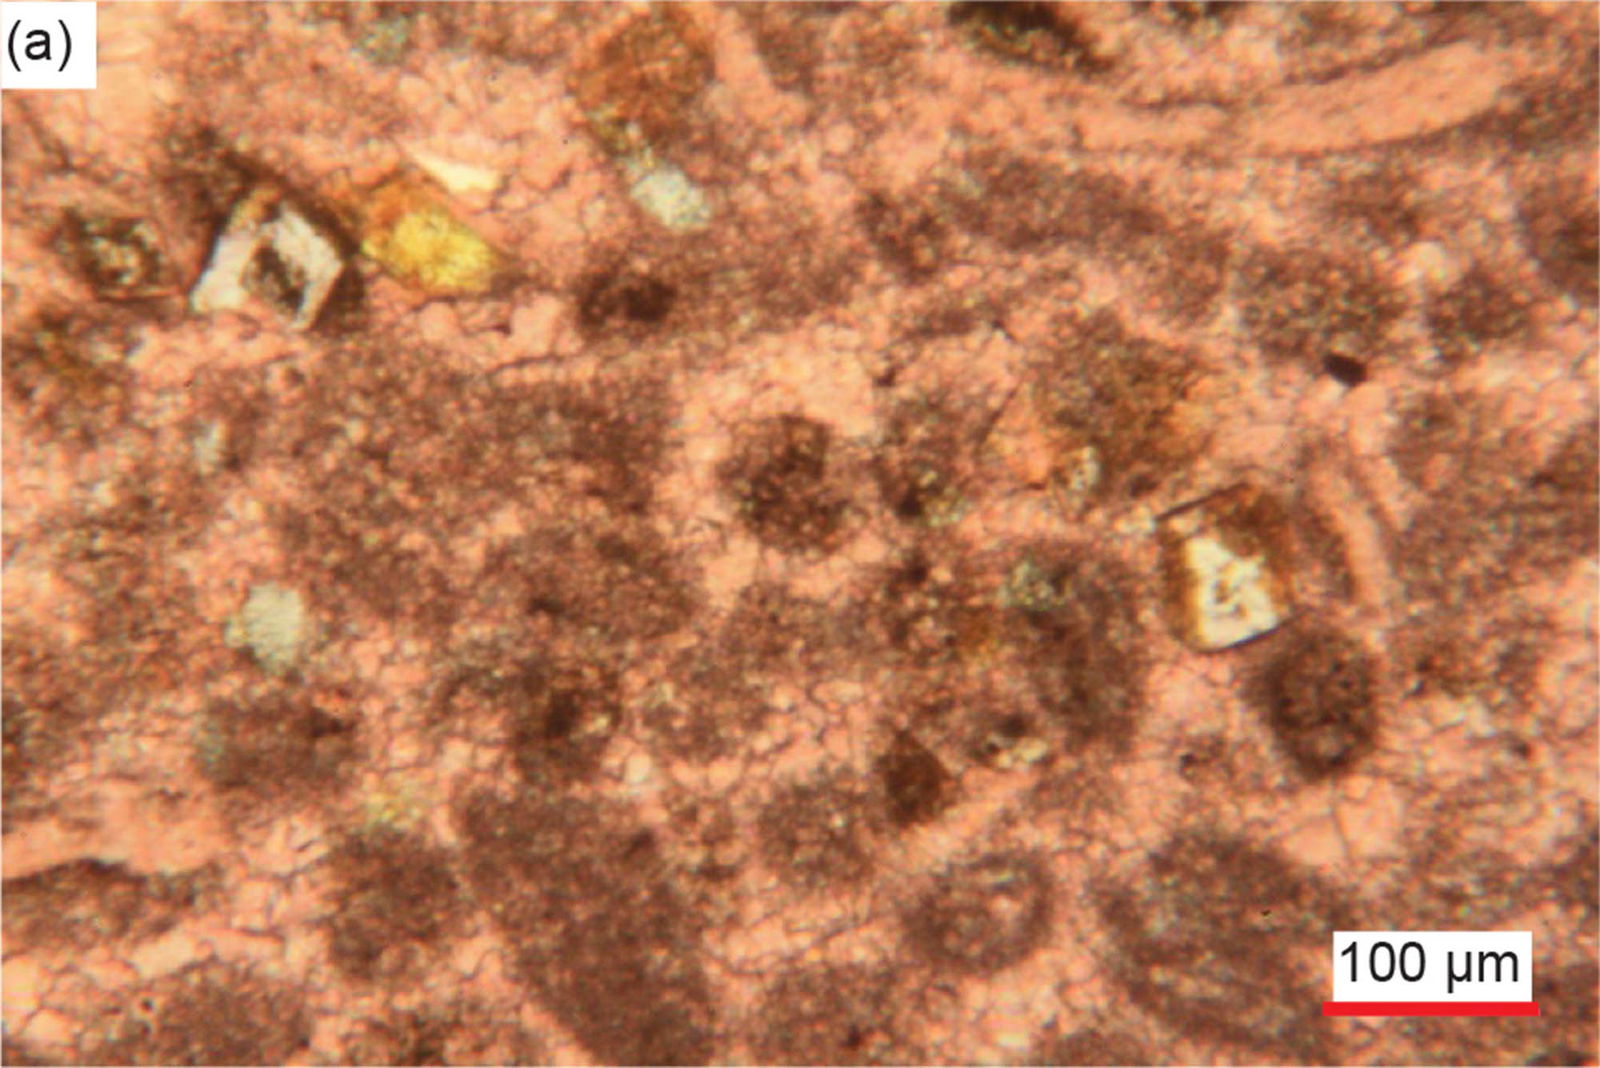
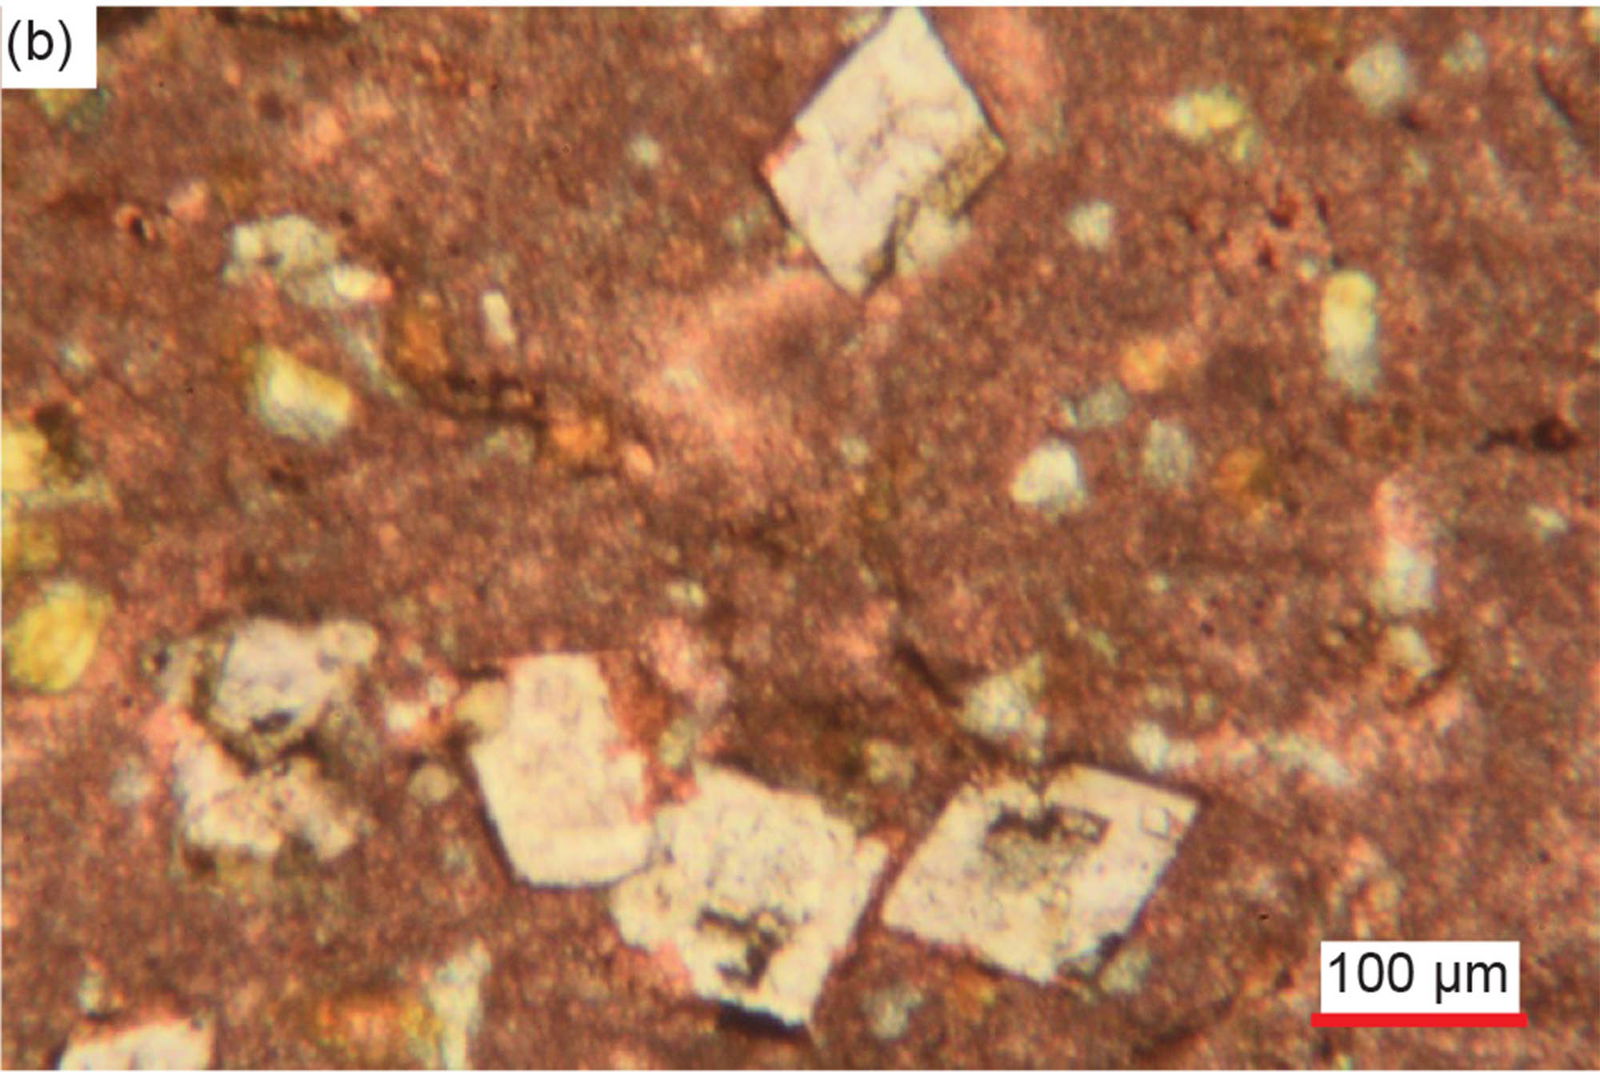
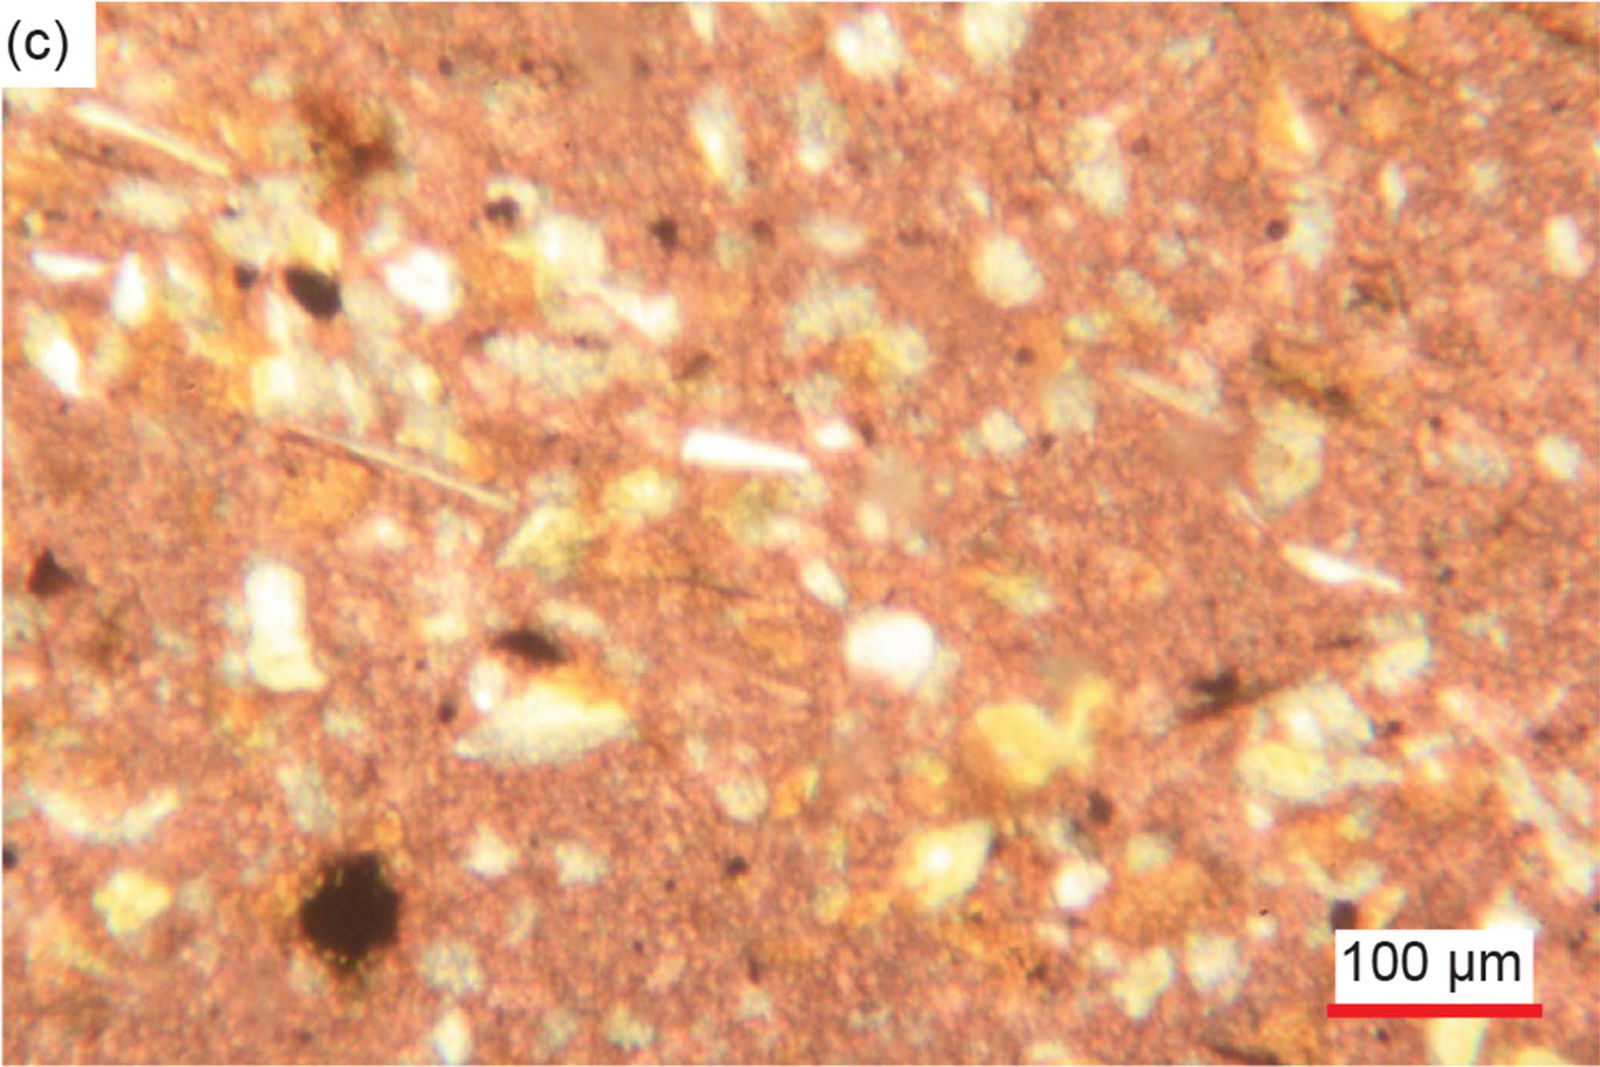
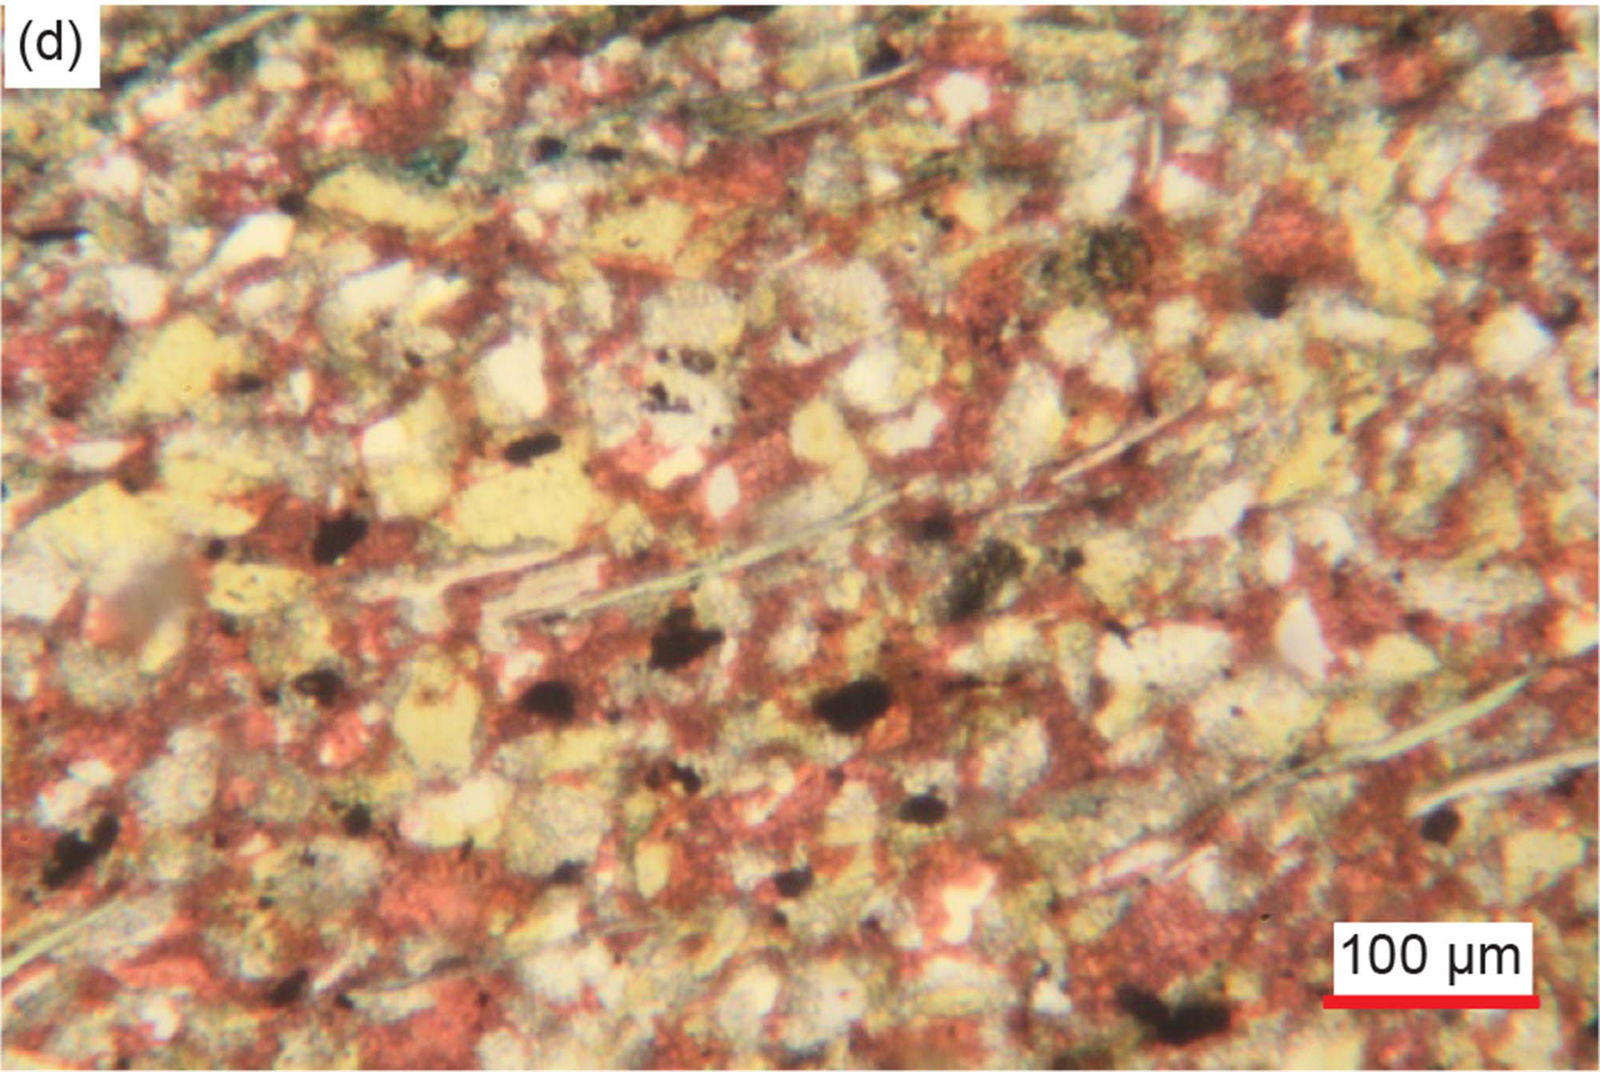
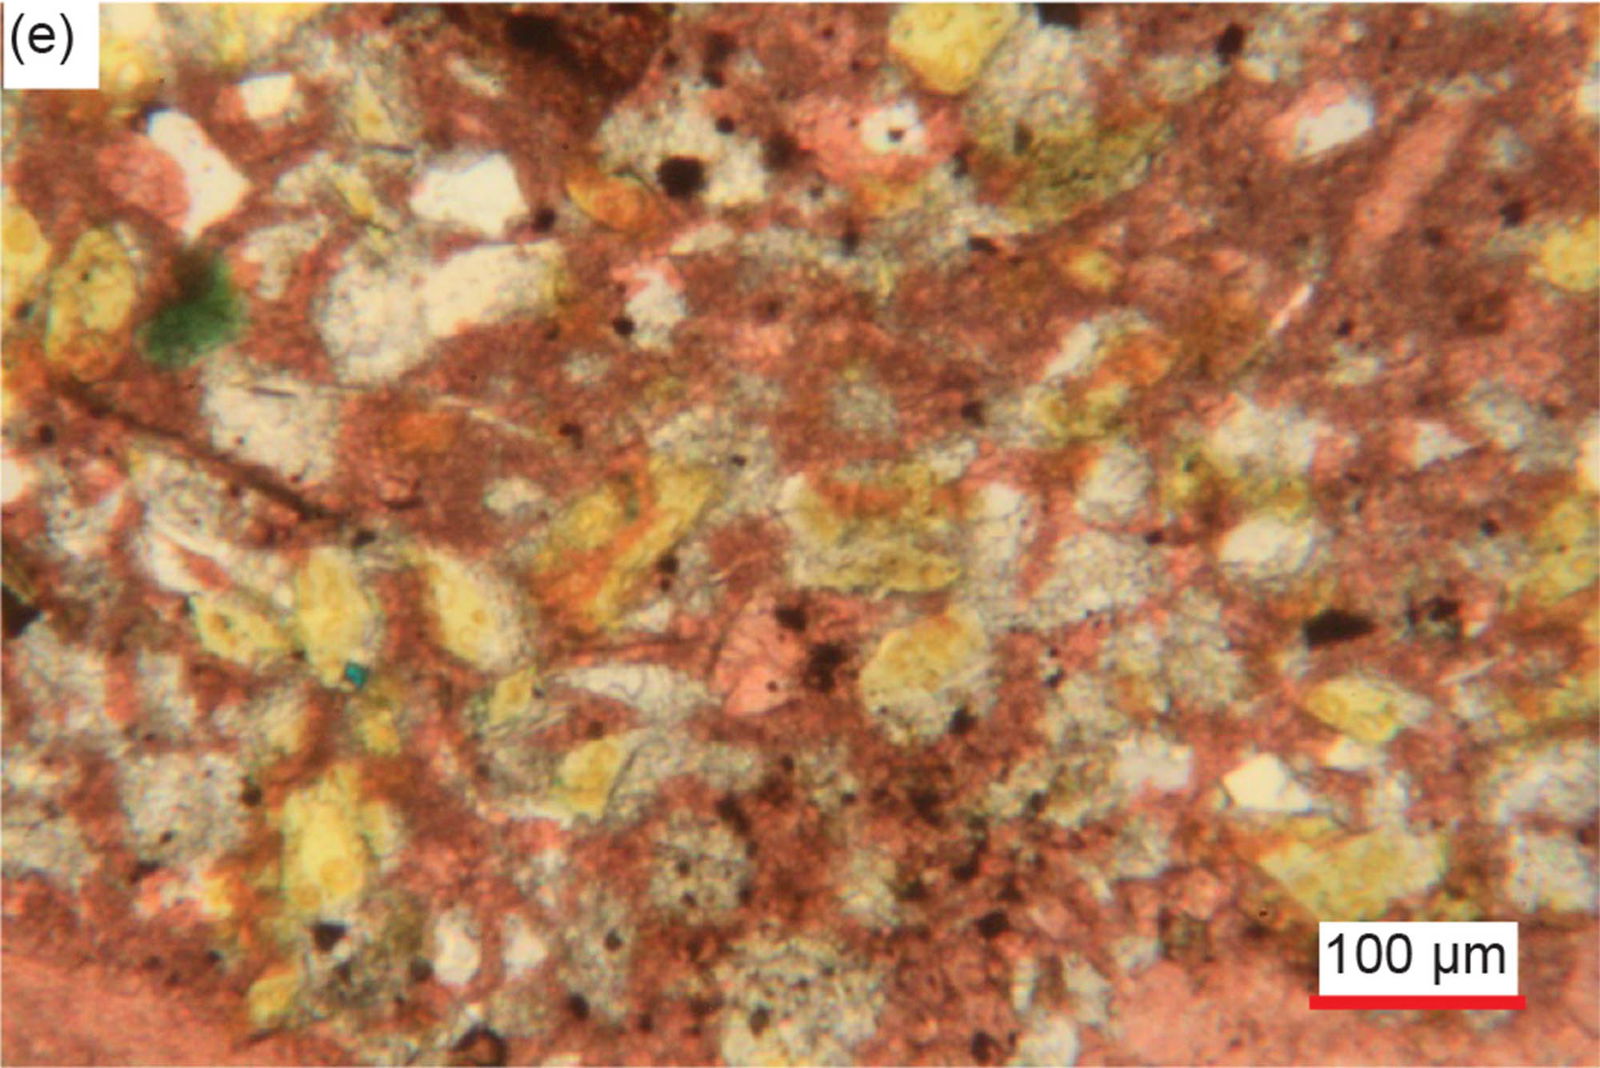
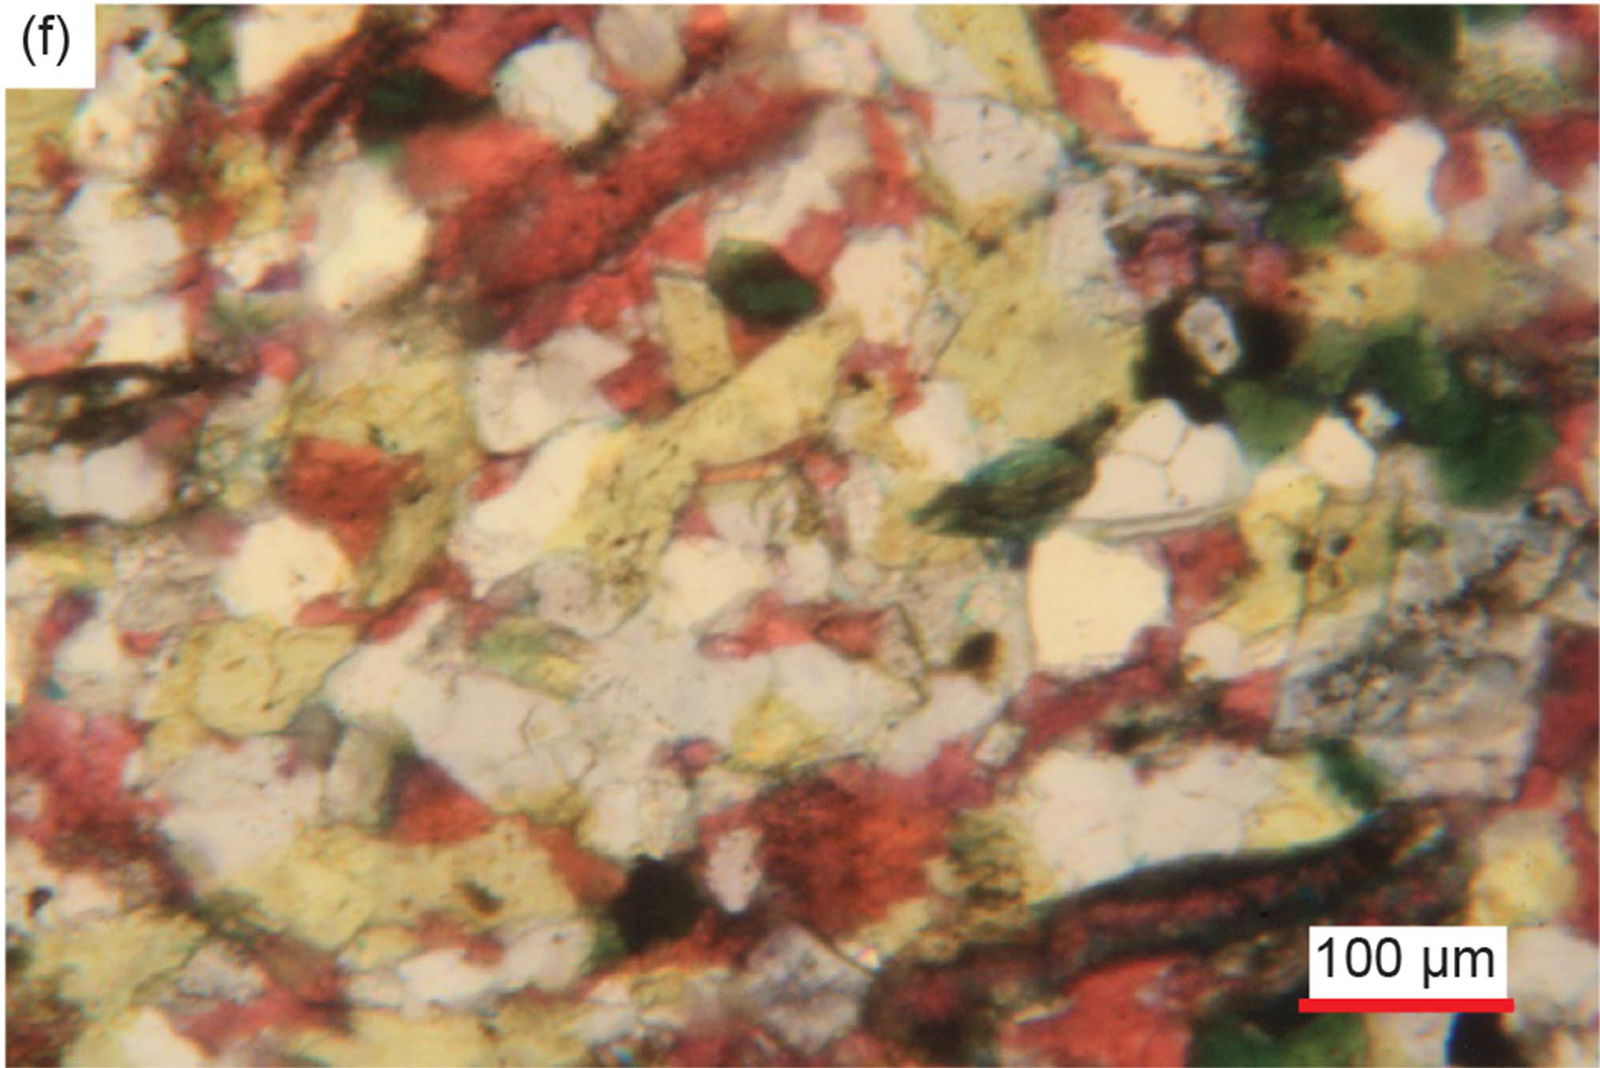
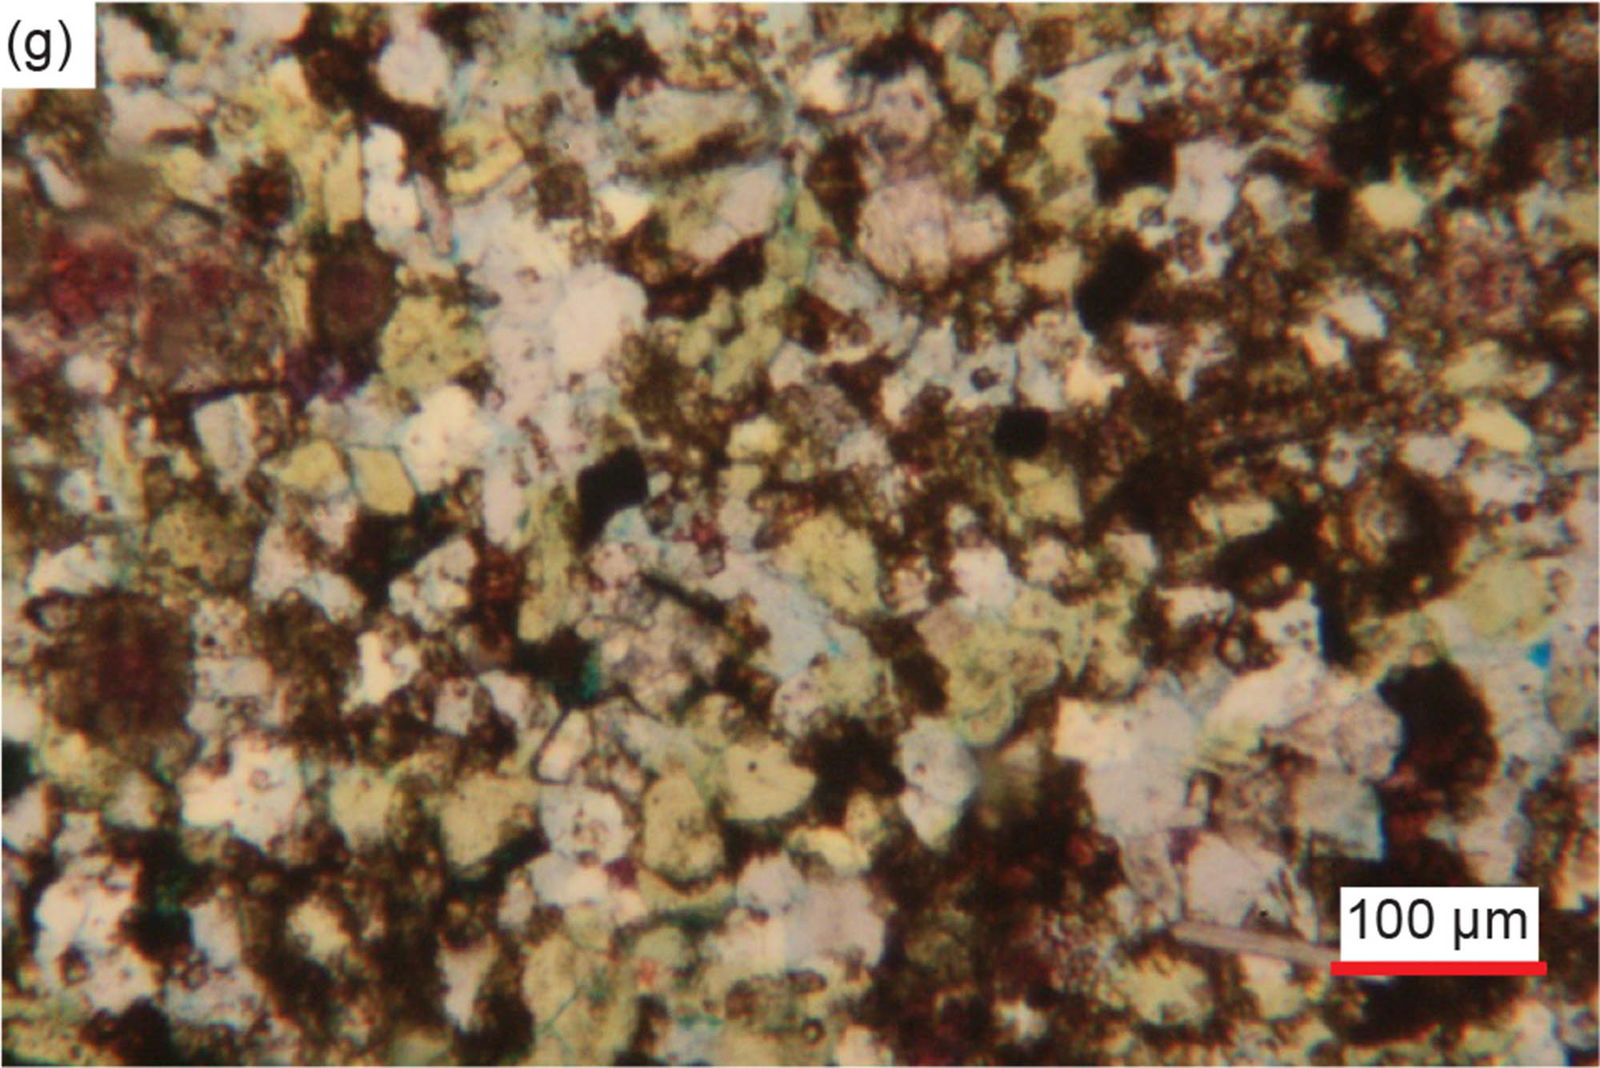
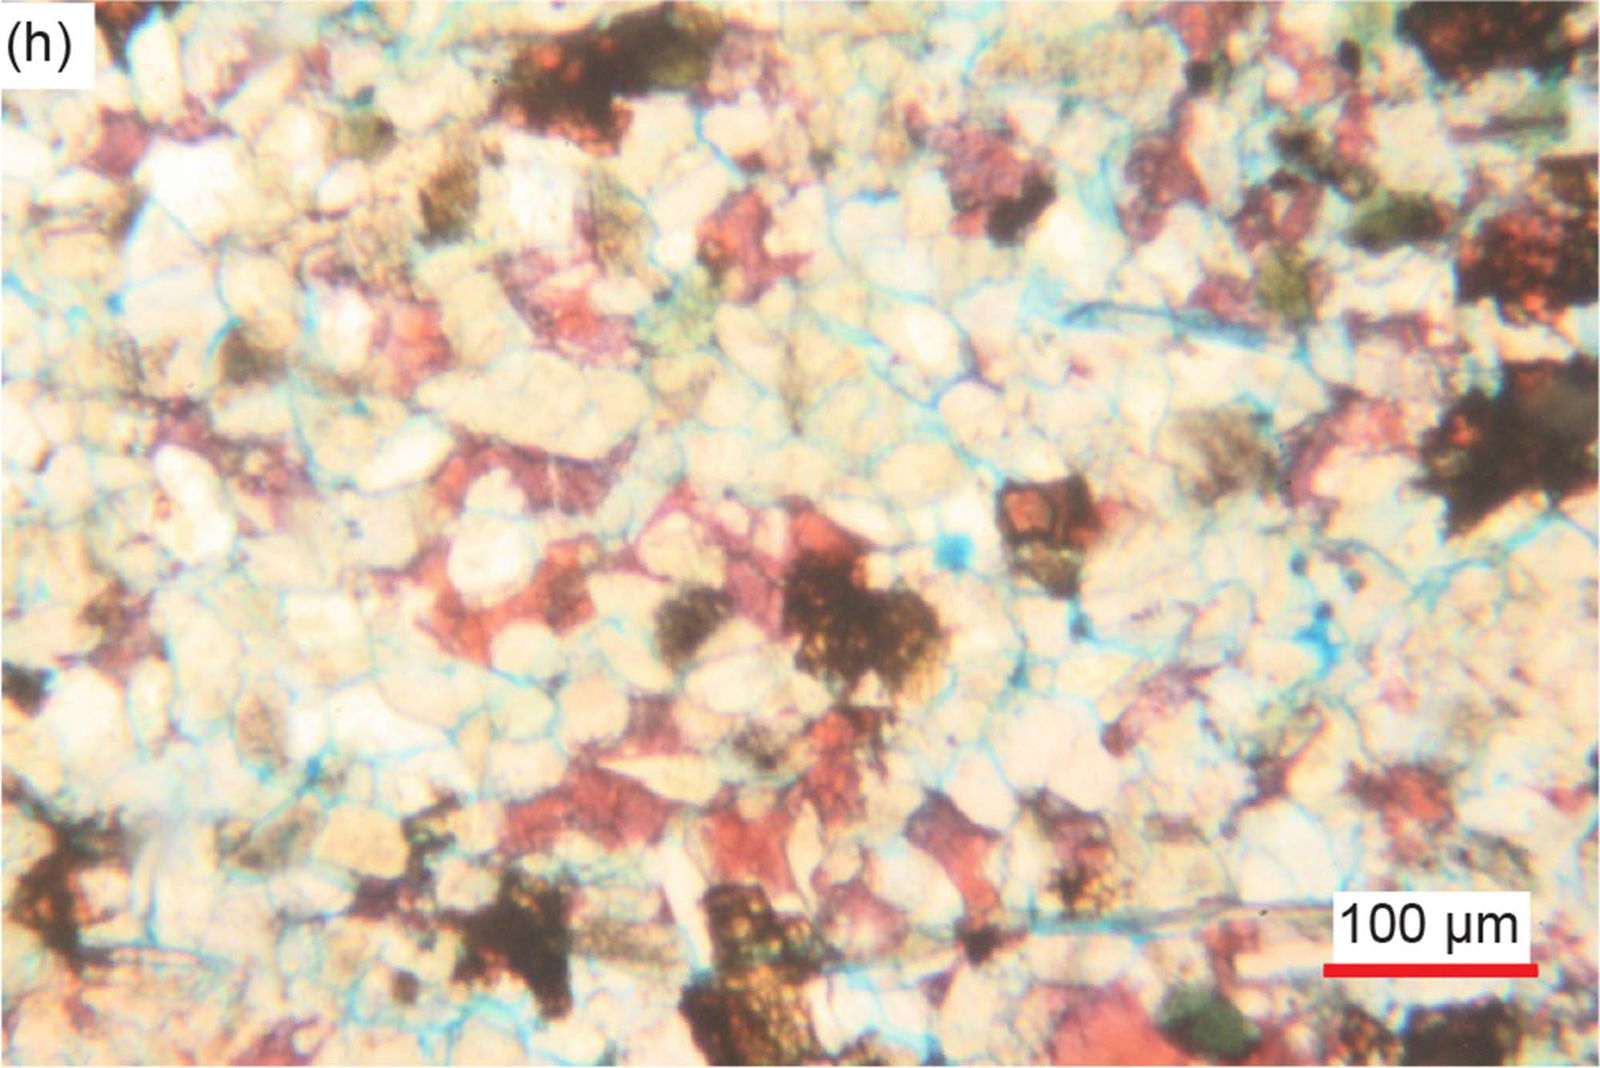
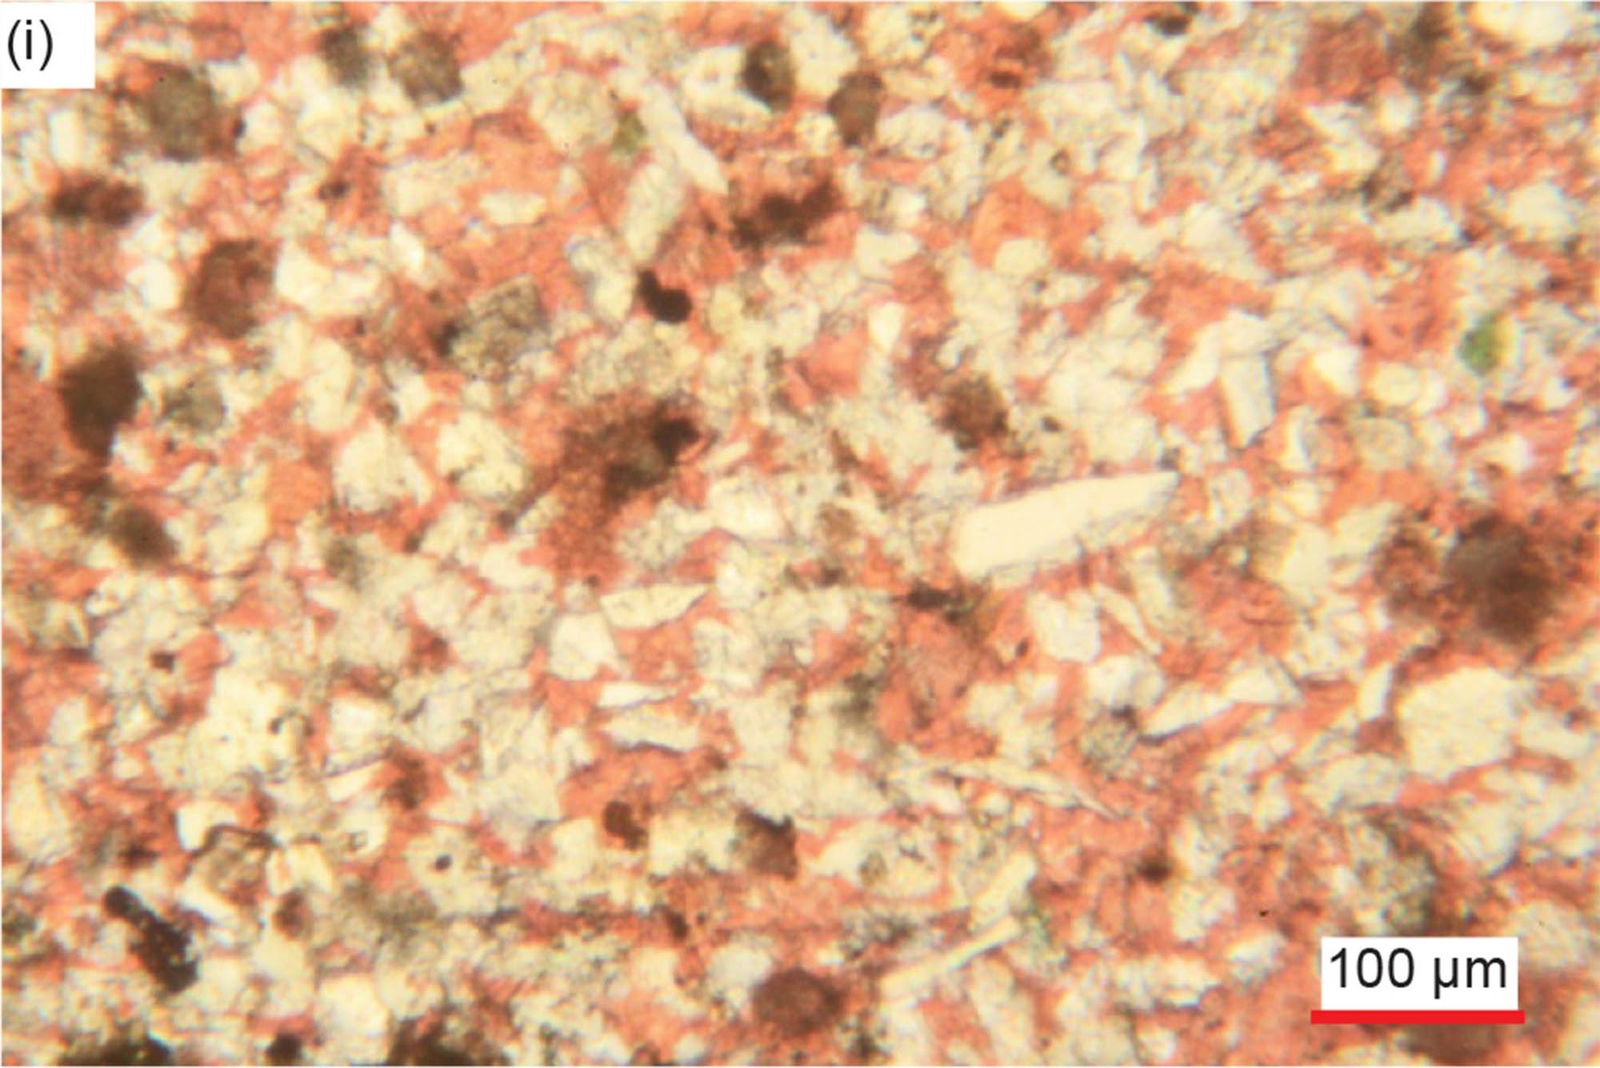
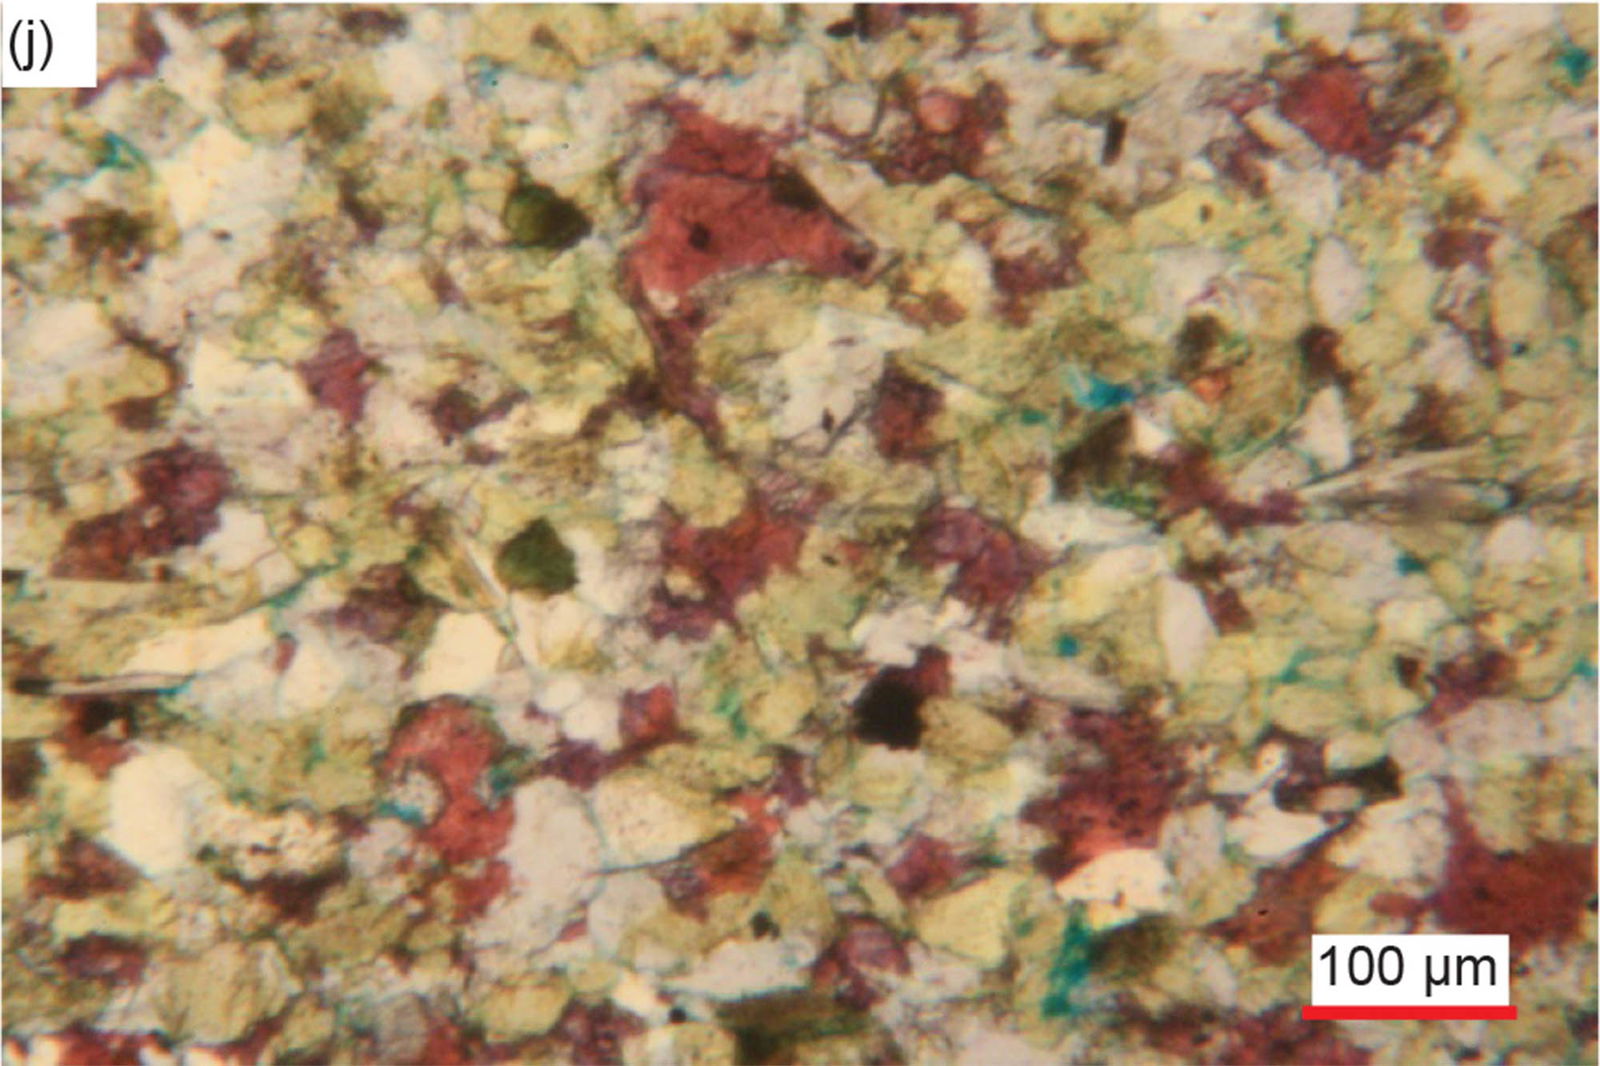
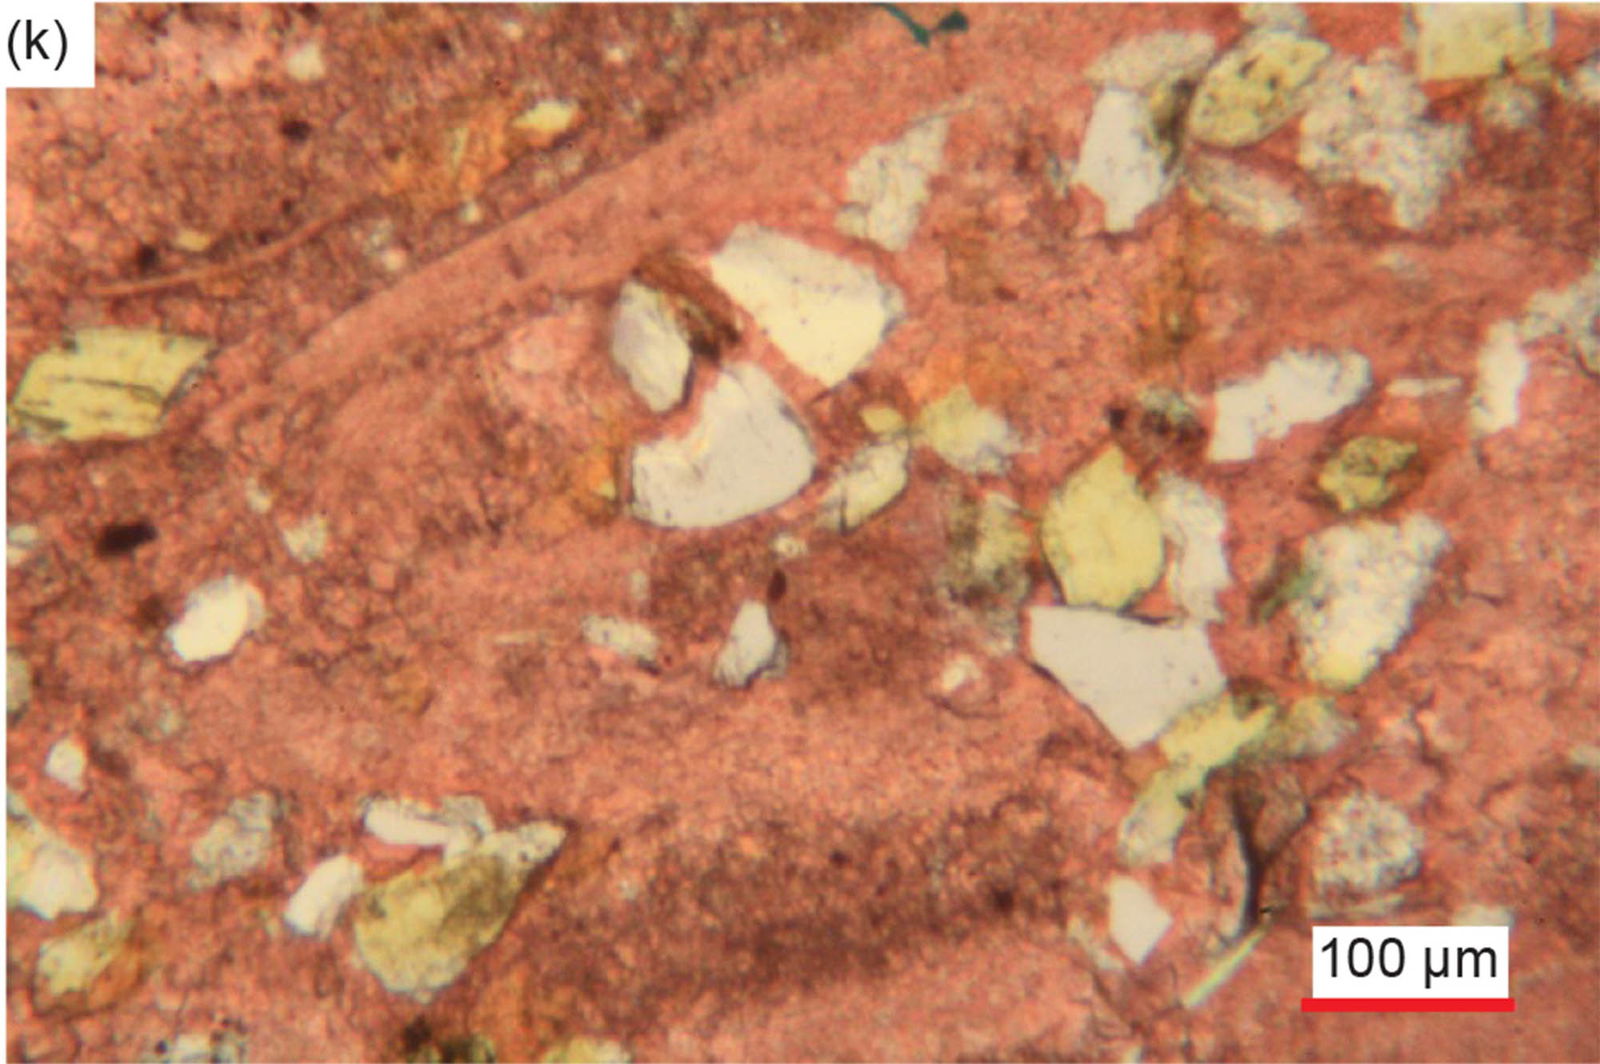
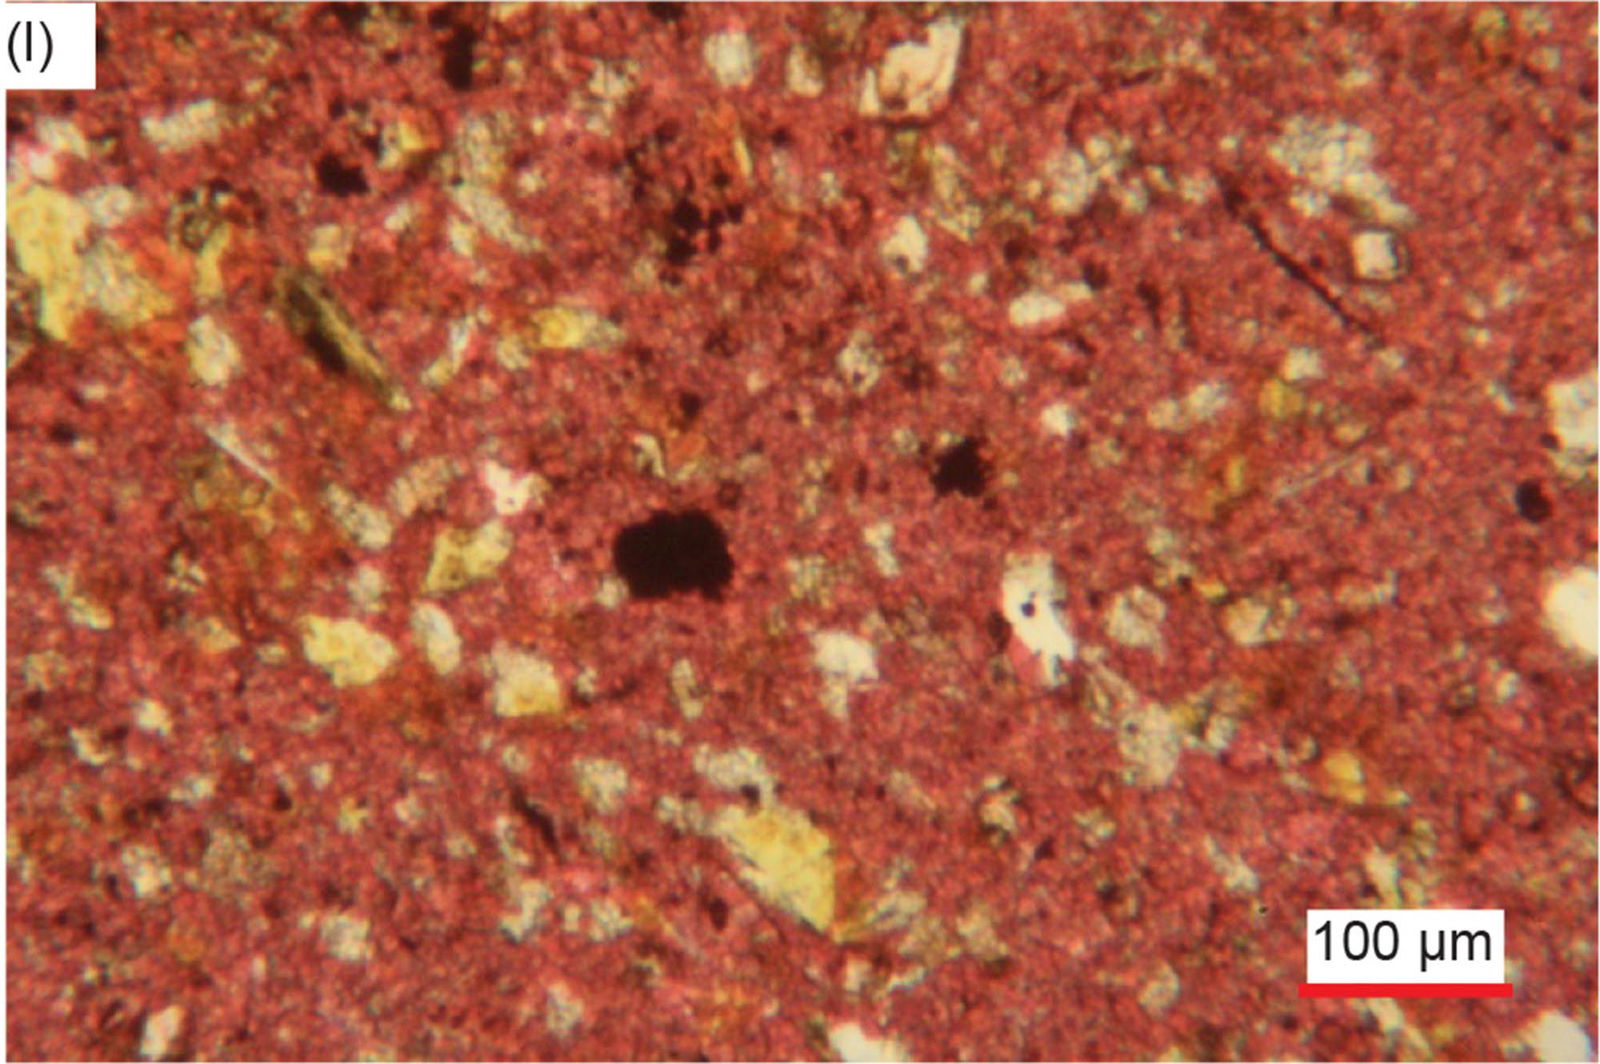
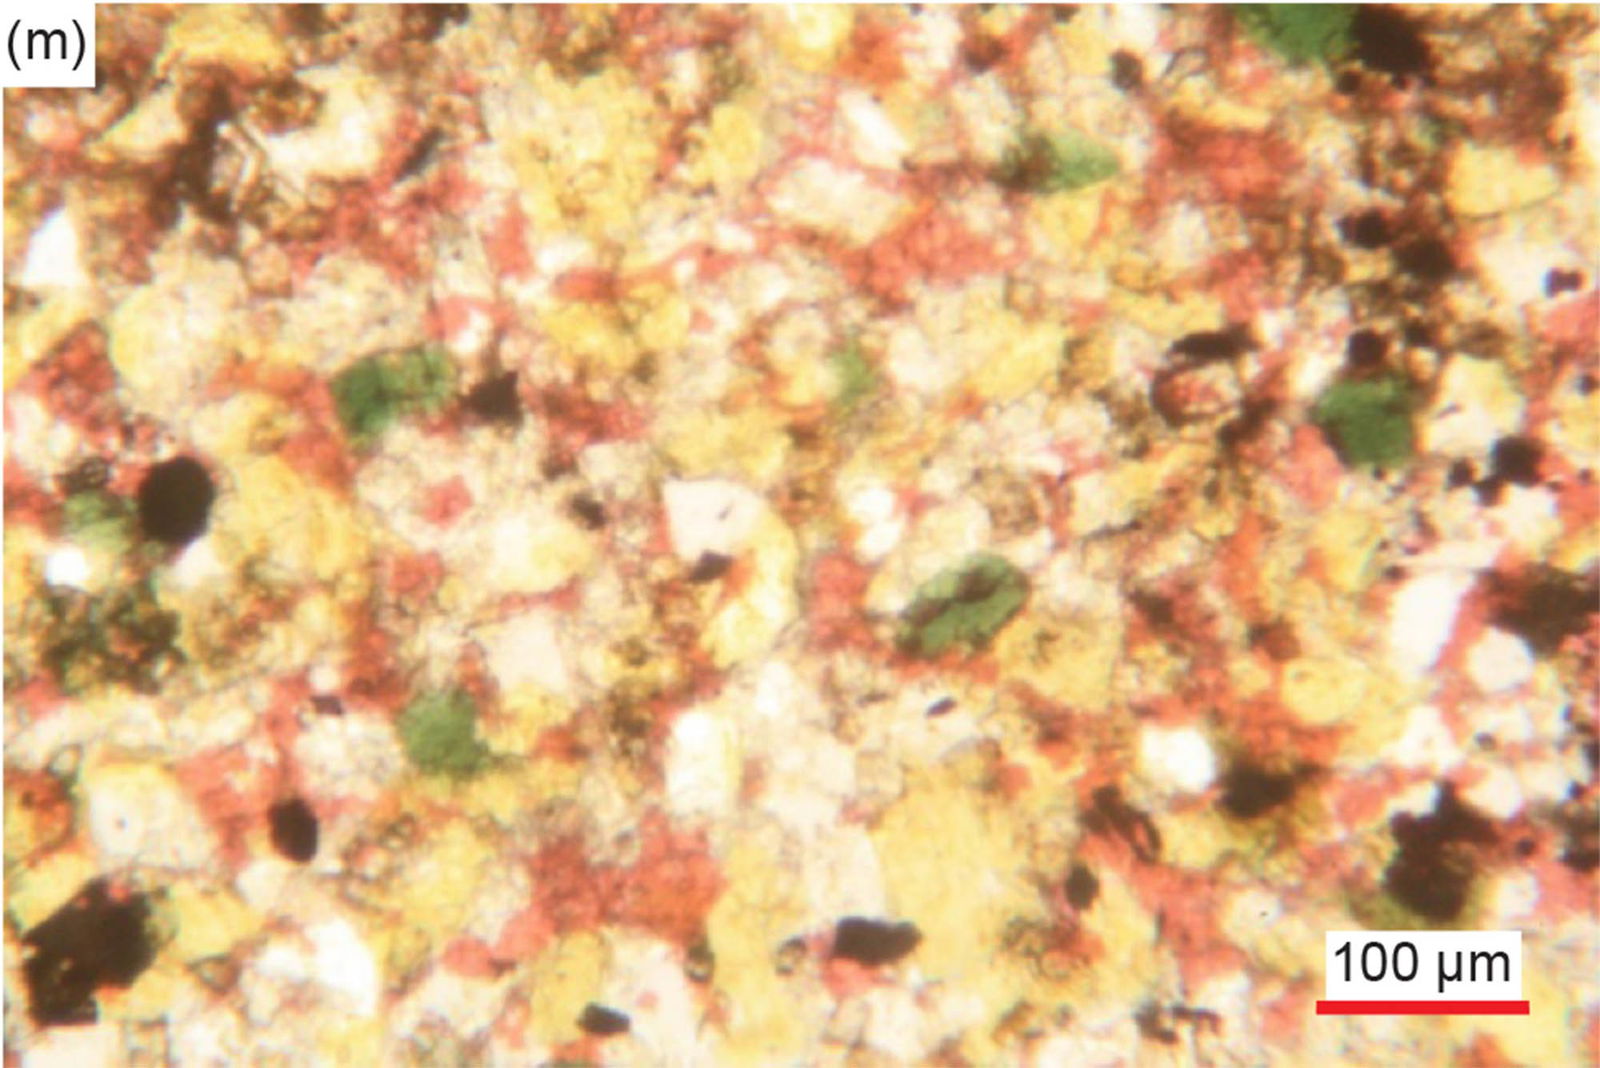
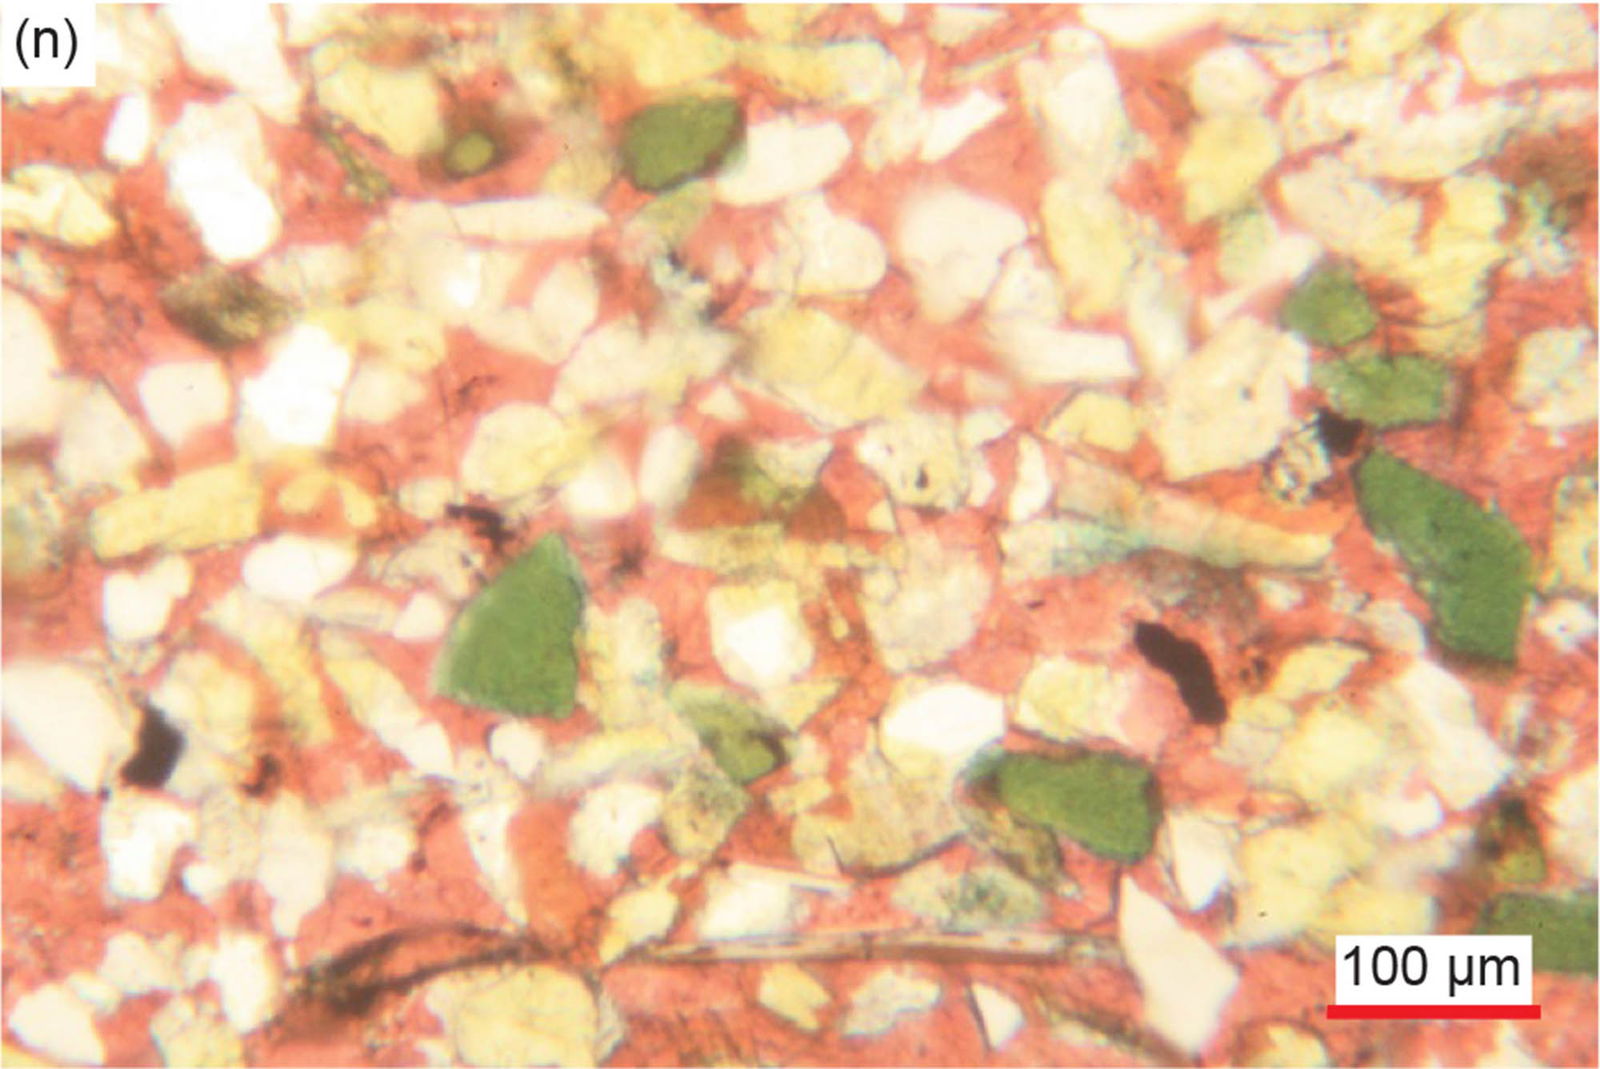
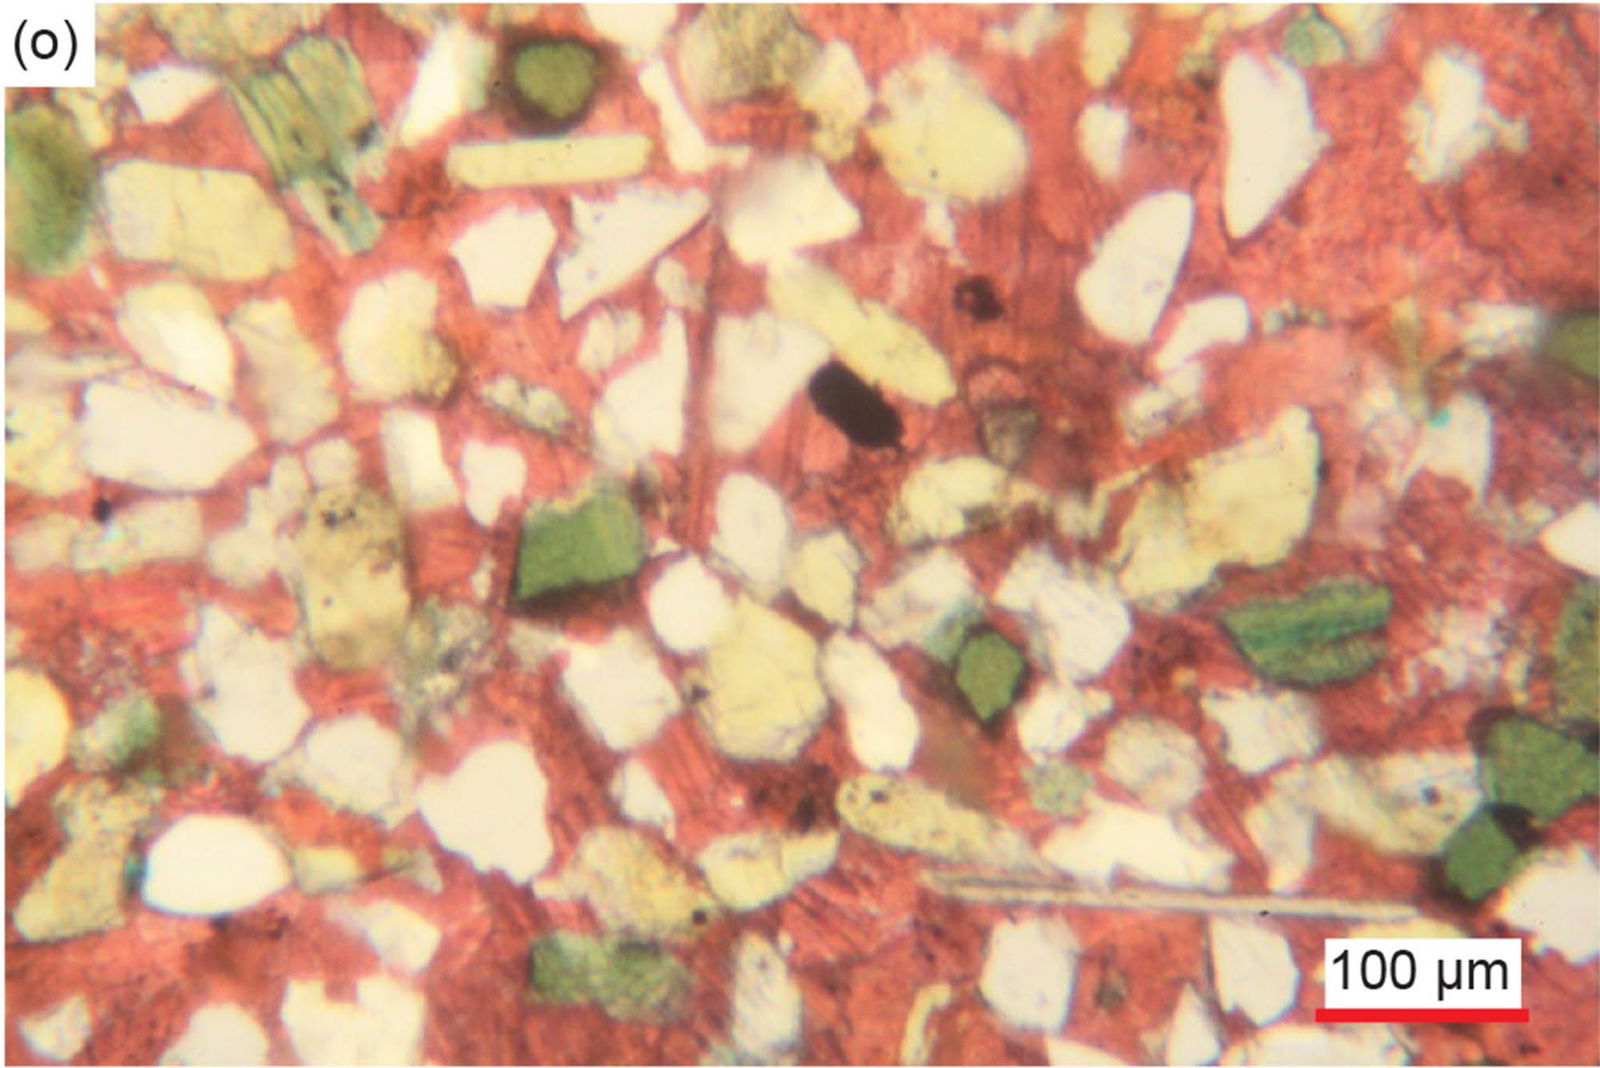
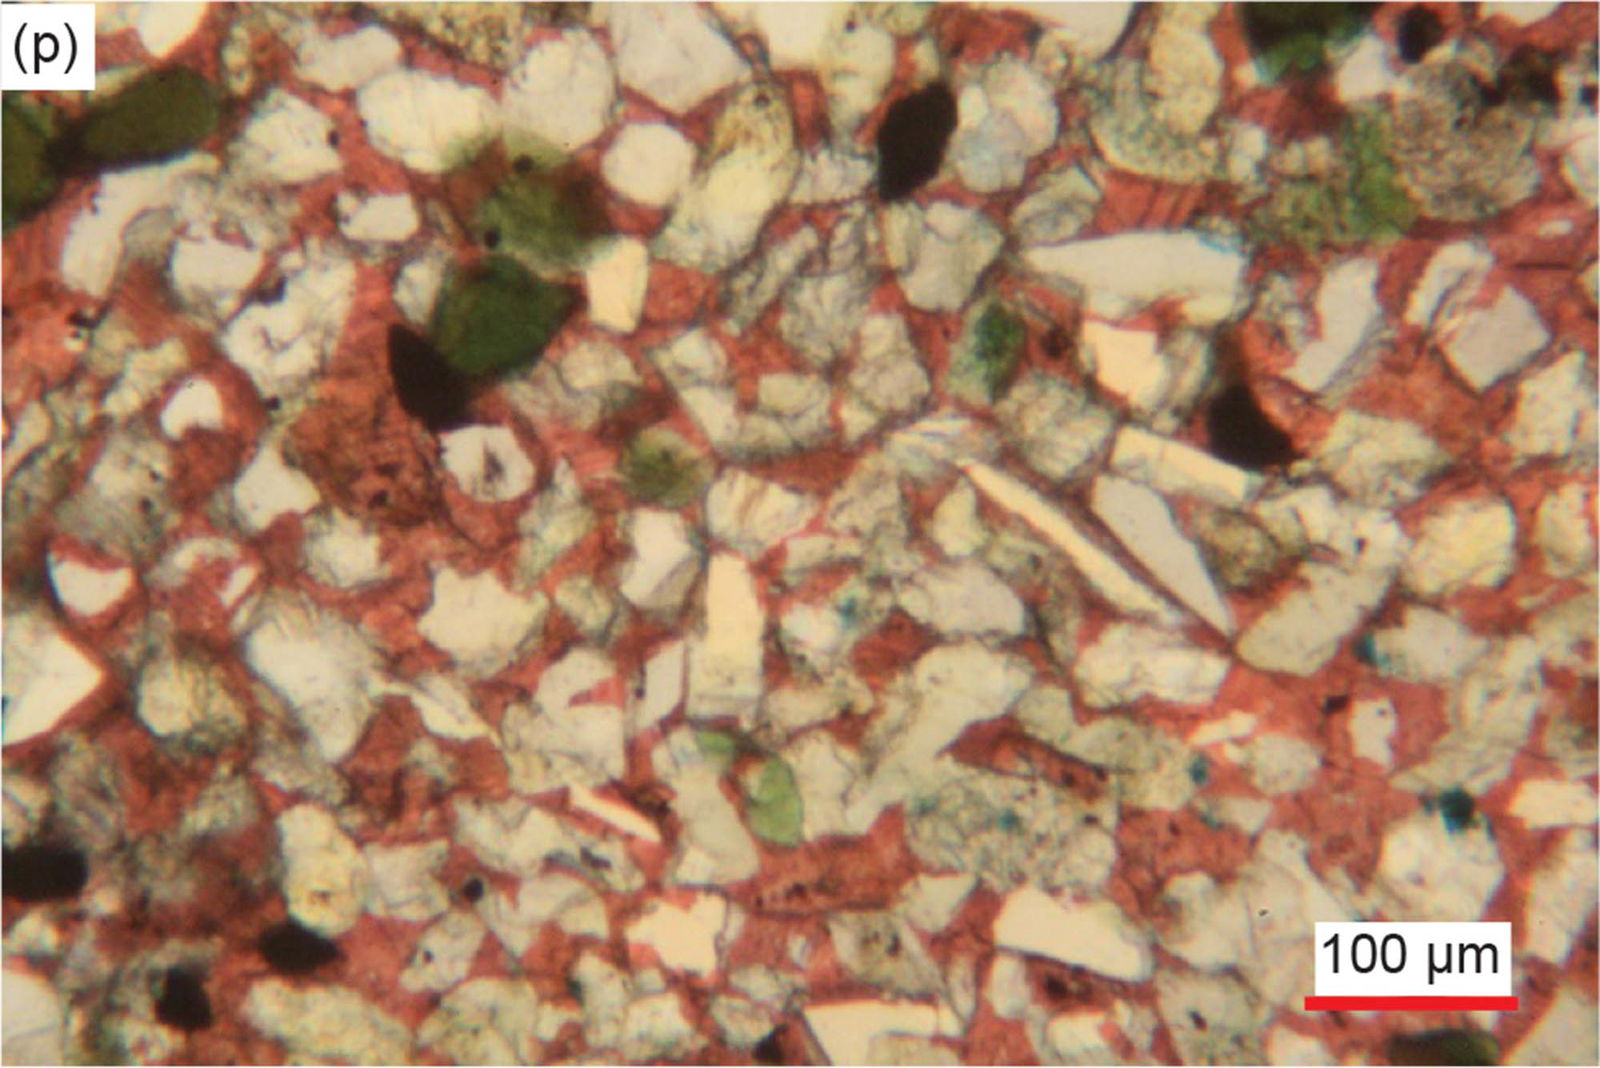
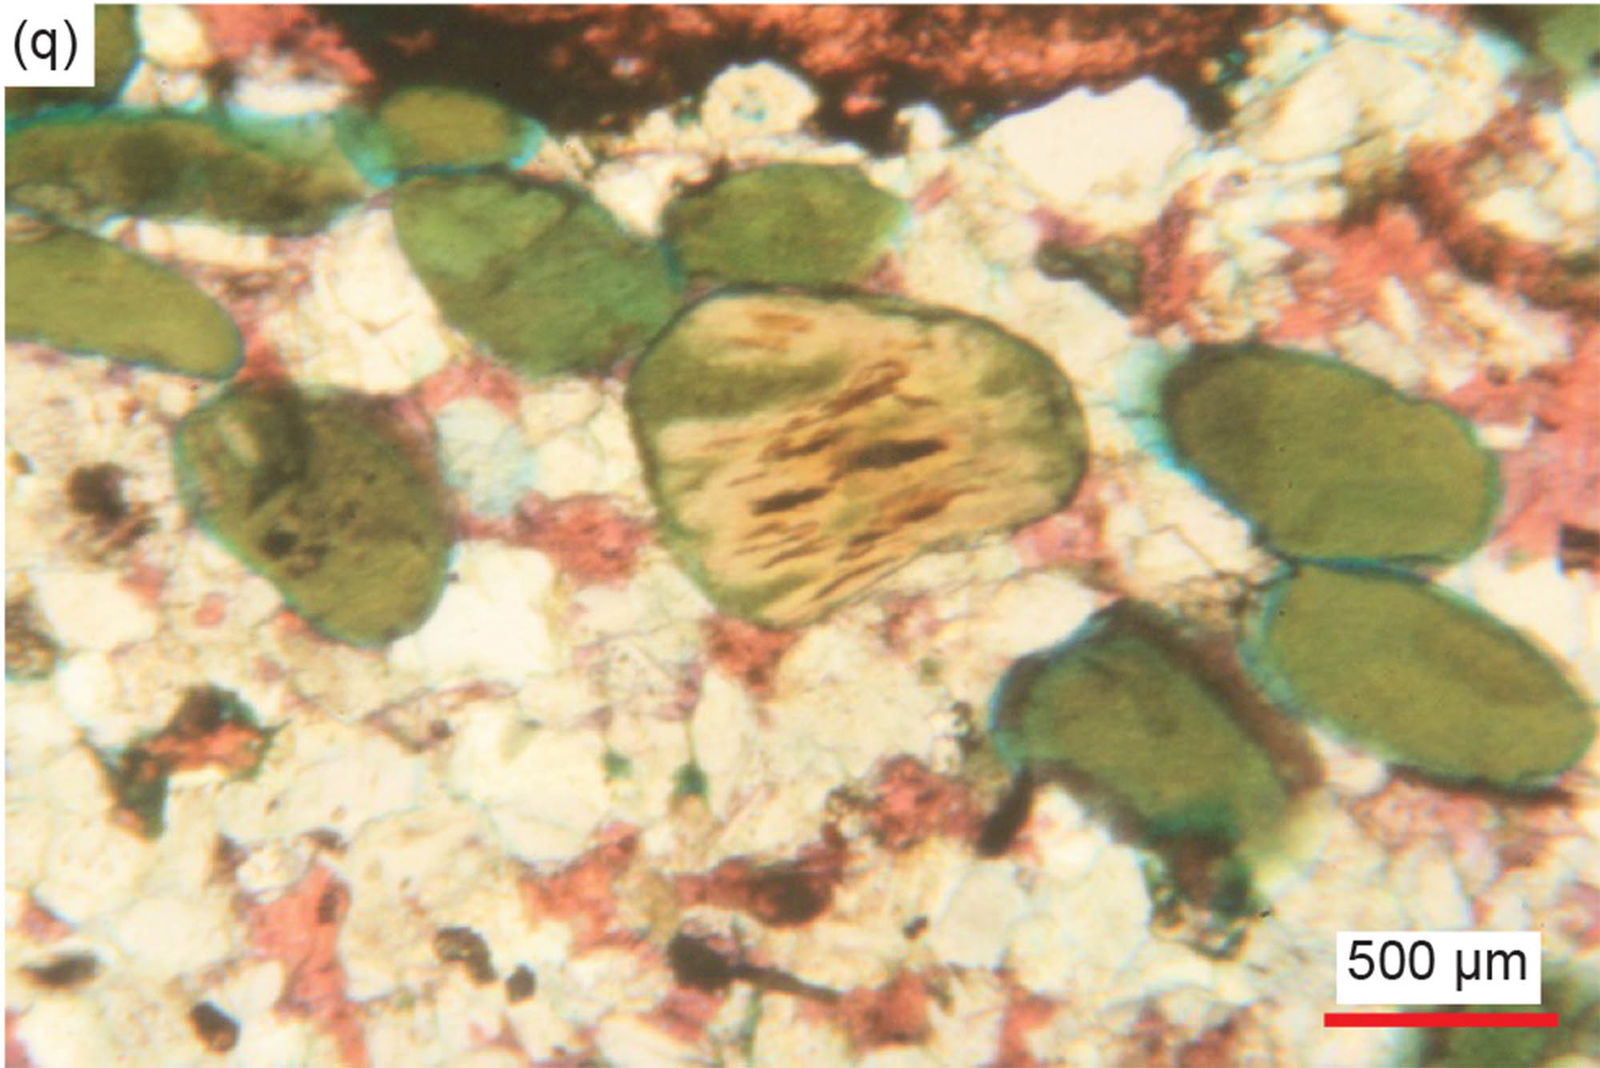
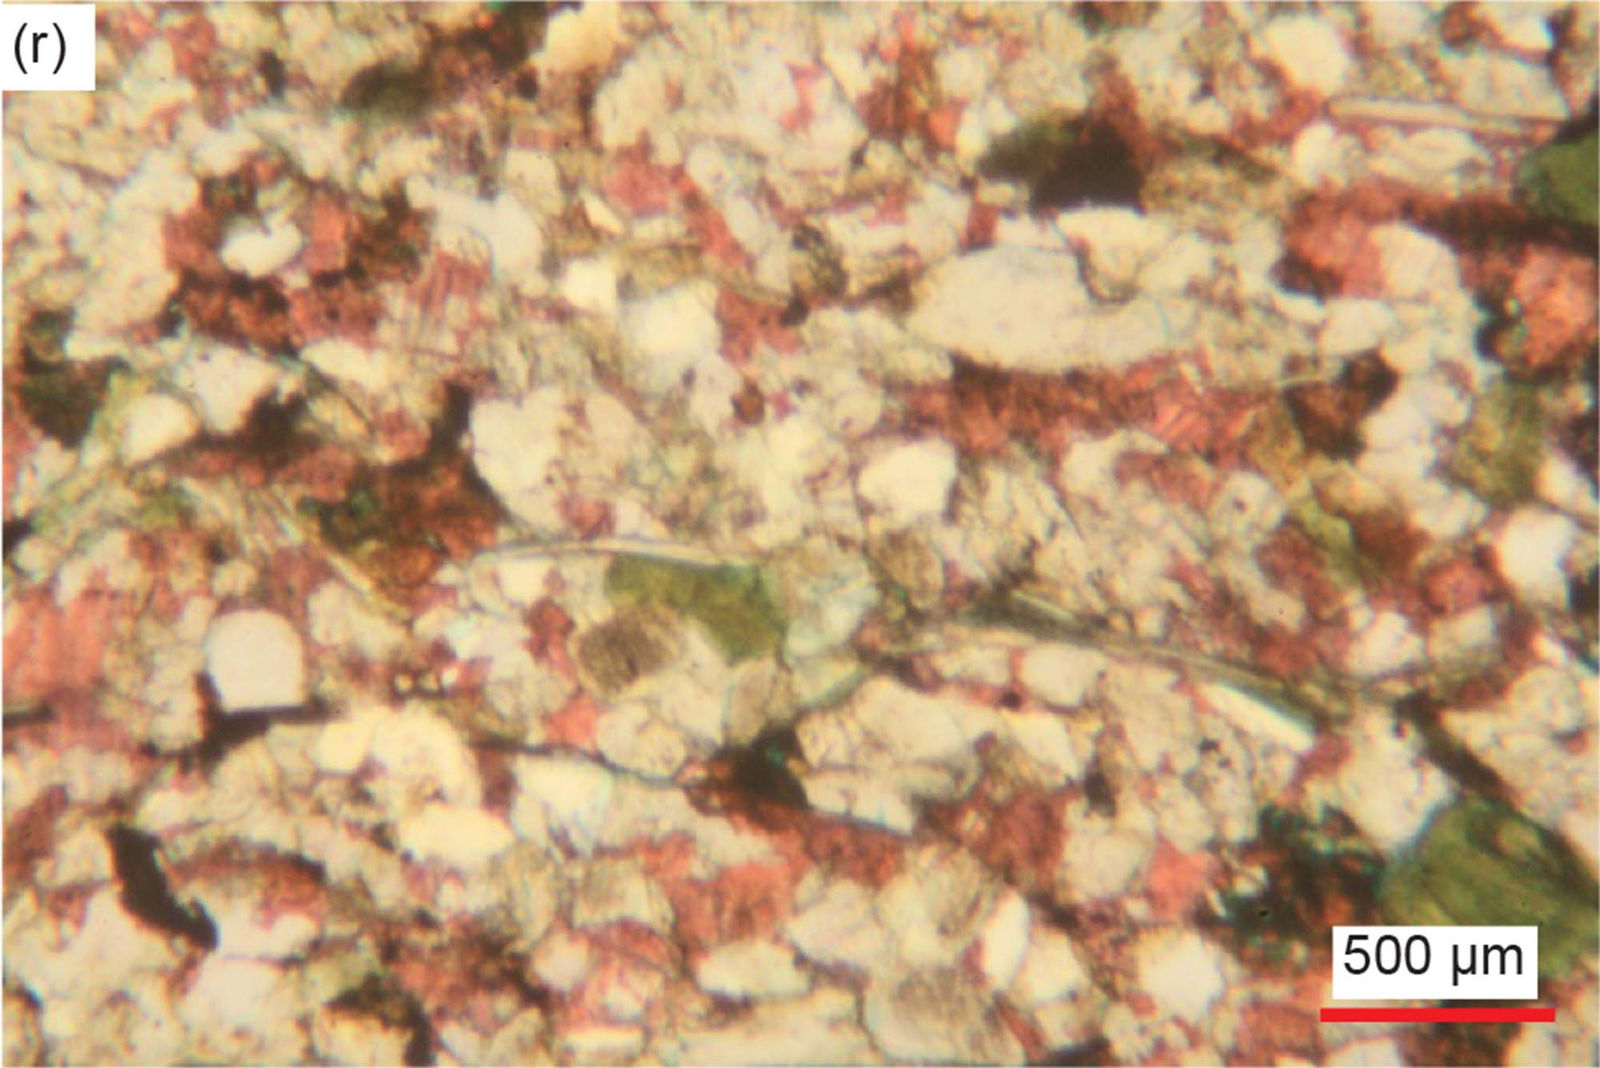
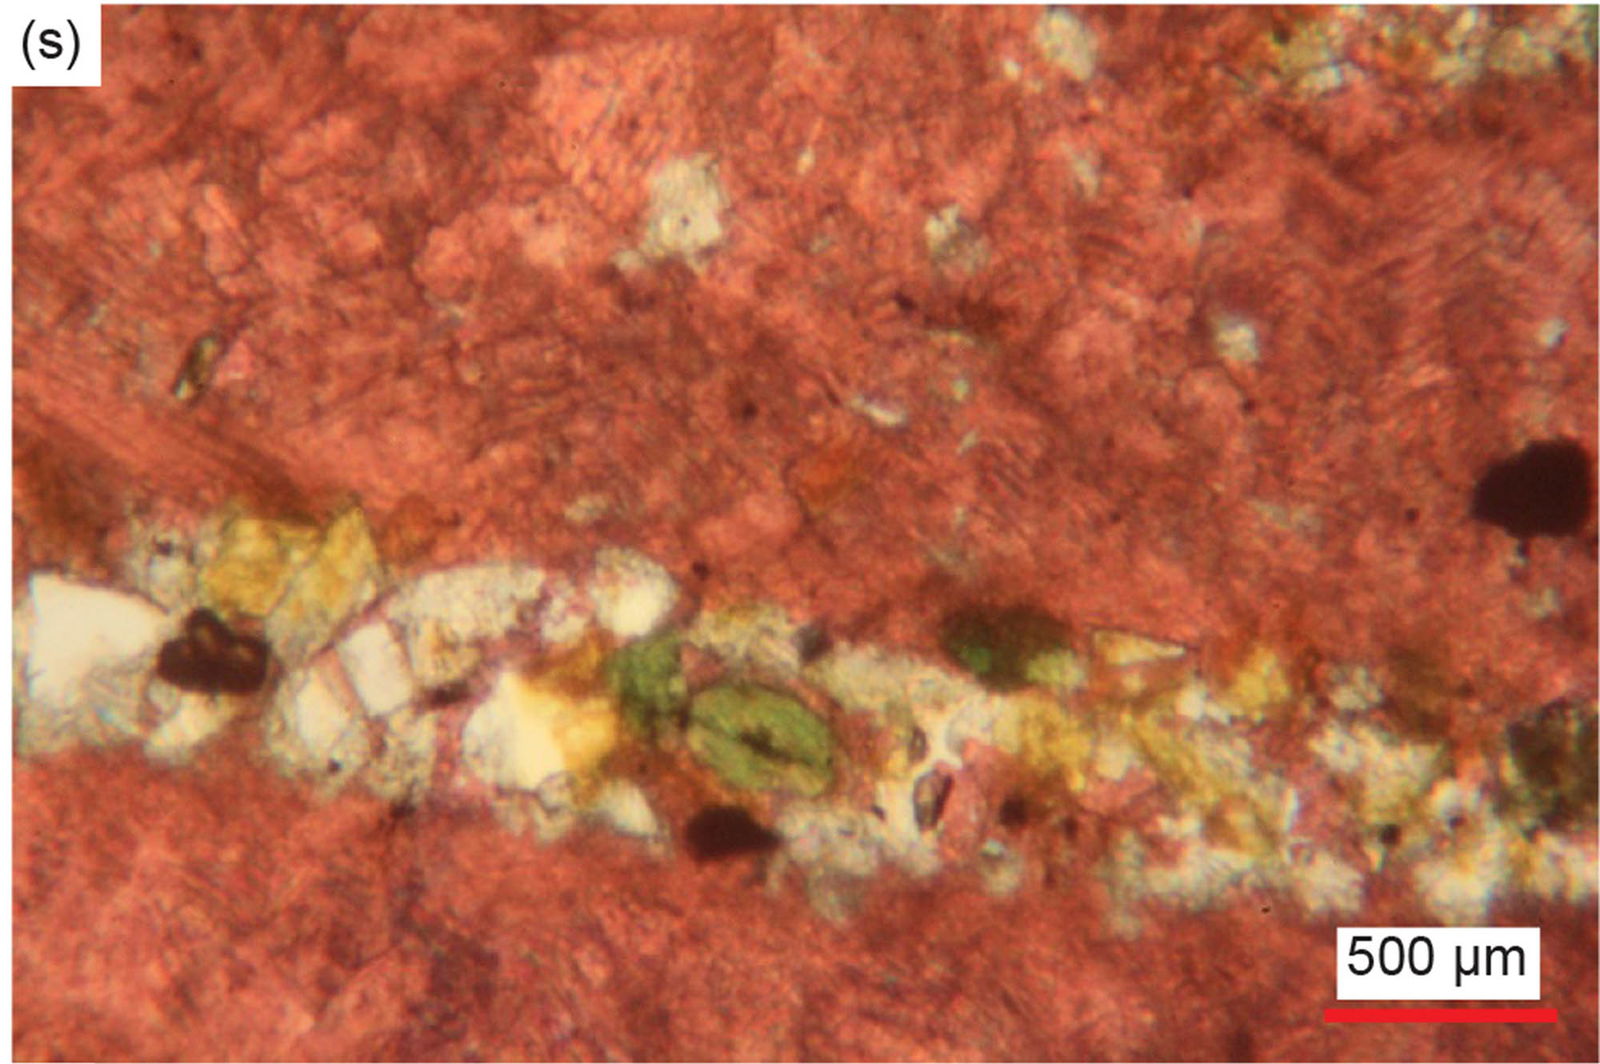
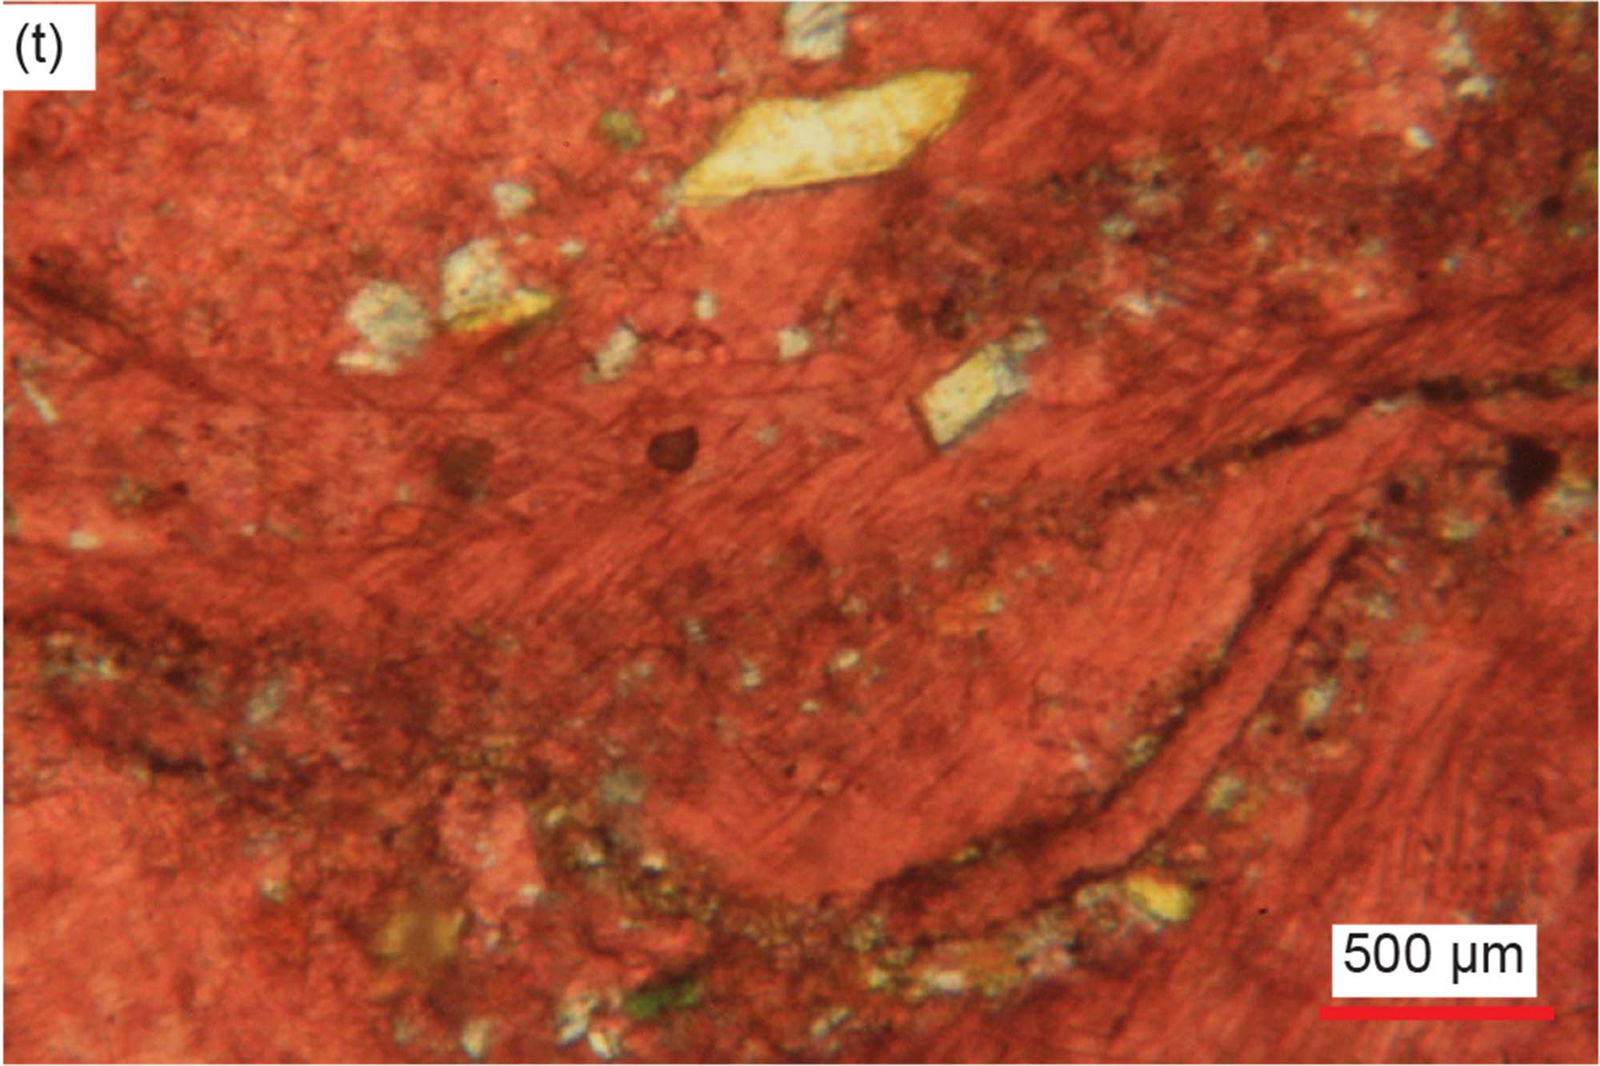
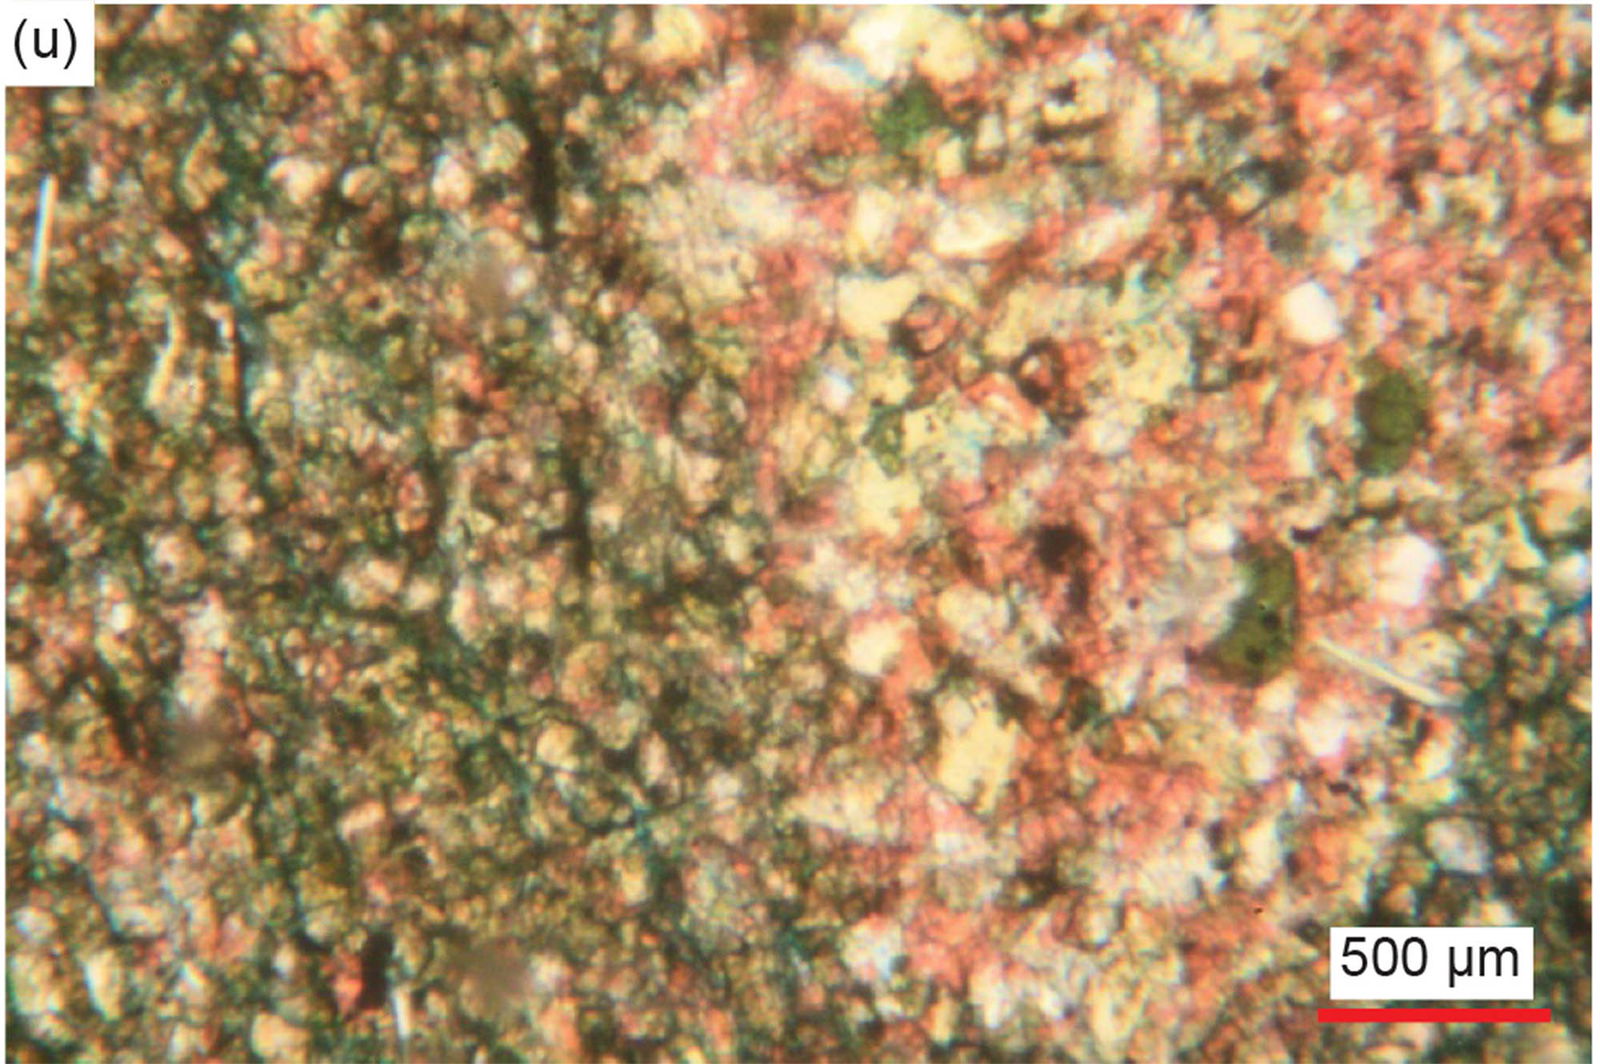
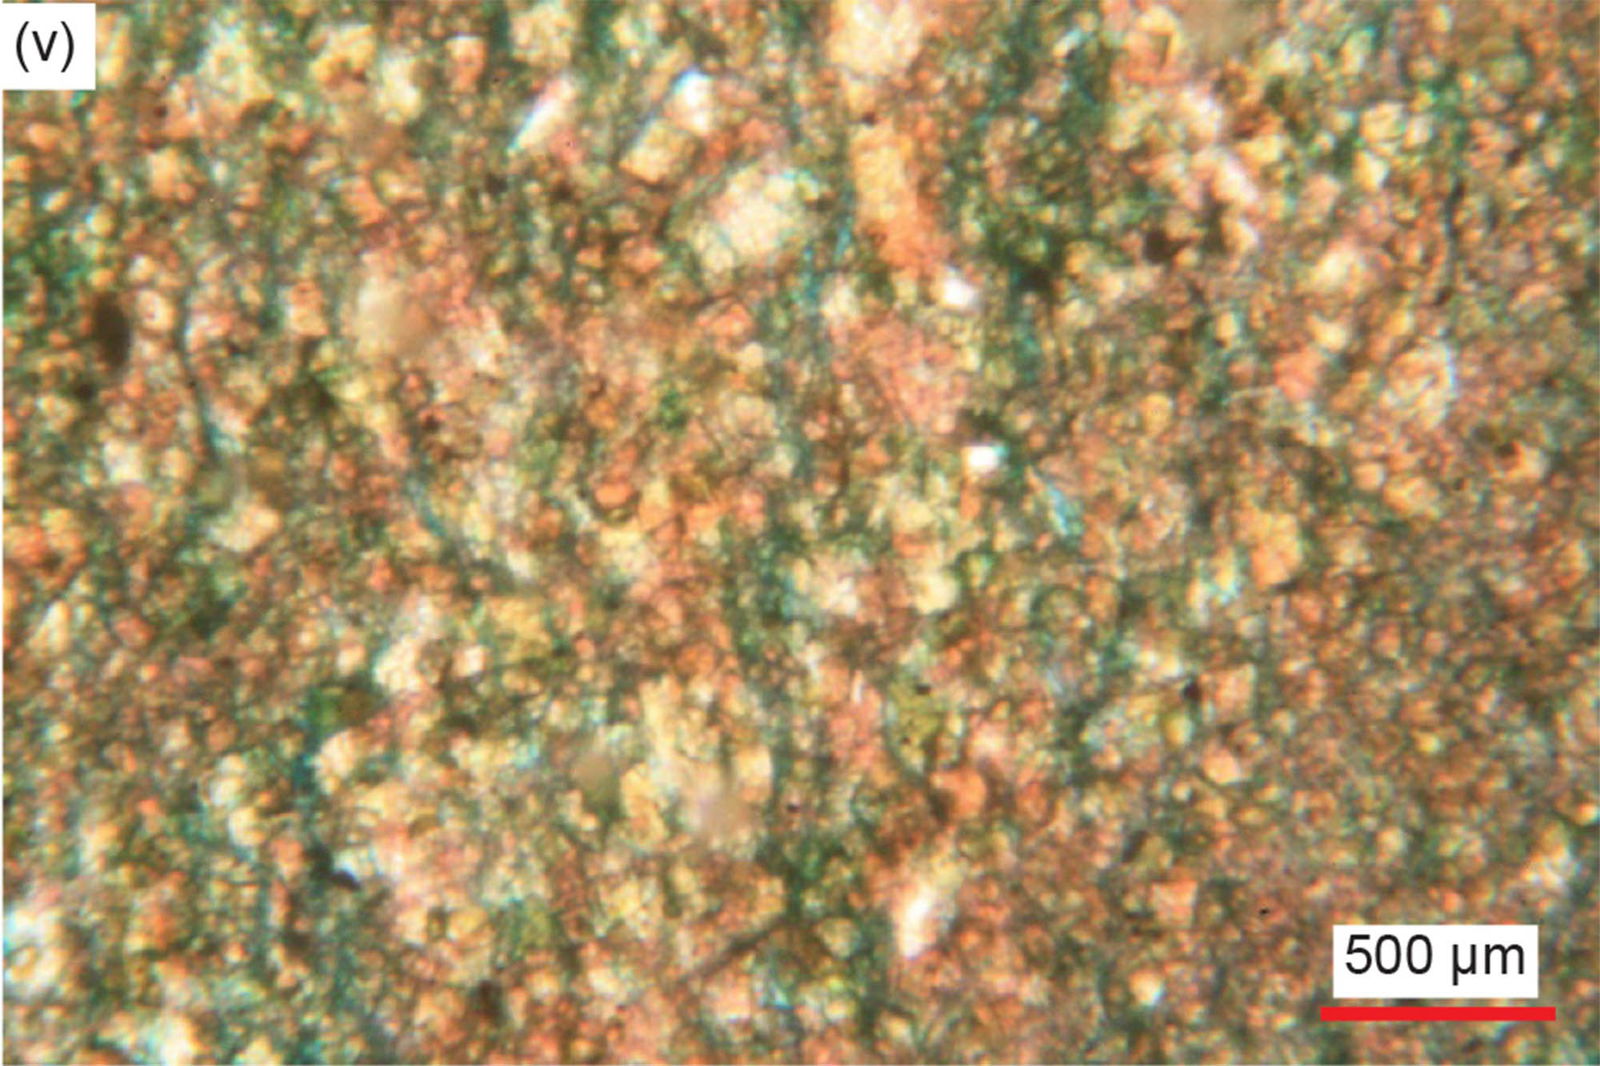
Fig. 28. A representative set of photomicrographs at various scales (as indicated) showing the detrital K-feldspar grains of various sizes, shapes, and states of alteration in the Muav Formation samples. Distal samples: (a), (b) MLS-01, (c), (d) MLS-02, and (e) MLS-03. Matkatamiba fold samples: (f) MFML-01, (g) MFML-02, (h) MFML-03, (i) MFML-04, (j) MFML-05, (k) MFML-06, (l), (m) MFTB-01, (n) MFTB-02, (o), (p) MFTB-03, (q), (r) MFTB-04, (s), (t) MFTB-05, and (u), (v) MFTB-06.
Original detrital plagioclase grains occur at 1.9% in a regional sample from the Gateway Canyon Member (table 2) but are also very sparsely present in five samples from the topmost Gateway Canyon Member, and the basal Havasu Member in the Matkatamiba fold (fig. 29). They are readily identified by their tell-tale multiple twinning under crossed polars. They are similar in size (very small) and shape (sub-angular to sub-rounded, and occasionally lath-like) to the accompanying K-feldspar and quartz grains.
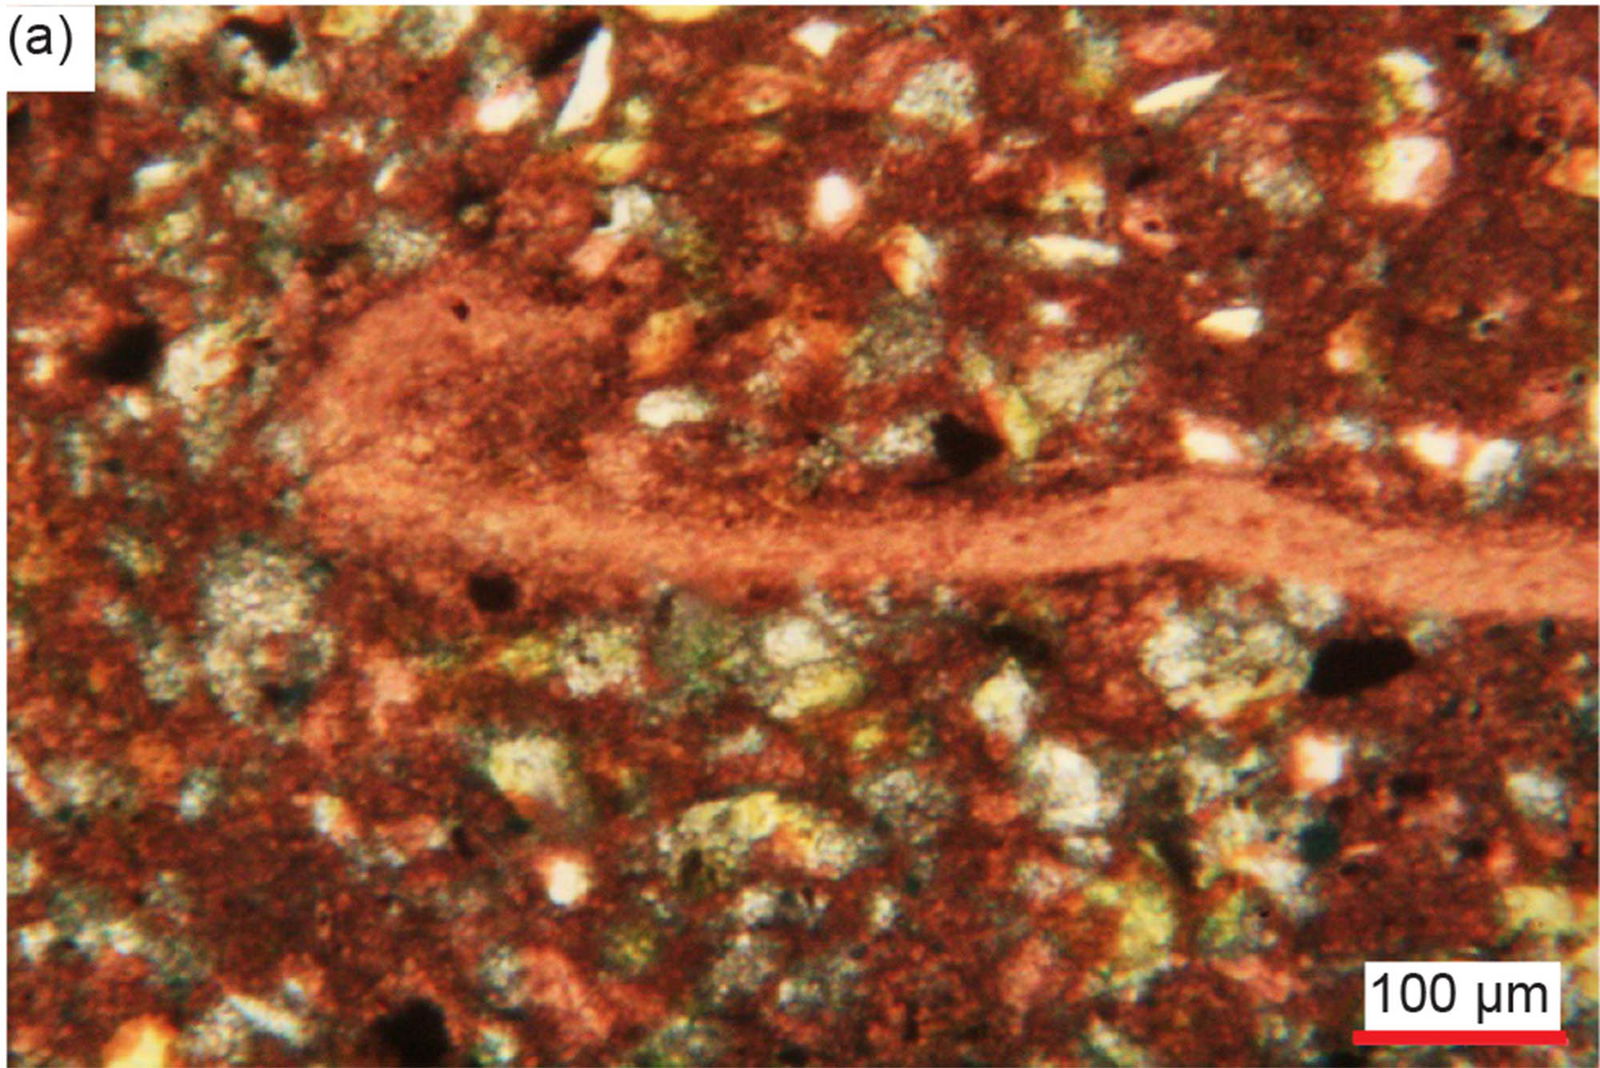
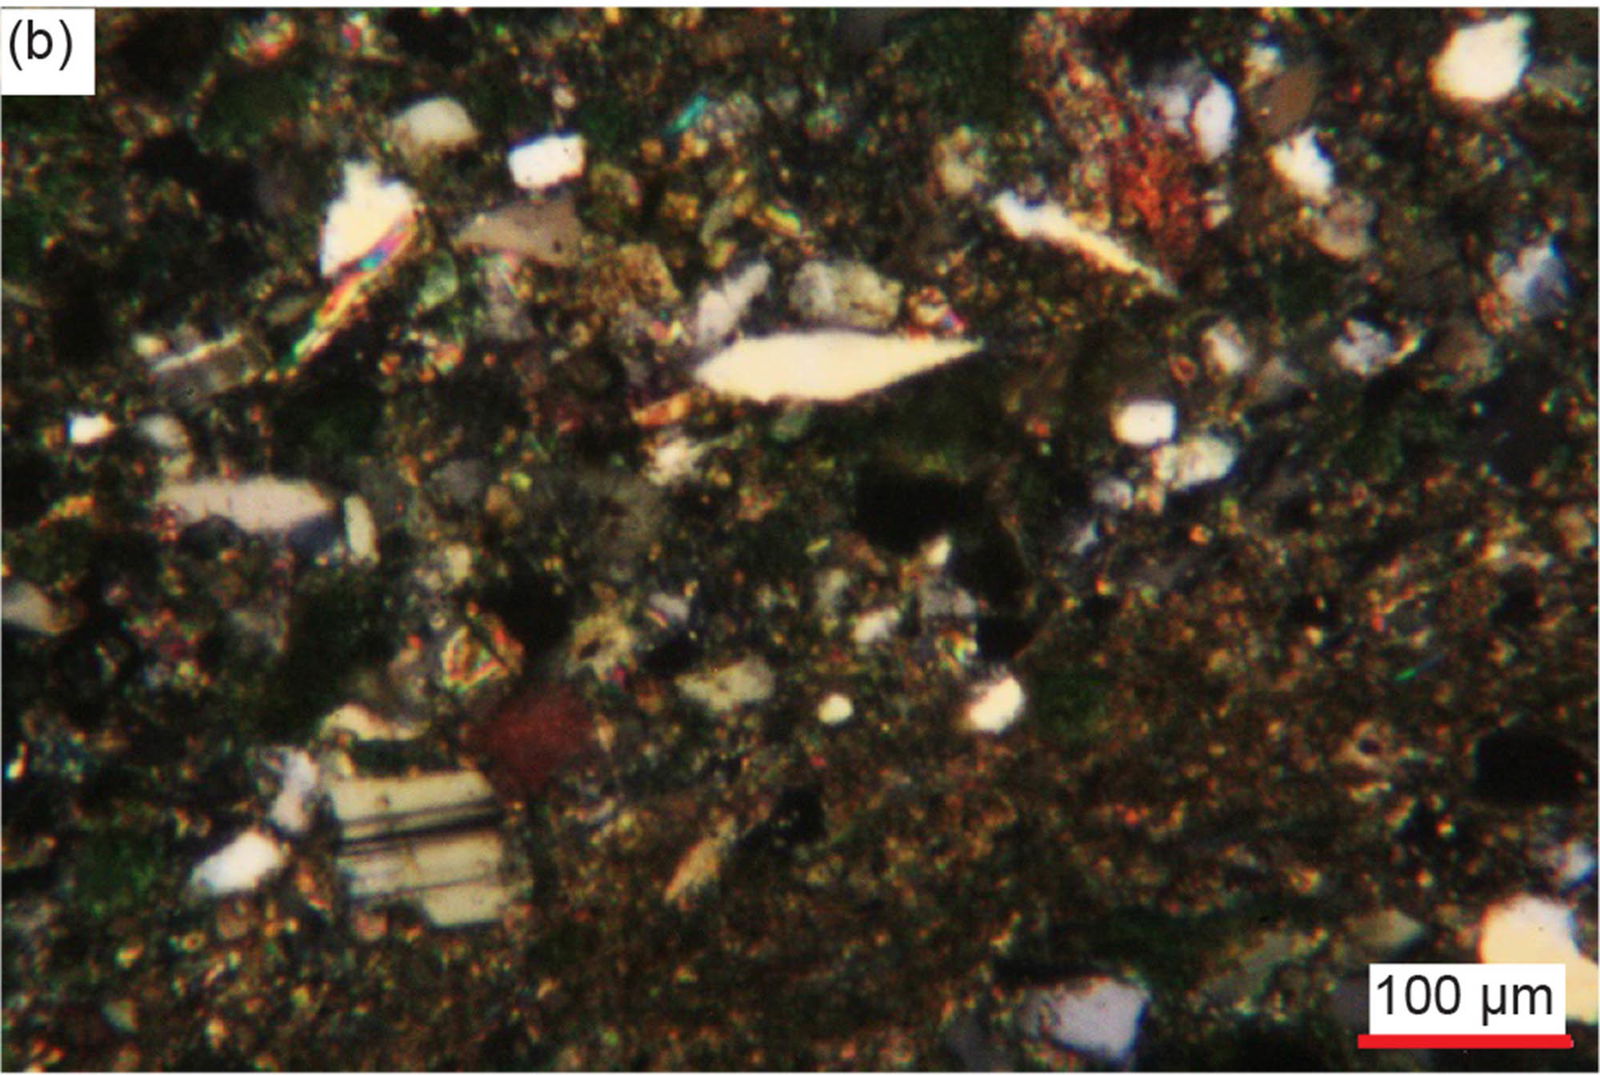
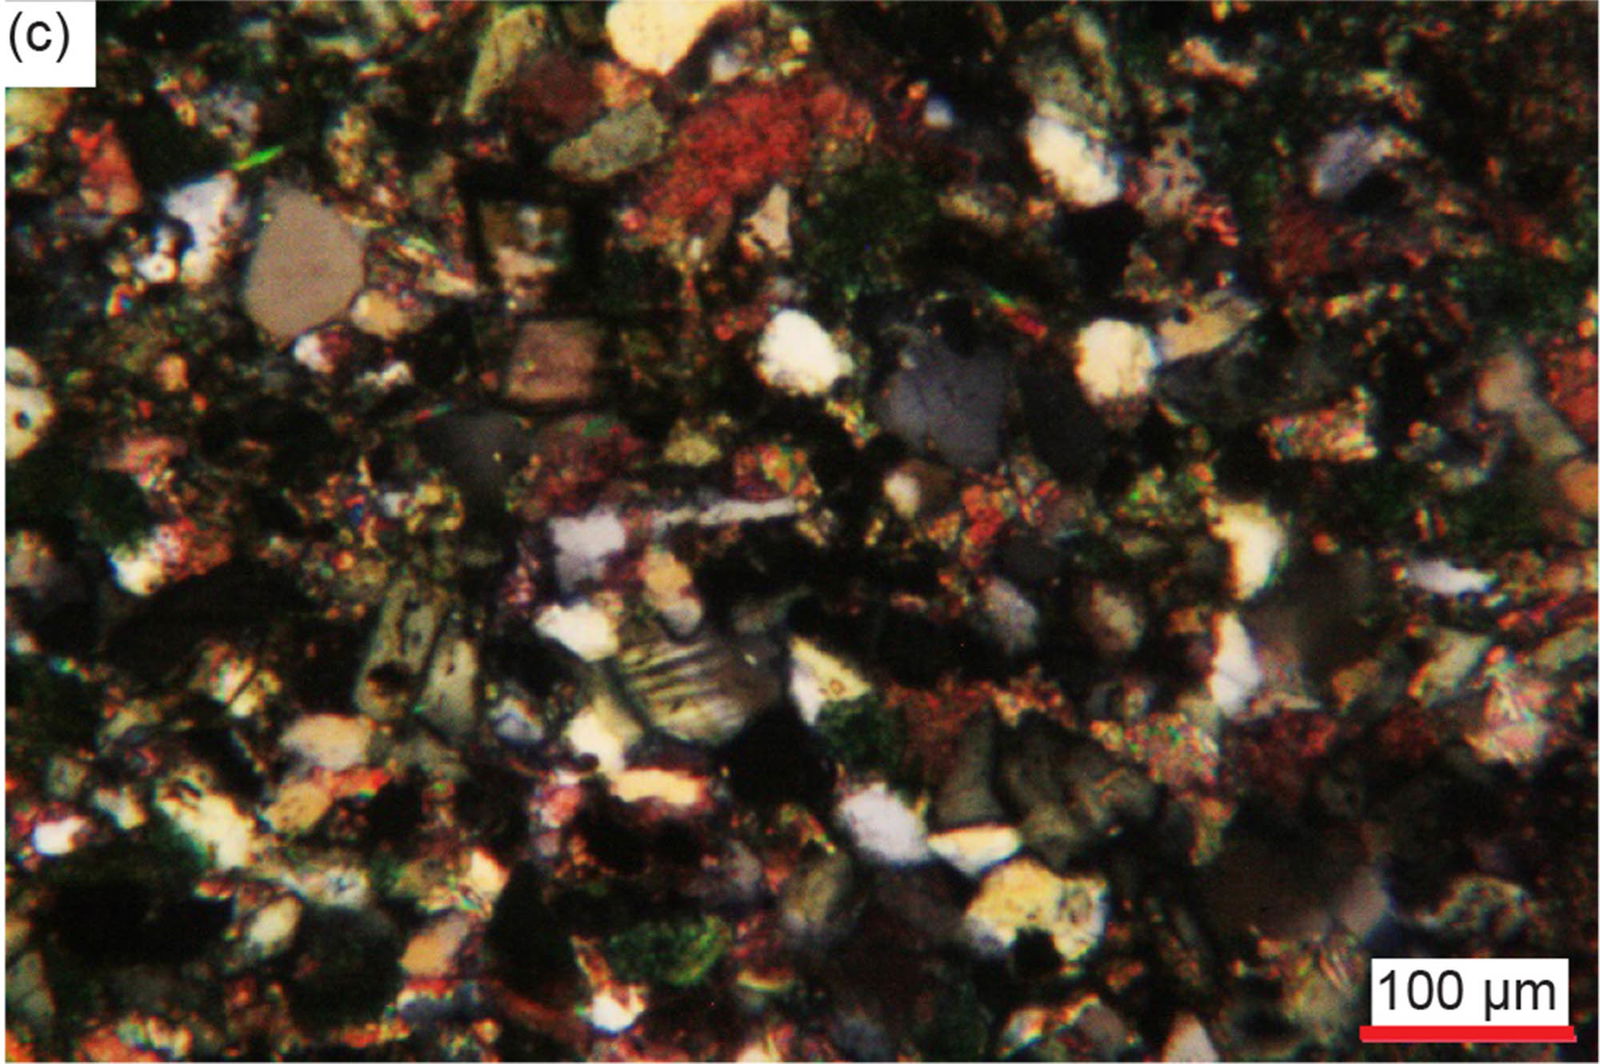
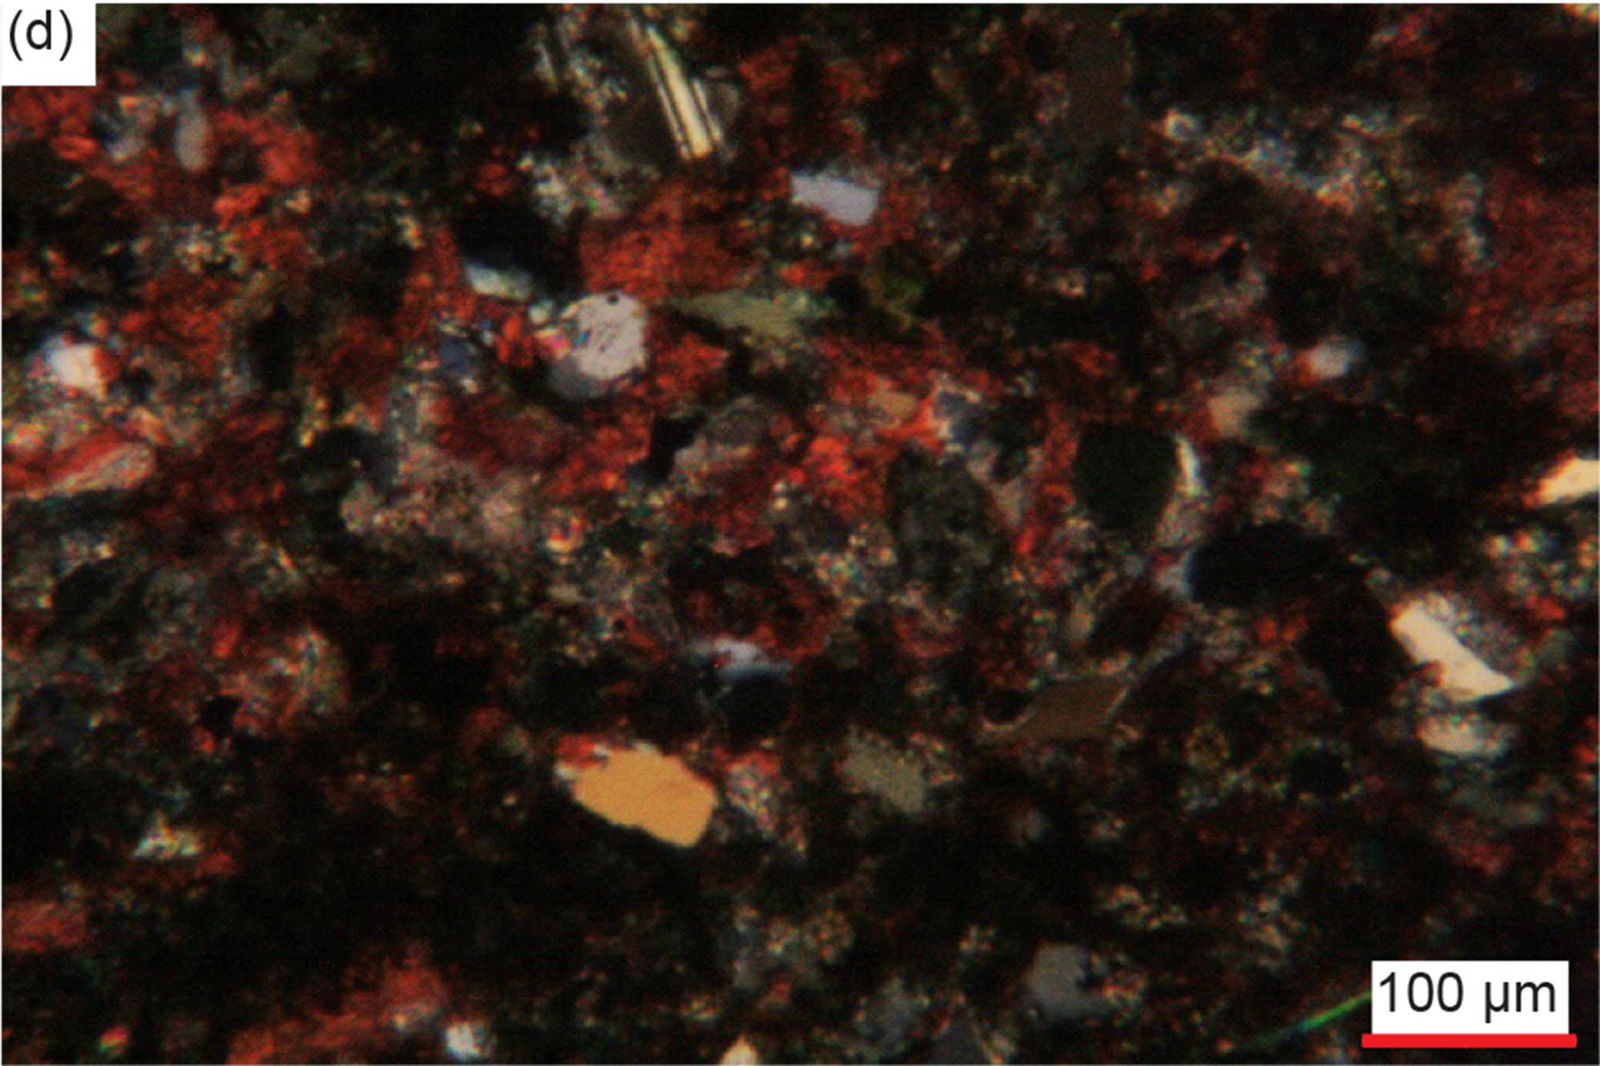
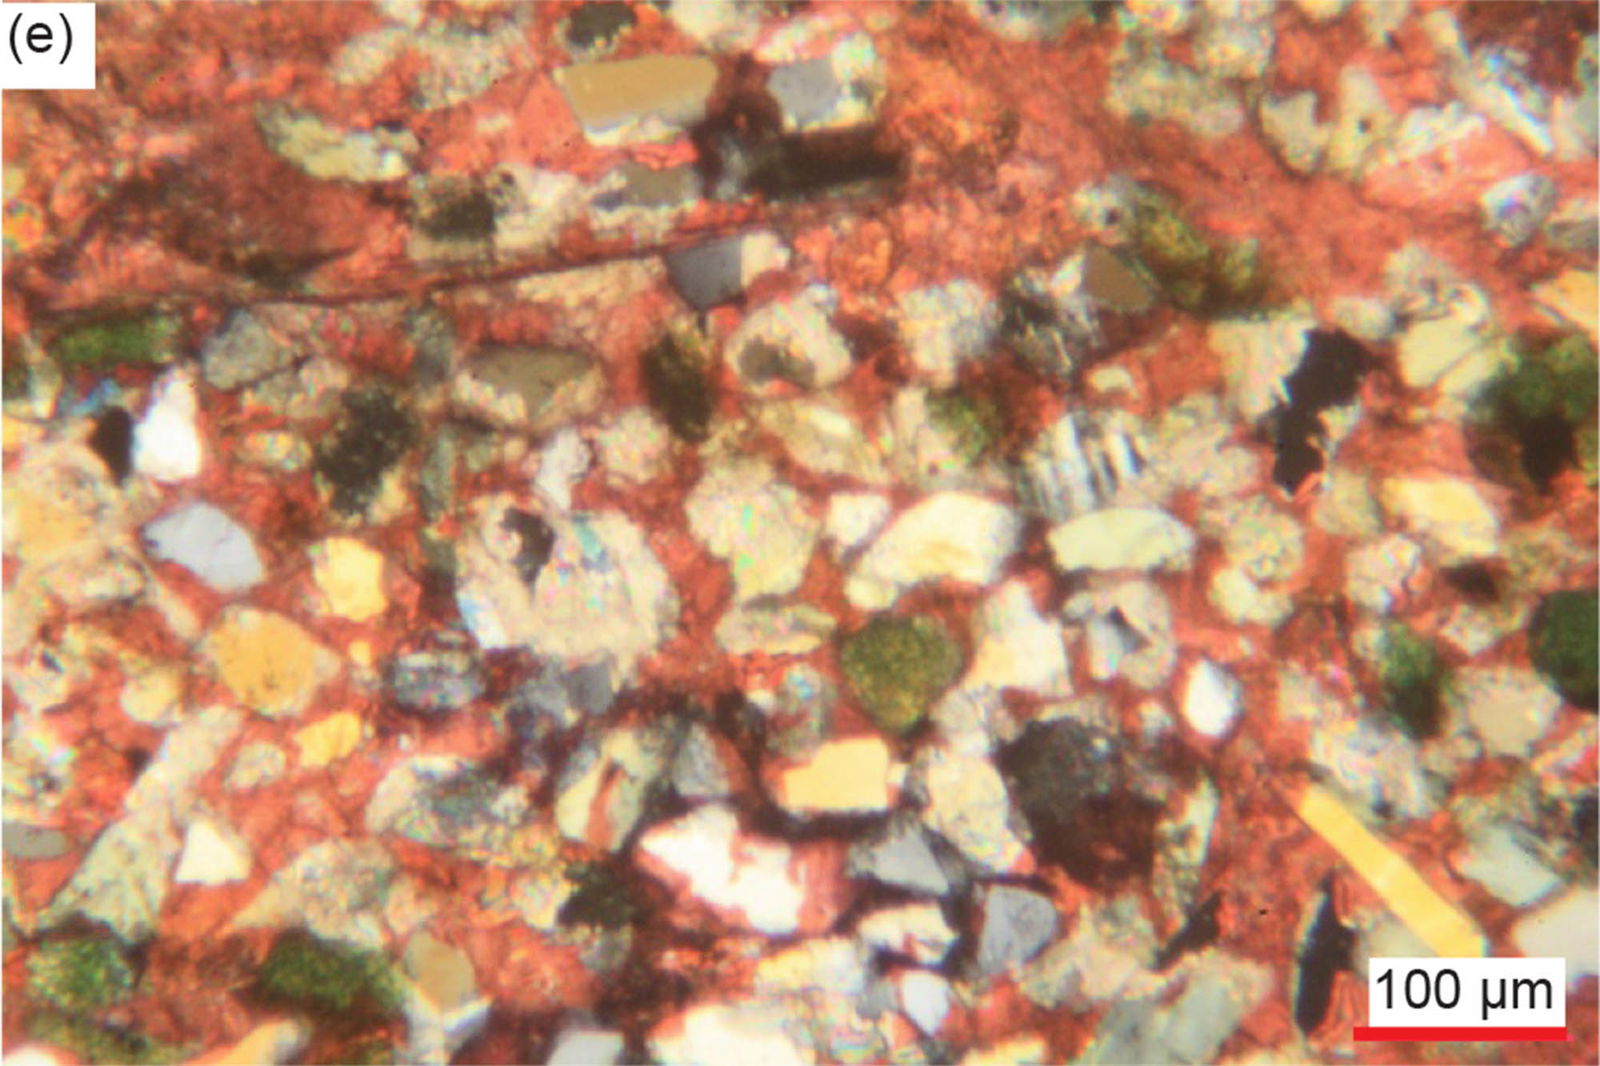
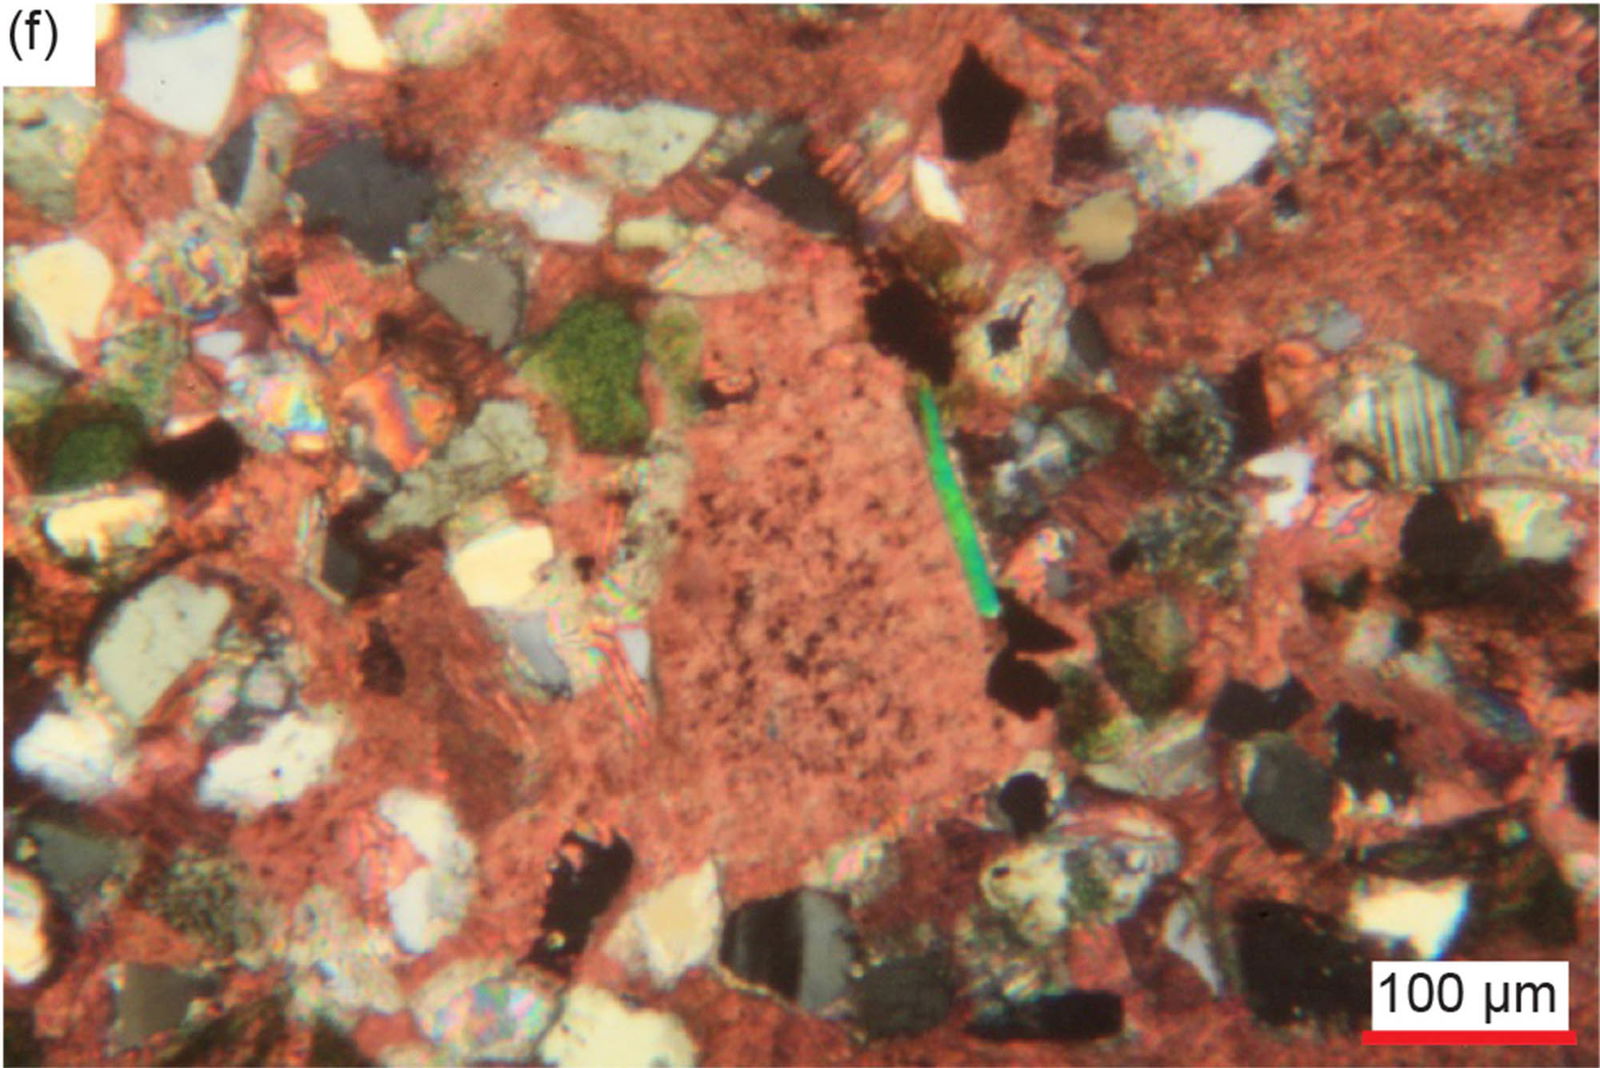
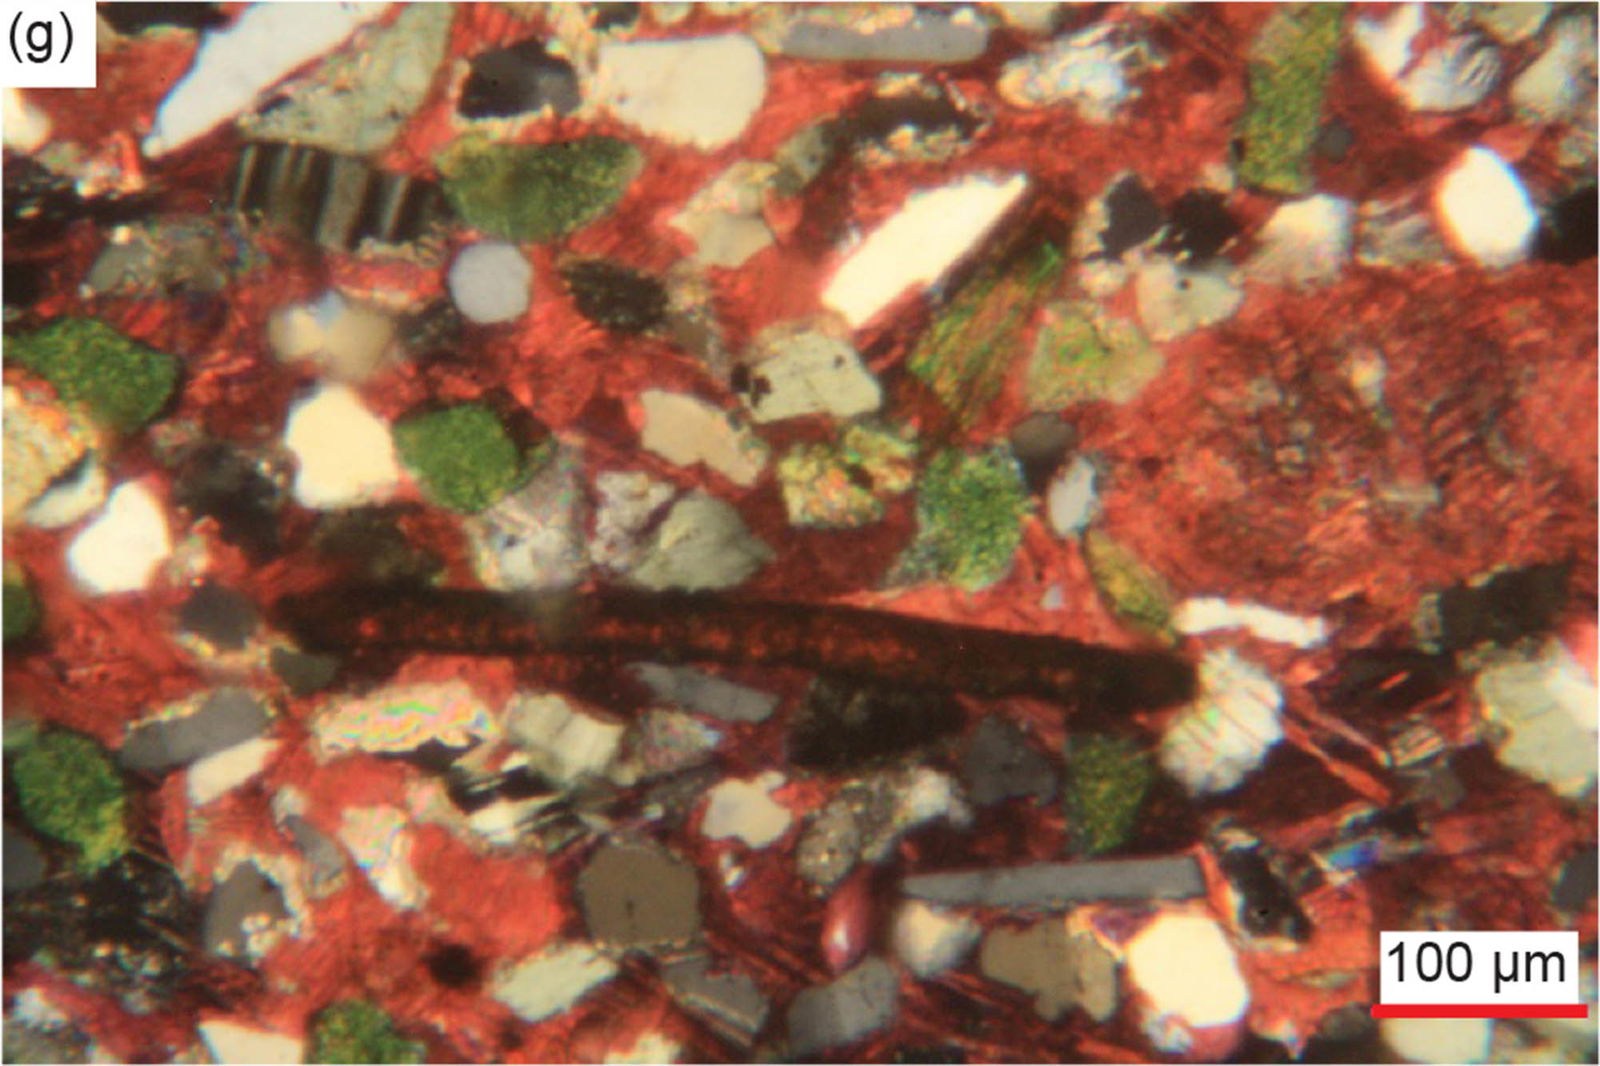
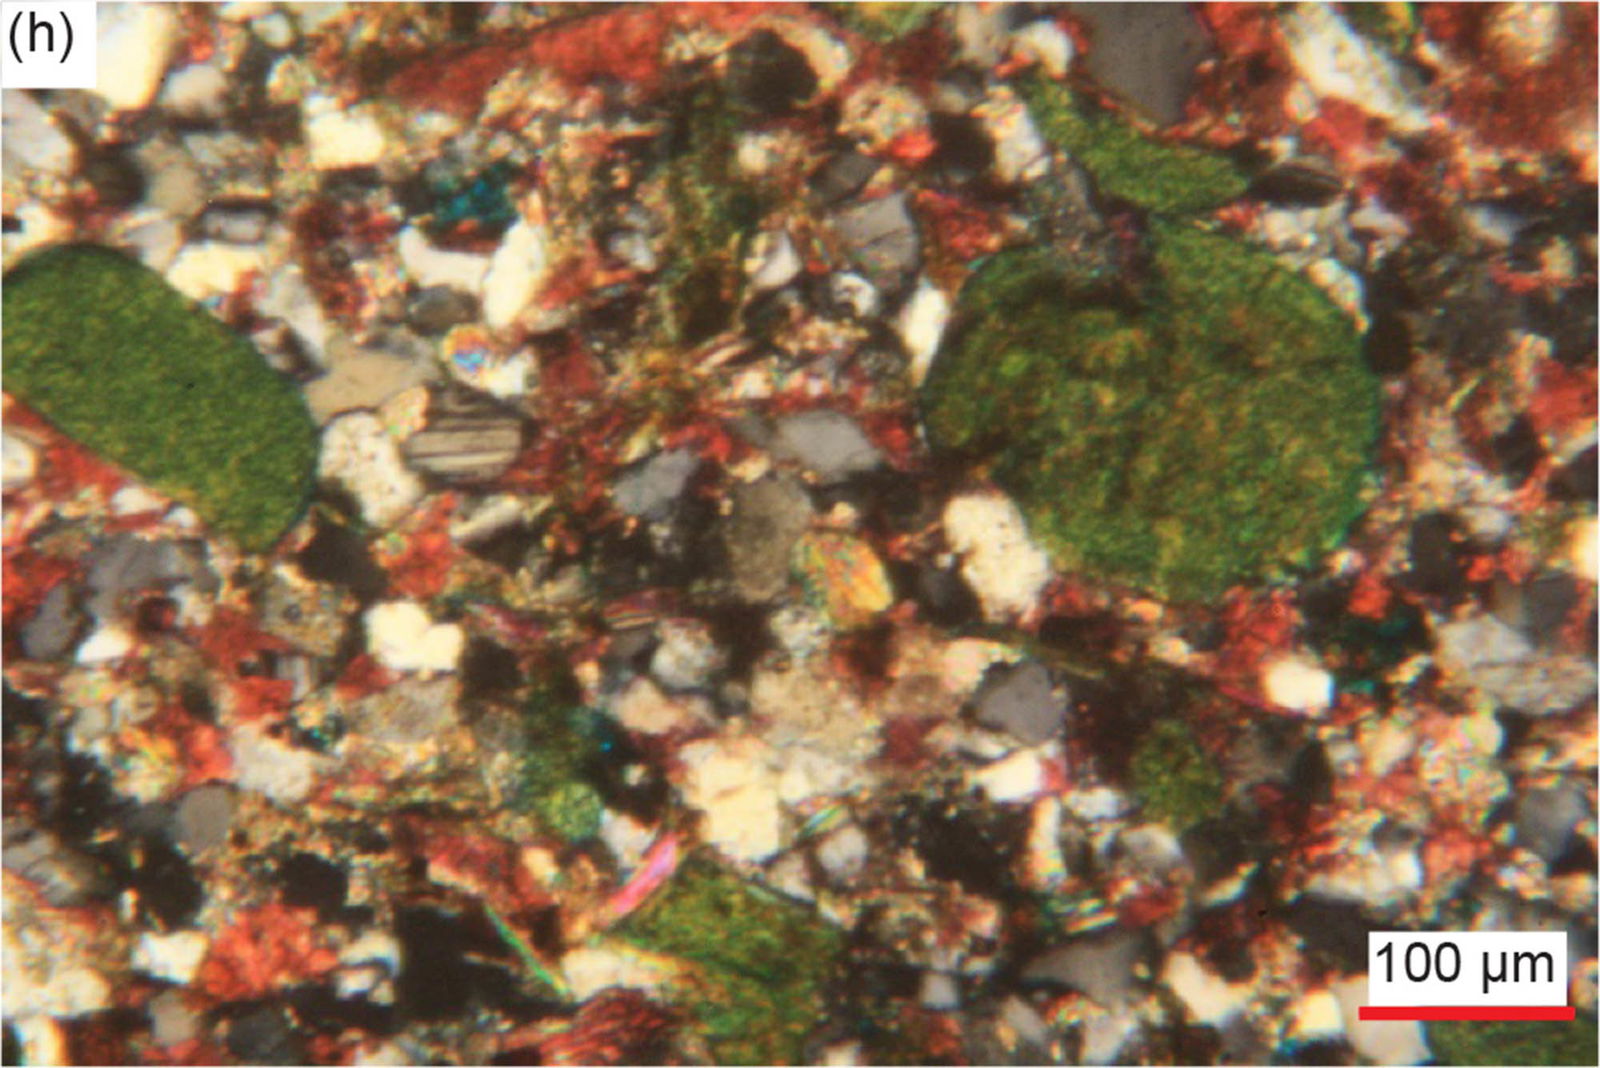
Fig. 29. A representative set of photomicrographs at various scales (as indicated) showing the detrital plagioclase grains in the Muav Formation samples. Distal sample: (a) MLS-02. Matkatamiba fold samples: (b), (c) MFML-01 crossed polars, (d) MFML-06 crossed polars, (e) MFTB-02 crossed polars, (f), (g) MFTB-03 crossed polars, and (h) MFTB-04 crossed polars.
In many samples some tiny and very small to small, sub-angular, sub-rounded and rounded K-feldspar grains and fragments are stained green, likely indicating partial illite alteration to glauconite, and are occasionally scattered among the other grains in the matrix (fig. 30). Sample MFTB-04 (basal Havasu Member, Matkatamiba fold, fig. 30 l-p) is very different from all the other samples due to the rock fabric consisting of a tightly-fitting interlocking mosaic dominated by scattered very small to small and small-medium, rounded and often elongated, greenish grains of glauconite (illite) (~6%). Some have broken off ends suggesting they are detrital glauconite clasts, while others are cracked. Others have internal inclusions of tiny quartz and/or K-feldspar or have an internal ribbed scaffolding structure, which suggests the glauconite (illite) grew around those grains as pellets. Some glauconite grains are grossly elongated, yet still rounded, so they likely are primary deposited grains.
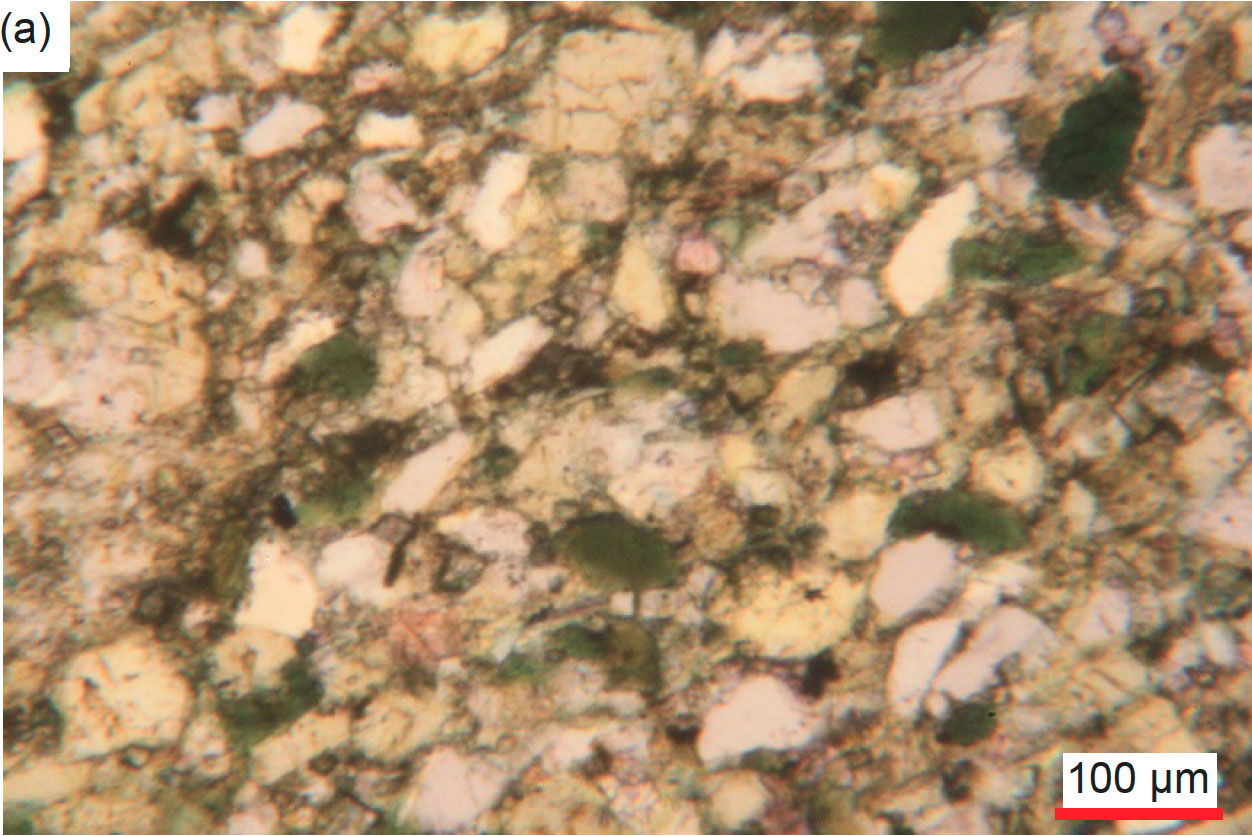
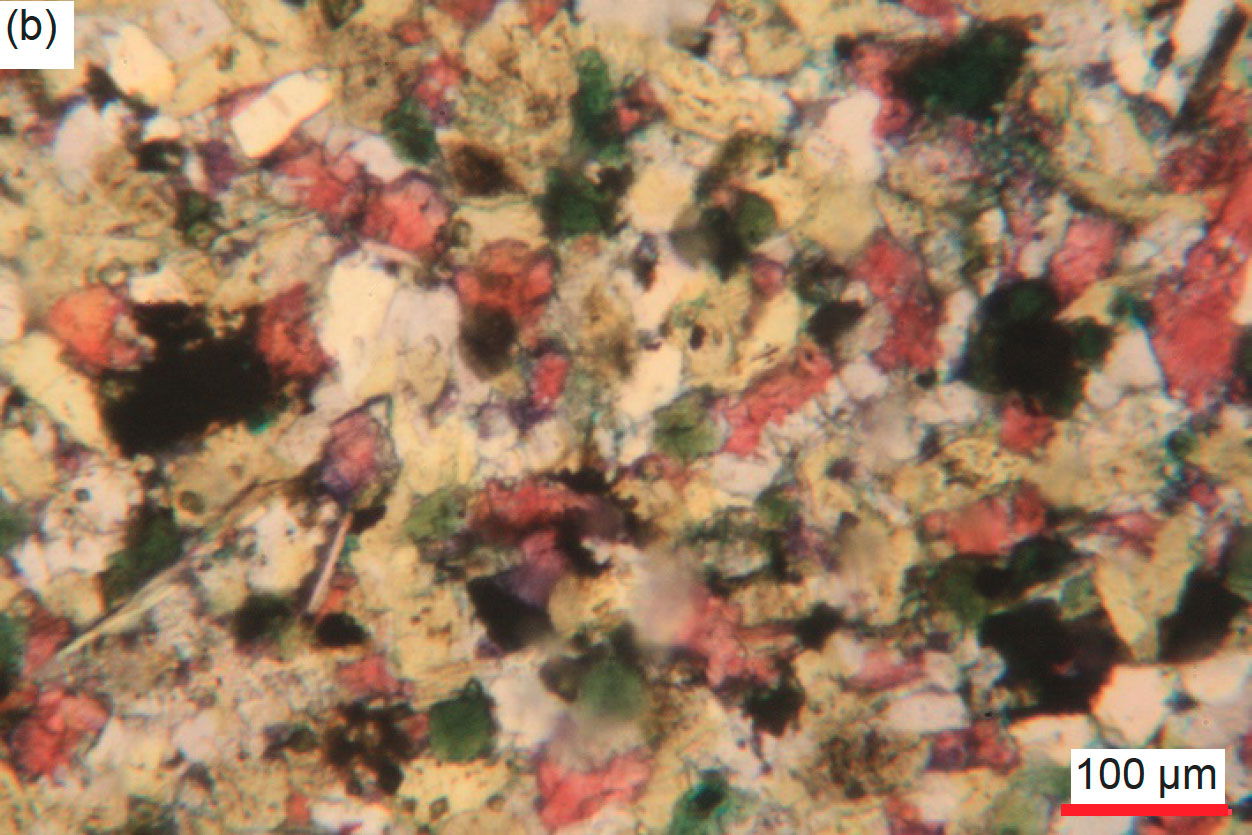
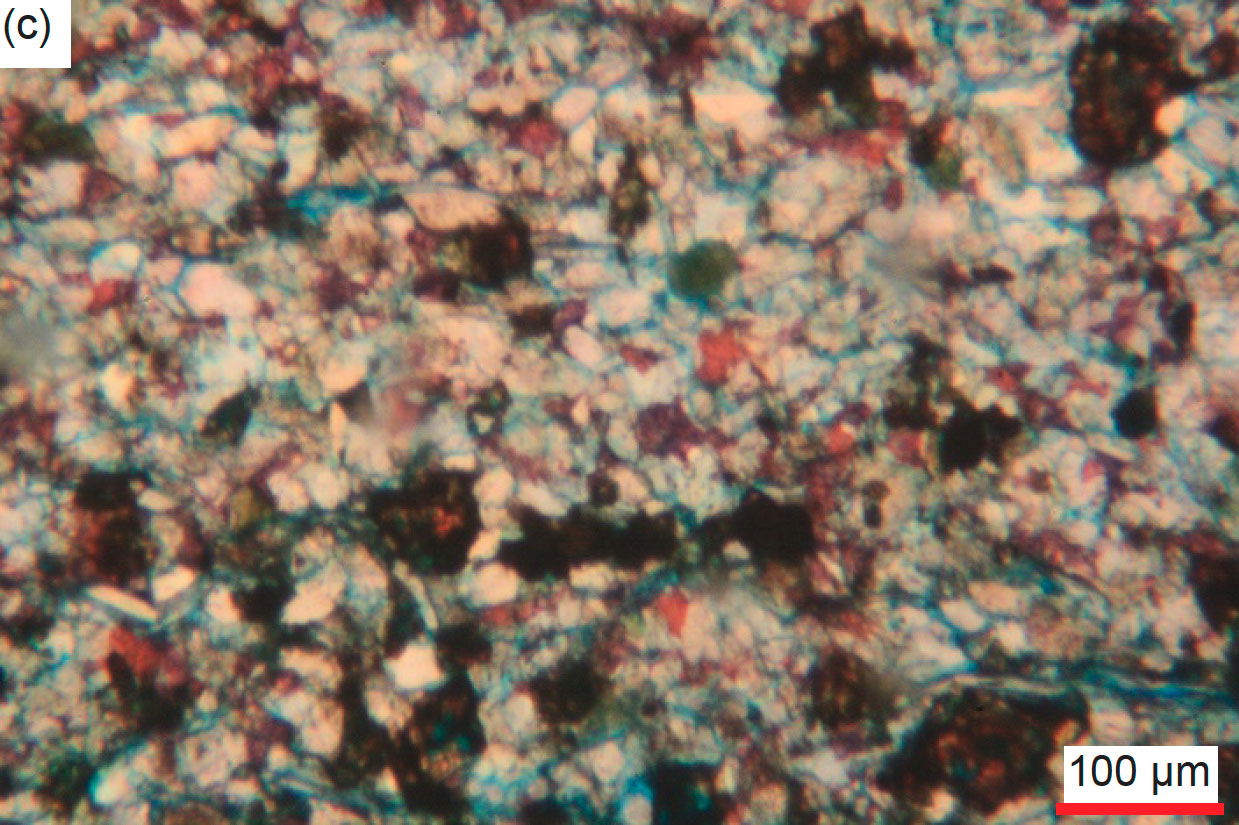
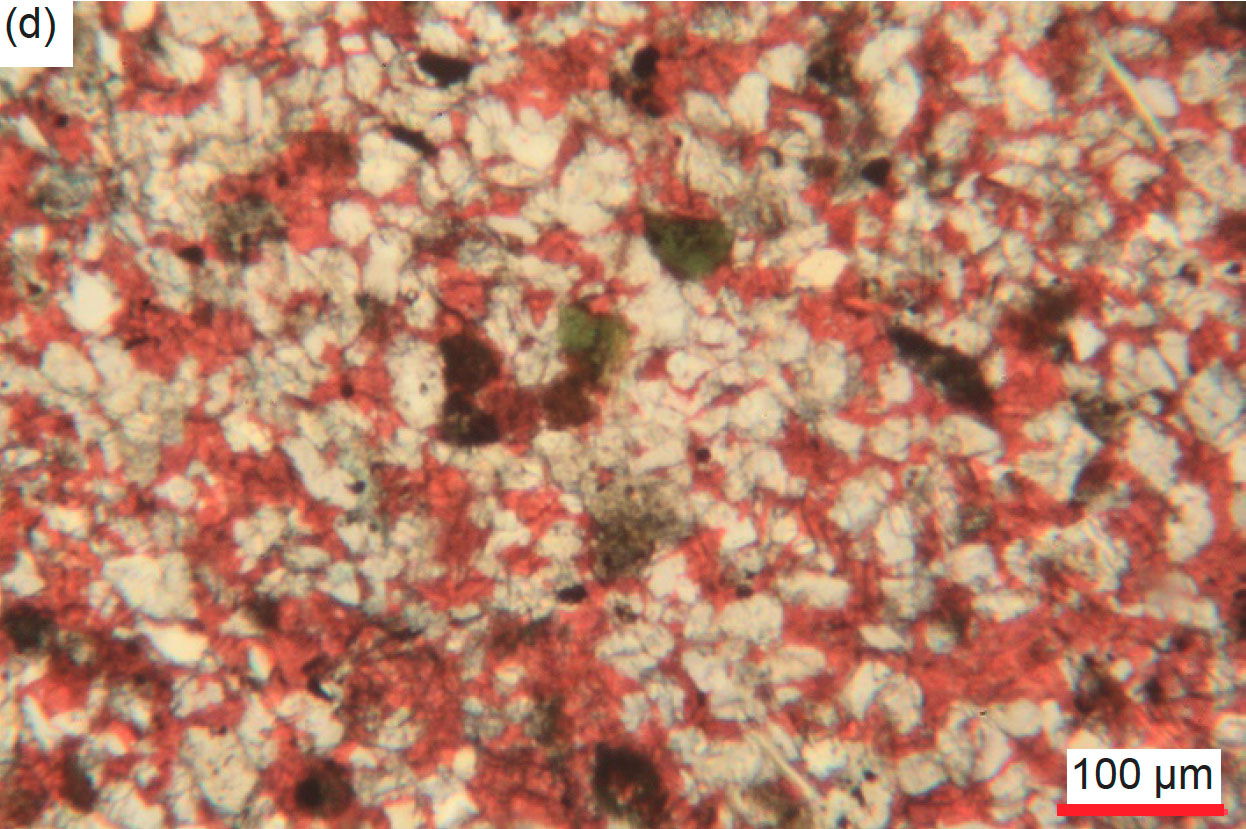
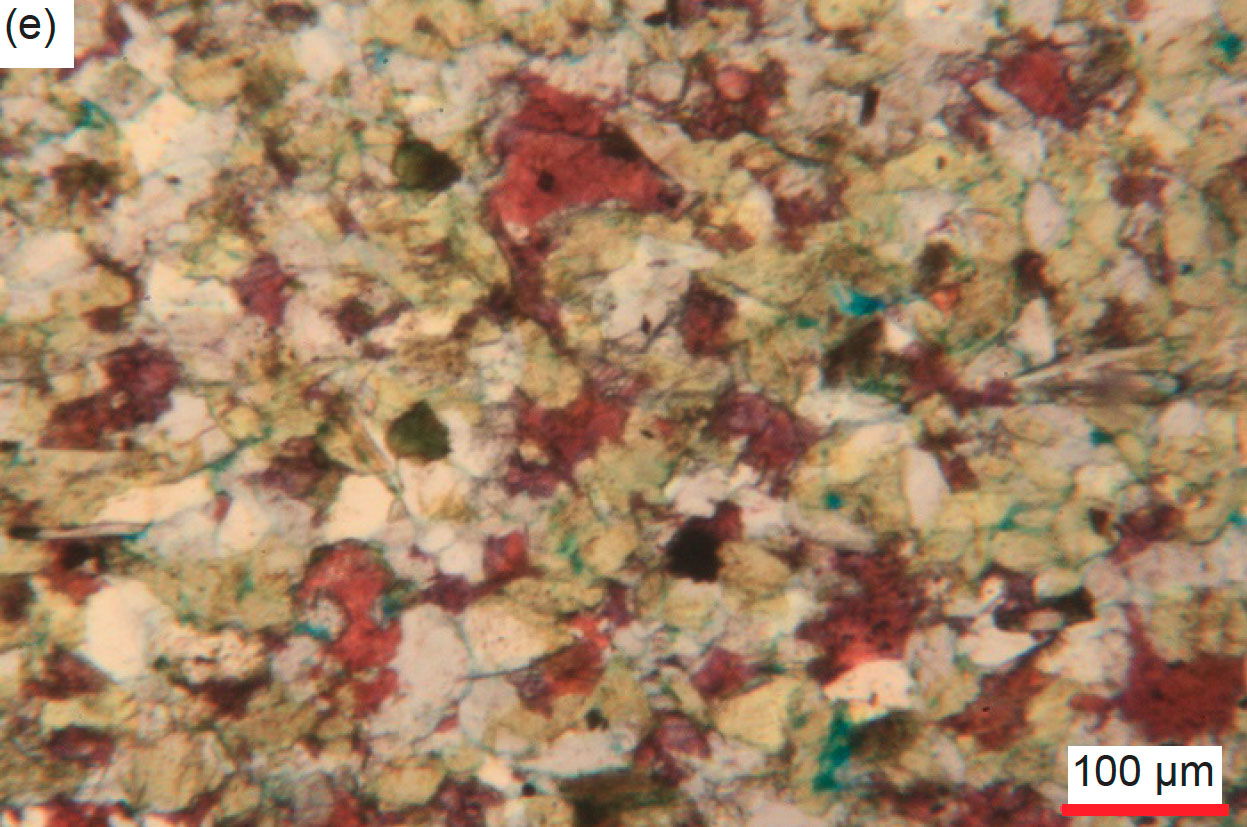
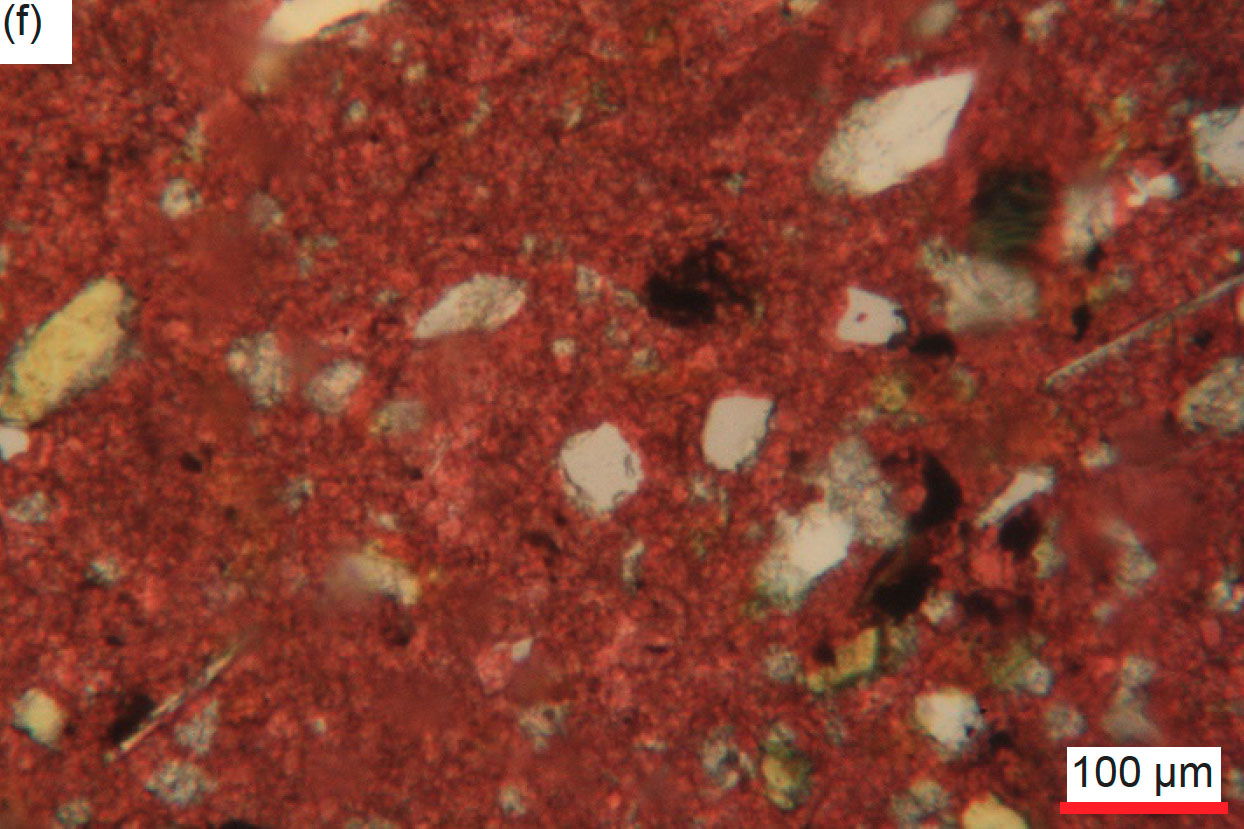

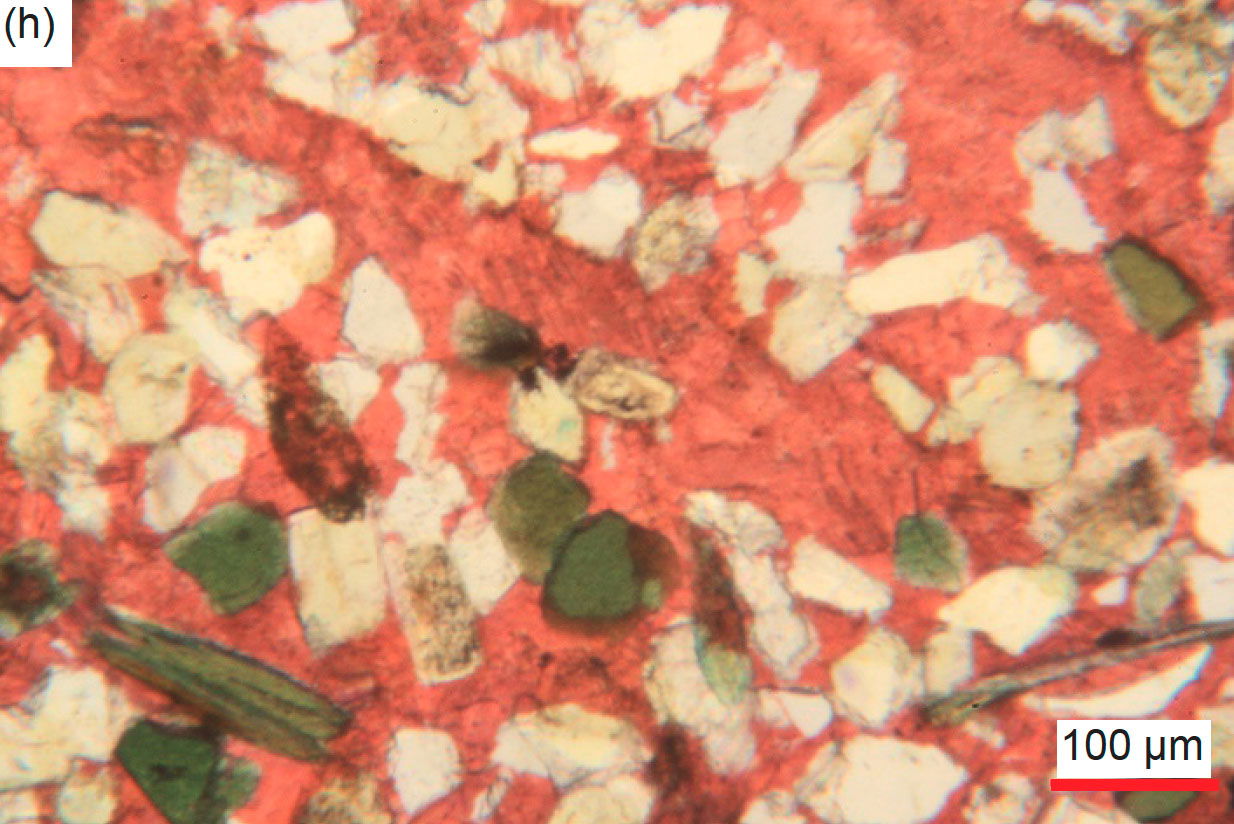
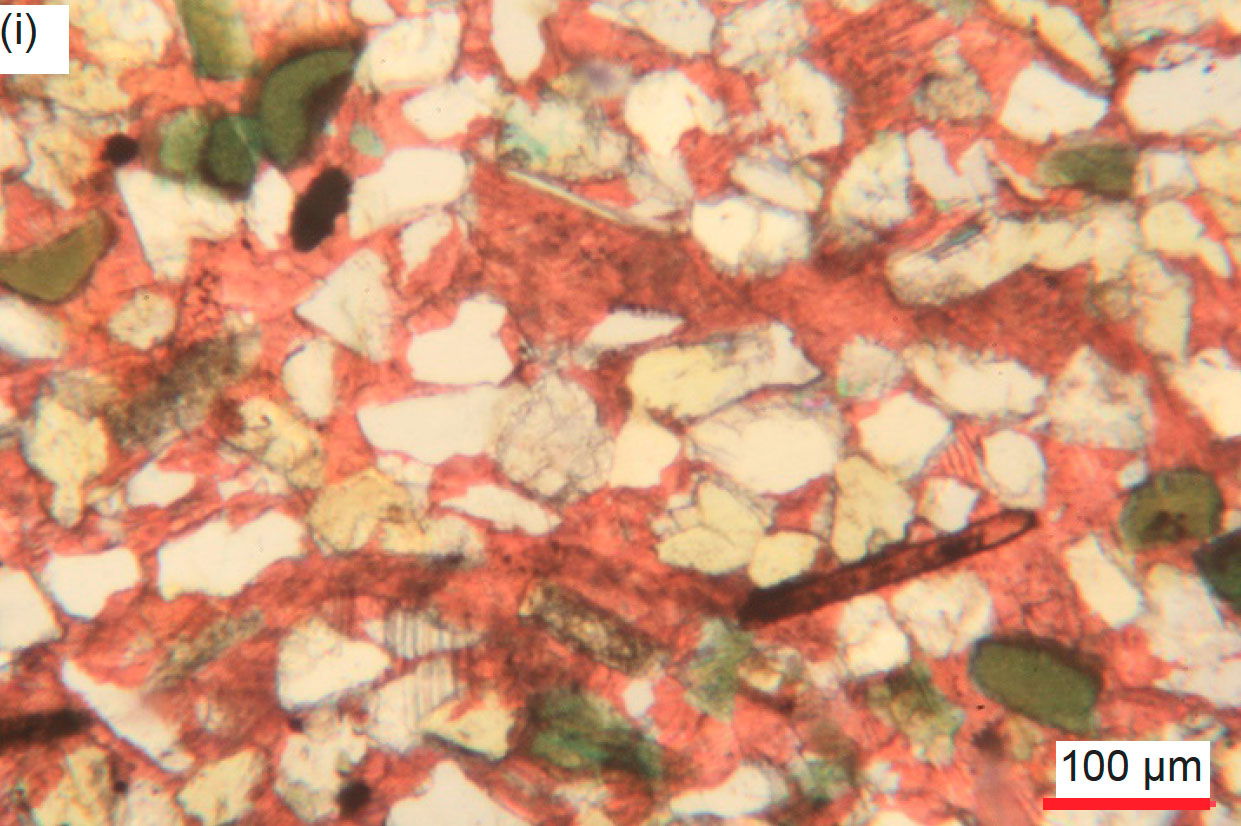
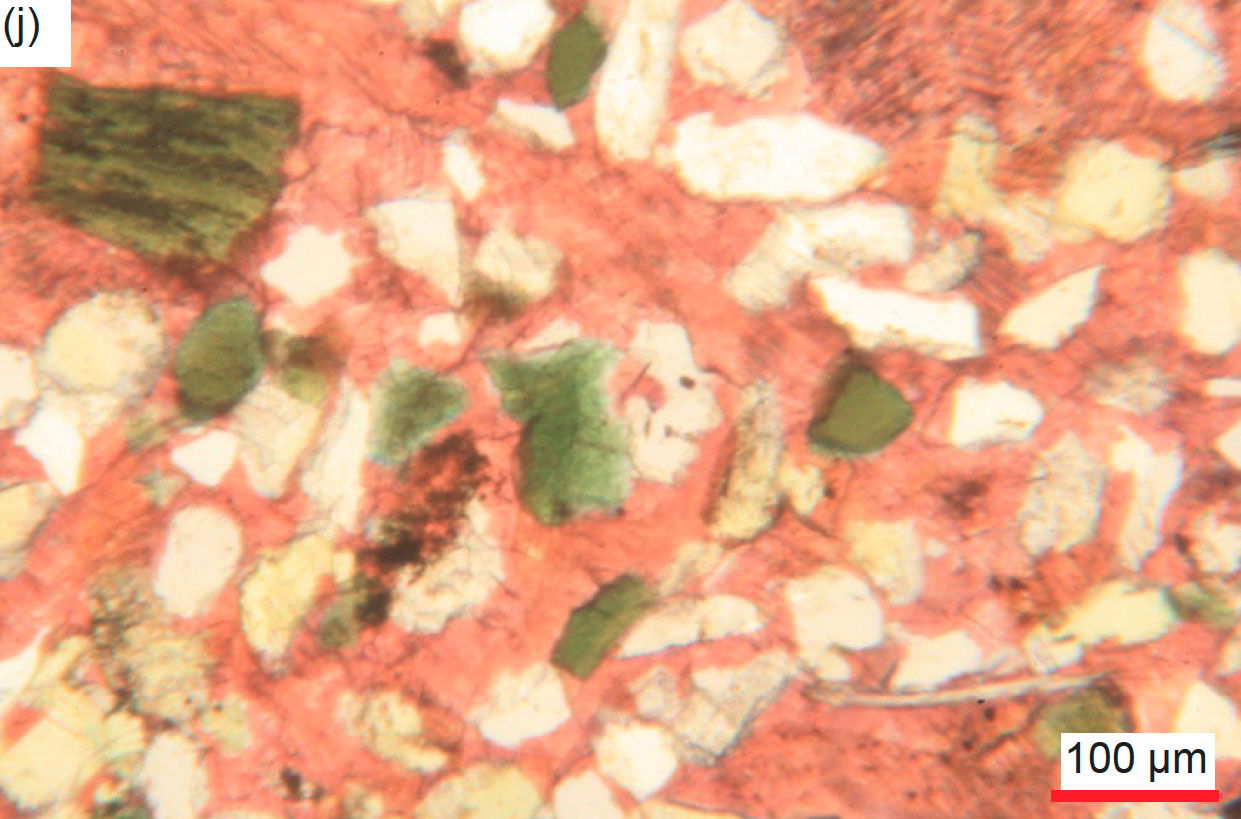
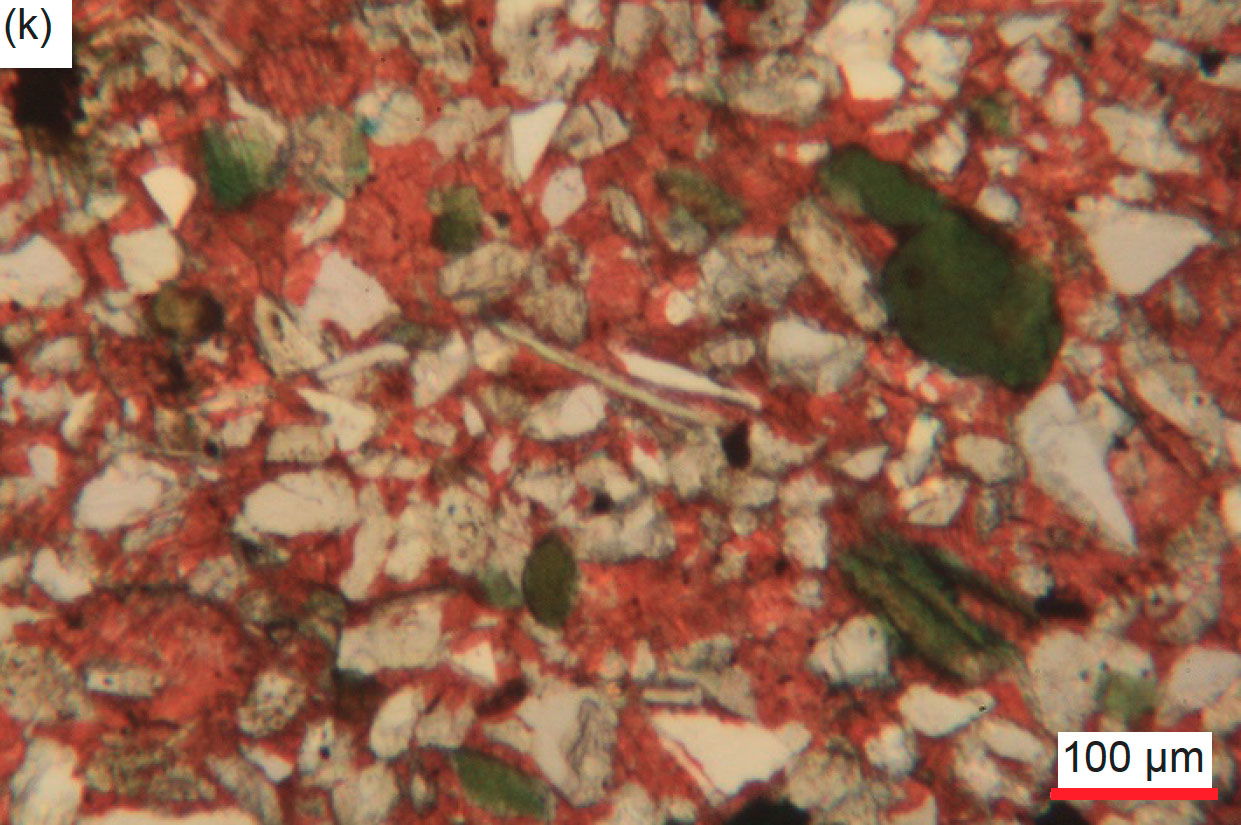
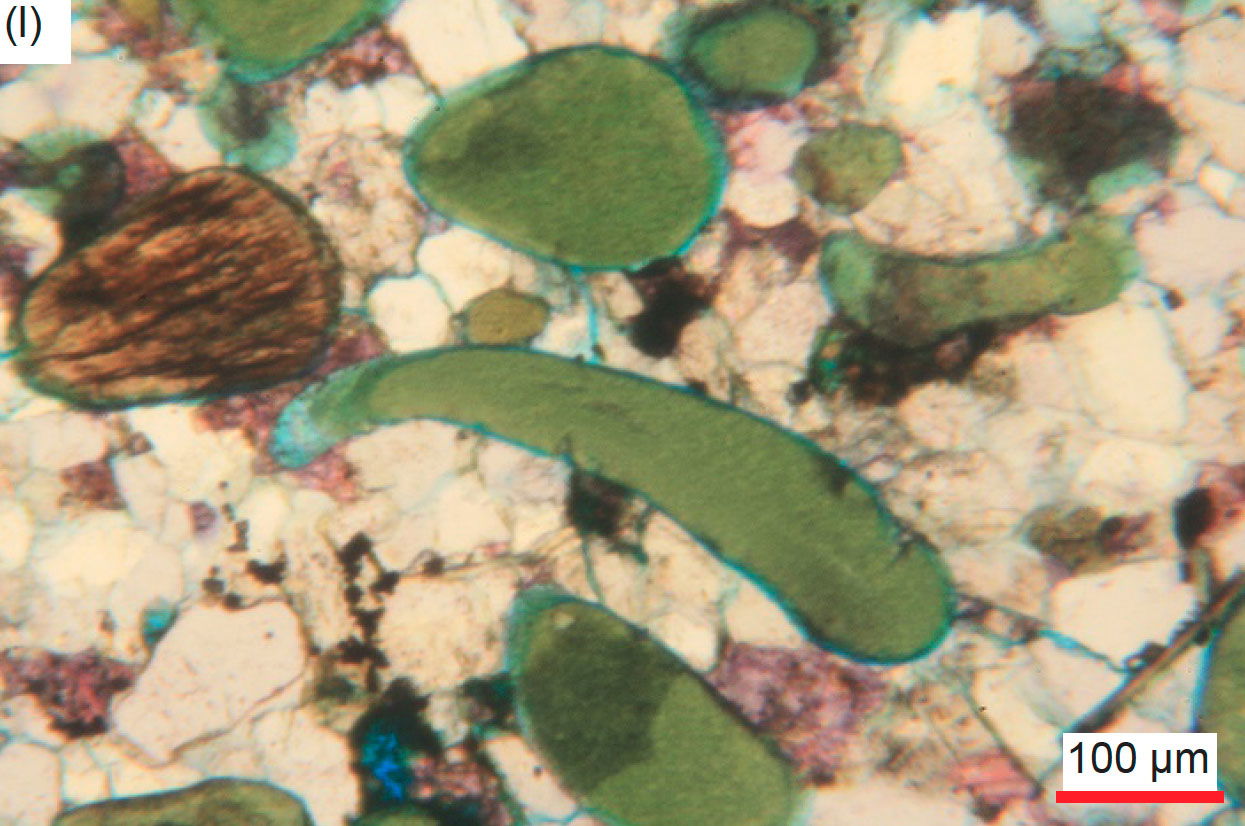
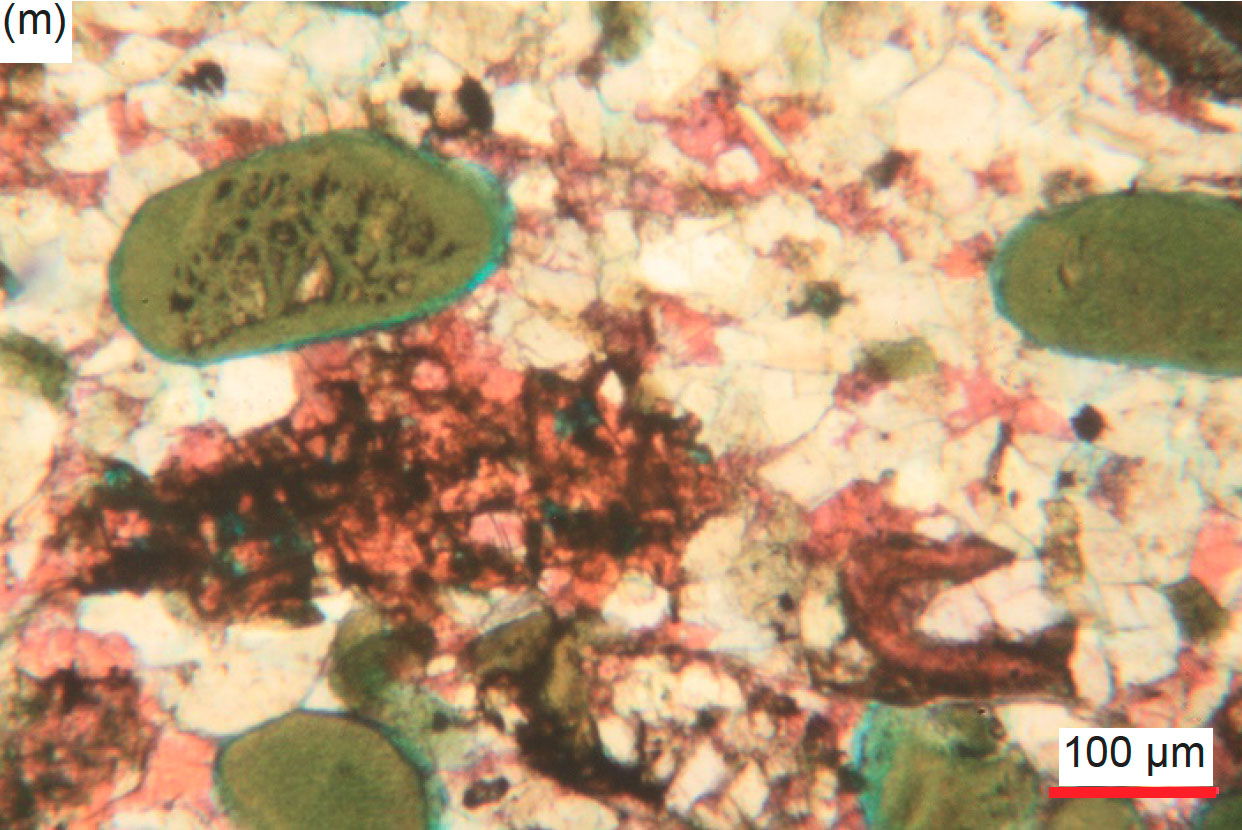
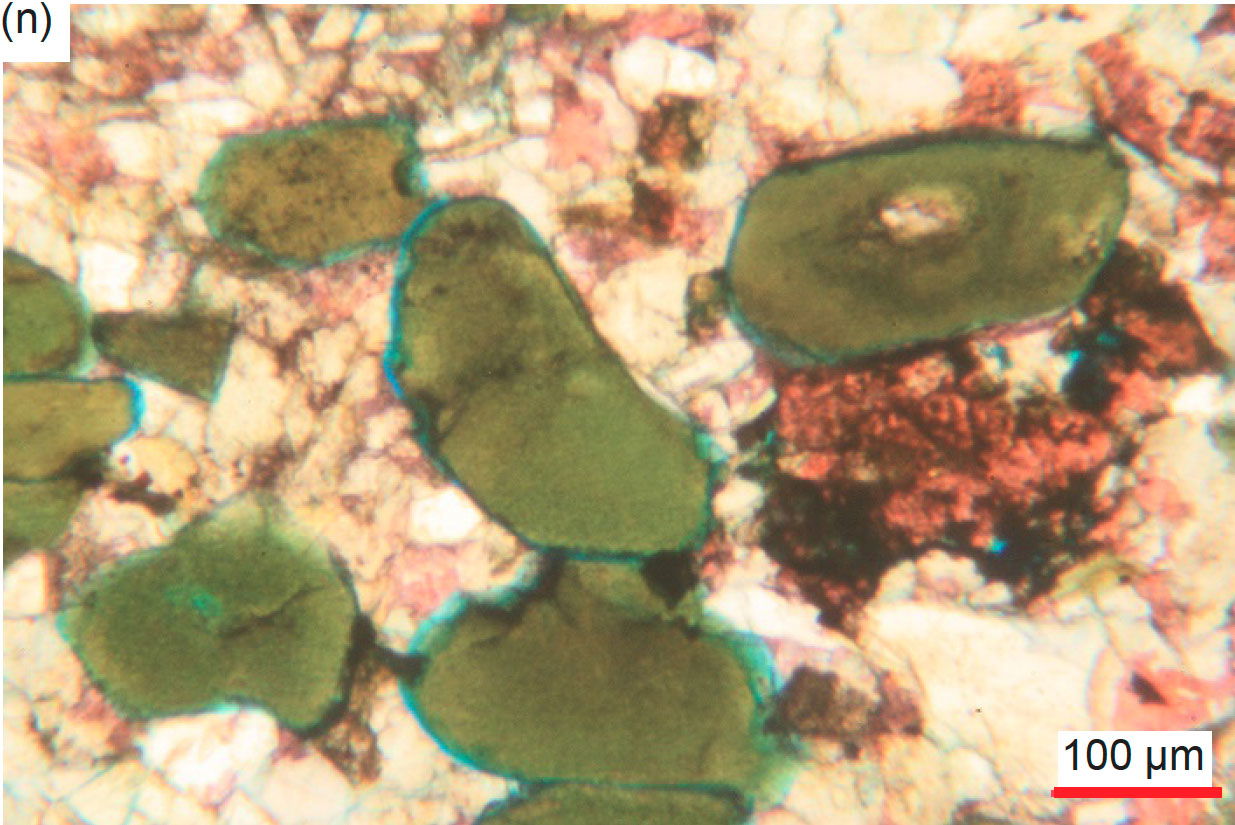
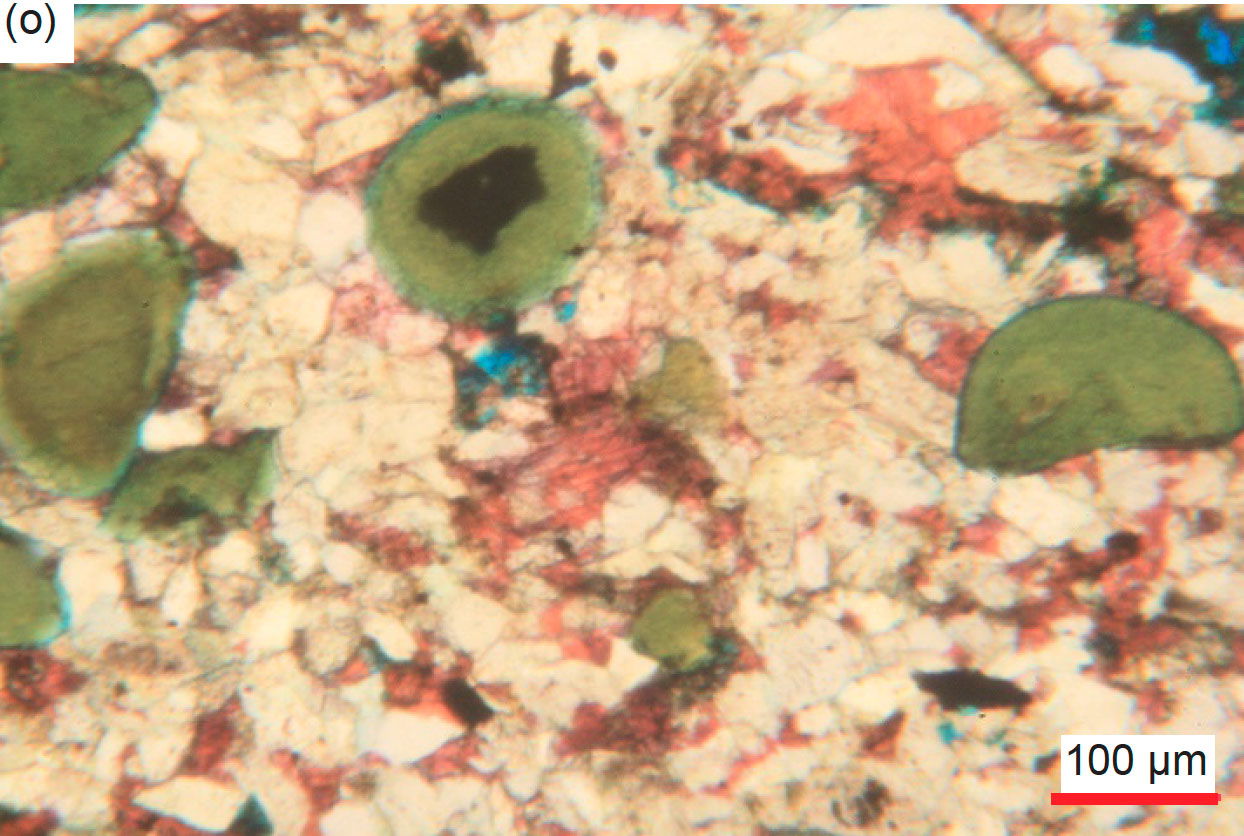
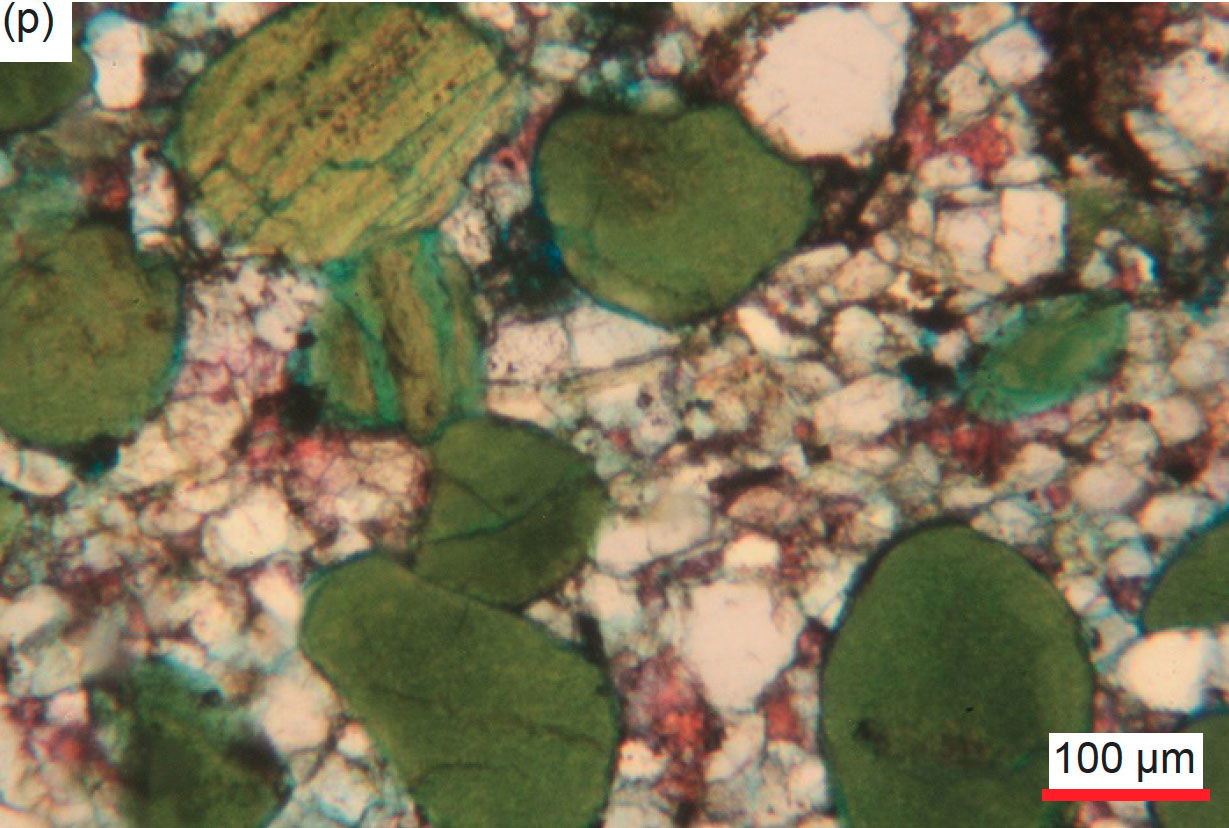
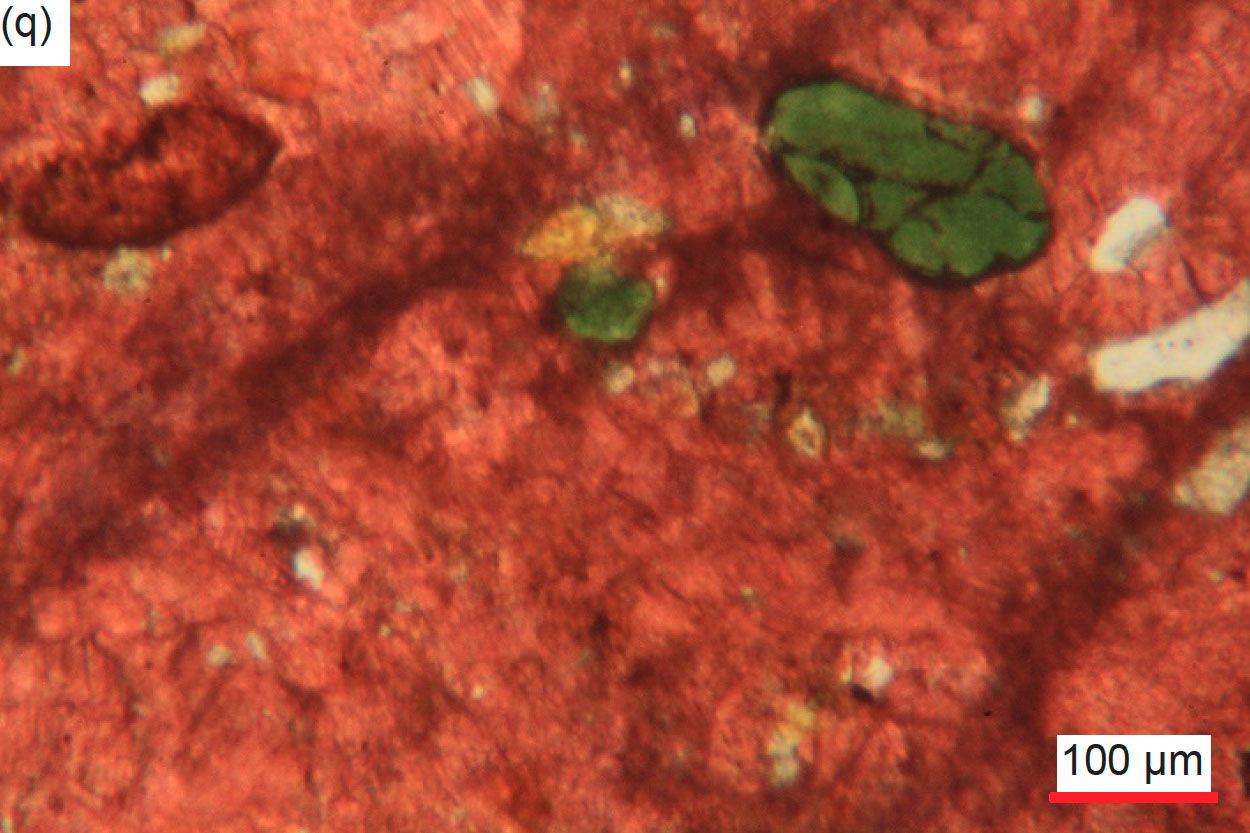
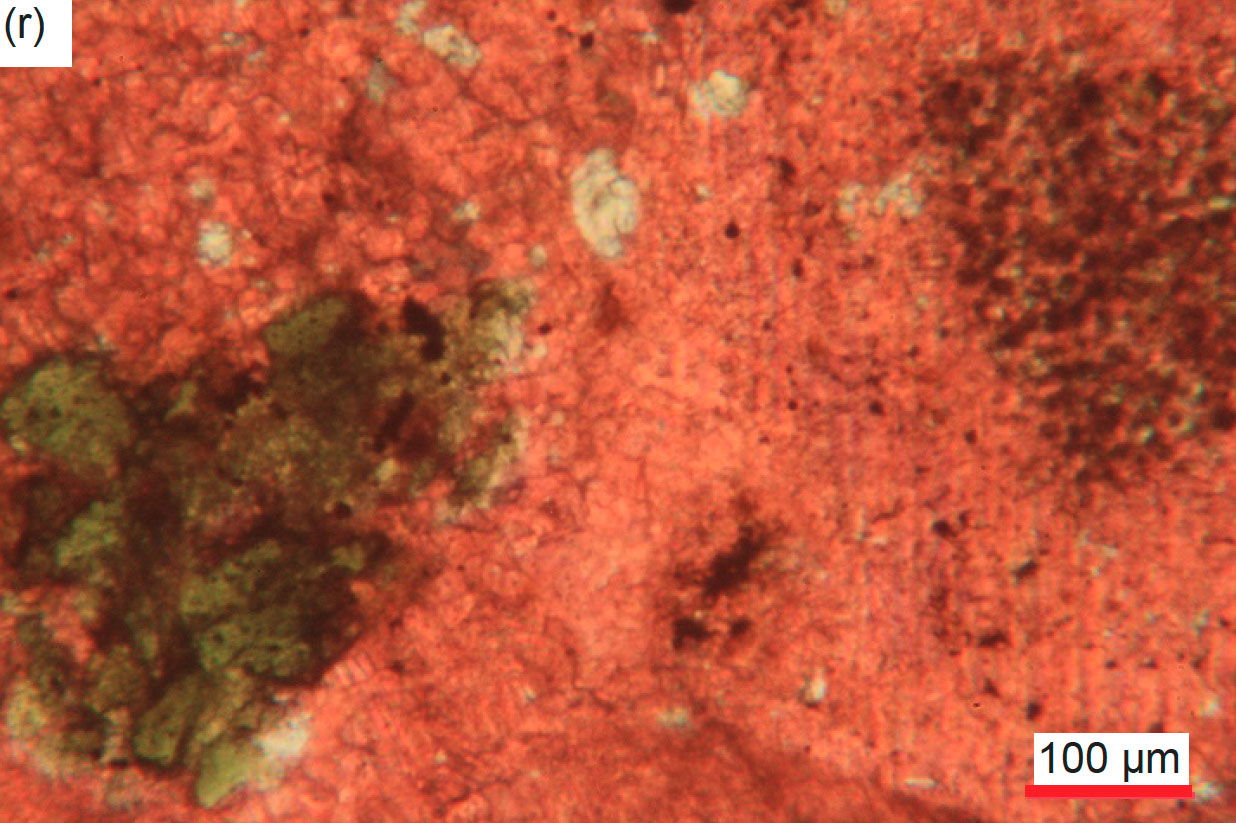
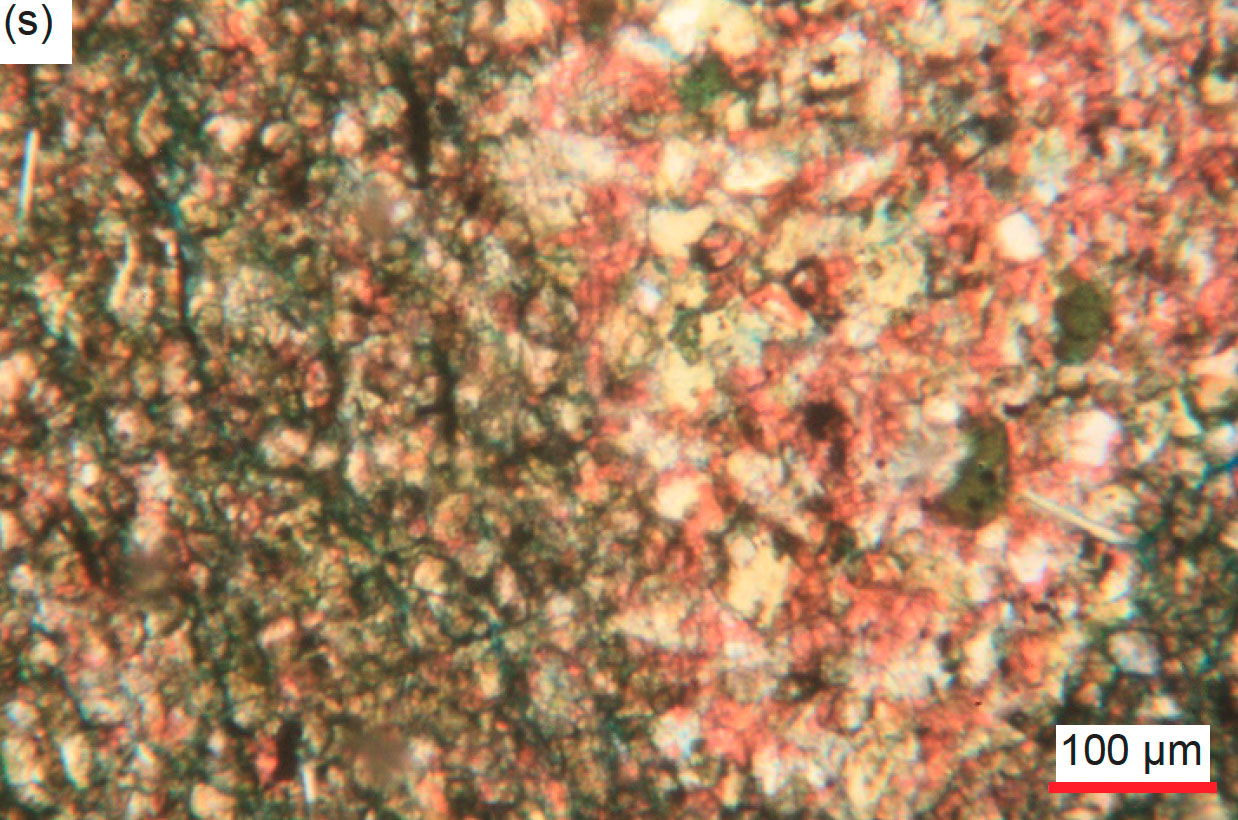
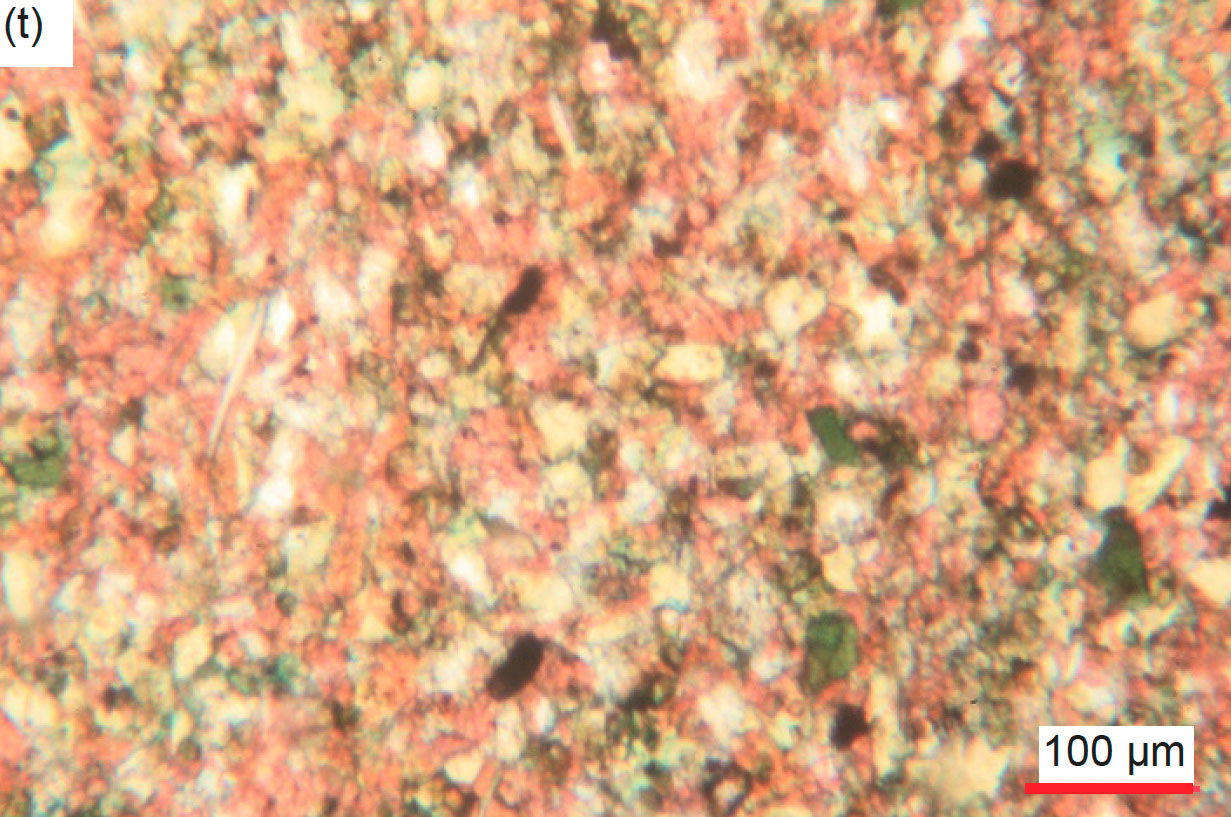
Fig. 30. A representative set of photomicrographs at various scales (as indicated) showing the glauconite grains in the Muav Formation samples from the Matkatamiba fold: (a), (b) MFML-01, (c) MFML-03, (d) MFML-04, (e) MFML-05, (f) MFML-06, (g) MFTB-01, (h) MFTB-02, (i) – (k) MFTB-03, (l) – (p) MFTB-04, (q), (r) MFTB-05, and (s), (t) MFTB-06.
Scattered through some samples are relatively long, thin/narrow, sometimes thicker, curvilinear, linear, ovoid or “worm-like” patches of tiny to very small, recrystallized calcite grains similar to the calcite matrix that are very clearly the edge-on cross-sections of detrital fossilized shells of mostly brachiopods but sometimes probably bivalves (fig. 31). Sometimes they have apparent internal divisions suggestive of internal chambers. Additionally, some curved, linear, V-shaped and flattened ovoid zones of similar recrystallized calcite grains to those within the calcite matrix are likely also edge-on slices through brachiopod, bivalve, or even gastropod or some other fossil shells. Some of these apparent cross-sections though fossil shells consist of iron-oxides-stained micro-crystalline dolomite, which must have replaced the original micro-crystalline calcite. Elsewhere, these curvilinear cross-sections are sometimes bent, some completely bent over, due to deposition and burial.
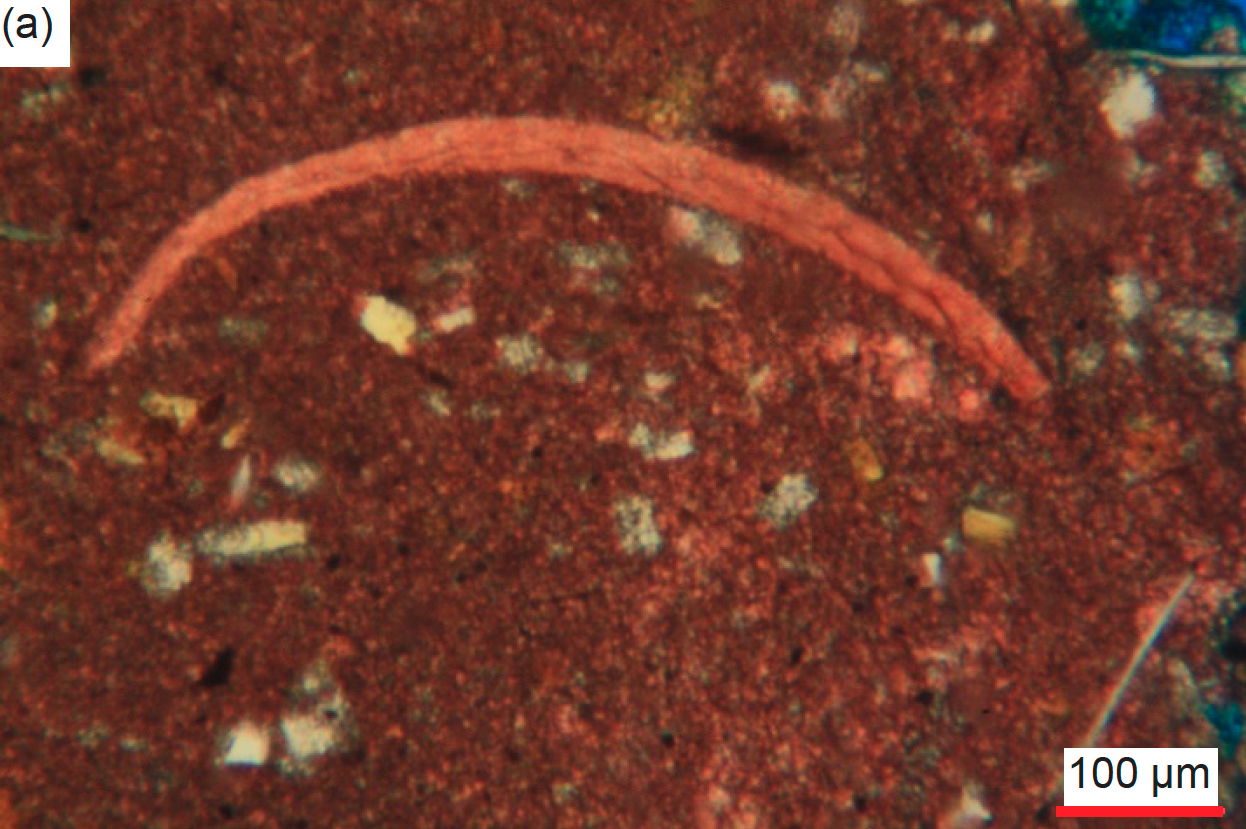
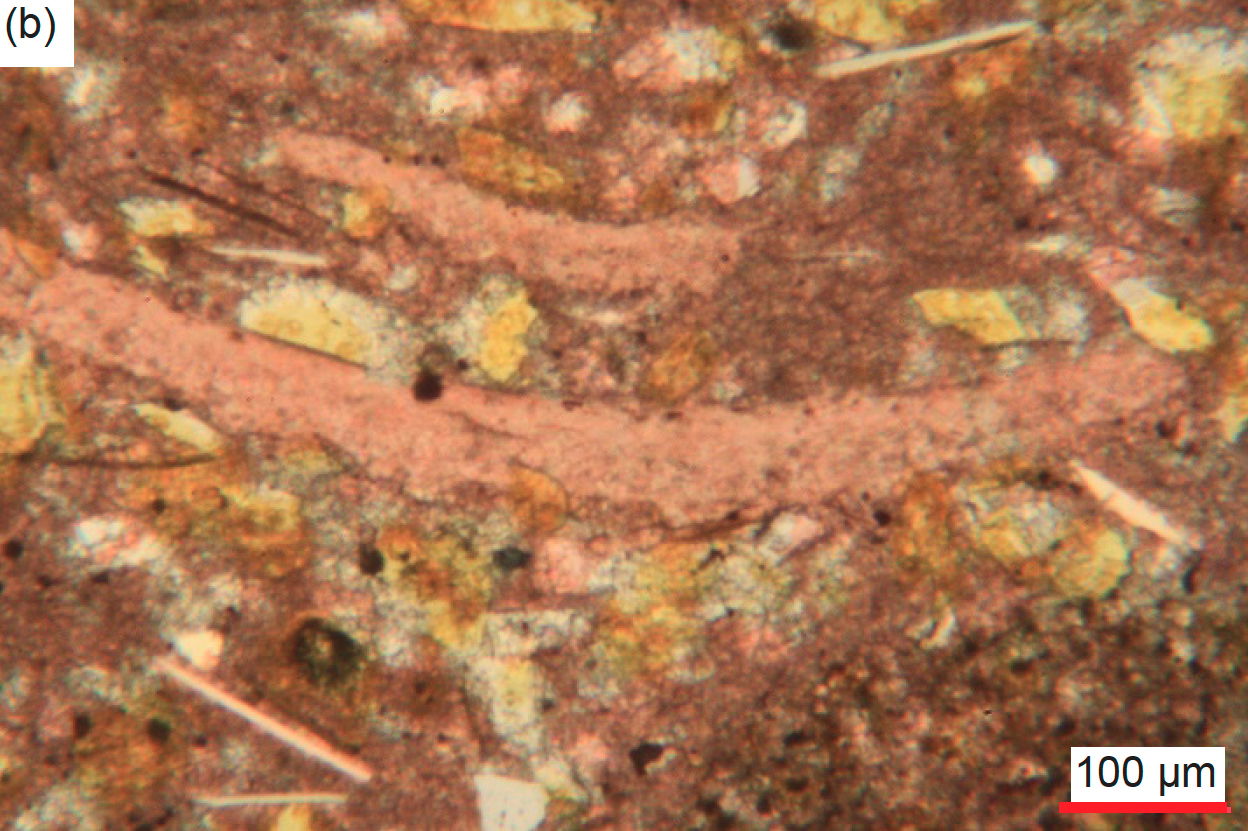
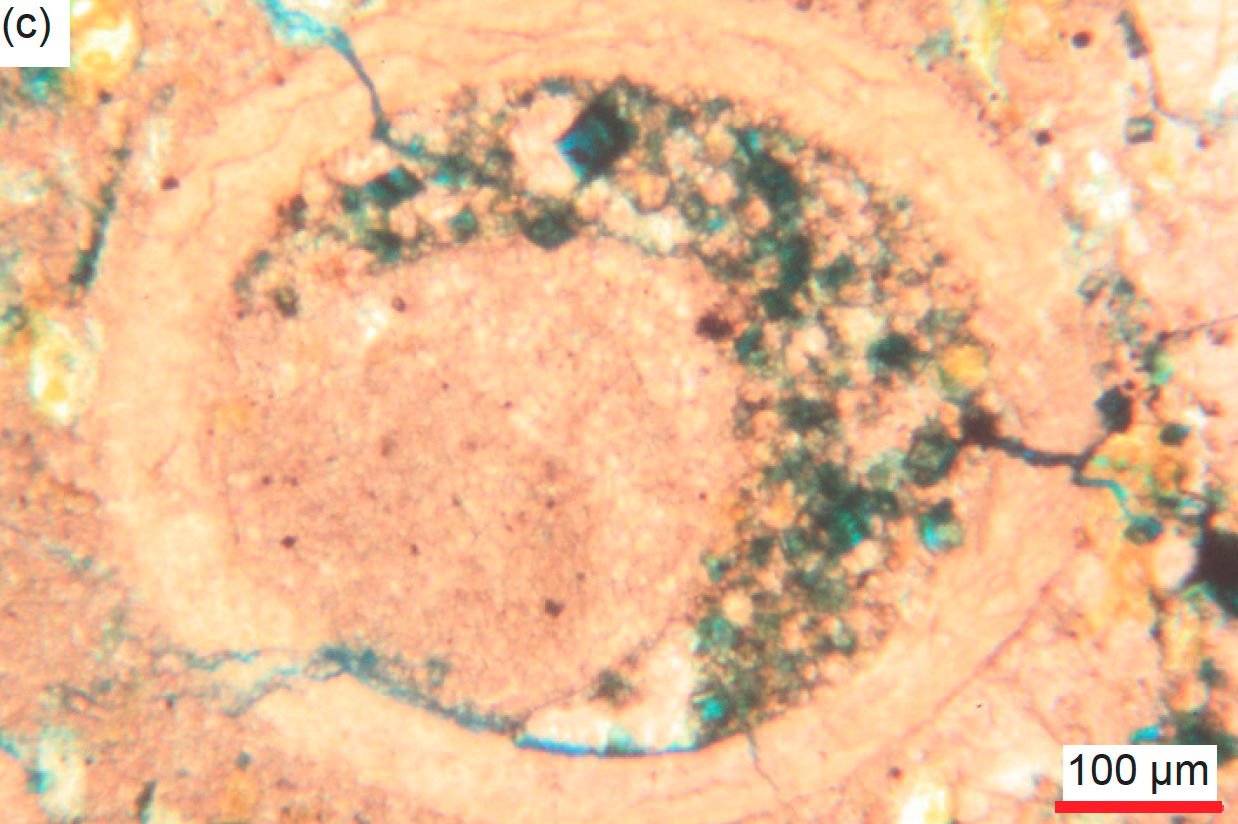
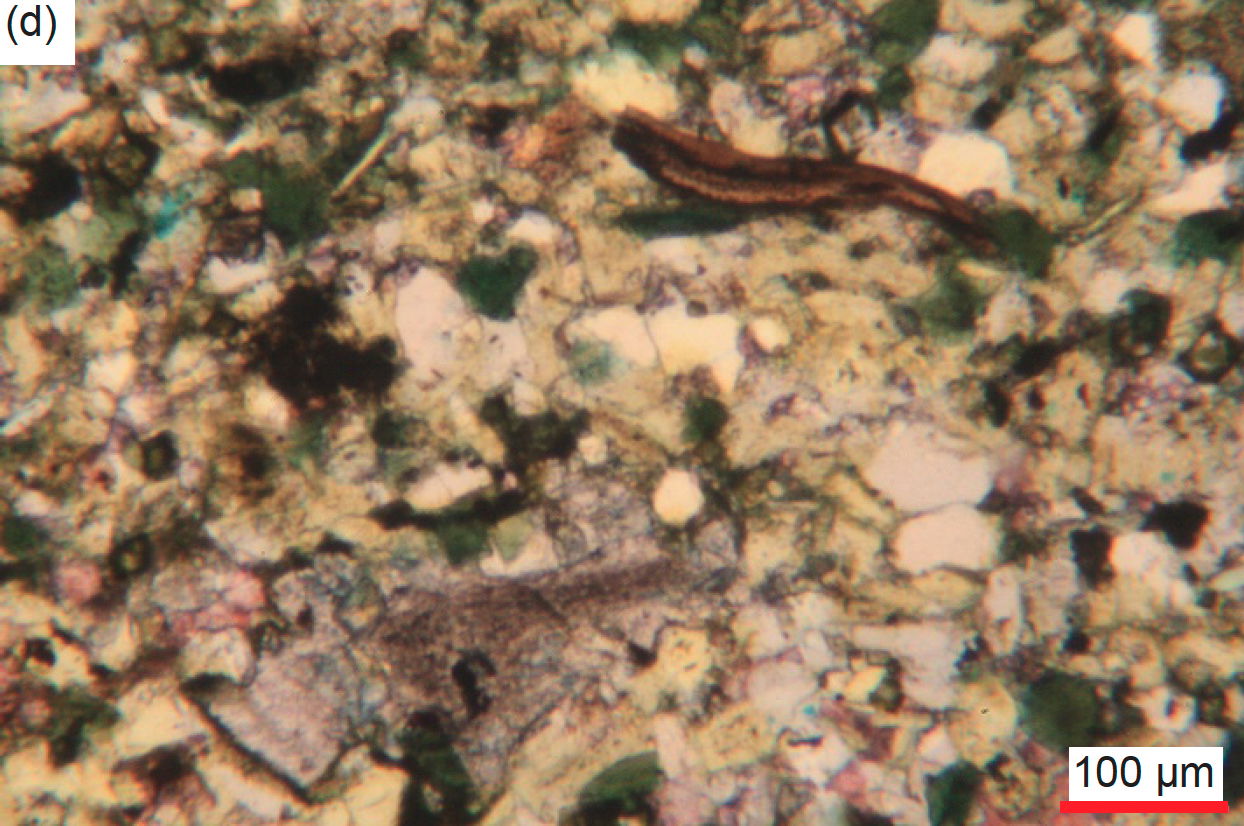
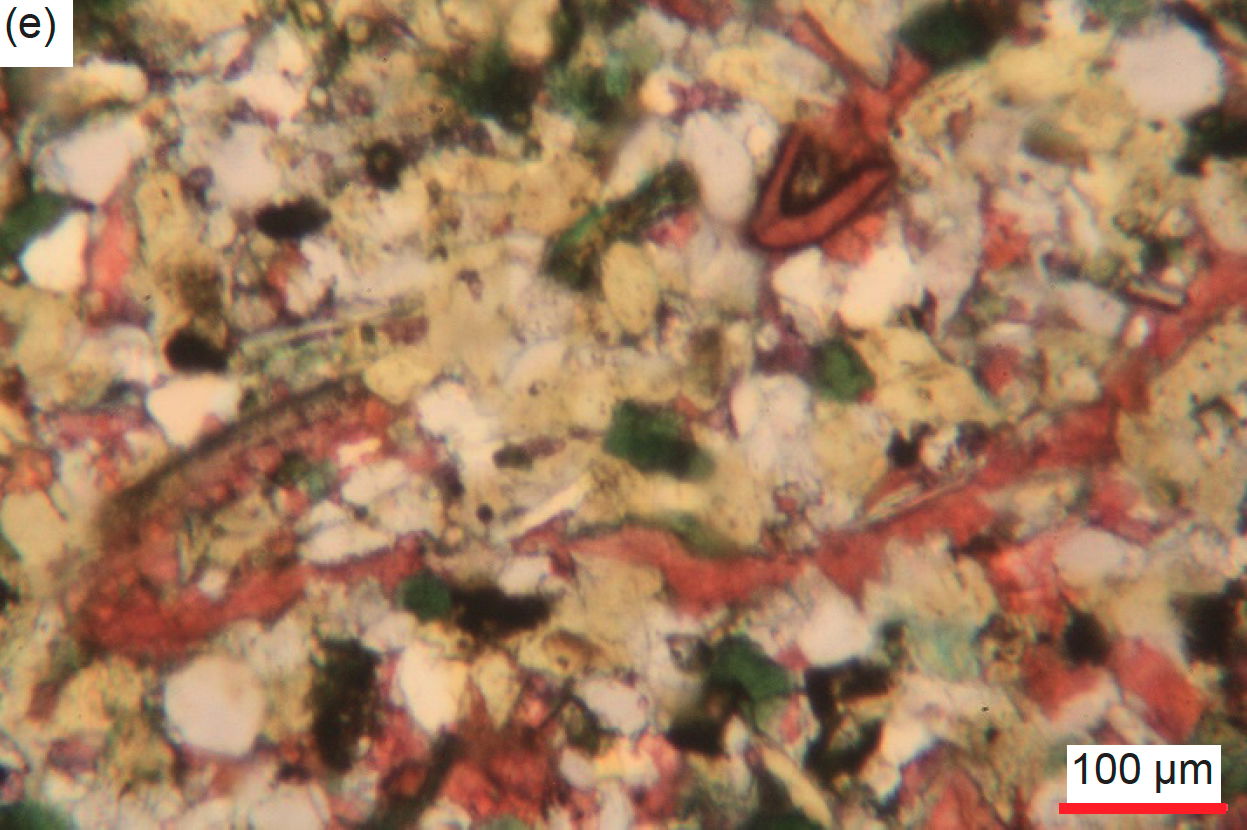
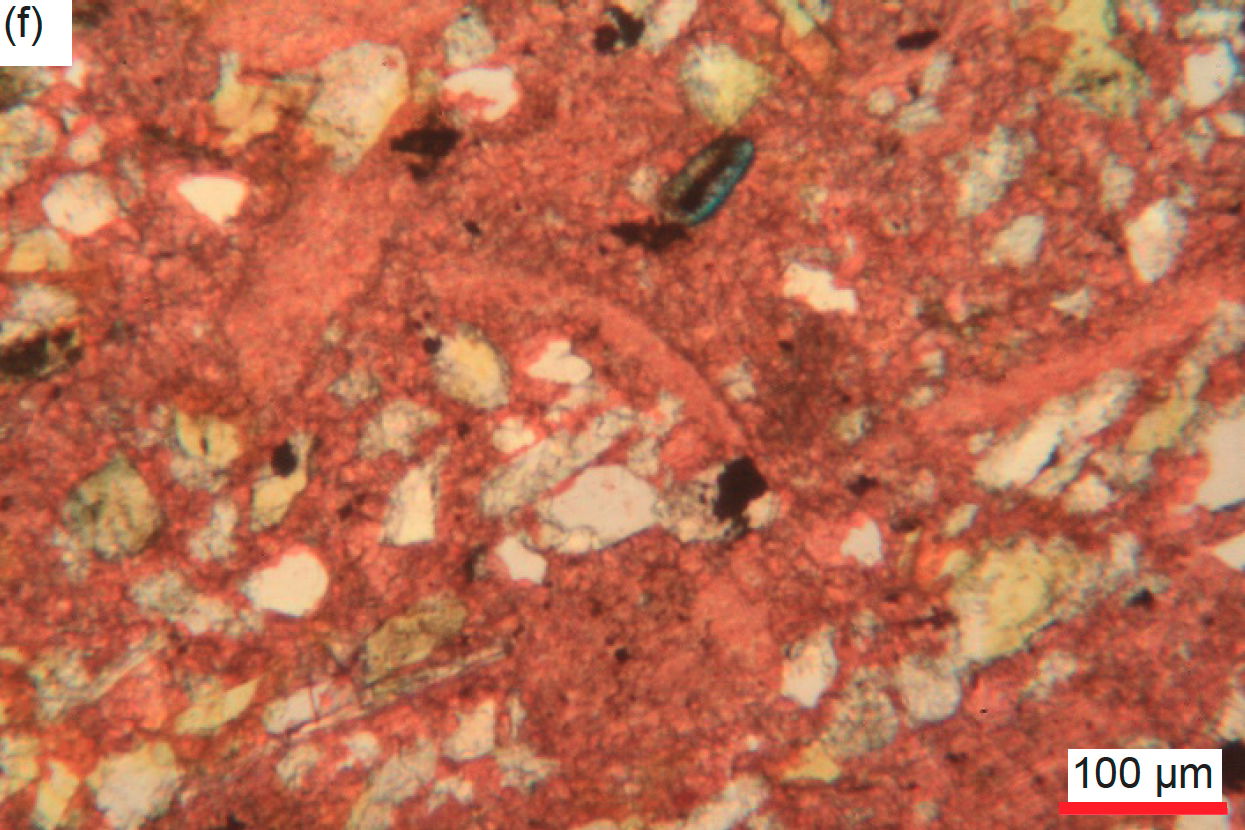

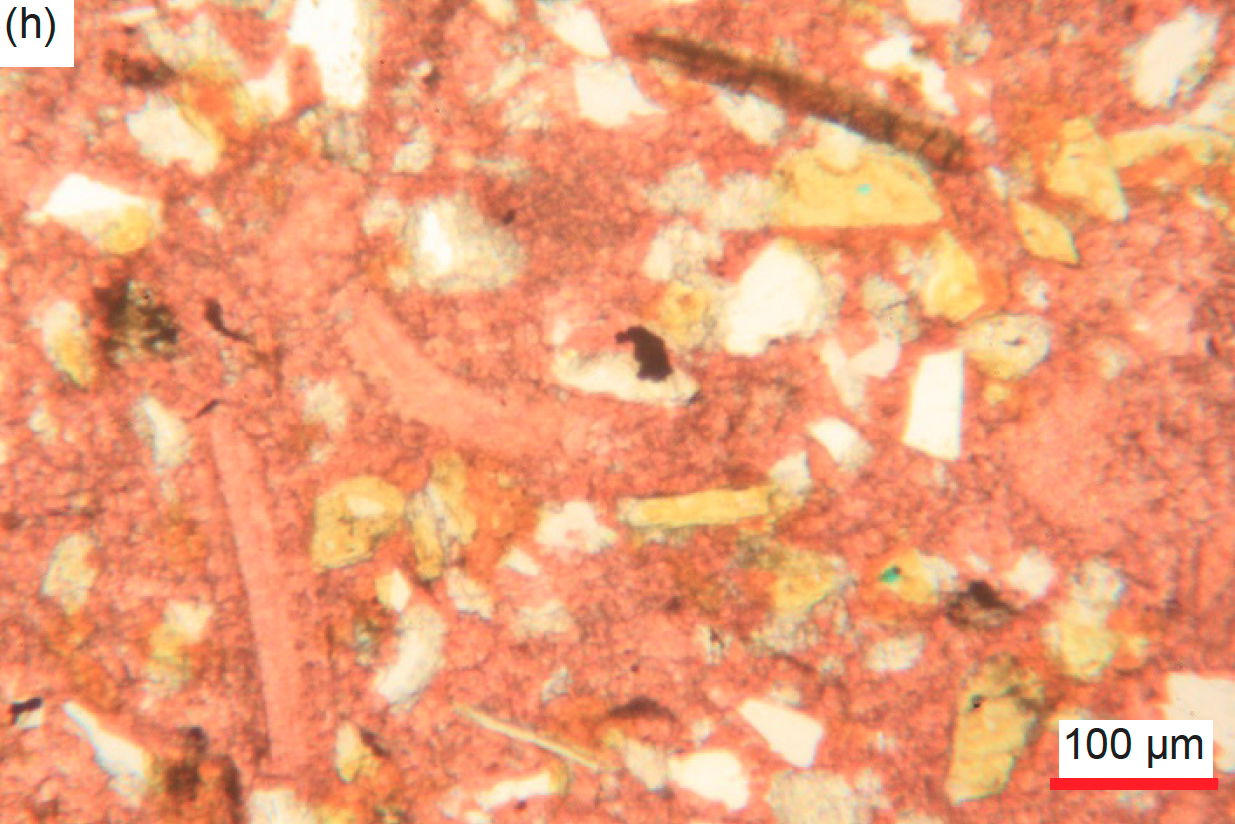
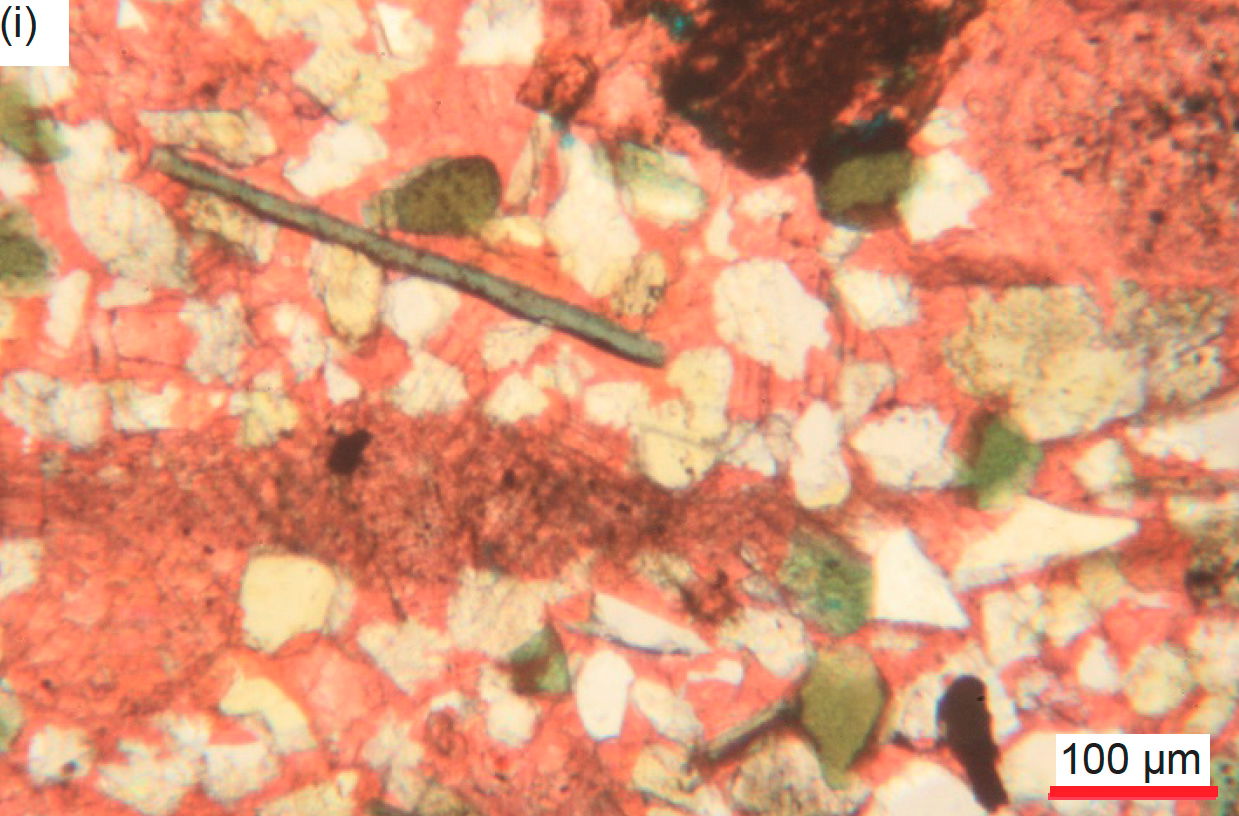
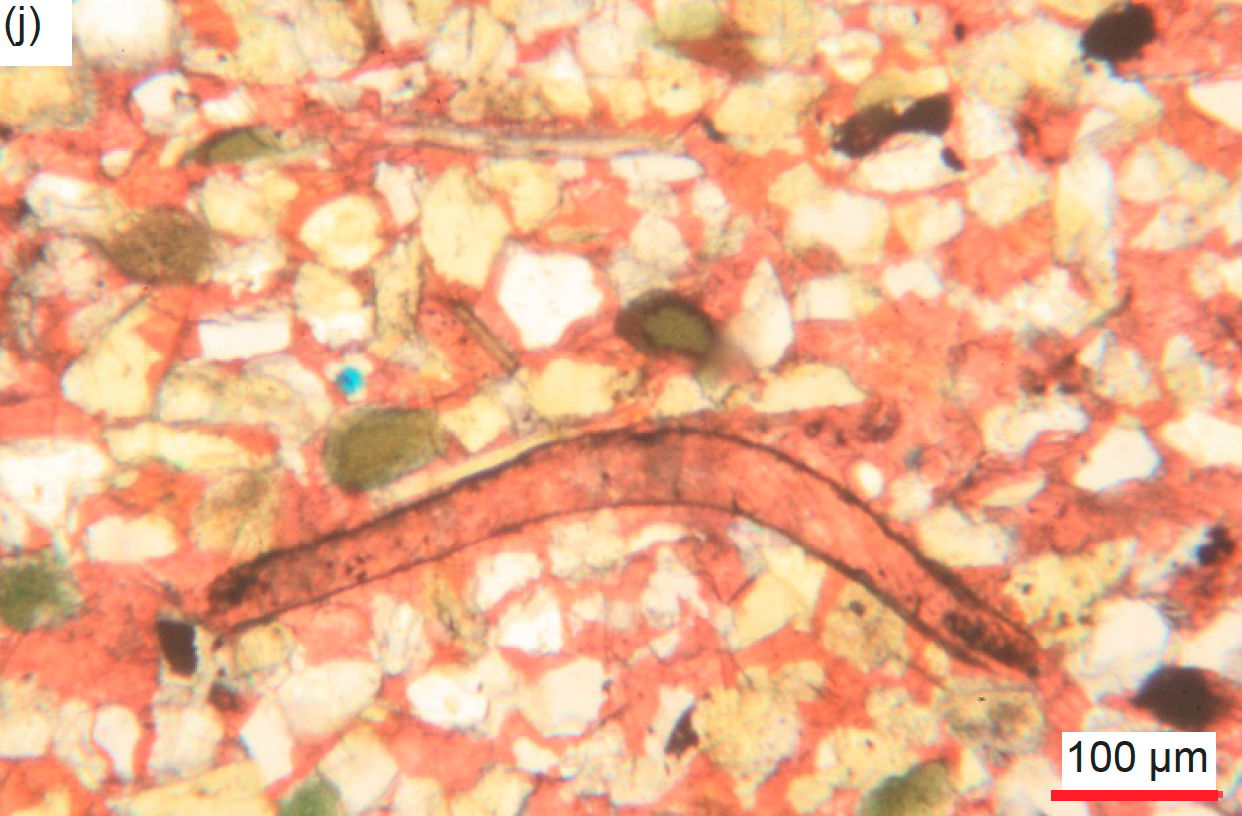
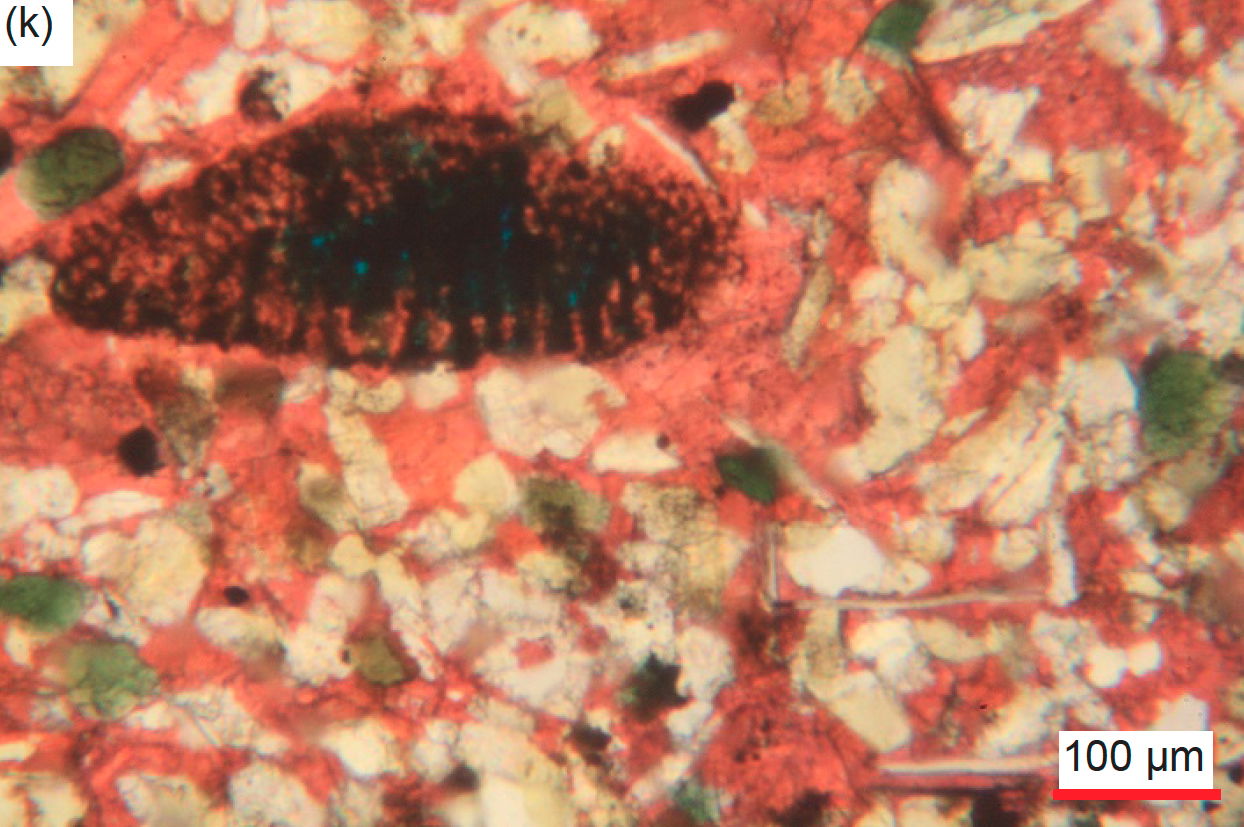
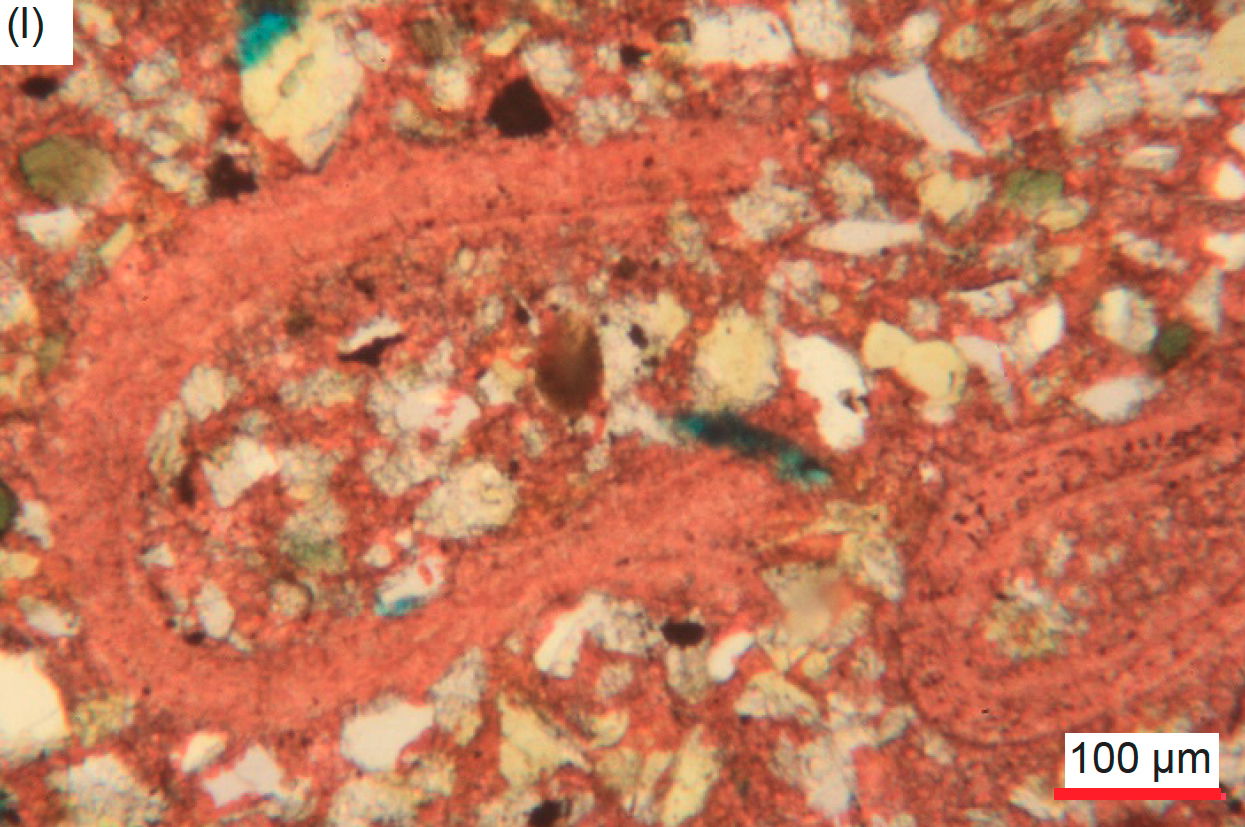

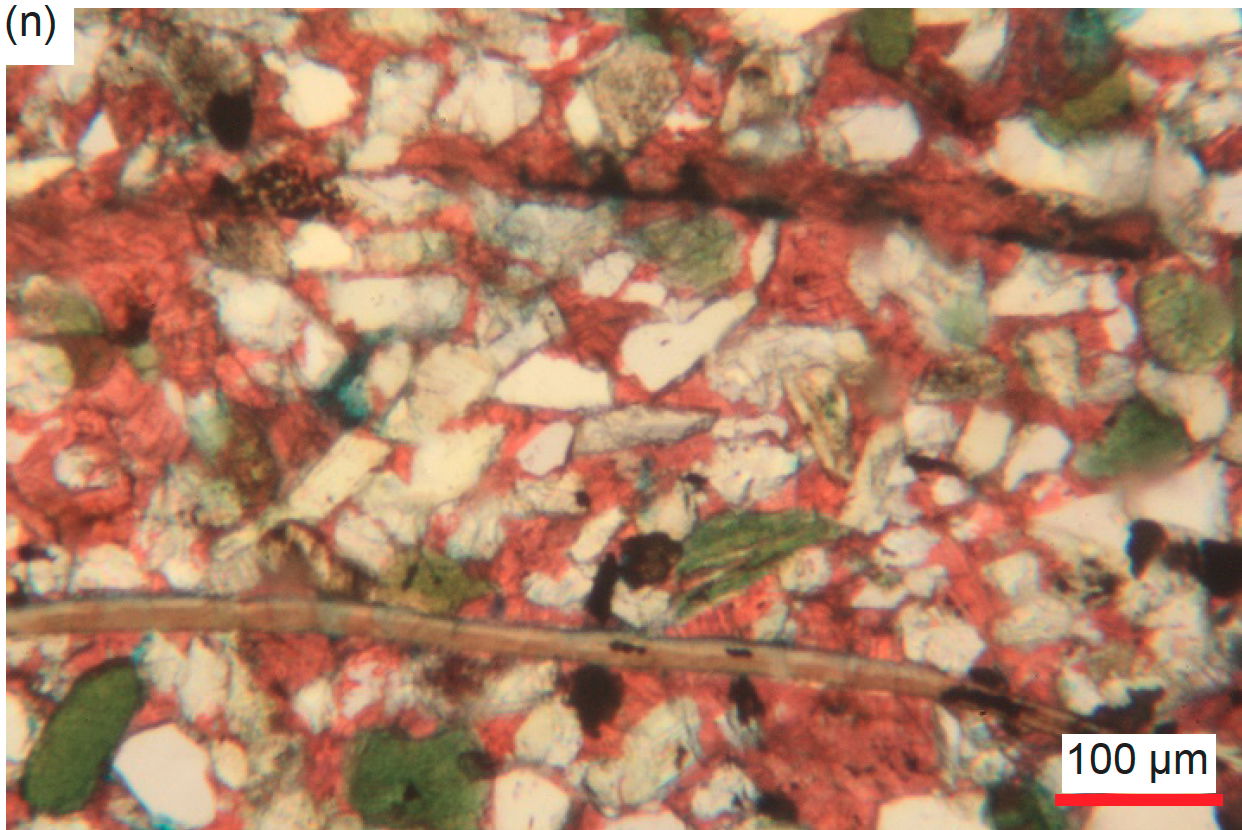
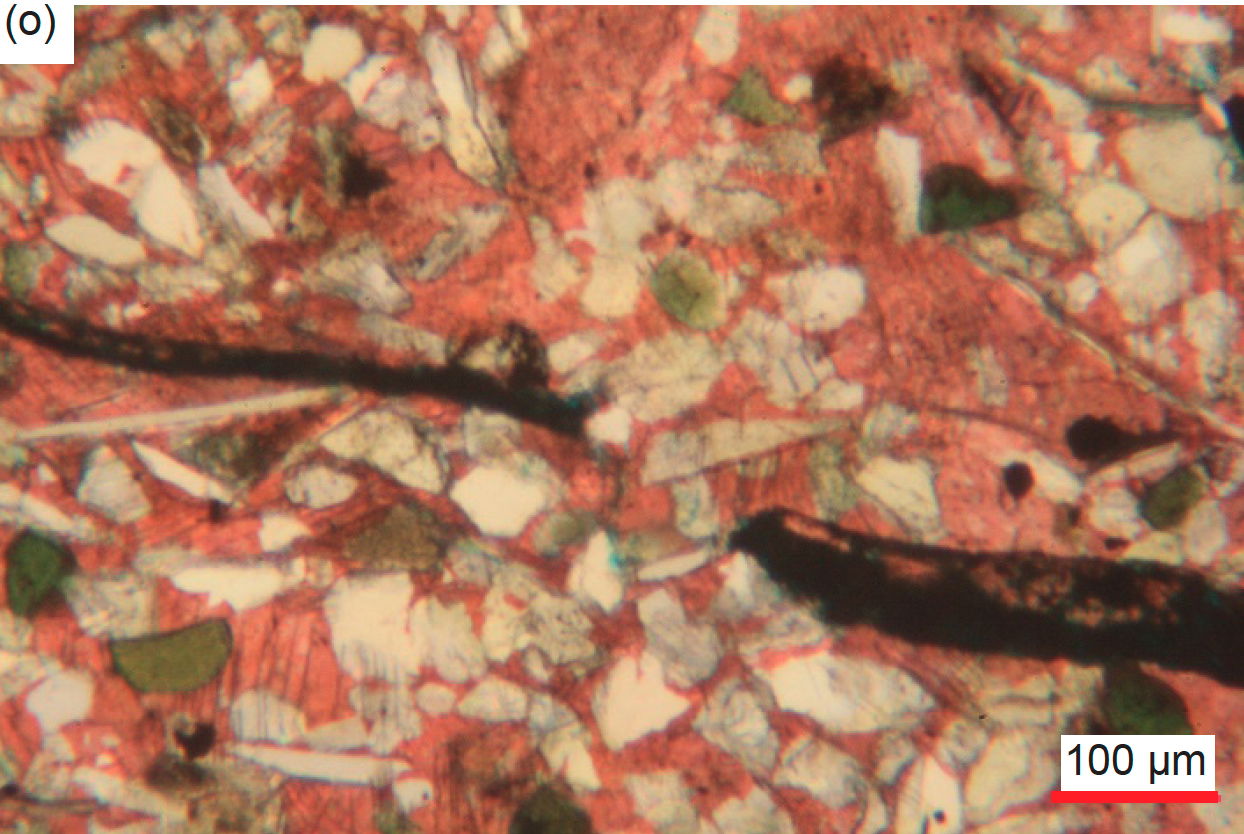
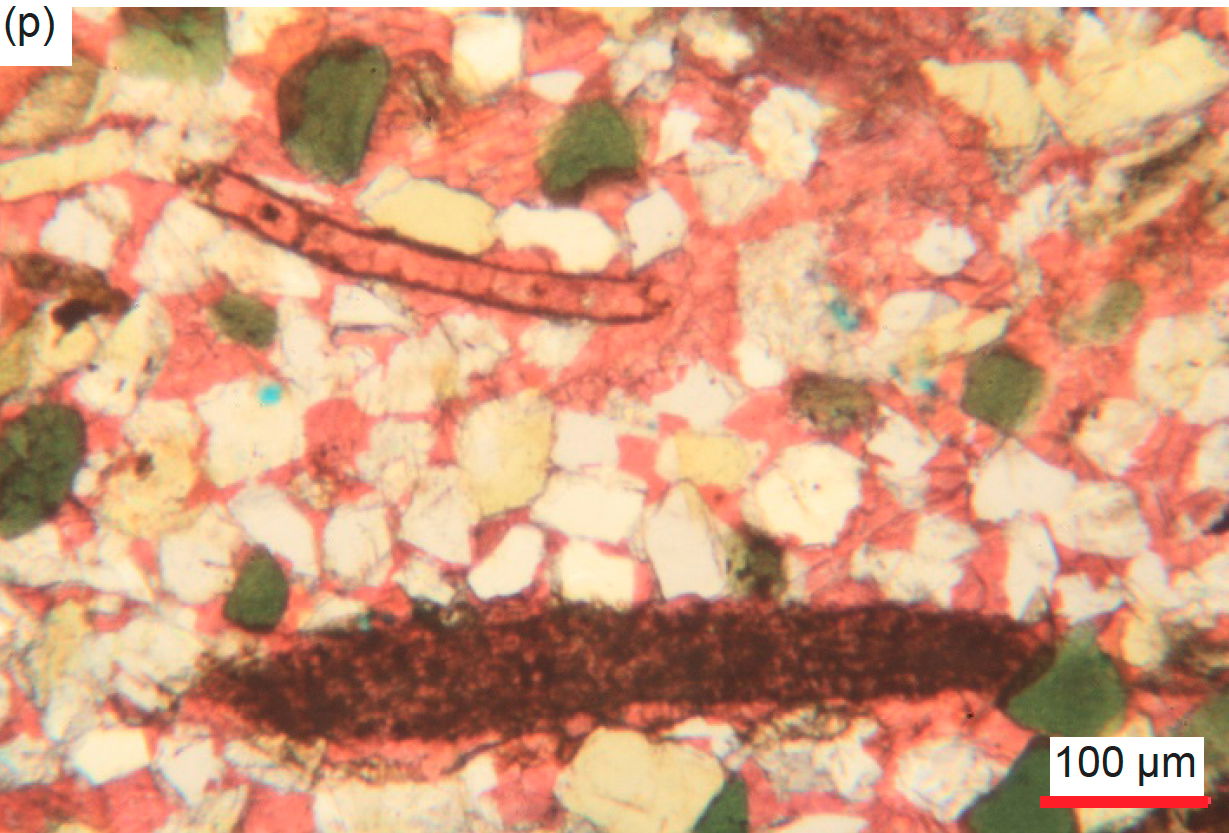
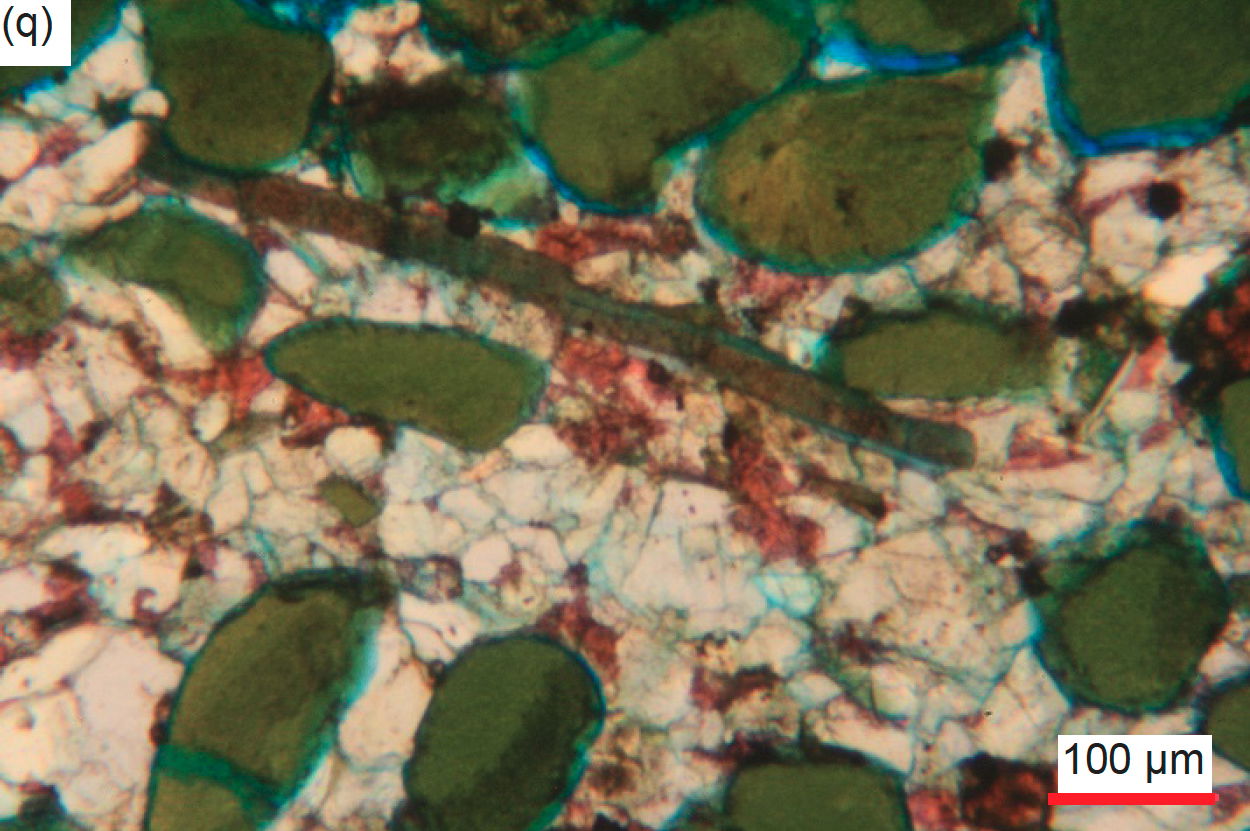
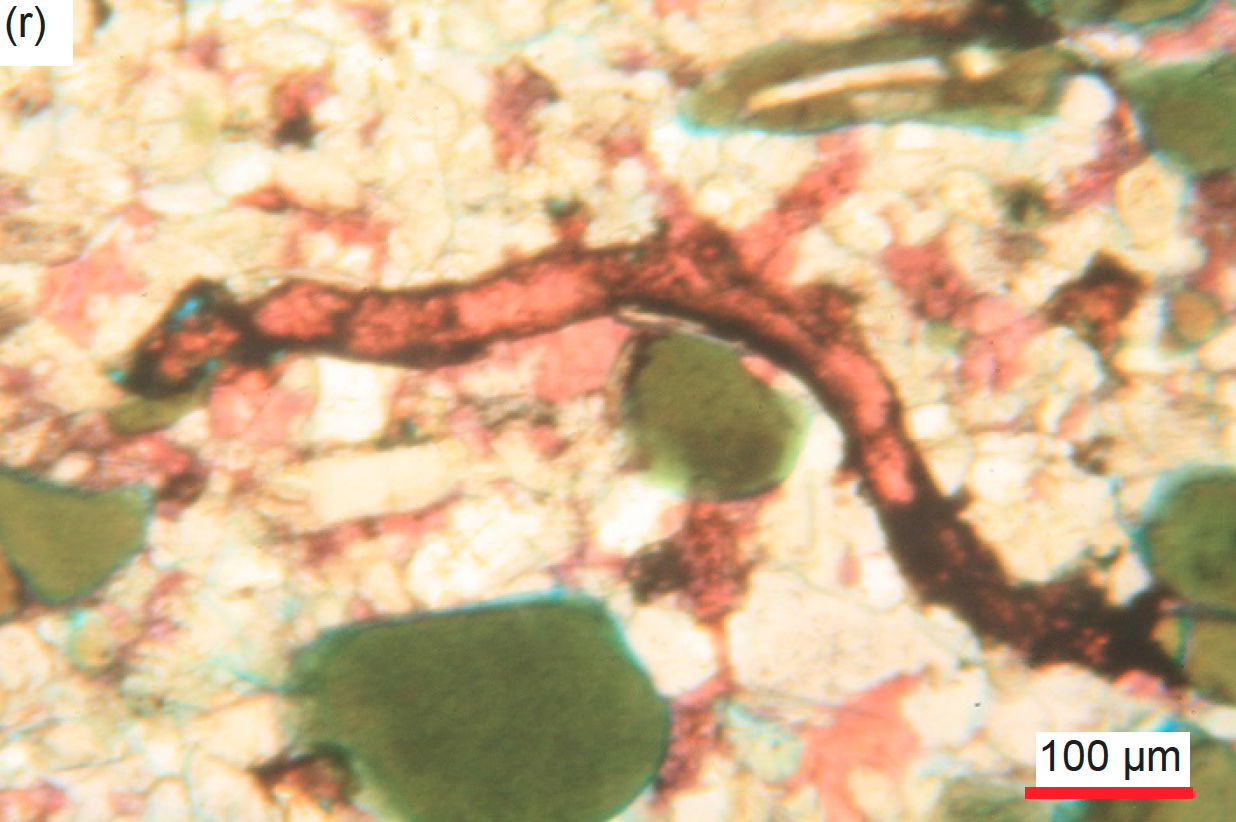
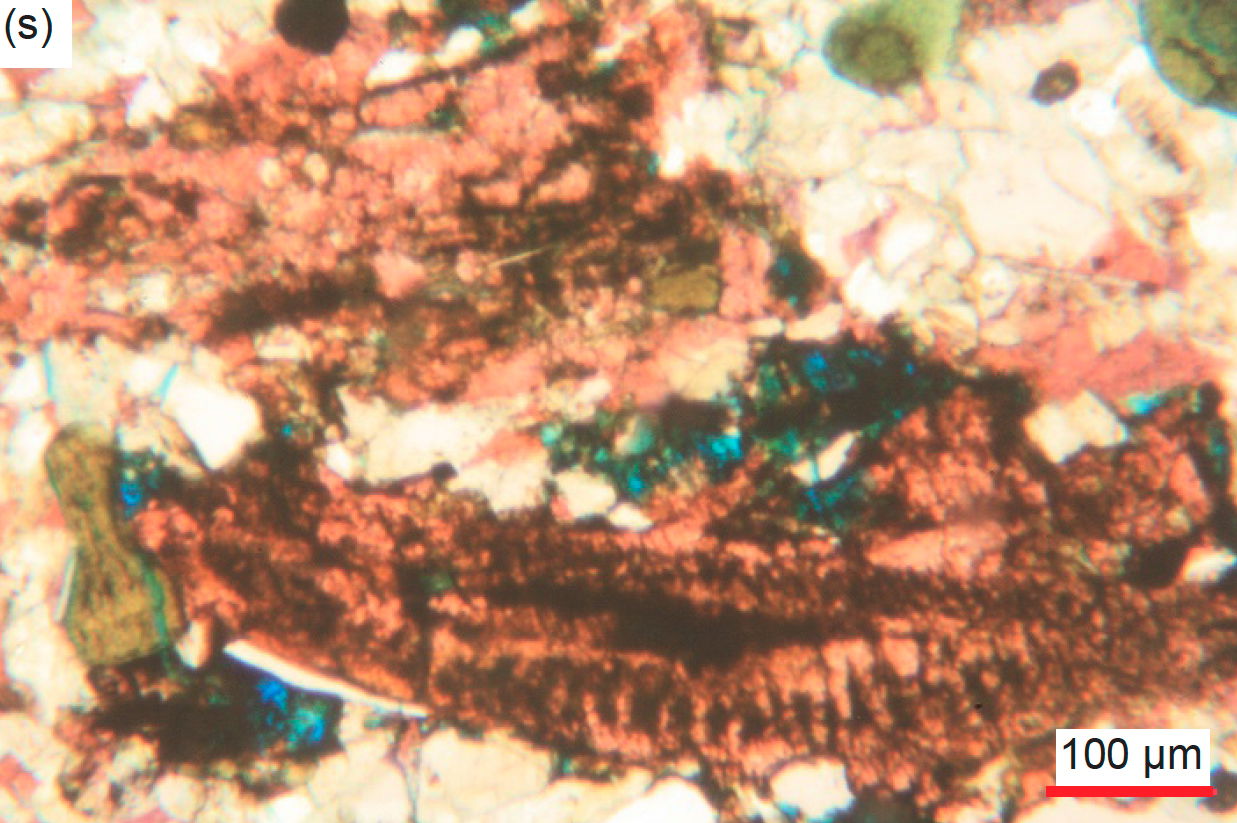
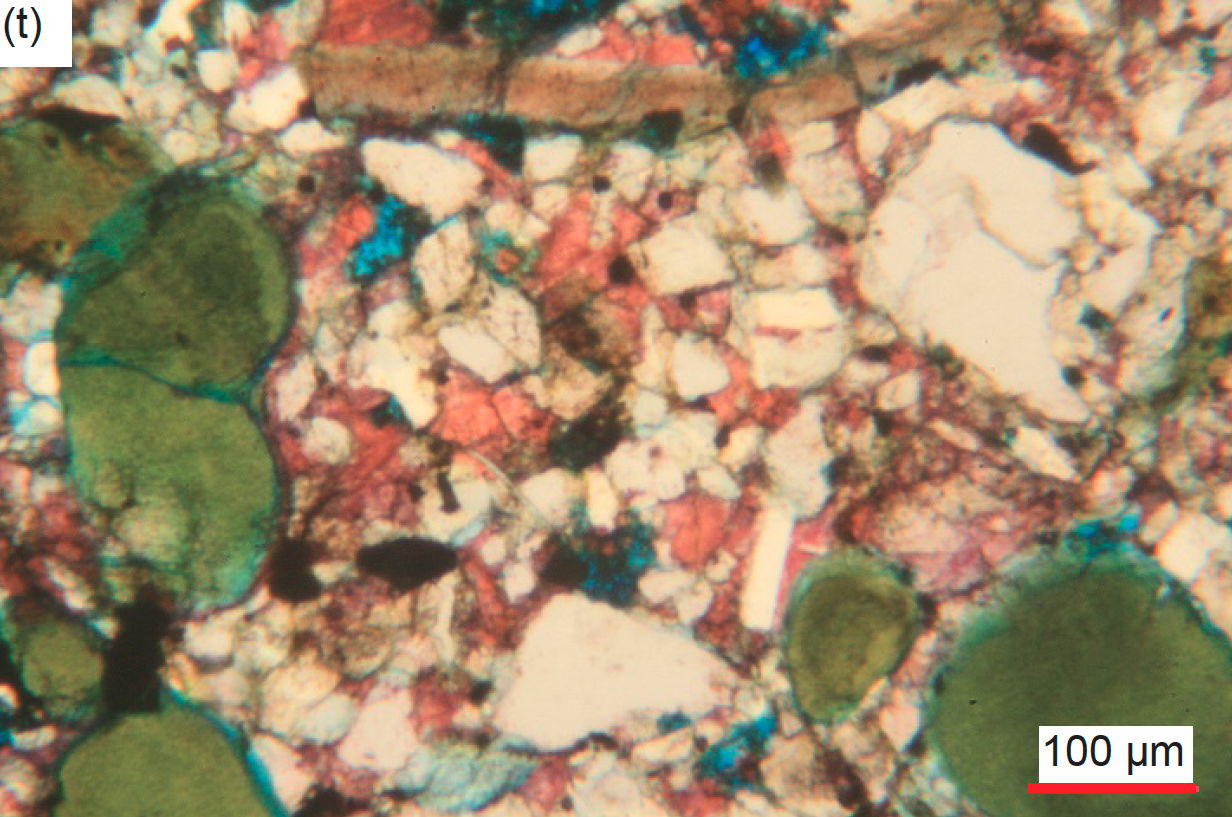
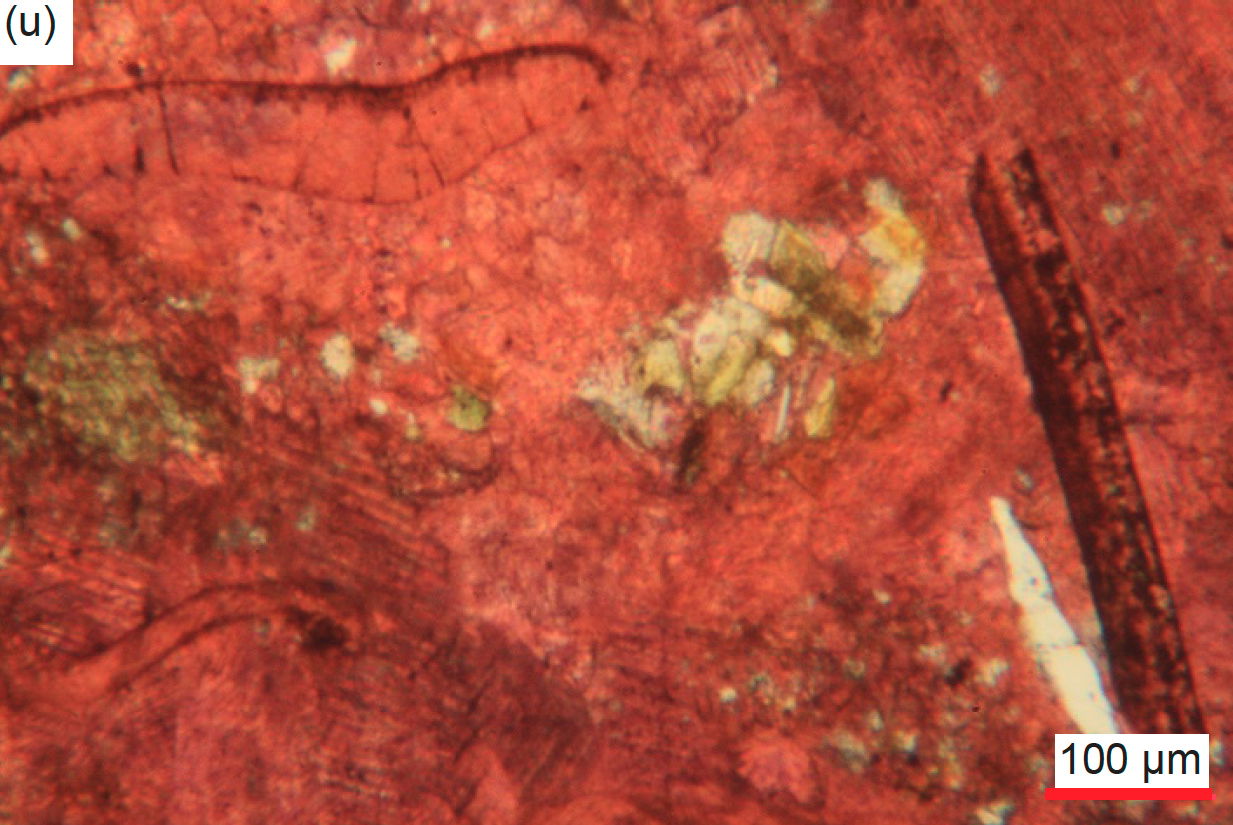
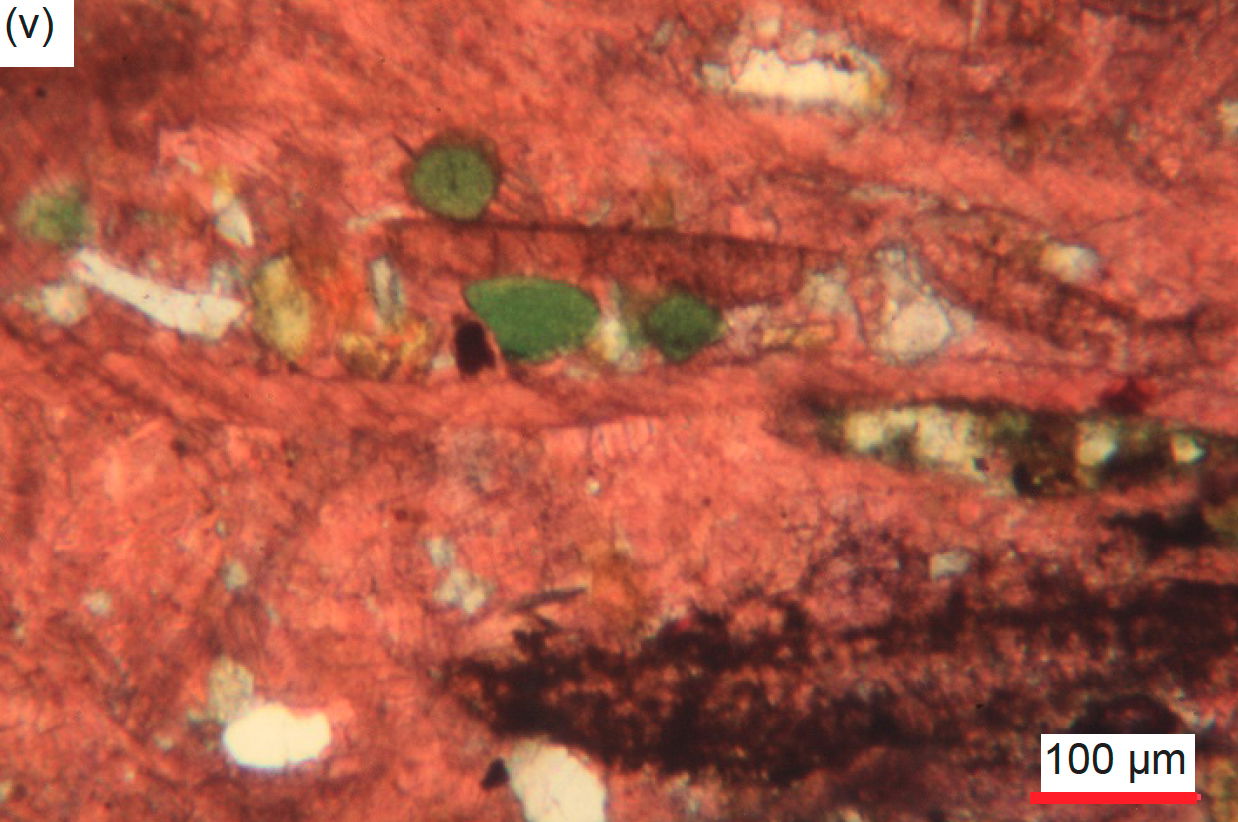
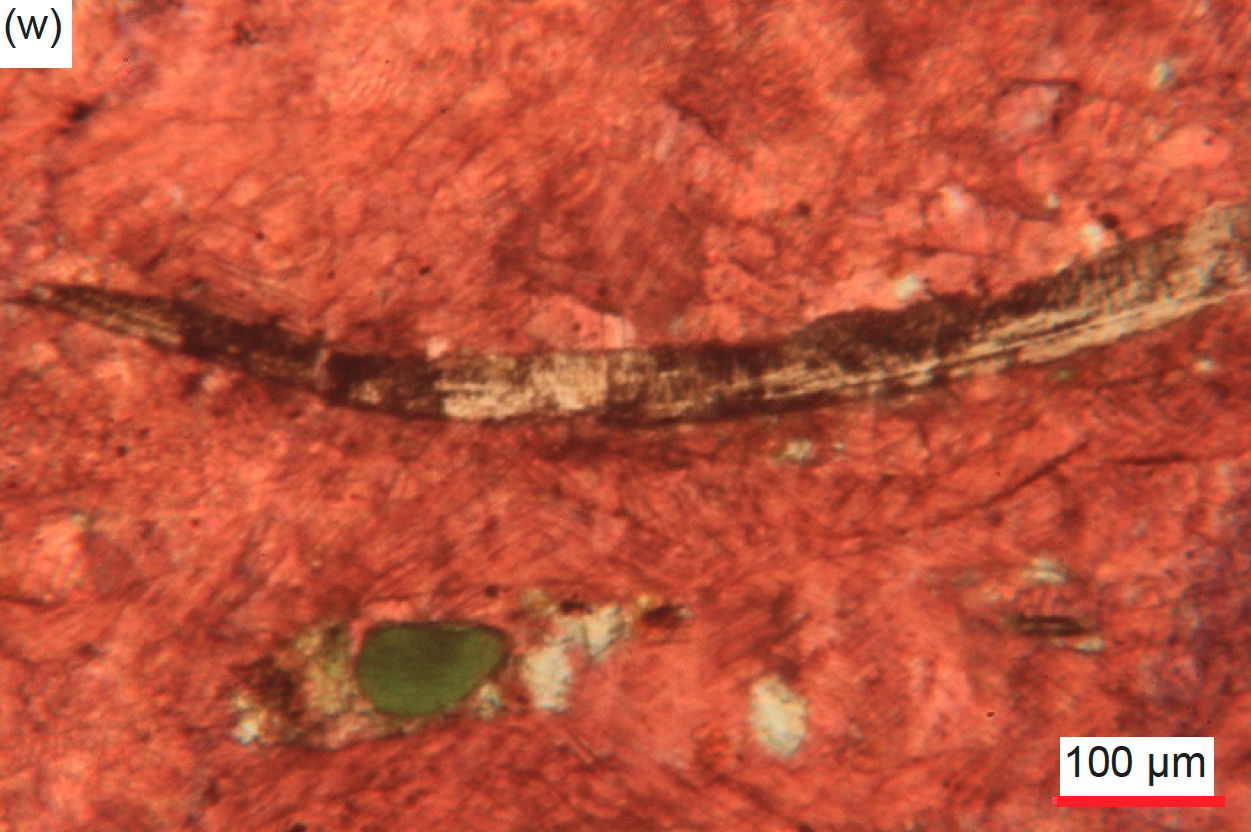
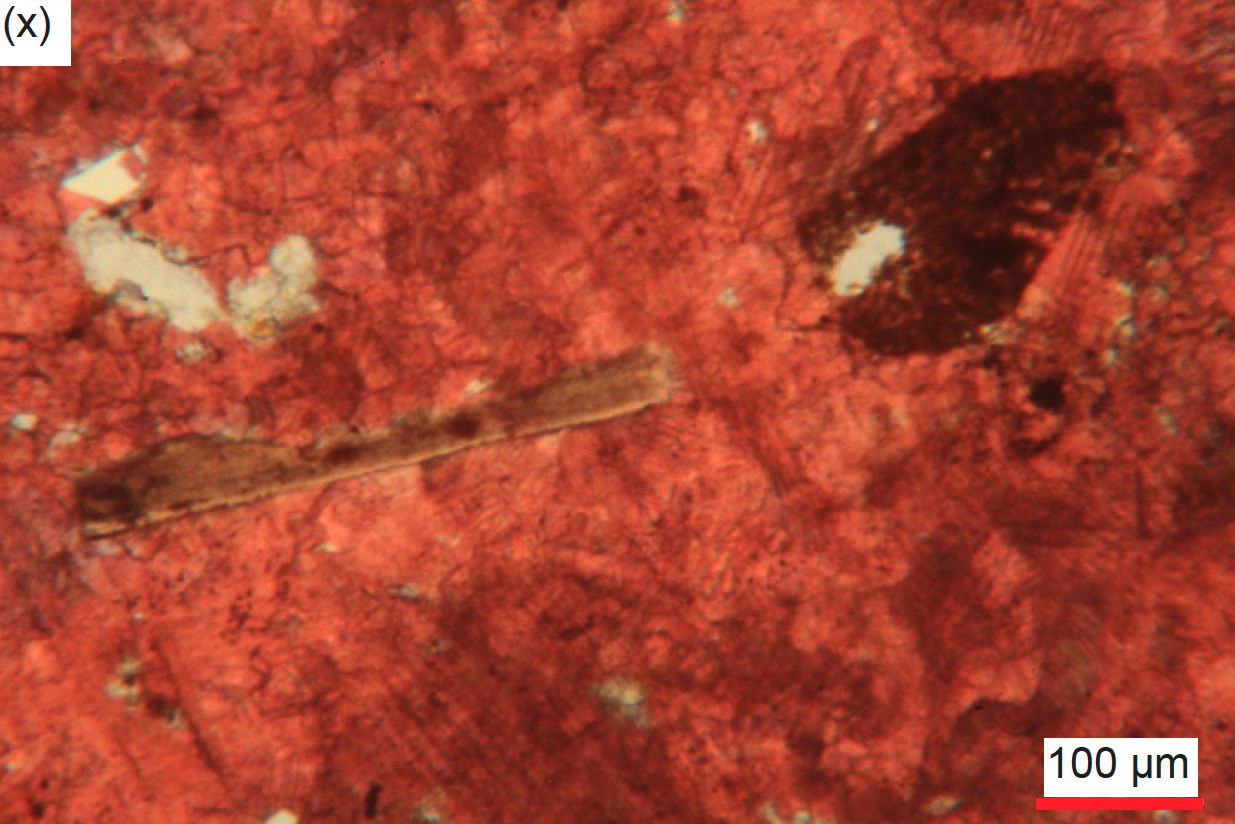
Fig. 31. A representative set of photomicrographs at various scales (as indicated) showing the detrital fossilized shell fragments in cross-section in the Muav Formation samples. Distal samples: (a) MLS-02, and (b), (c) MLS-03. Matkatamiba fold samples: (d), (e) MFML-01, (f), (g) MFML-06, (h)–(l) MFTB-02, (m)–(p) MFTB-03, (q)–(t) MFTB-04, and (u)–(x) MFTB-05.
Original detrital muscovite flakes are present in all samples but in varying quantities which are difficult to specify because in the XRD analyses muscovite also registered as illite (table 2). Due to the thin sections being cut perpendicular to the bedding, these muscovite flakes are always seen edge-on as thin or thicker cross-sections of books of thin sheets (fig. 32). The abundance of these edge-on muscovite flakes varies from rare and a few in some samples to occasional or many and numerous in other samples. They vary in size from tiny and very small in length to small, medium, long/large and very long. They are usually scattered through the rock fabric at various angles wedged tightly between the other grains in the calcite (or dolomite) matrix, but often parallel to the bedding and to laminations, even when several are in proximity to one another. Sometimes, several flakes are stacked on top of one another. Some longer flakes are bent or broken and wedged between and around quartz, K-feldspar, and glauconite grains, occasionally with split and/or frayed ends. These features, namely, wedged between other detrital grains, and bent round them occasionally with split or frayed ends, as well as often being generally parallel to the bedding and to laminations, are consistent with these muscovite flakes also being detrital grains. In some samples, there are areas where the long thin edge-on muscovite flakes are at the same oblique angle with elongated quartz and K-feldspar grains, all aligned parallel at the same oblique angle to the bedding within the calcite matrix, which would be a primary depositional feature. Bedding planes can also be accompanied by thin edge-on muscovite flakes paralleling them.
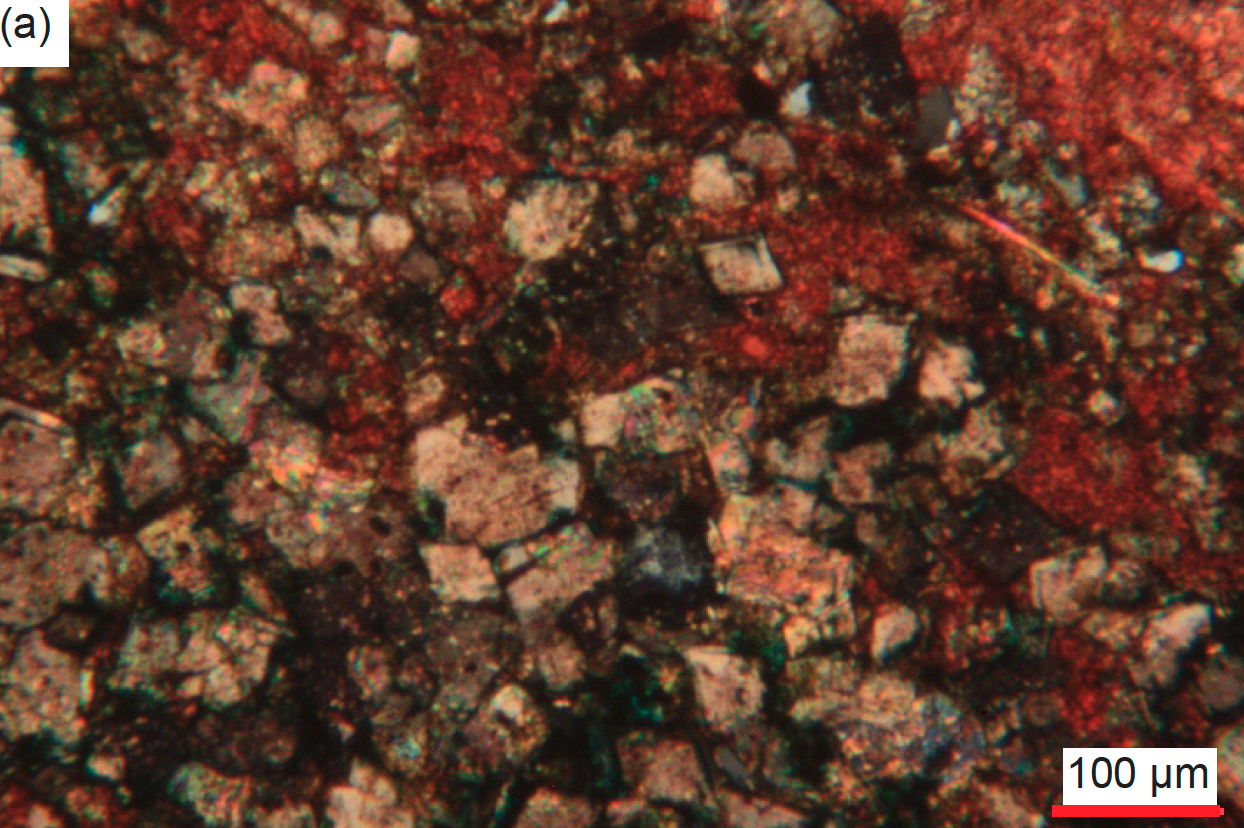
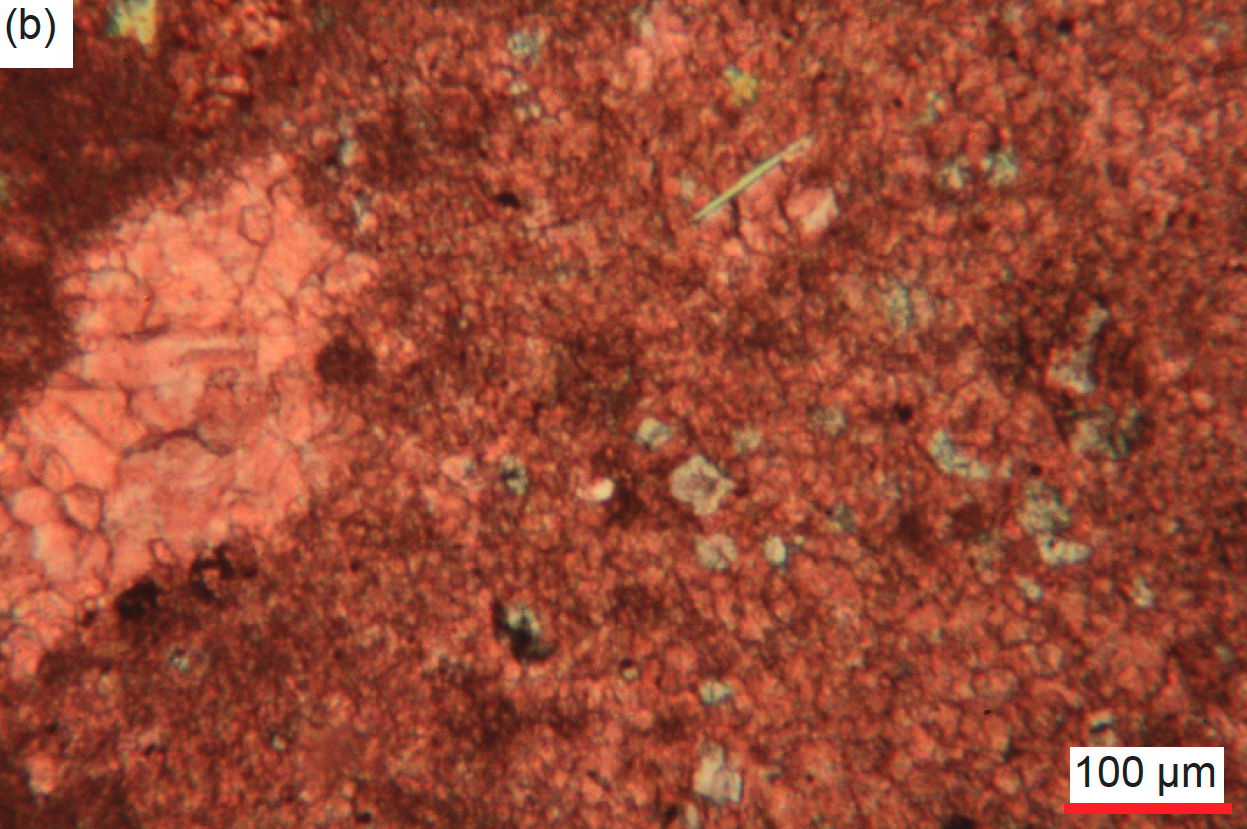
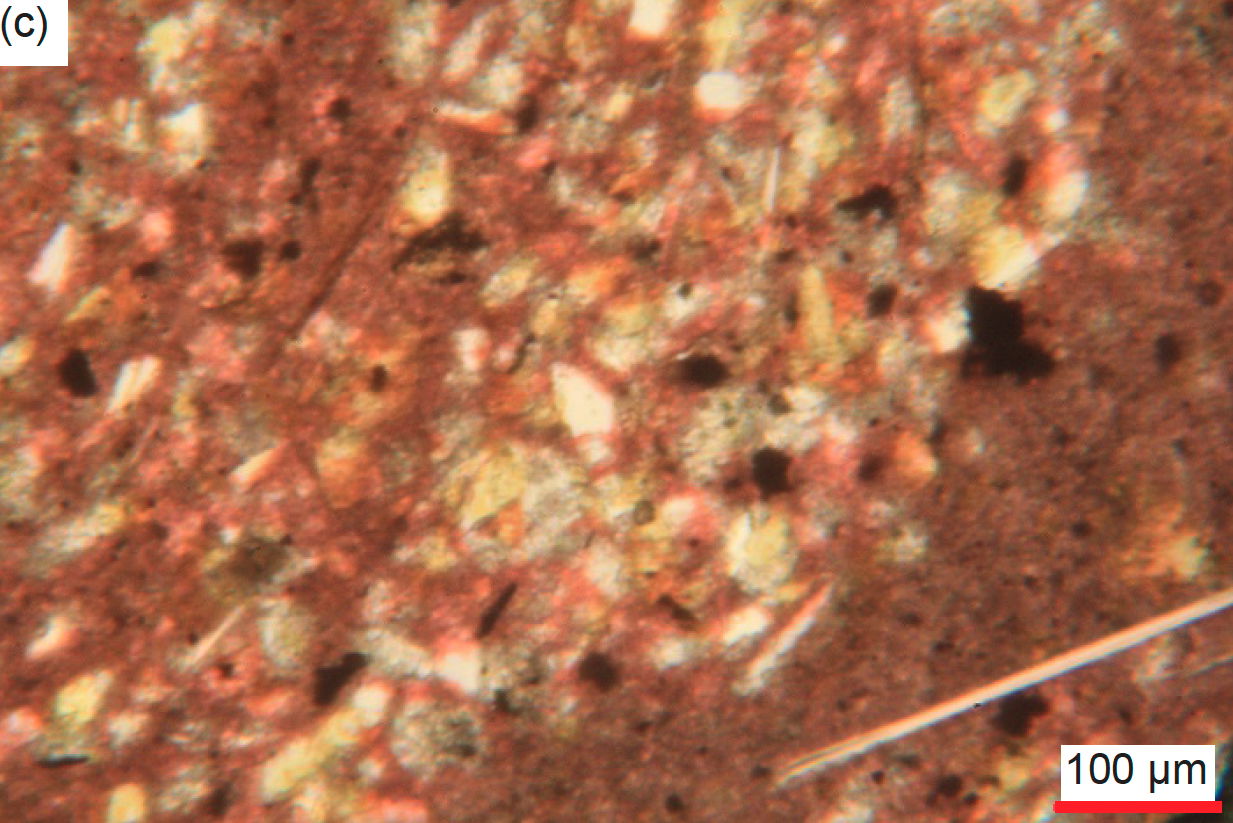
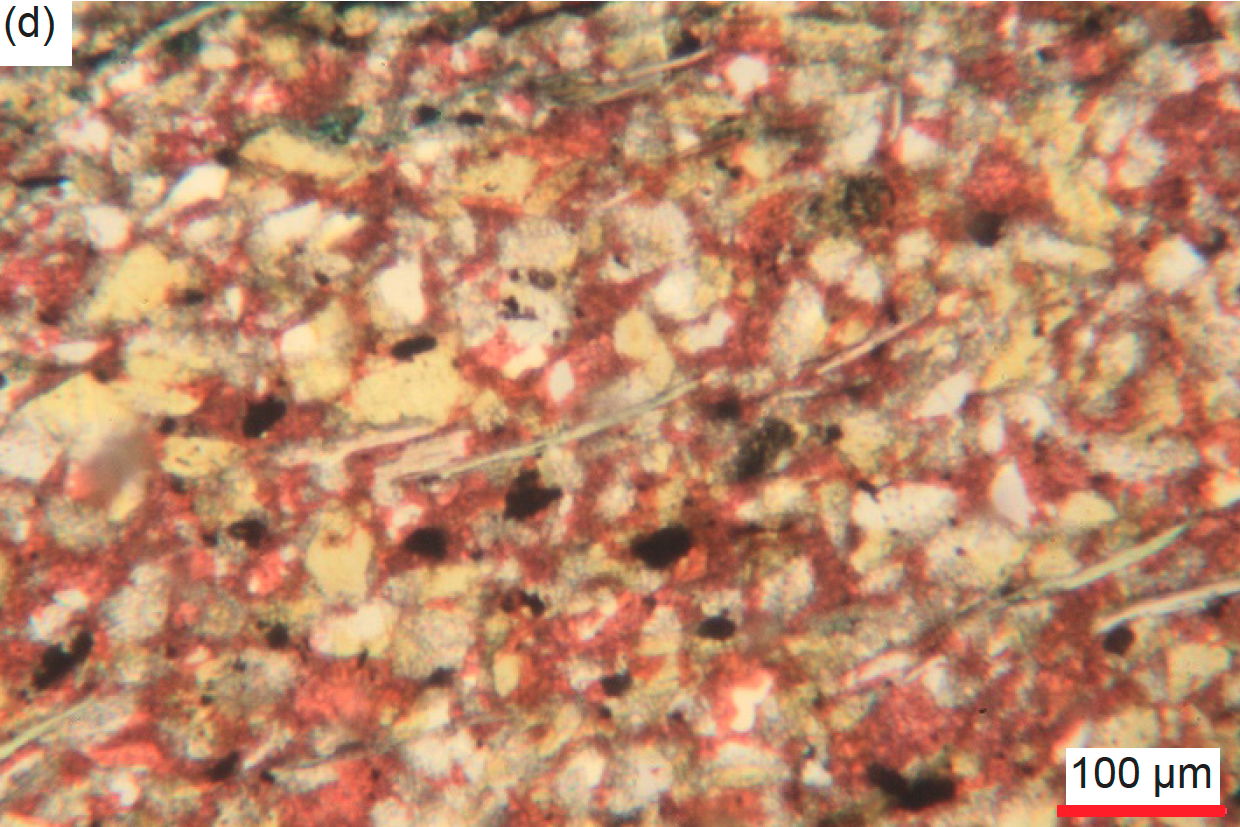
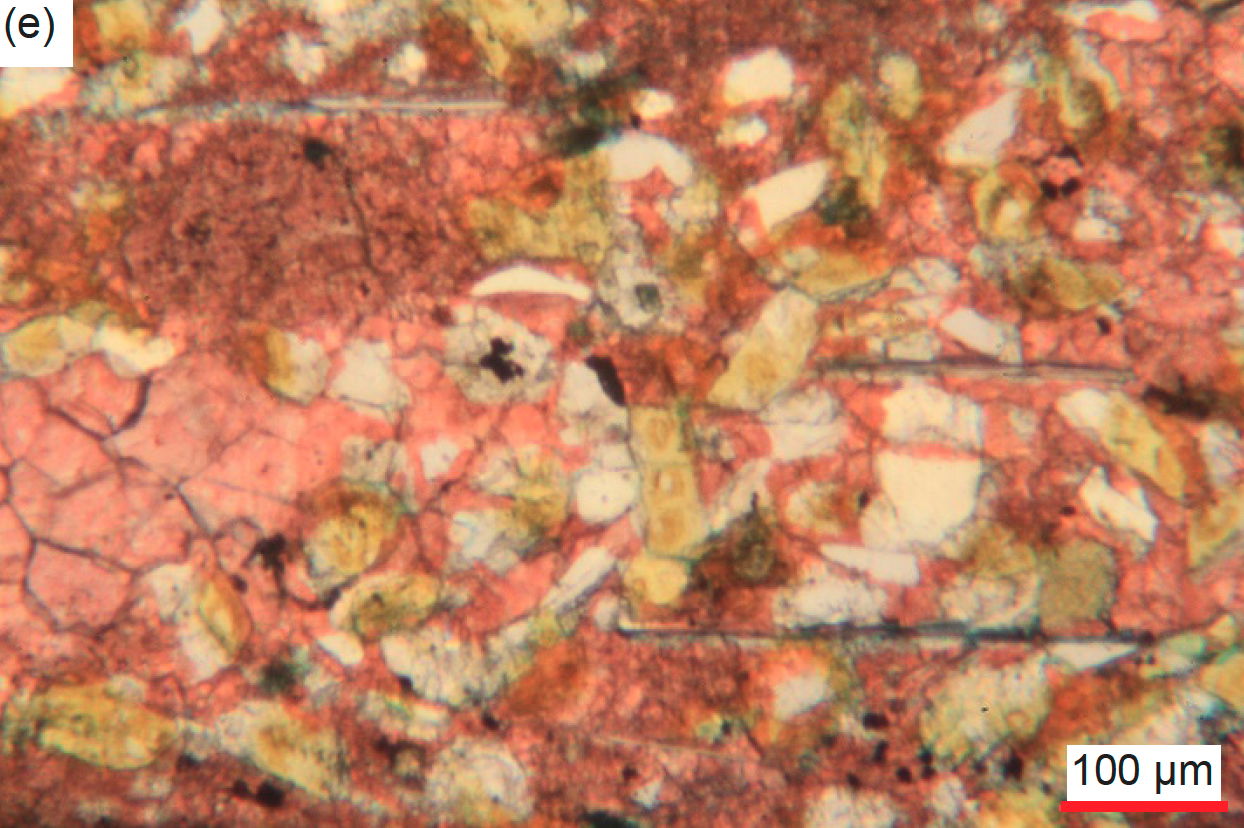
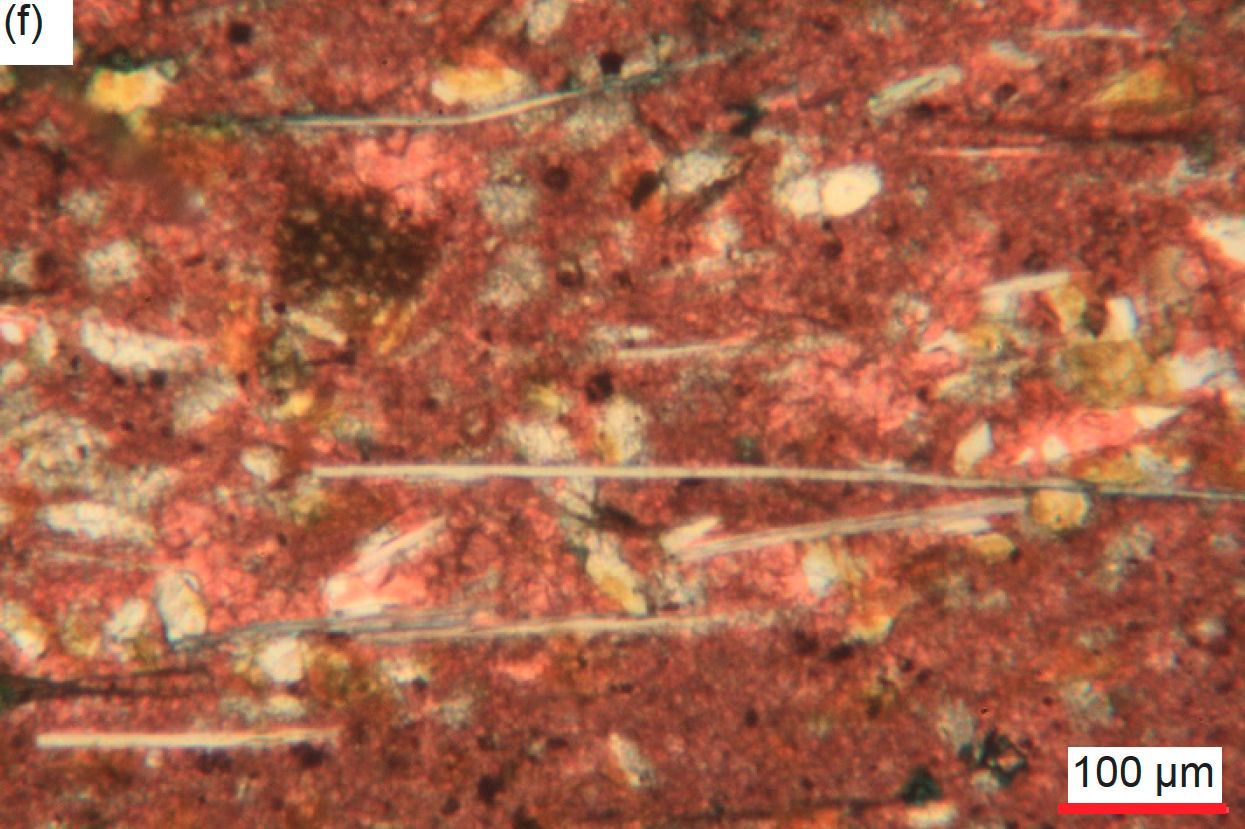
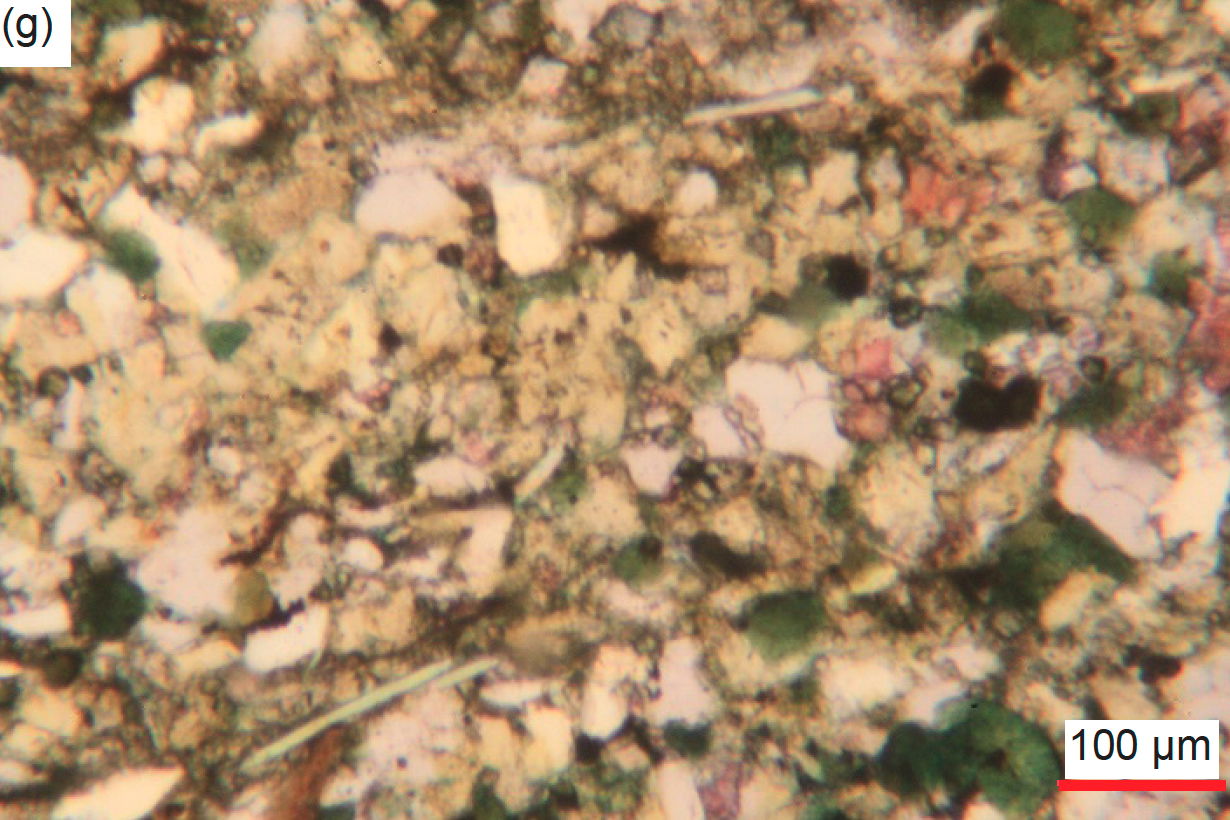
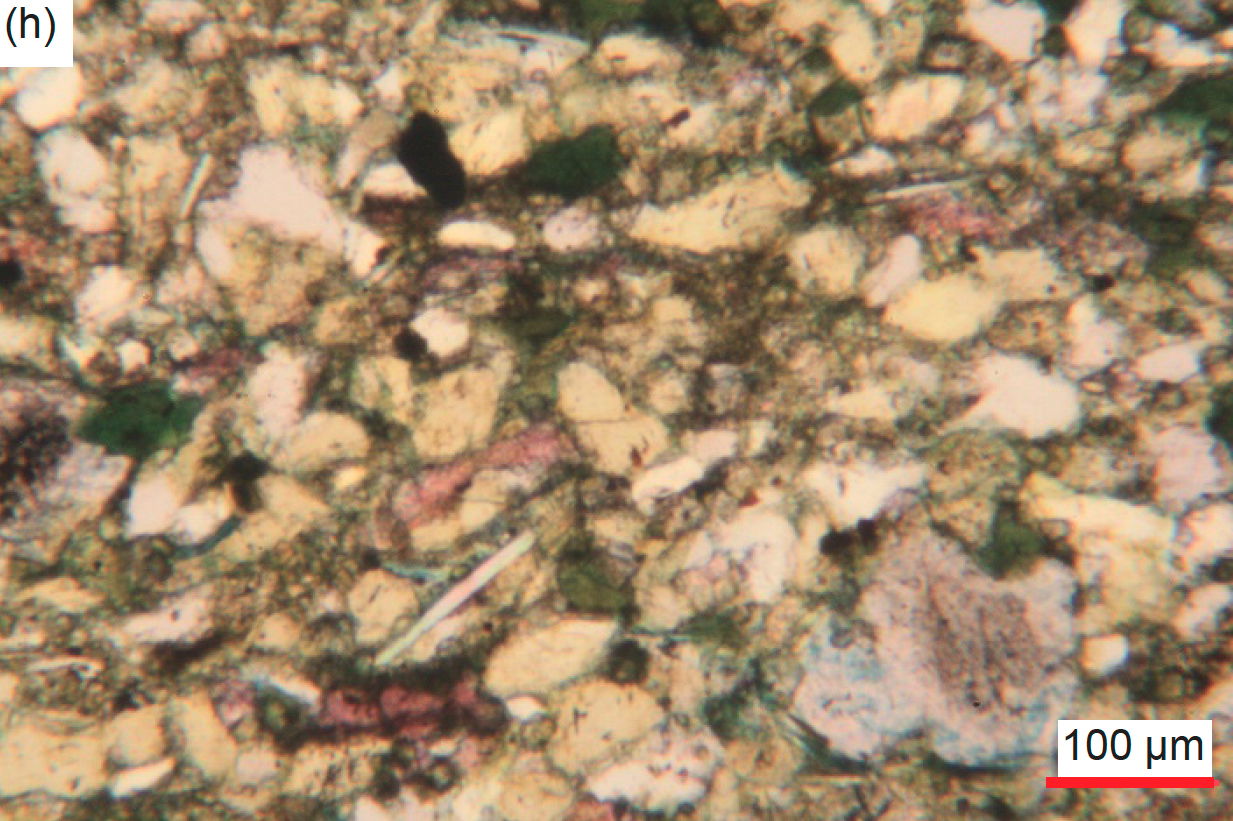
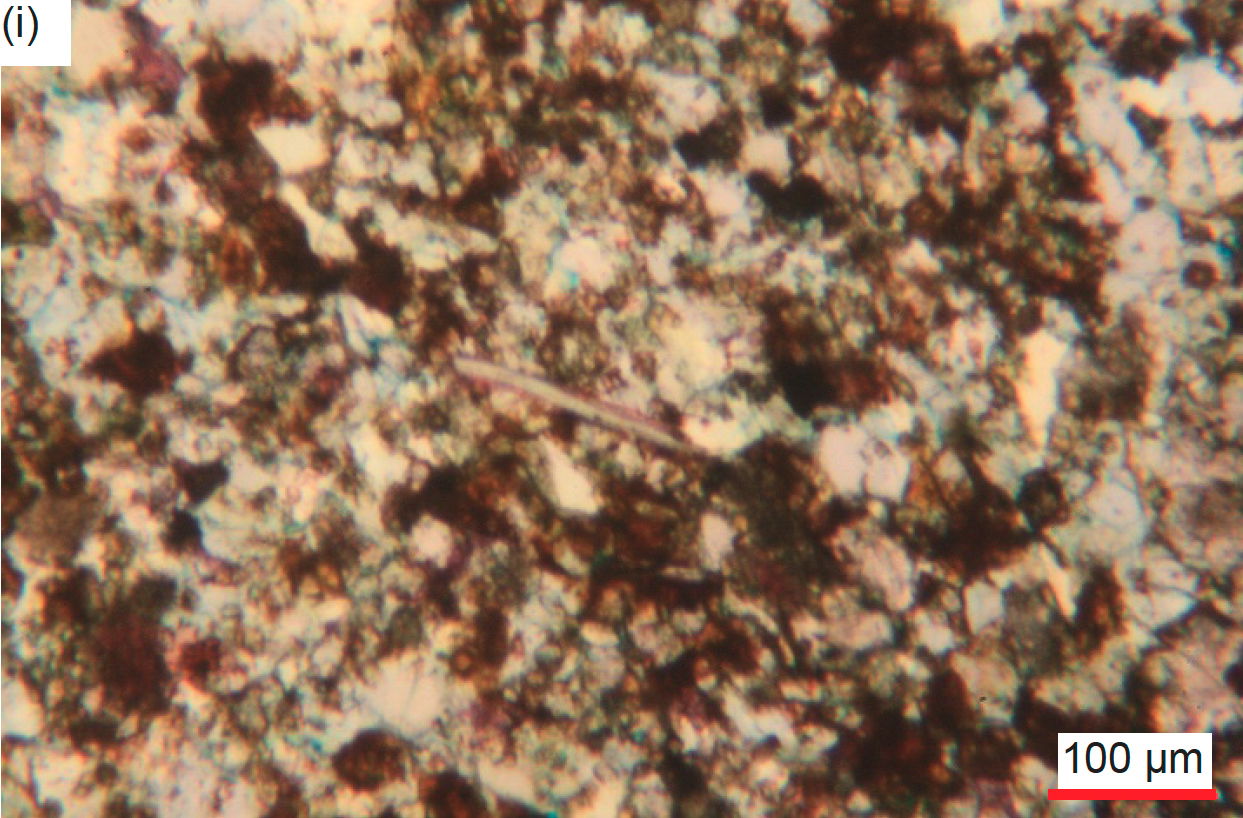
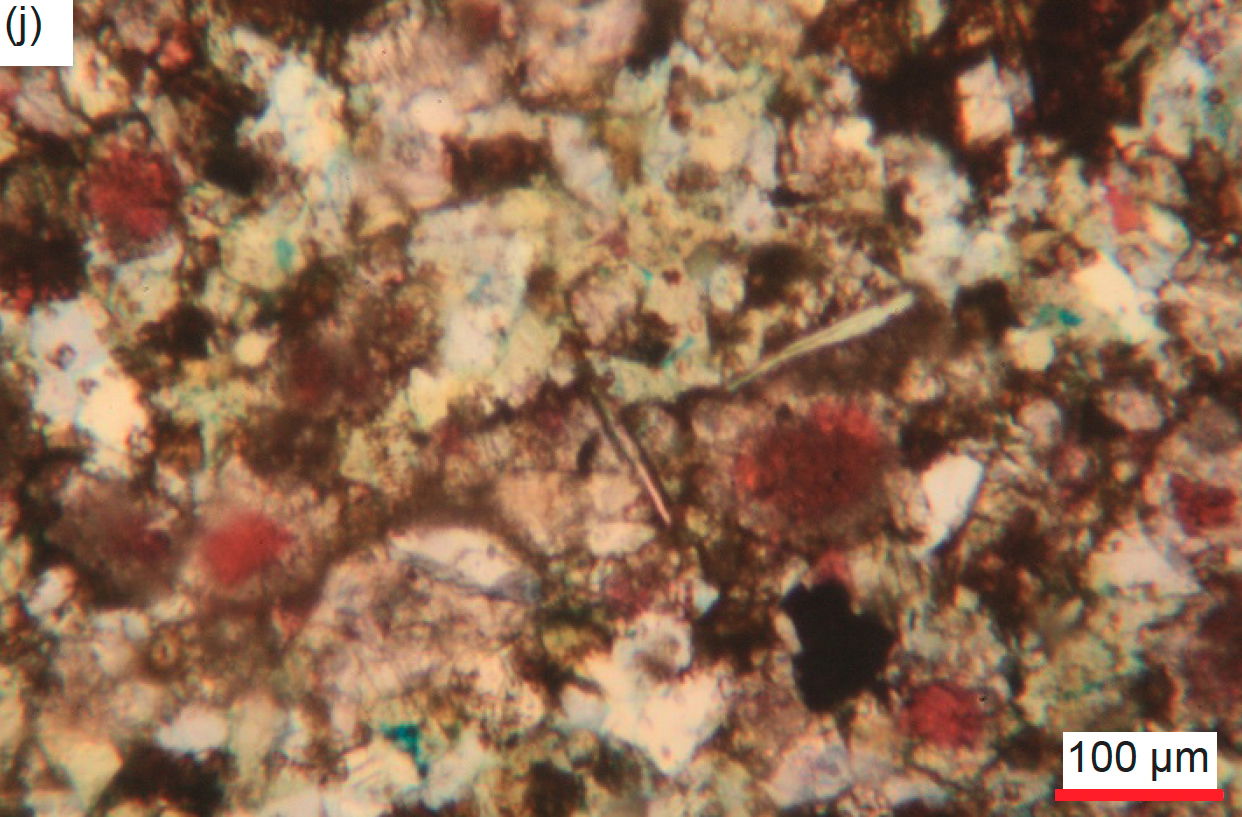
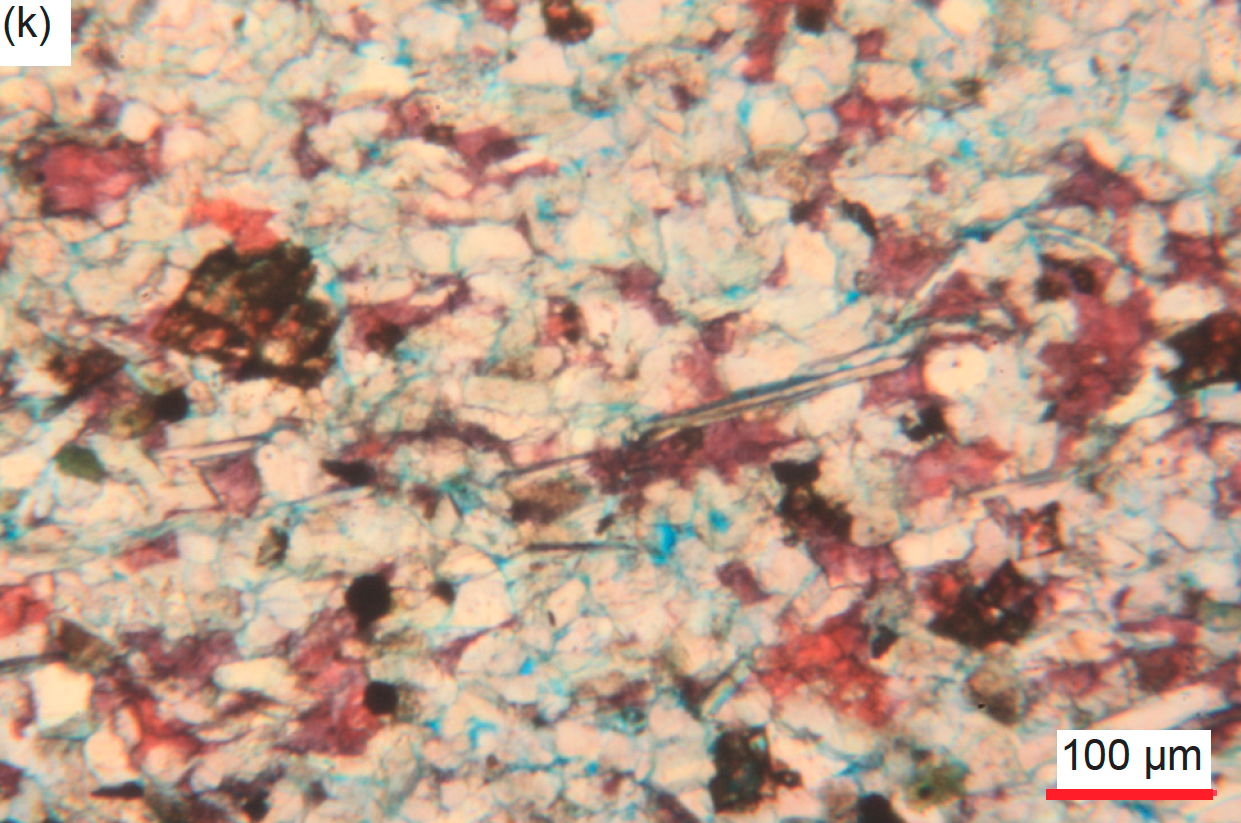
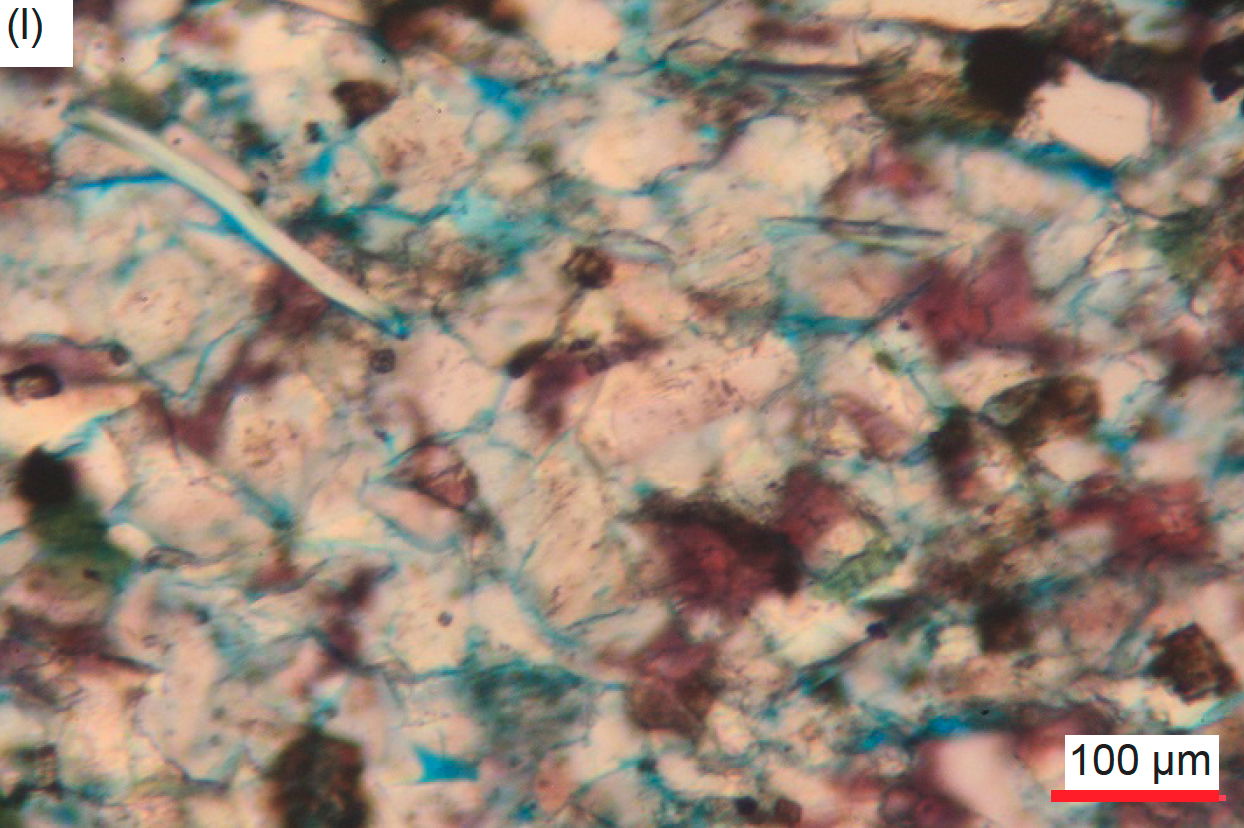
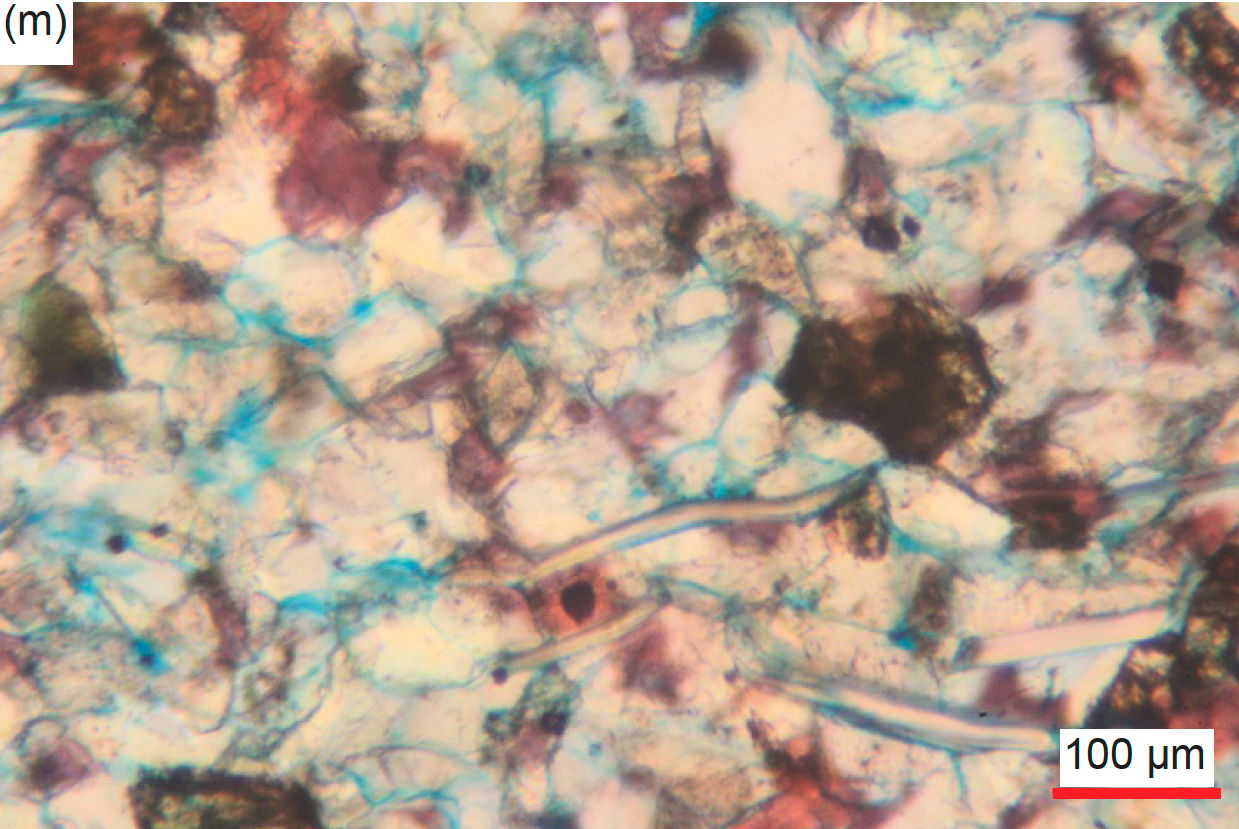
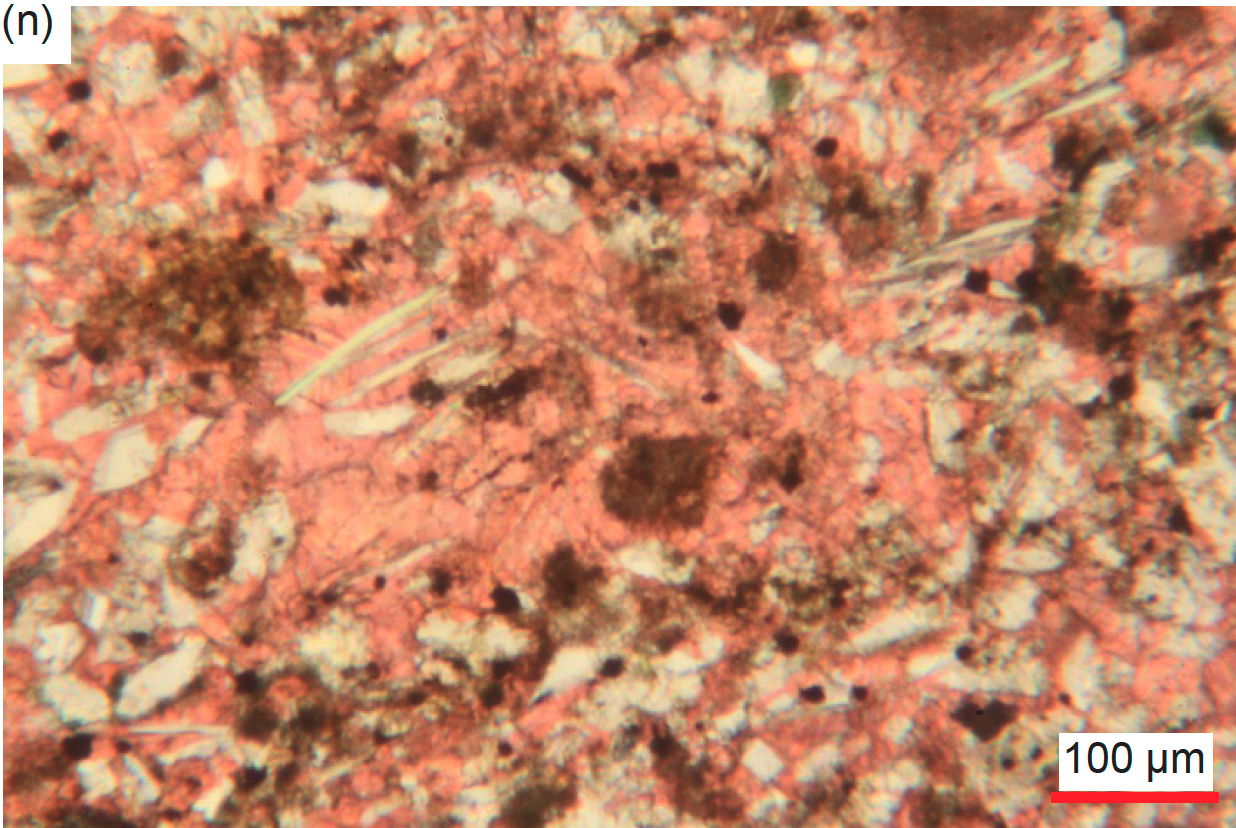
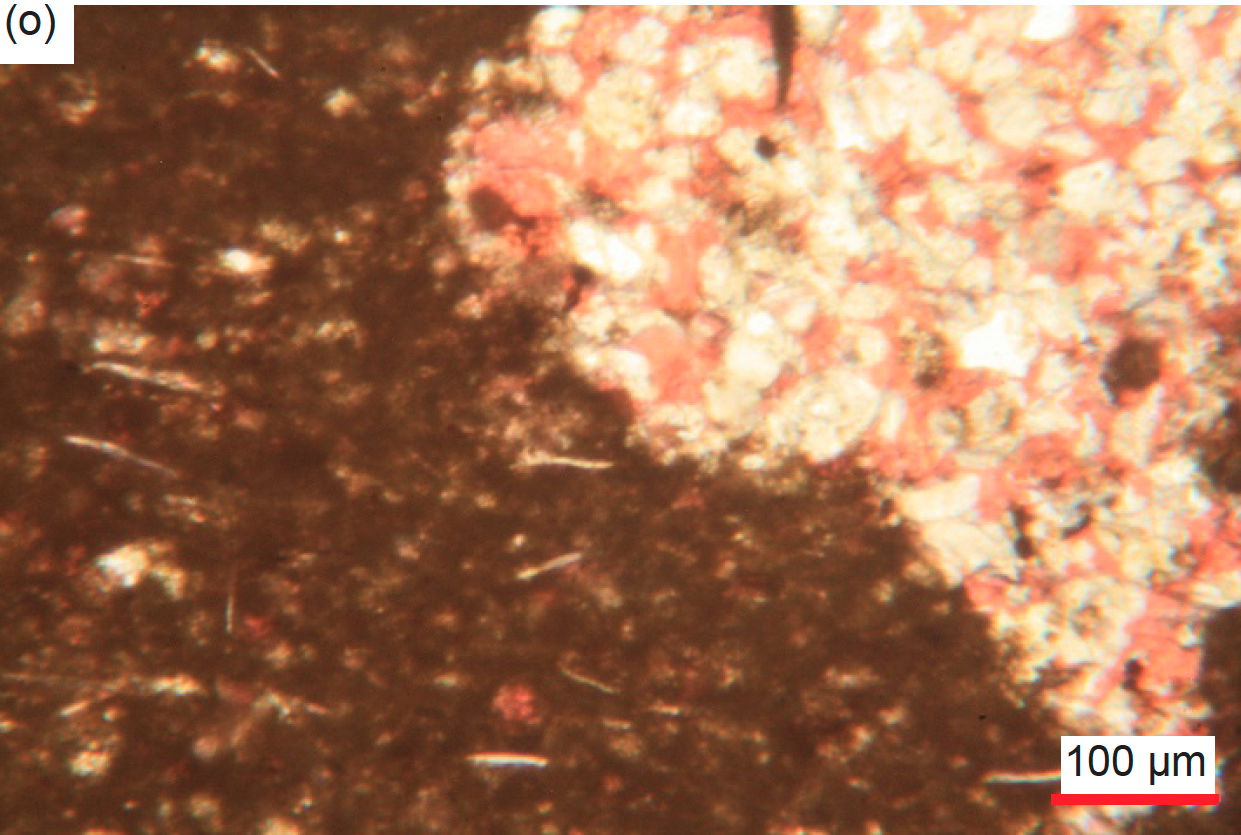
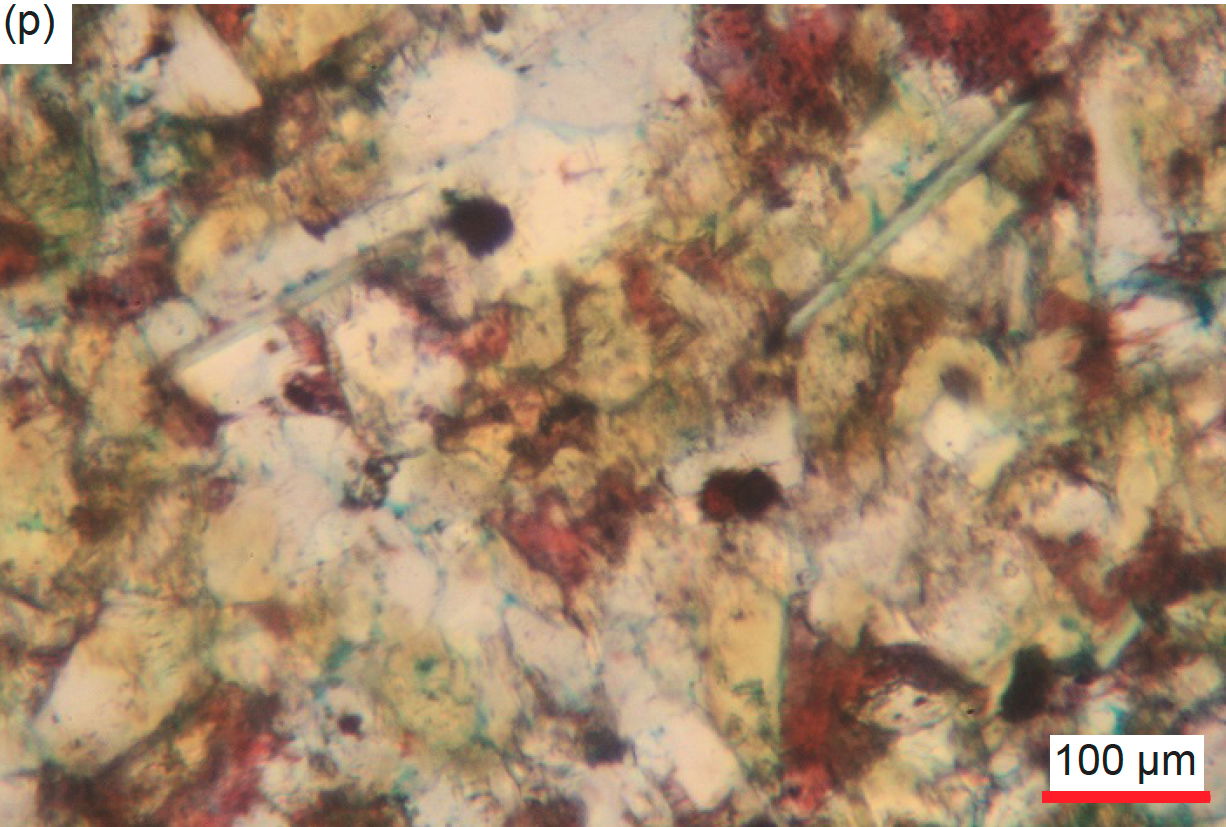
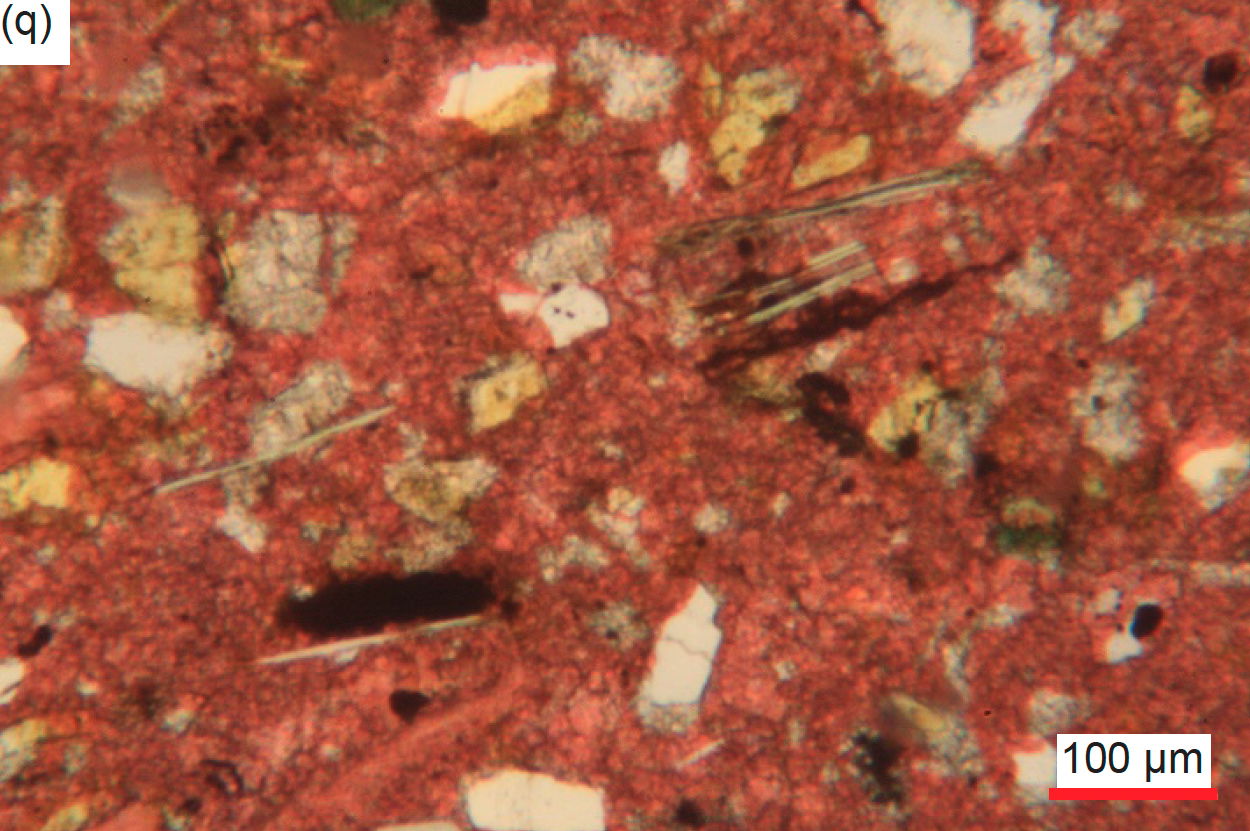
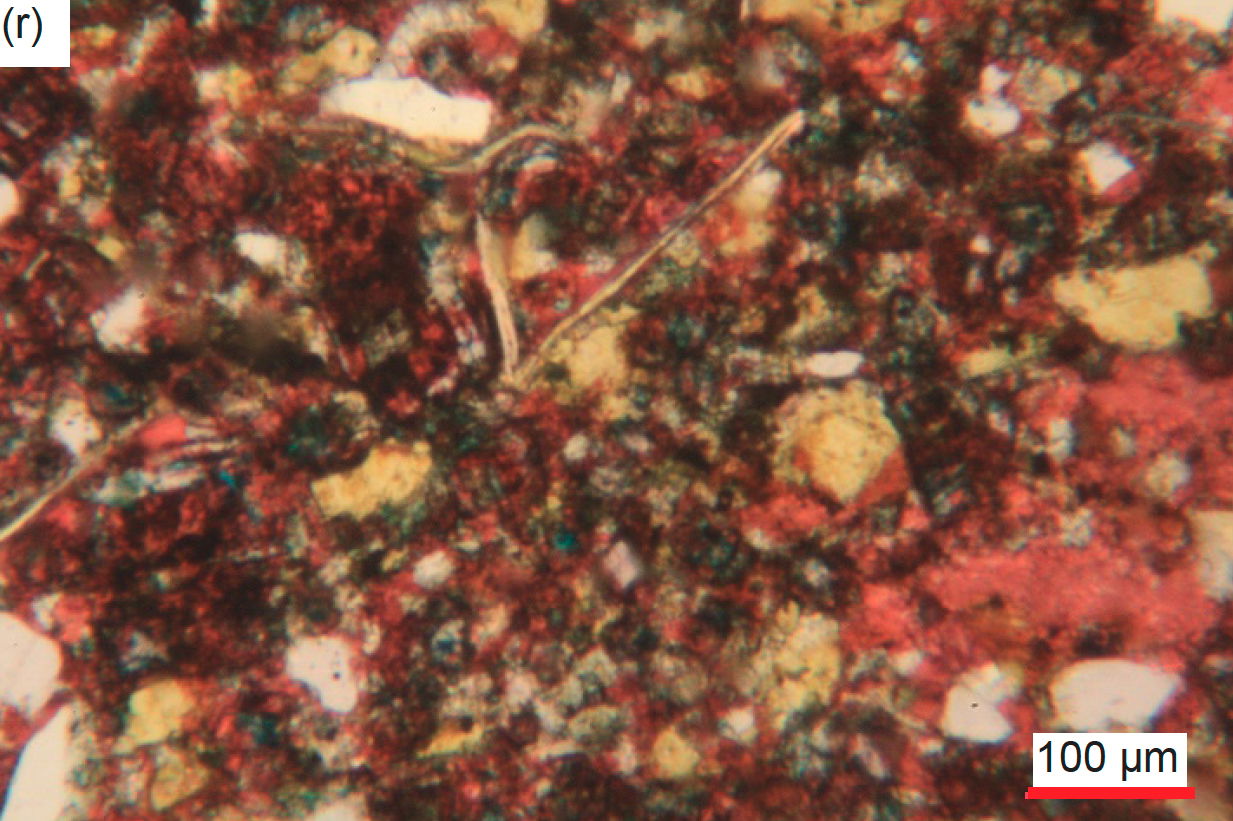
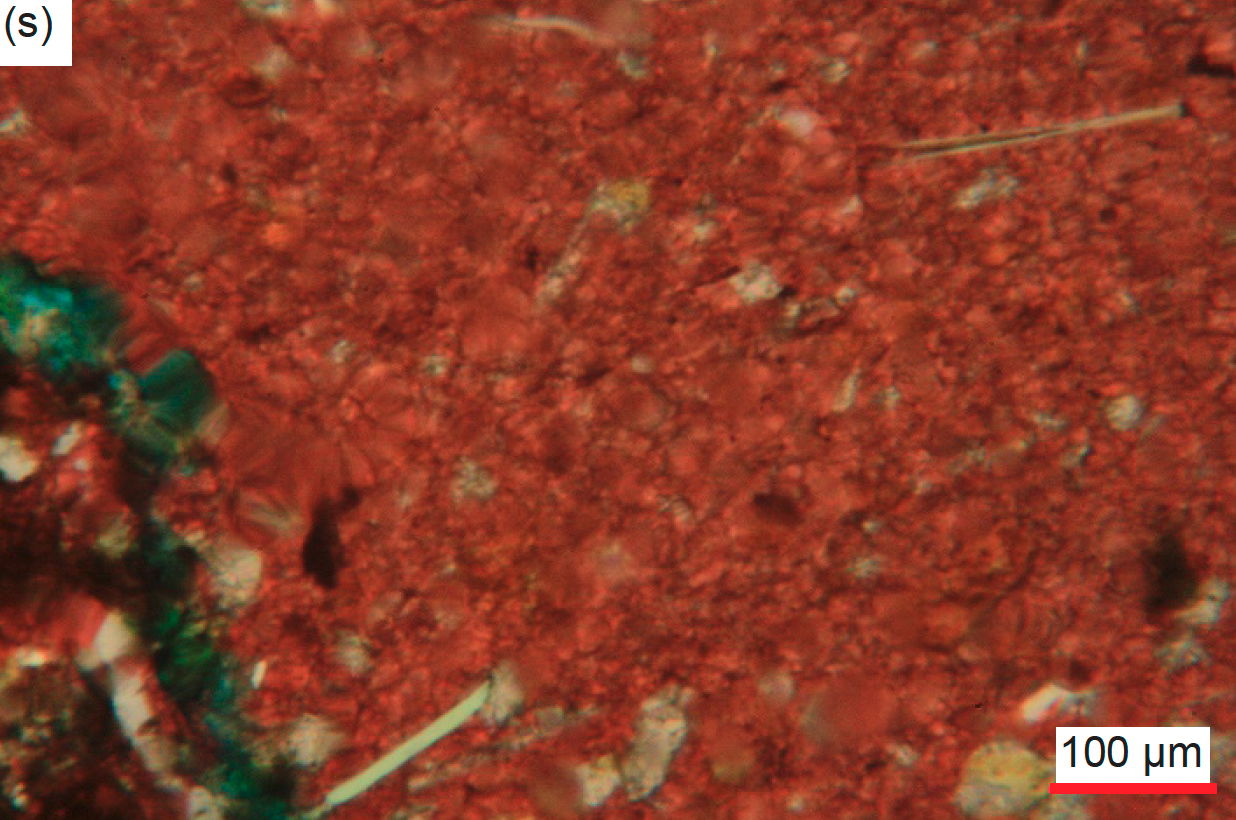
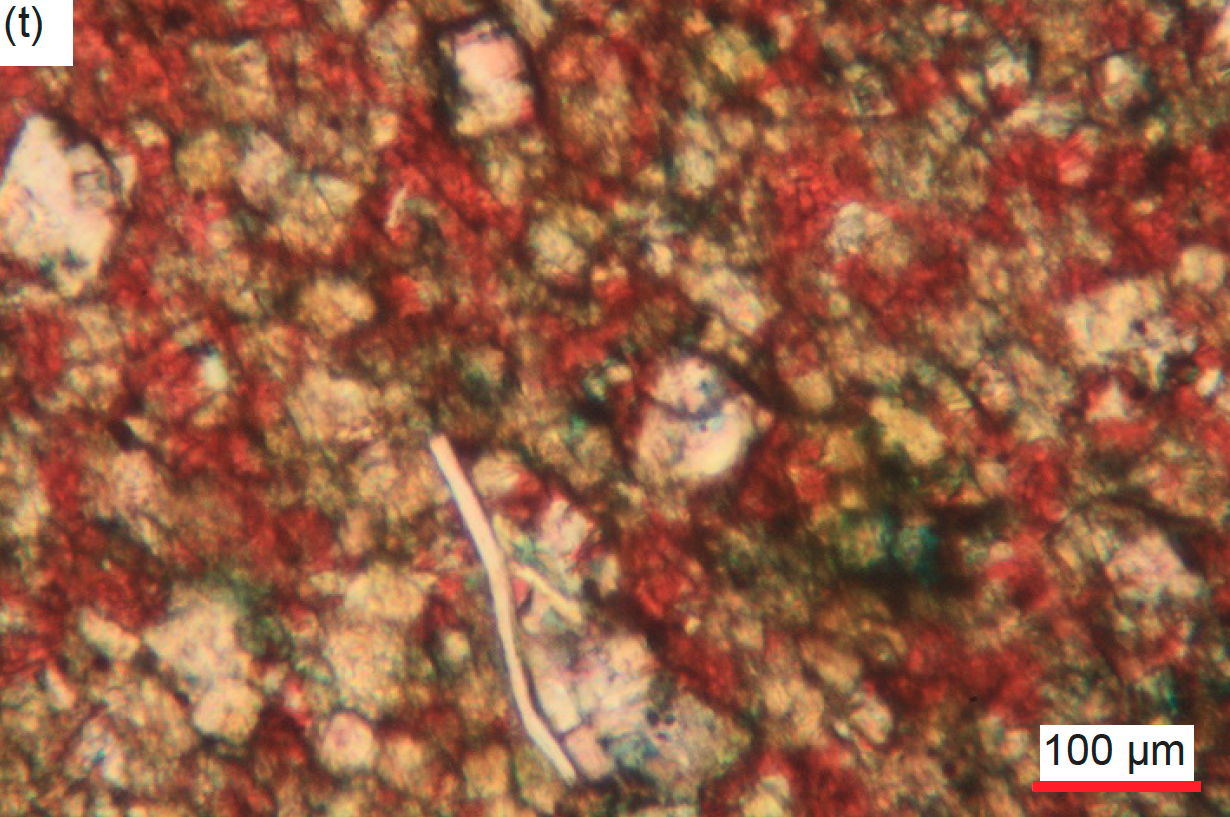
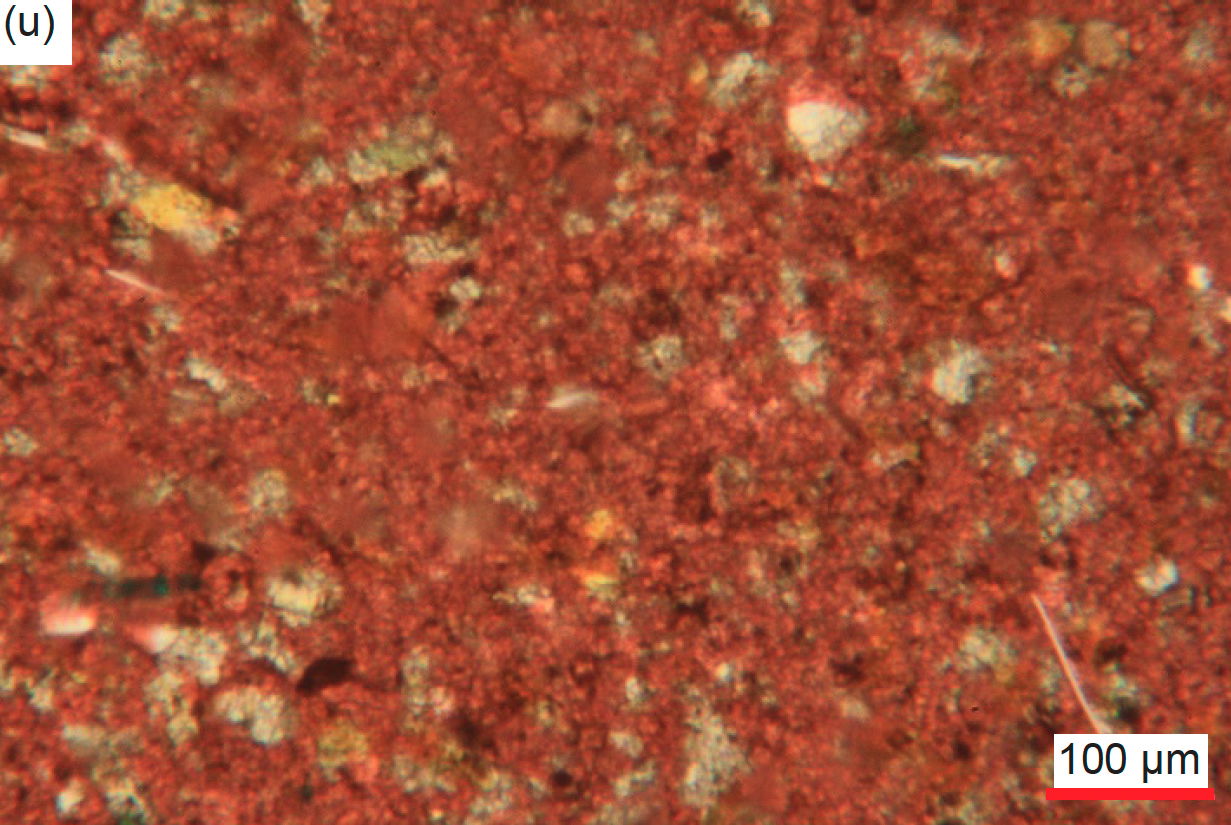
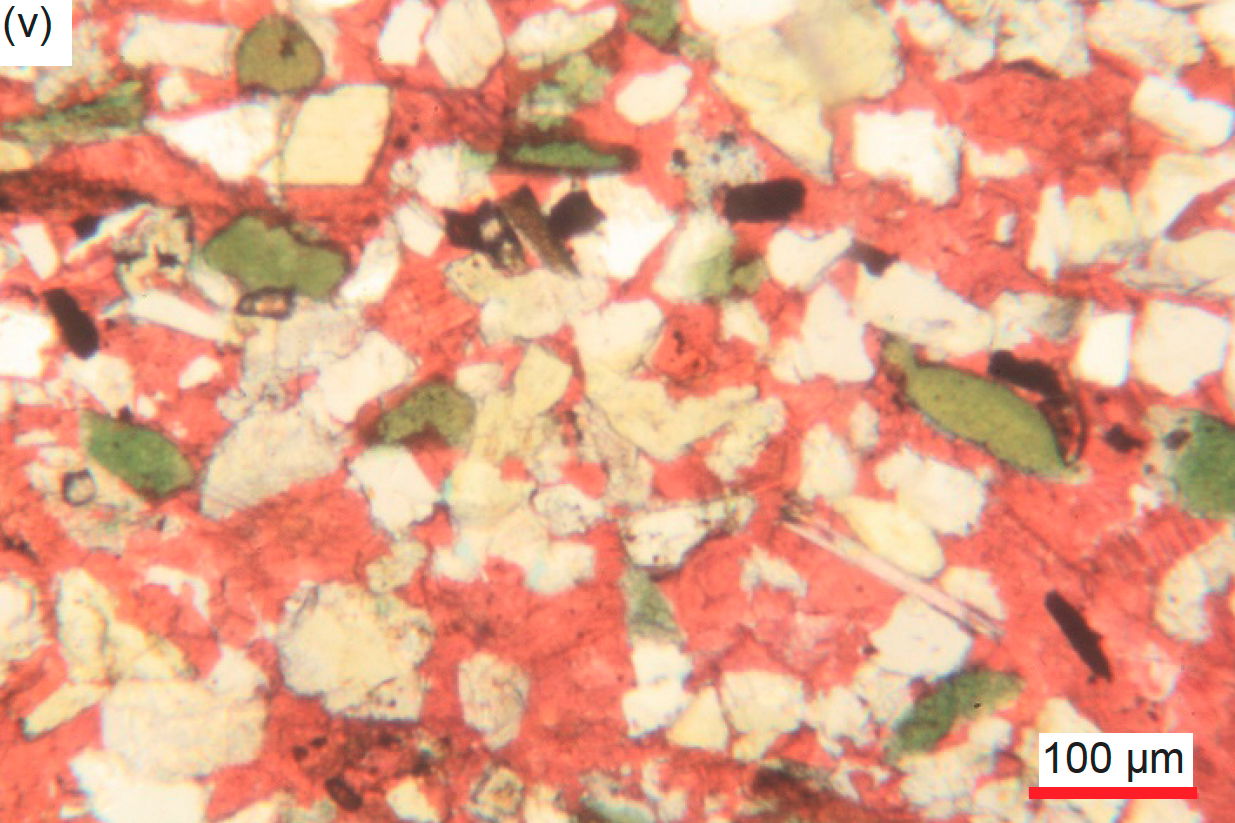
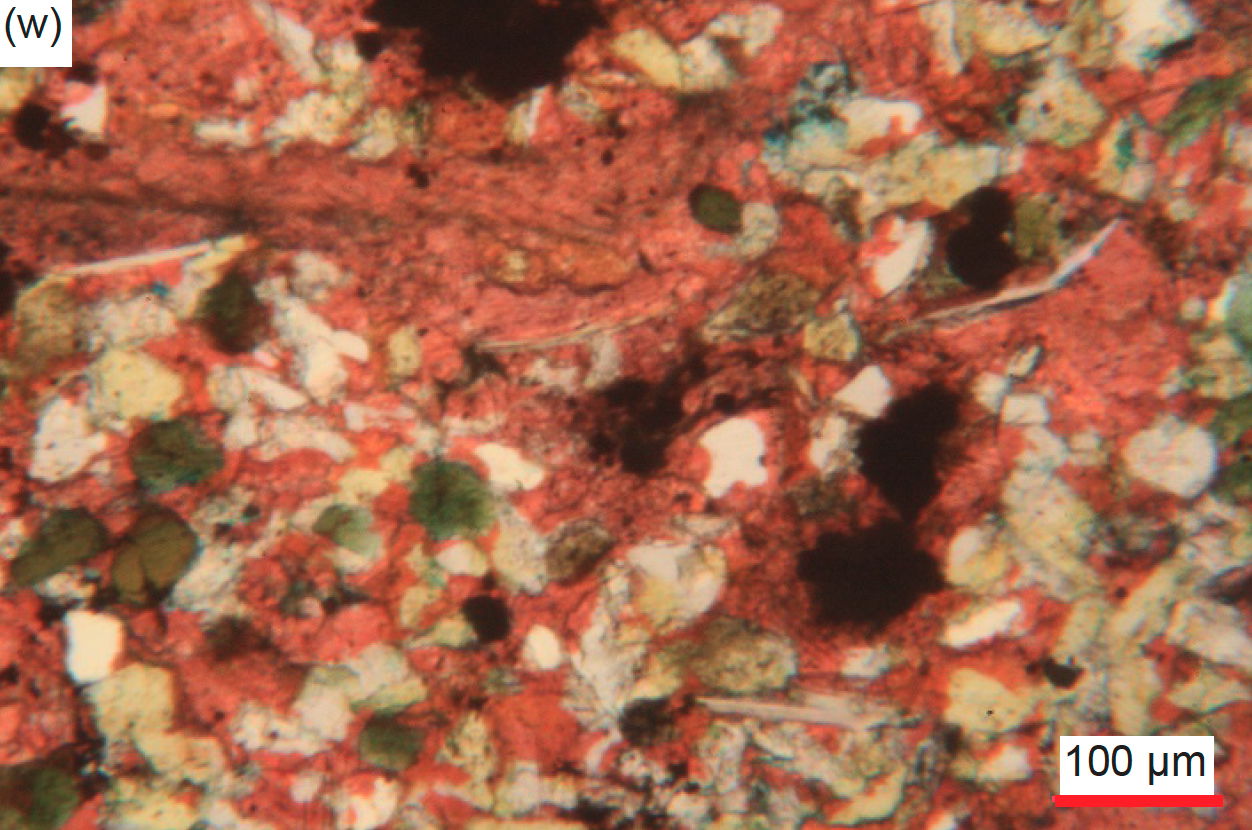
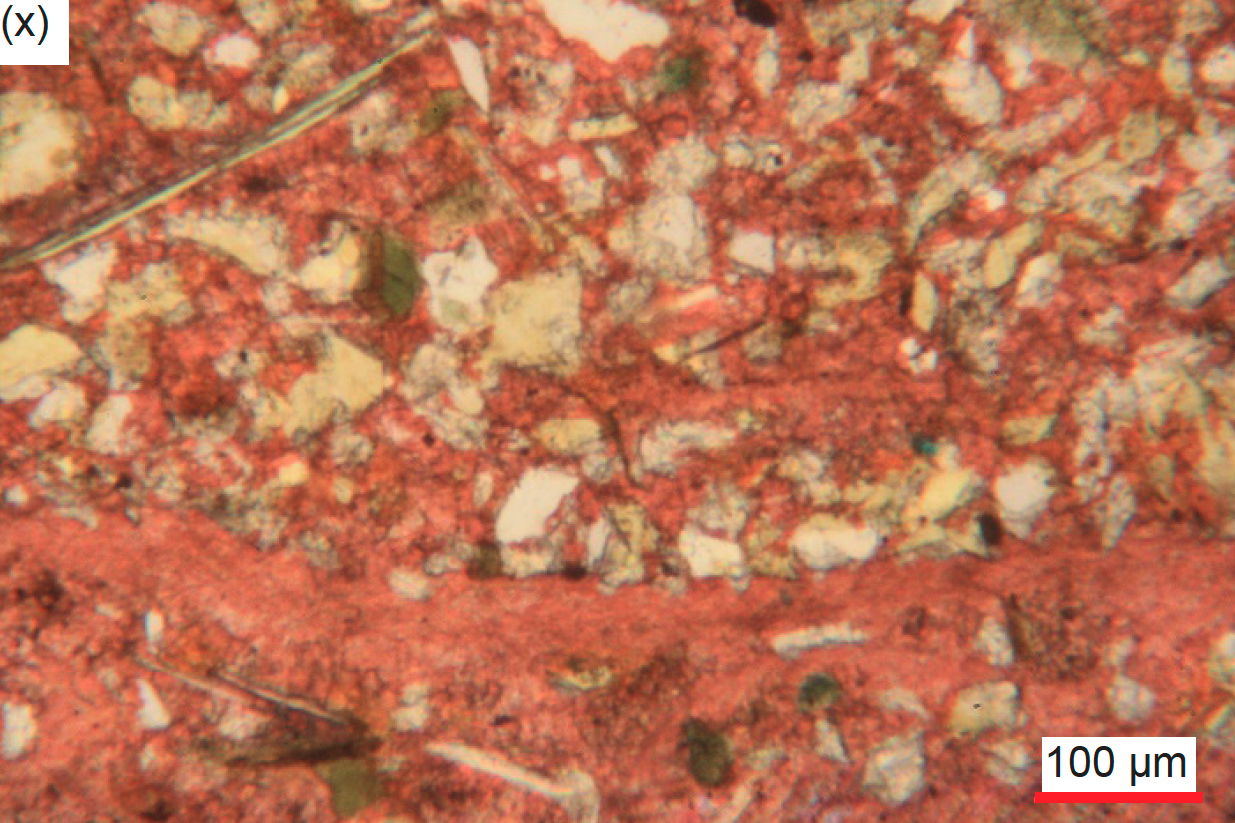
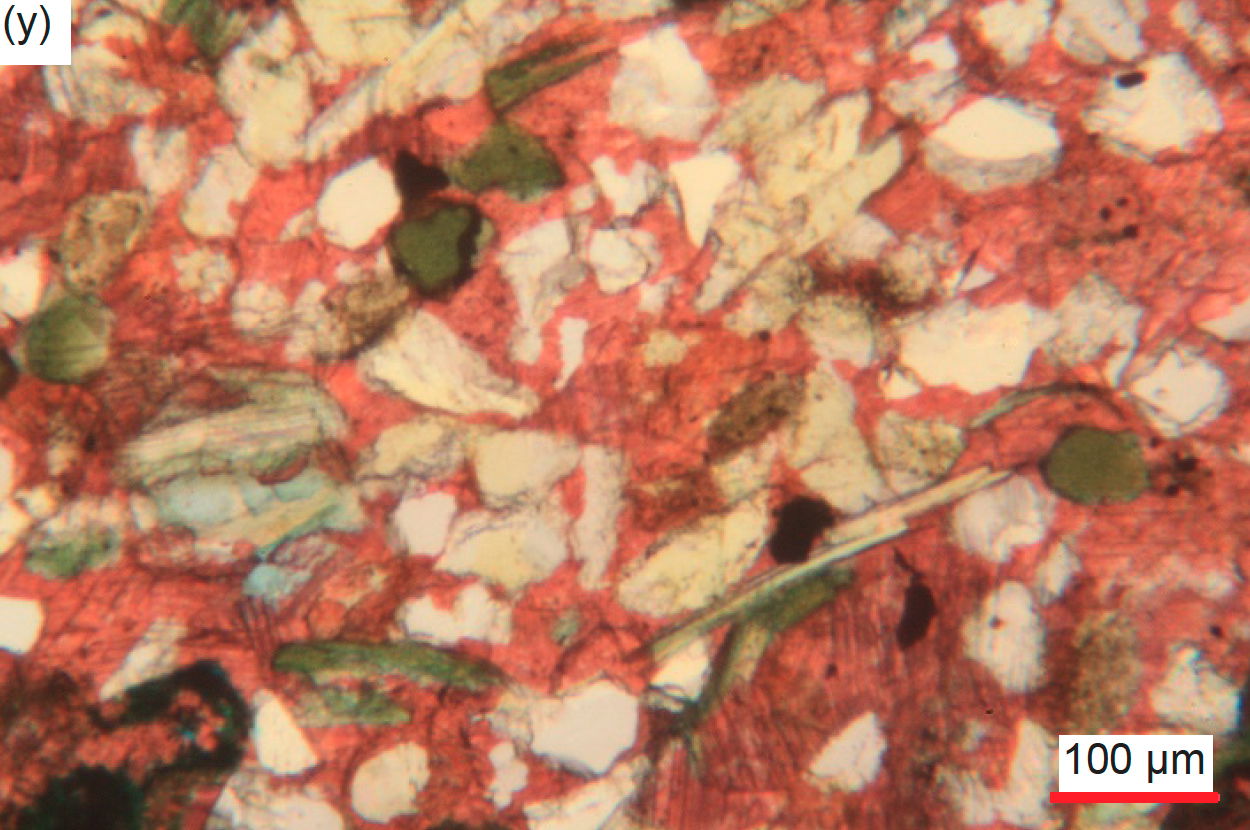
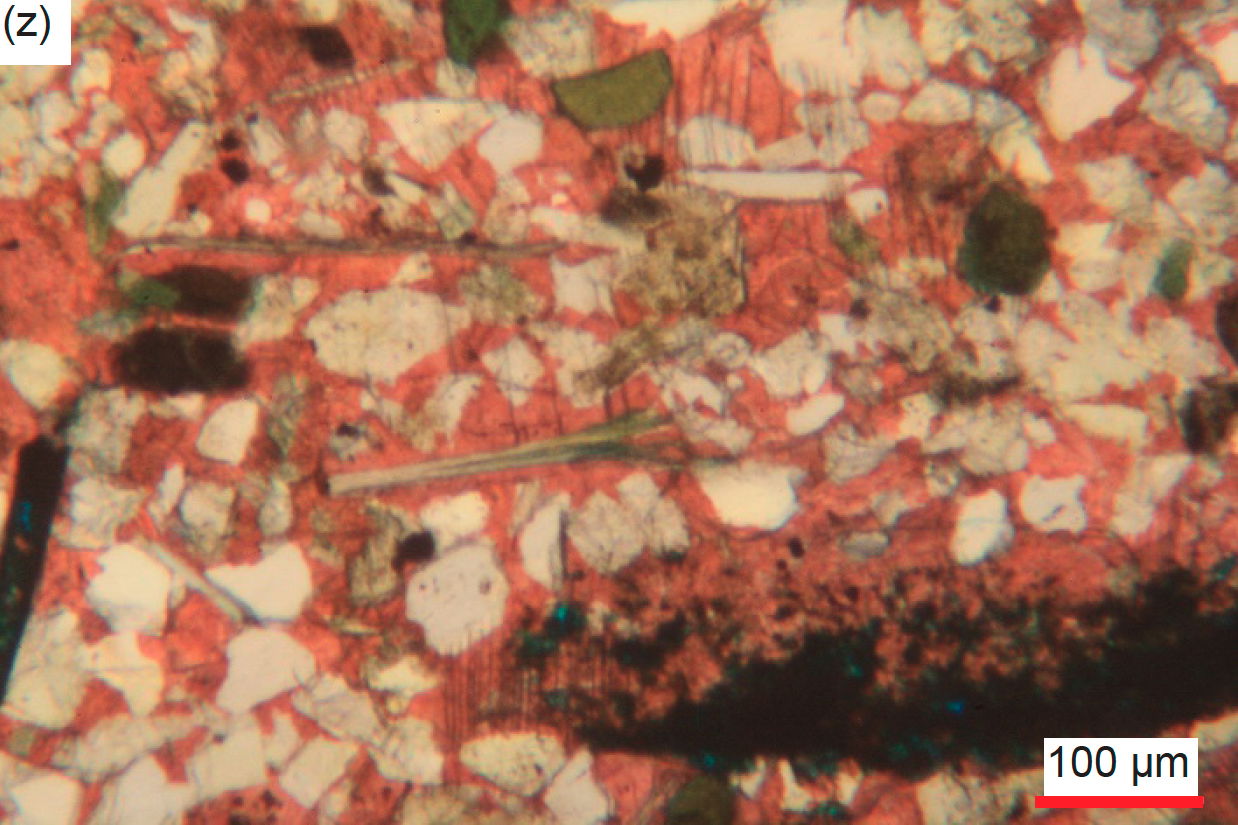
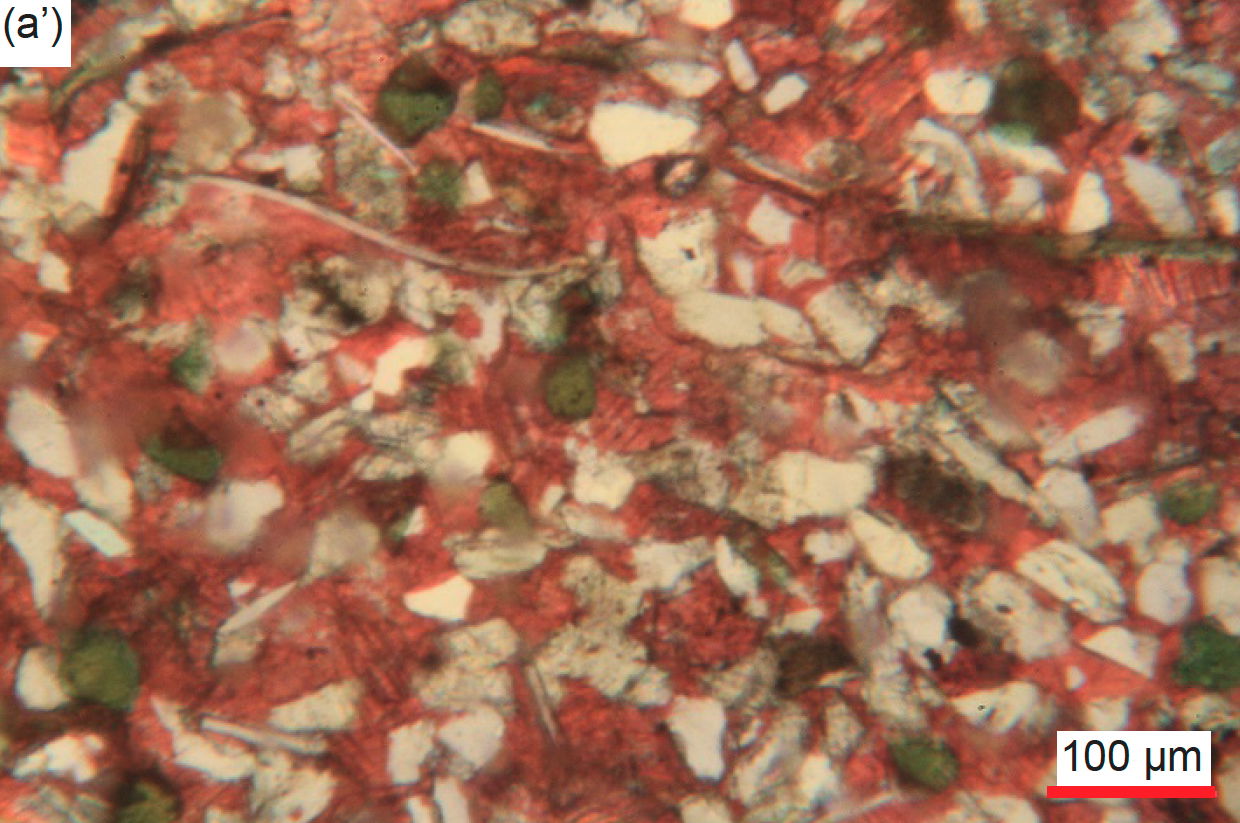
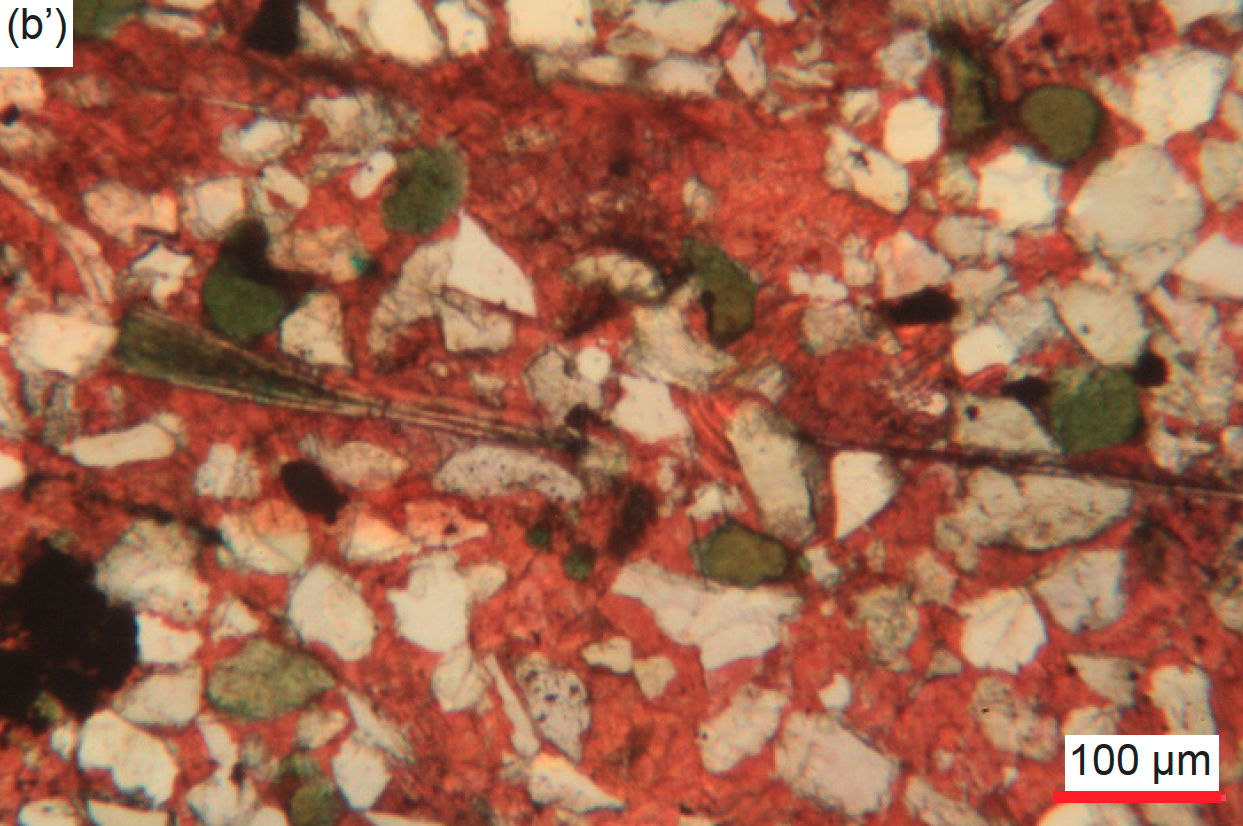
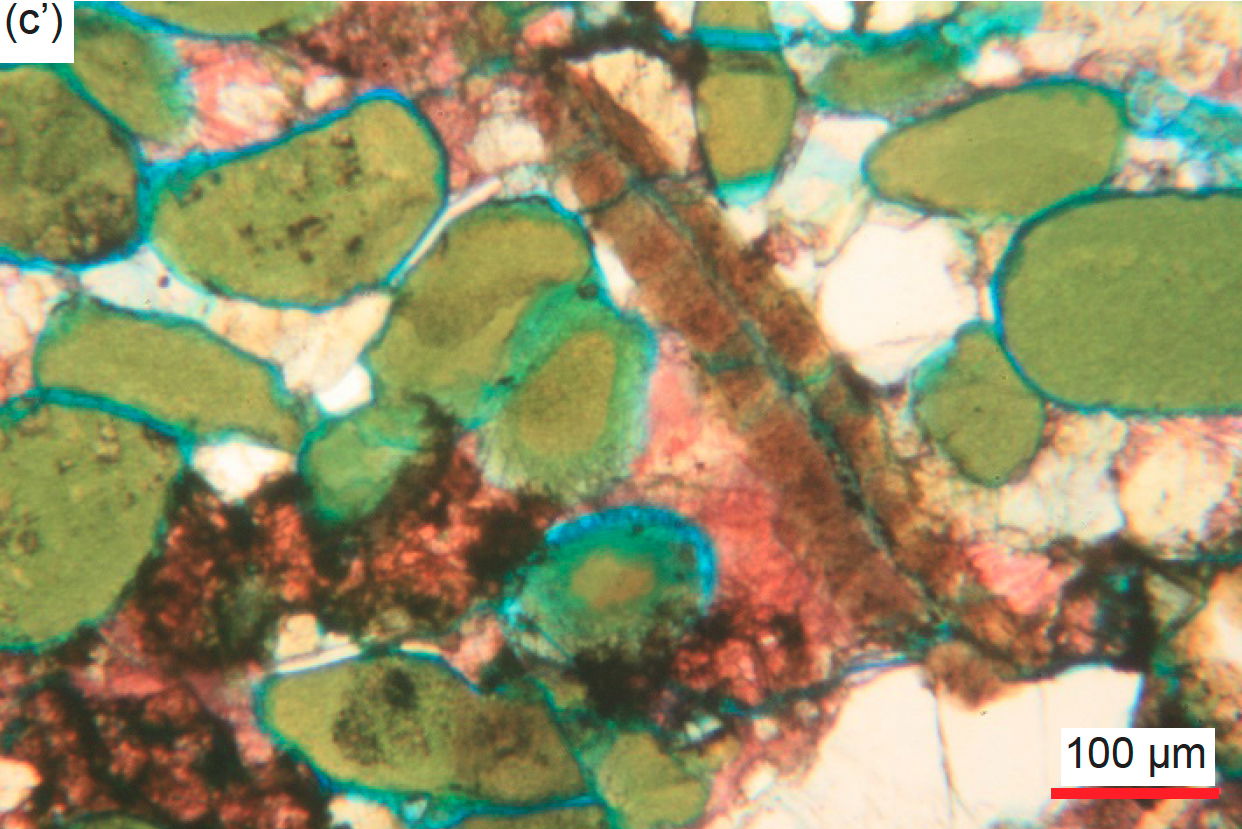
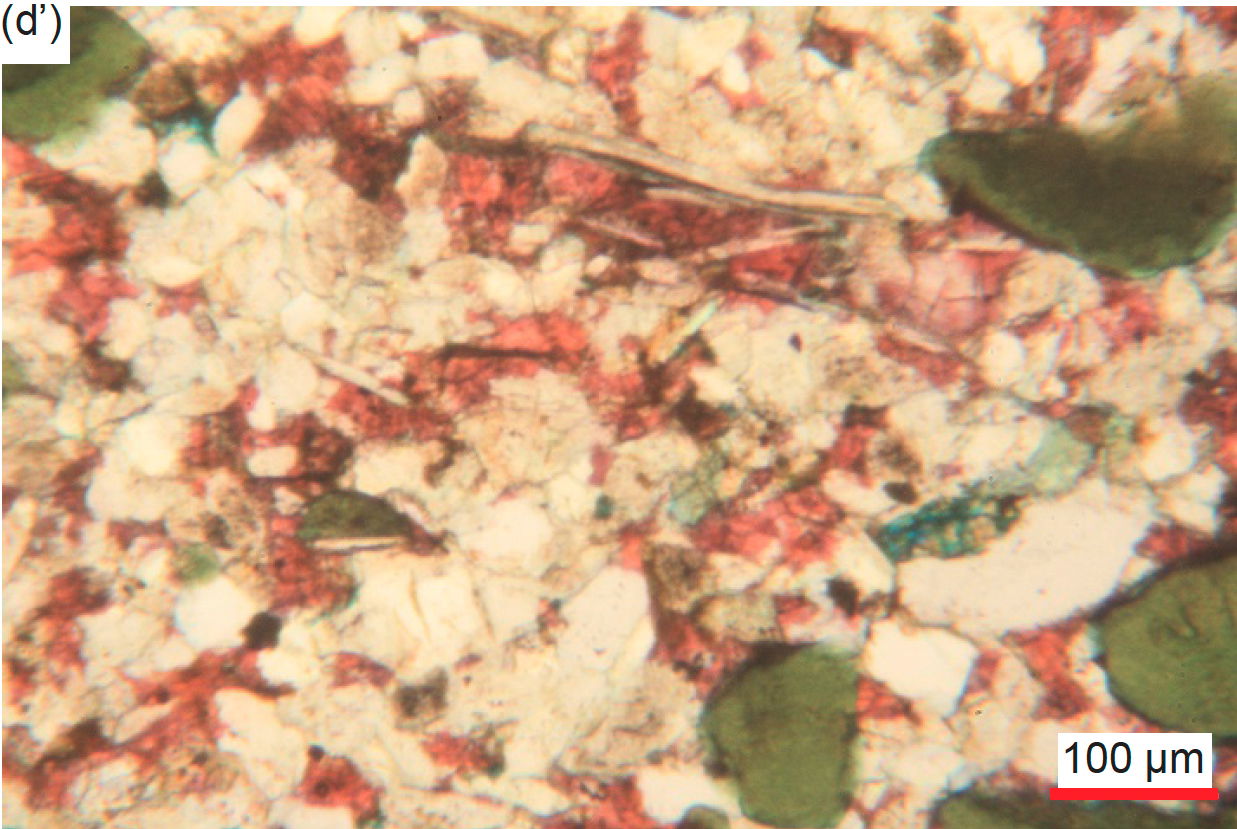
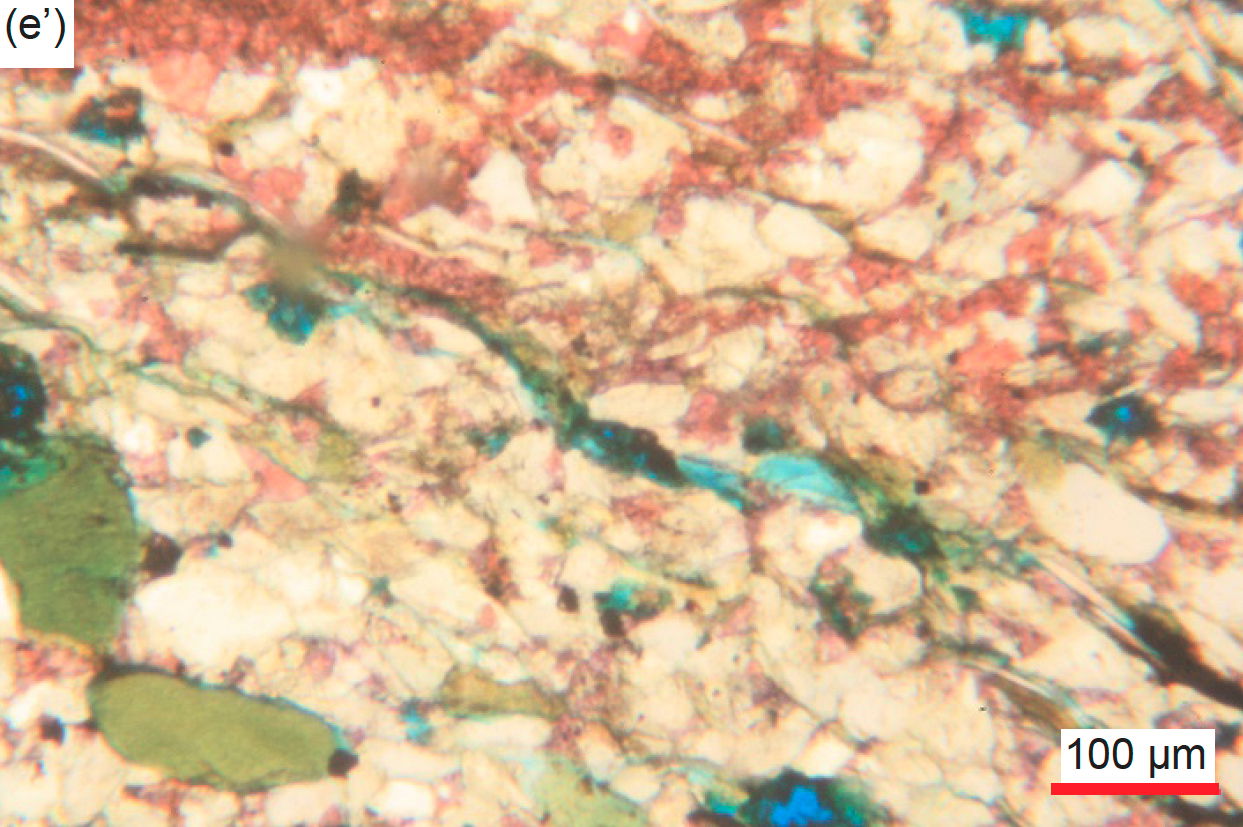
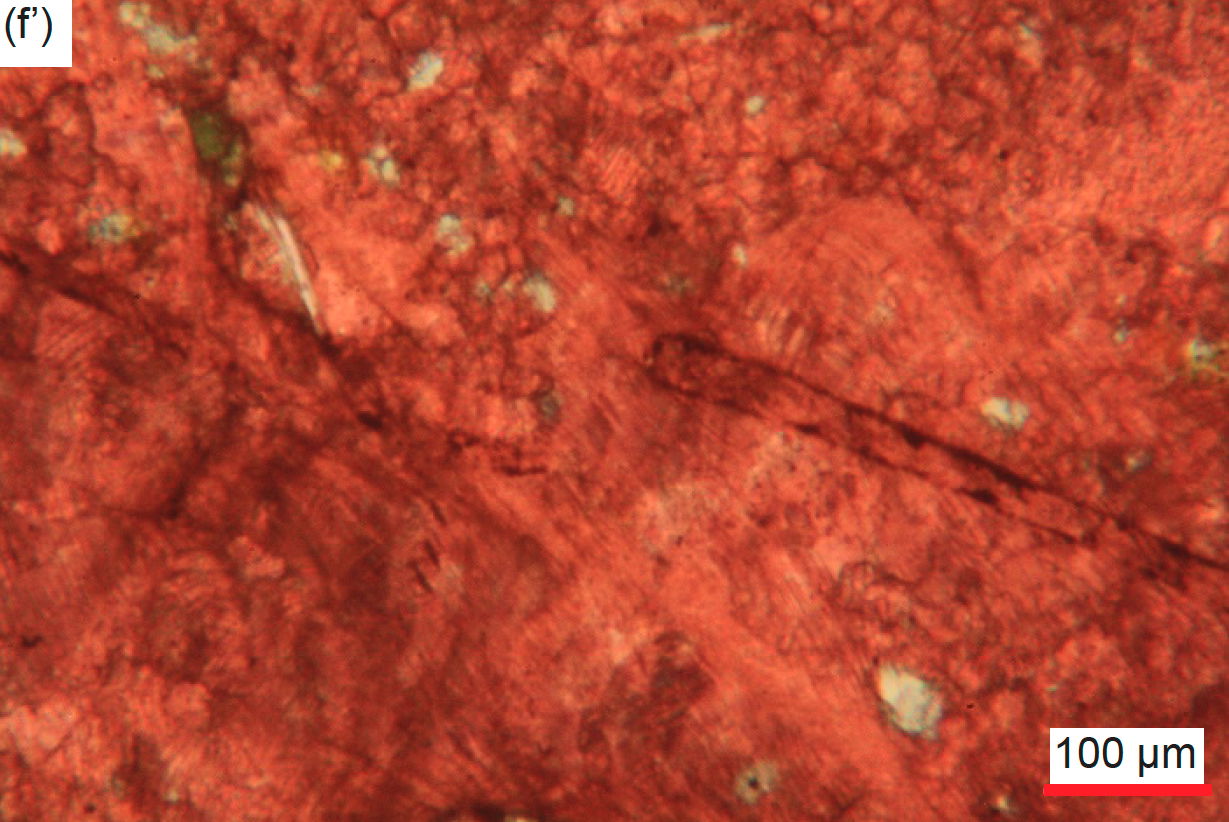
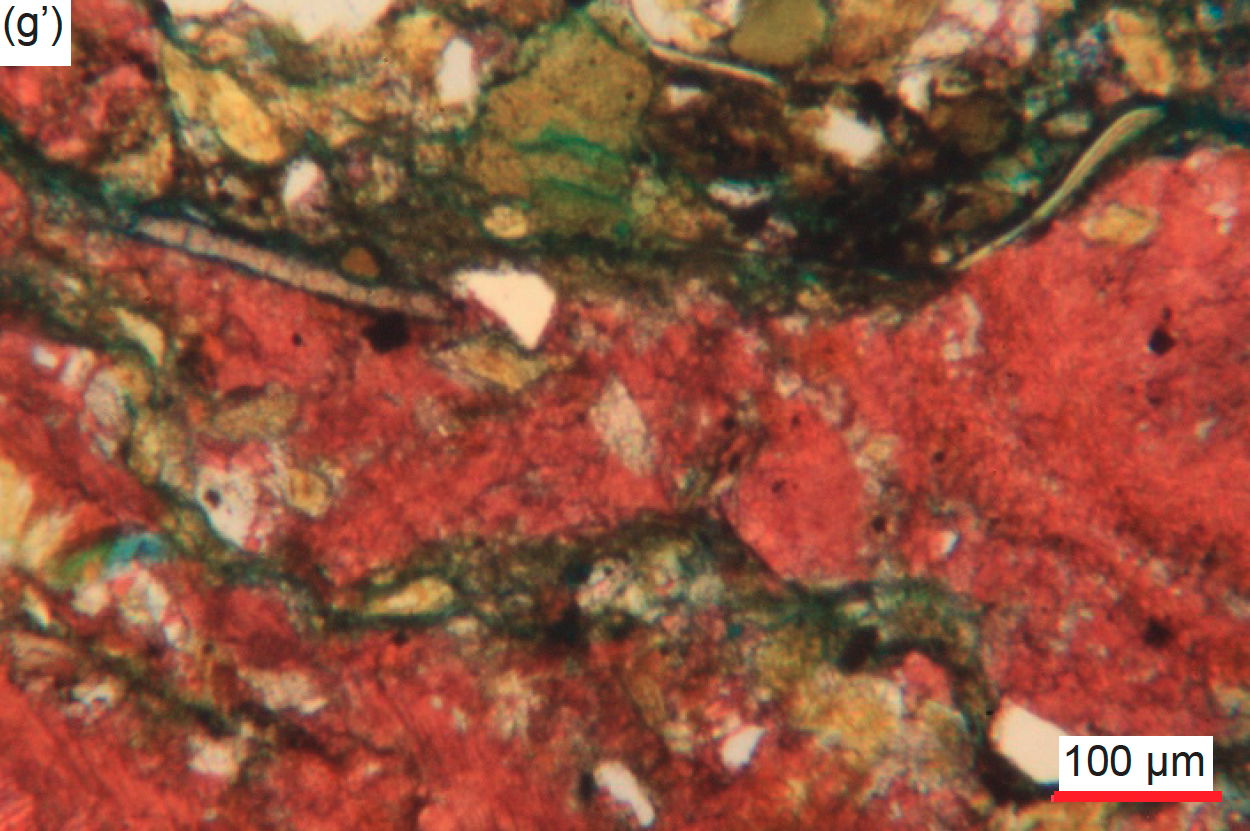
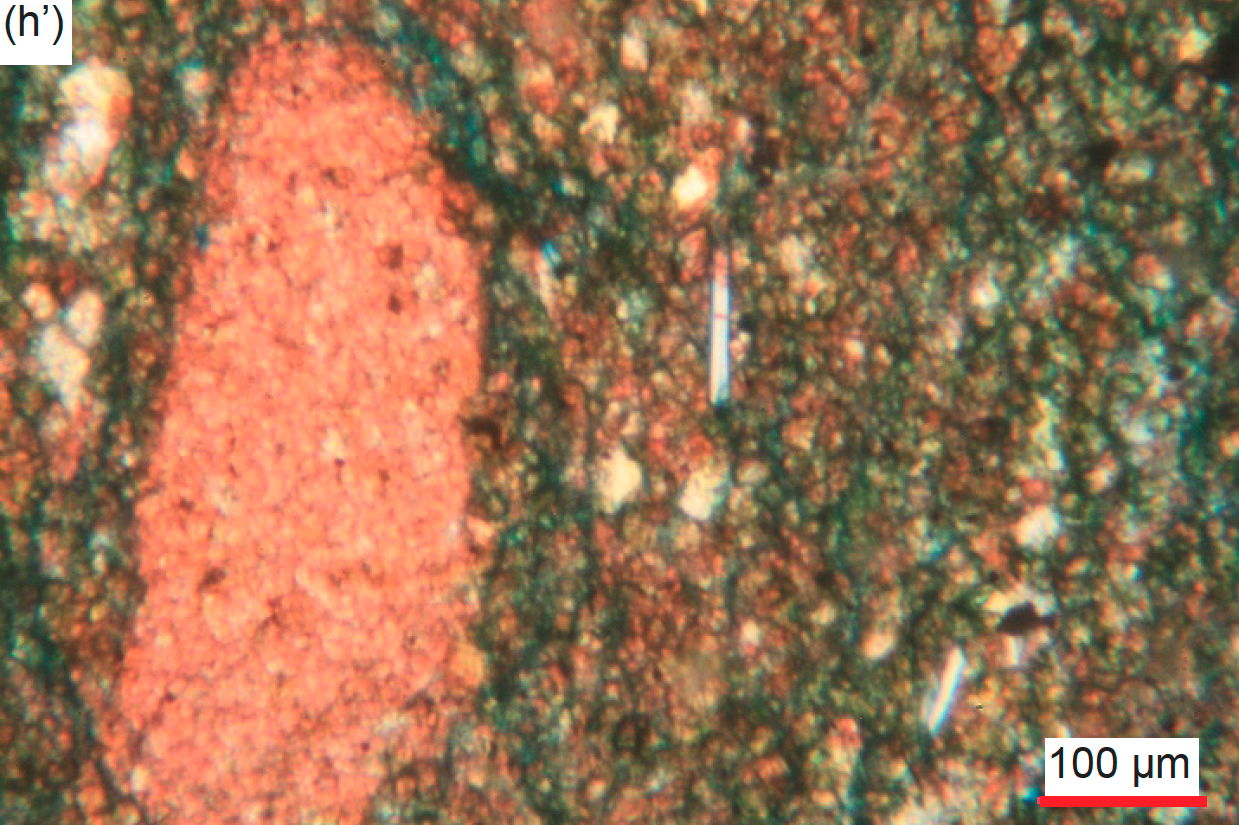
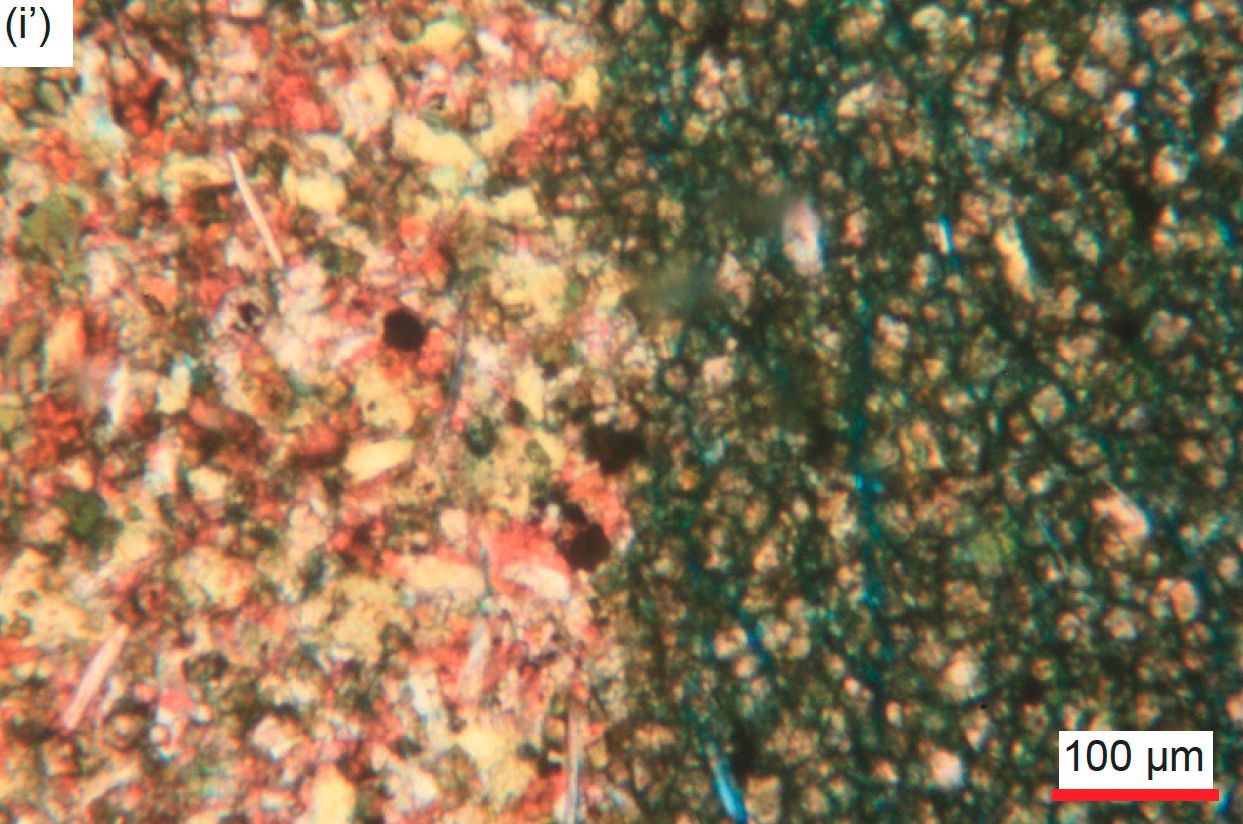
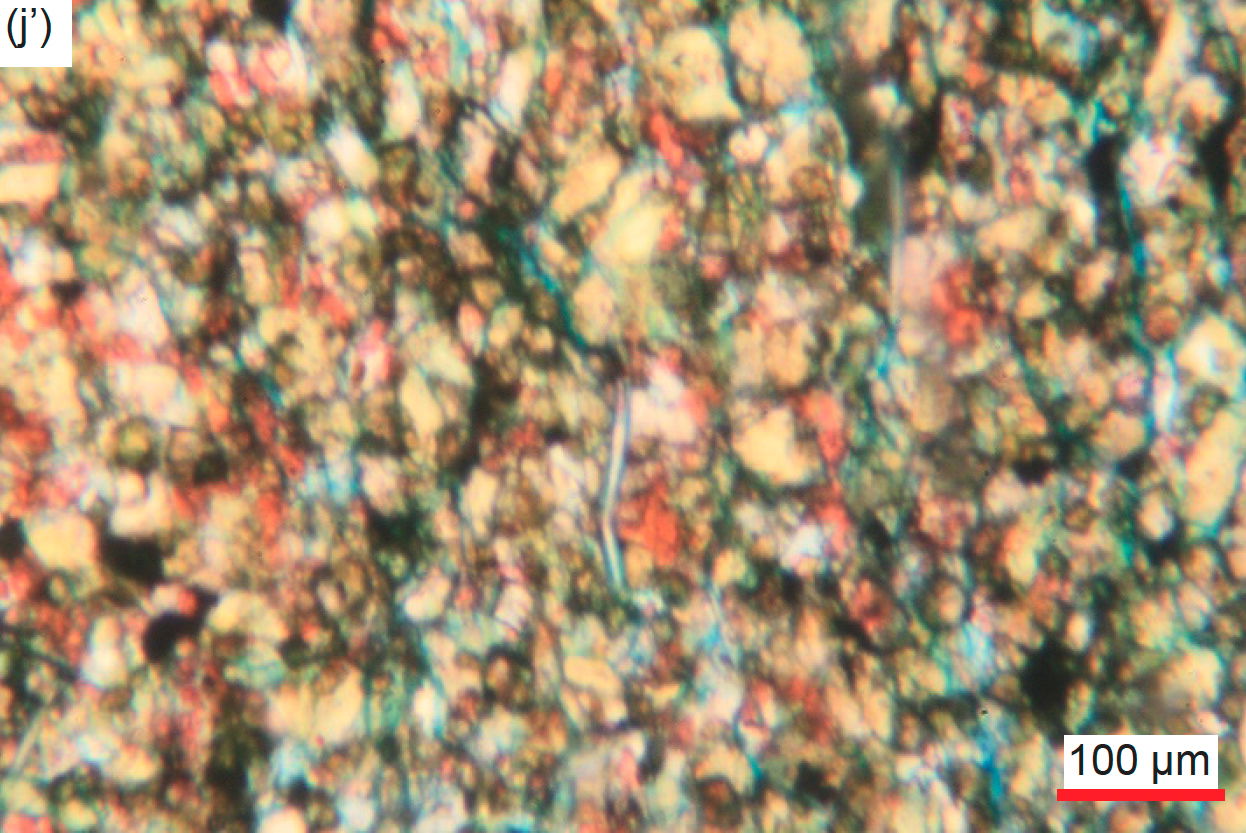
Fig. 32. A representative set of photomicrographs at various scales (as indicated) showing typical detrital edge-on muscovite flakes in the Muav Formation samples with features such as frayed or flayed ends and/or bent around quartz and K-feldspar grains indicating they are detrital grains, while some have expanded due to alteration. Distal samples: (a), (b) MLS-01, (c), (d) MLS-02, and (e), (f) MLS-03. Matkatamiba fold samples: (g), (h) MFML-01, (i), (j) MFML-02, (k)–(m) MFML-03, (n), (o) MFML-04, (p) MFML-05, (q)–(s) MFML-06, (t), (u) MFTB-01 (v)–(x) MFTB-02, (y)–(b’) MFTB-03, (c’)–(e’) MFTB-04, (f’), (g’) MFTB-05, and (h’)–(j’) MFTB-06.
The dominant carbonate component of all but two of these 15 samples is calcite, varying overall from 4.3% to 92.8% (table 2). Most samples consist of either a dominant massive, densely-packed interlocking mosaic of very tiny or ultra-fine-grained (mud-sized) grains and rhombs of calcite (micrite) (fig. 33), which probably was mostly detrital. Sometimes this calcite matrix is mud to coarse silt and very fine sand sized. Where it is subordinate, the calcite matrix consists of very small, small, and small-medium crystals, many of which are due to recrystallization, particularly the larger crystals, and thus are set at different extinction angles, which are variably iron-oxides-stained, including along cleavage planes. Alternately, there are medium and large-huge sized patches (some elongated) of the calcite matrix that have sometimes been recrystallized to very small to small and medium platy calcite crystals, also at different extinction angles and sometimes with characteristic cleavage evident. Occasionally, there is a sharp linear boundary between the densely iron-oxides-stained calcite matrix and the regular “clean” calcite matrix or the smaller-grained recrystallized calcite matrix, and sometimes the boundaries are gradational.
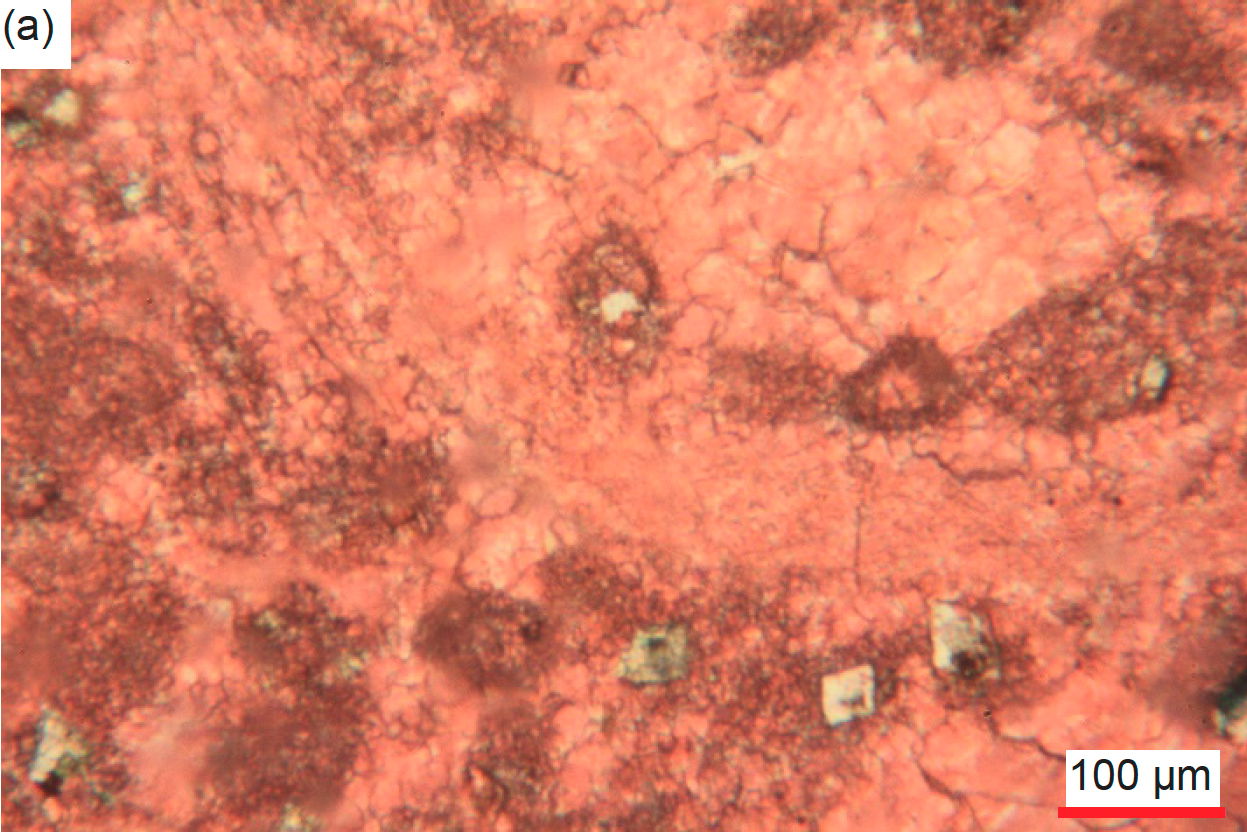
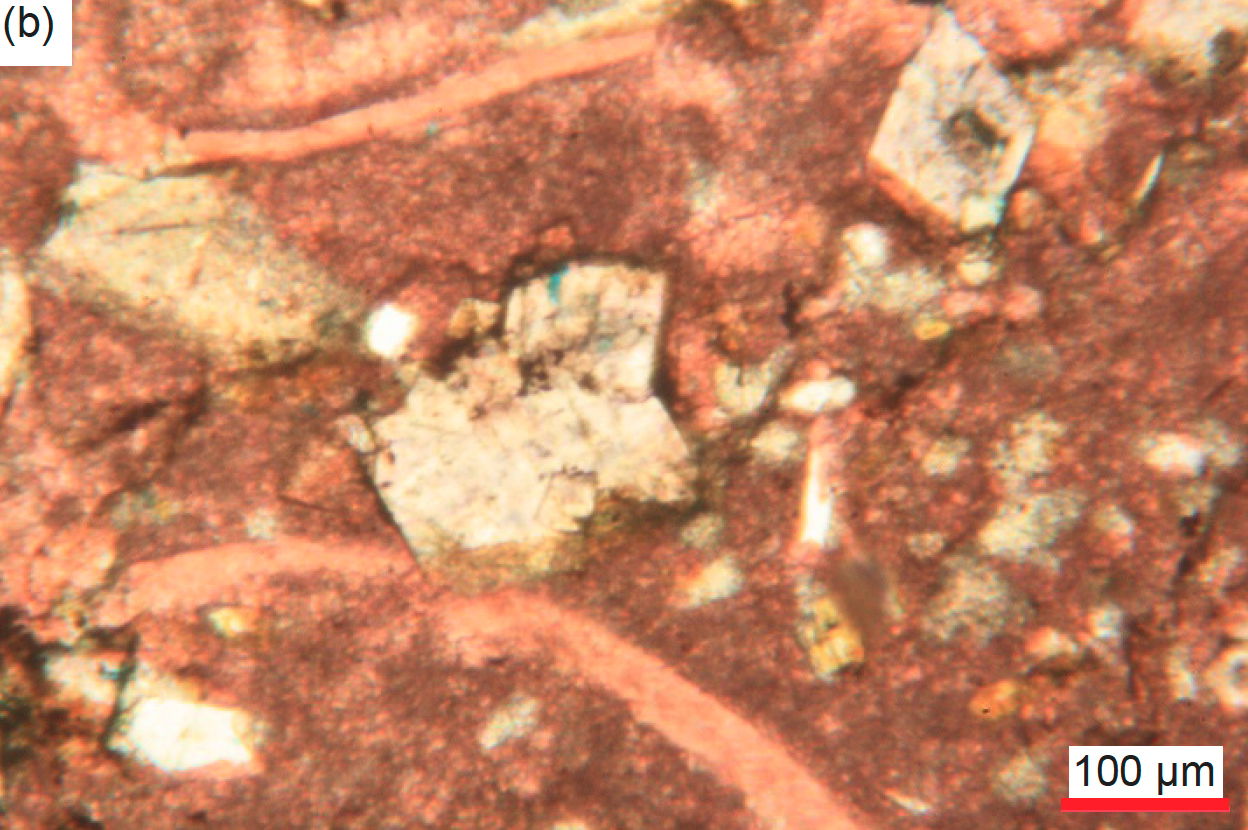
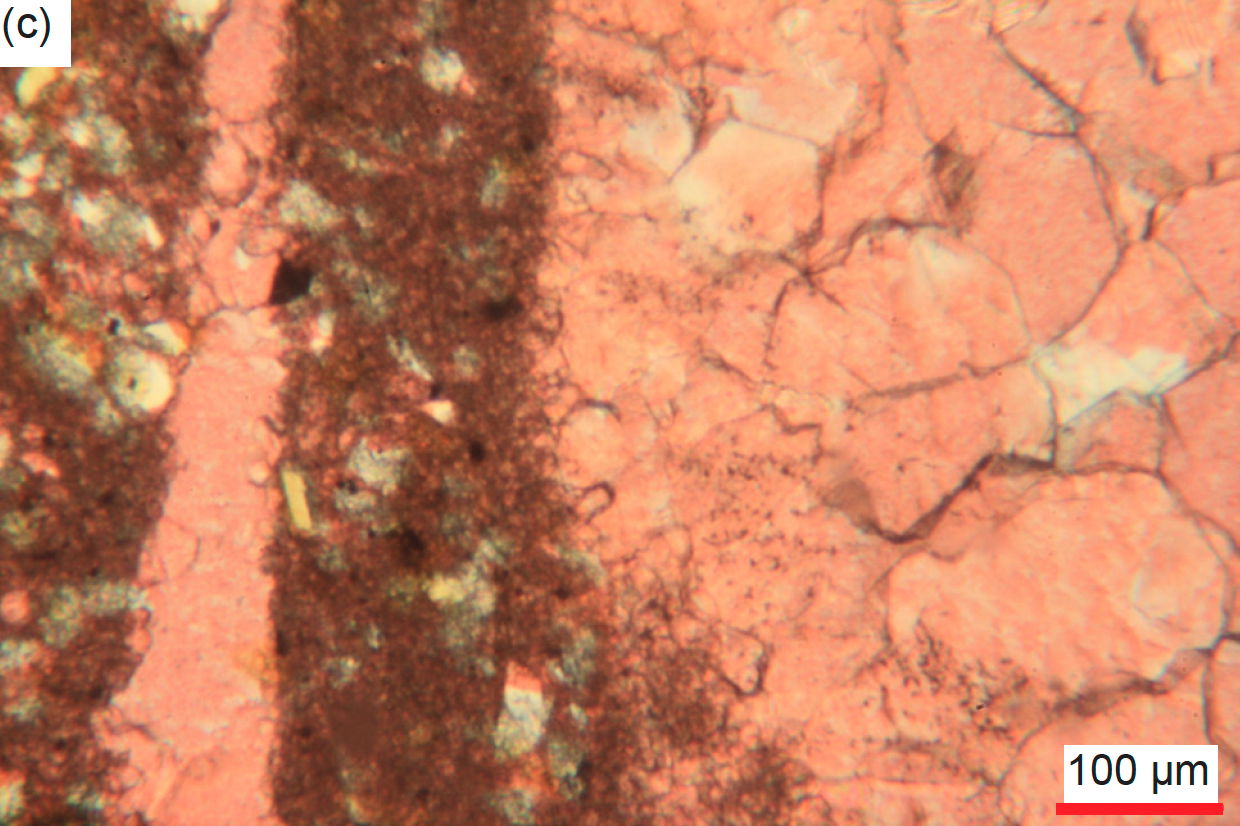
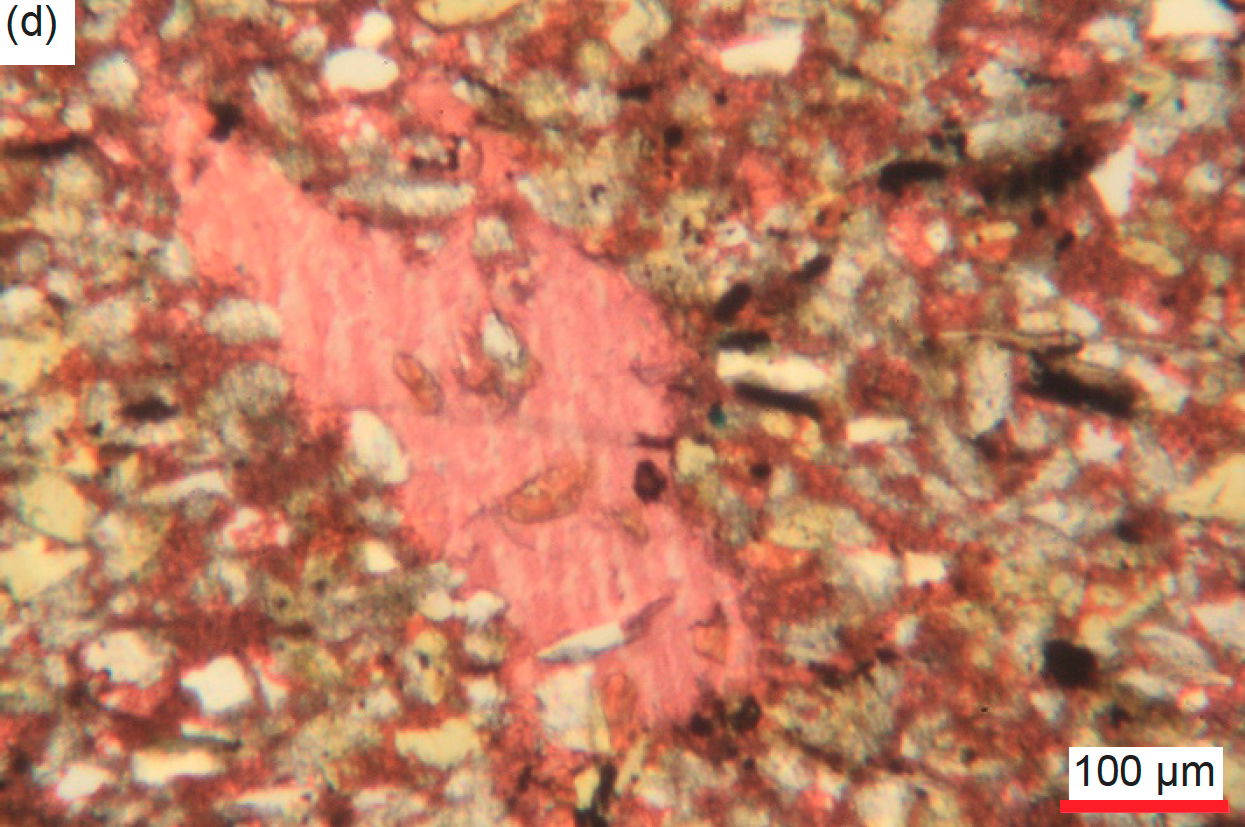
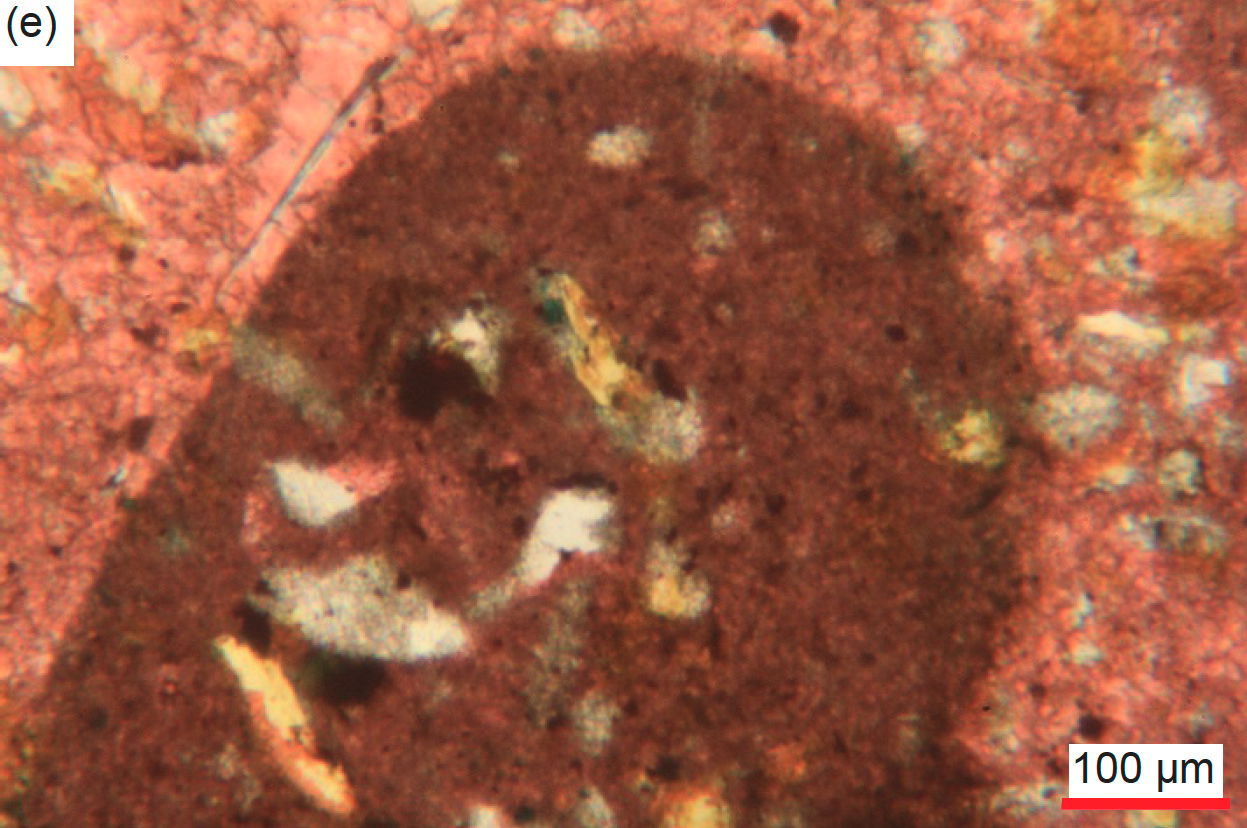
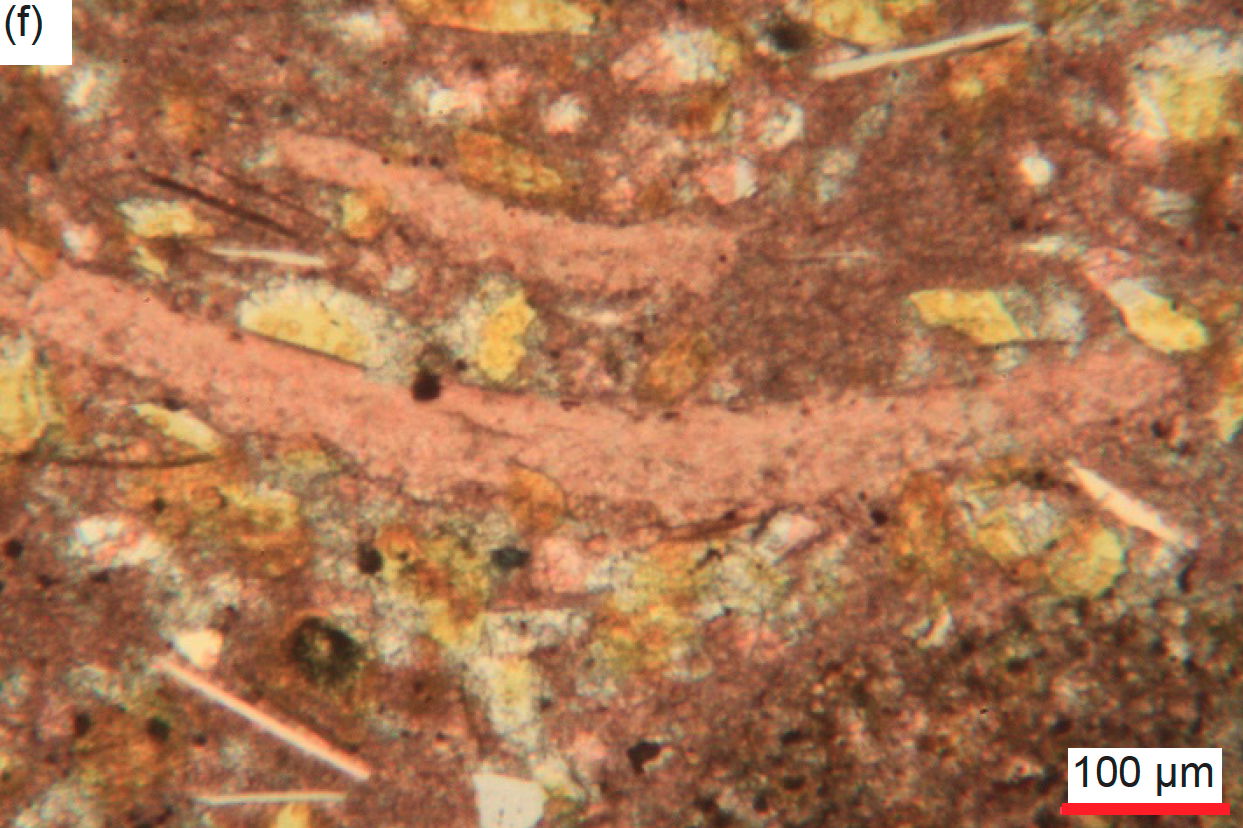
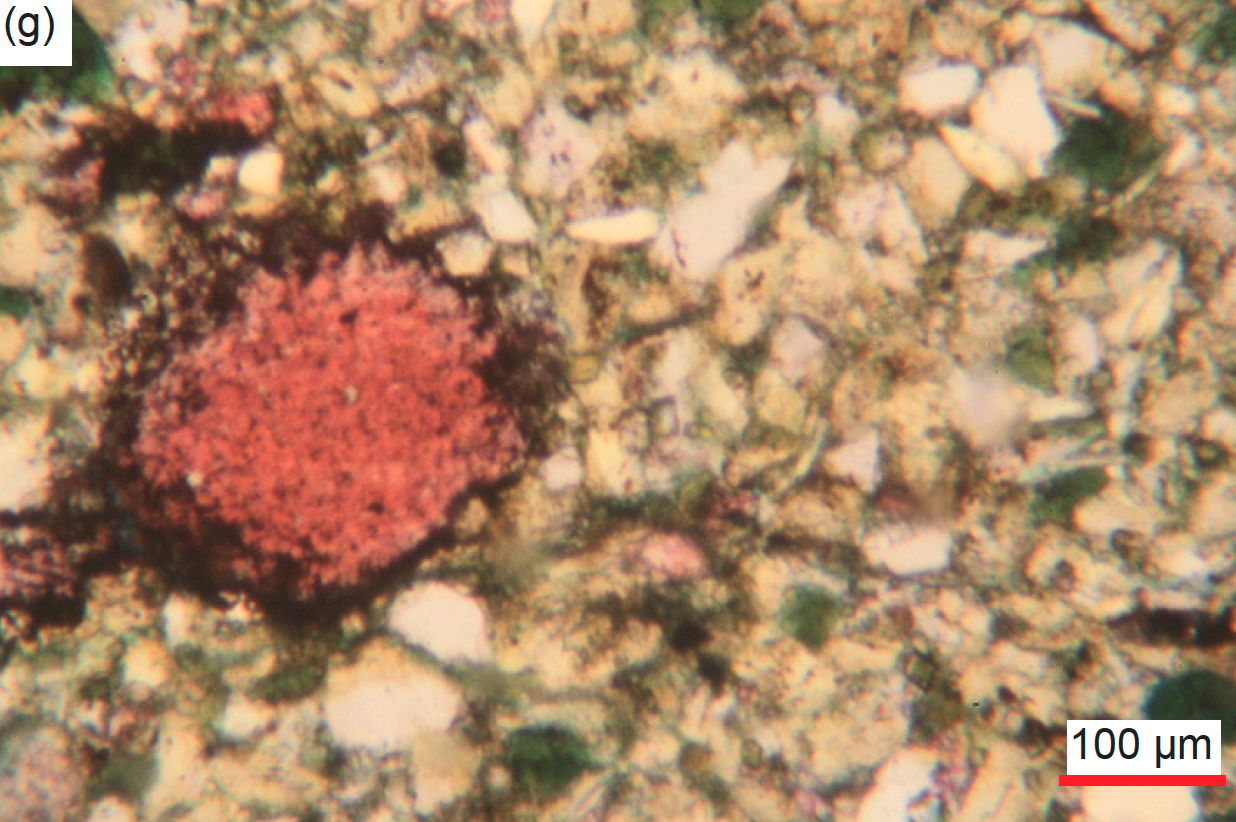
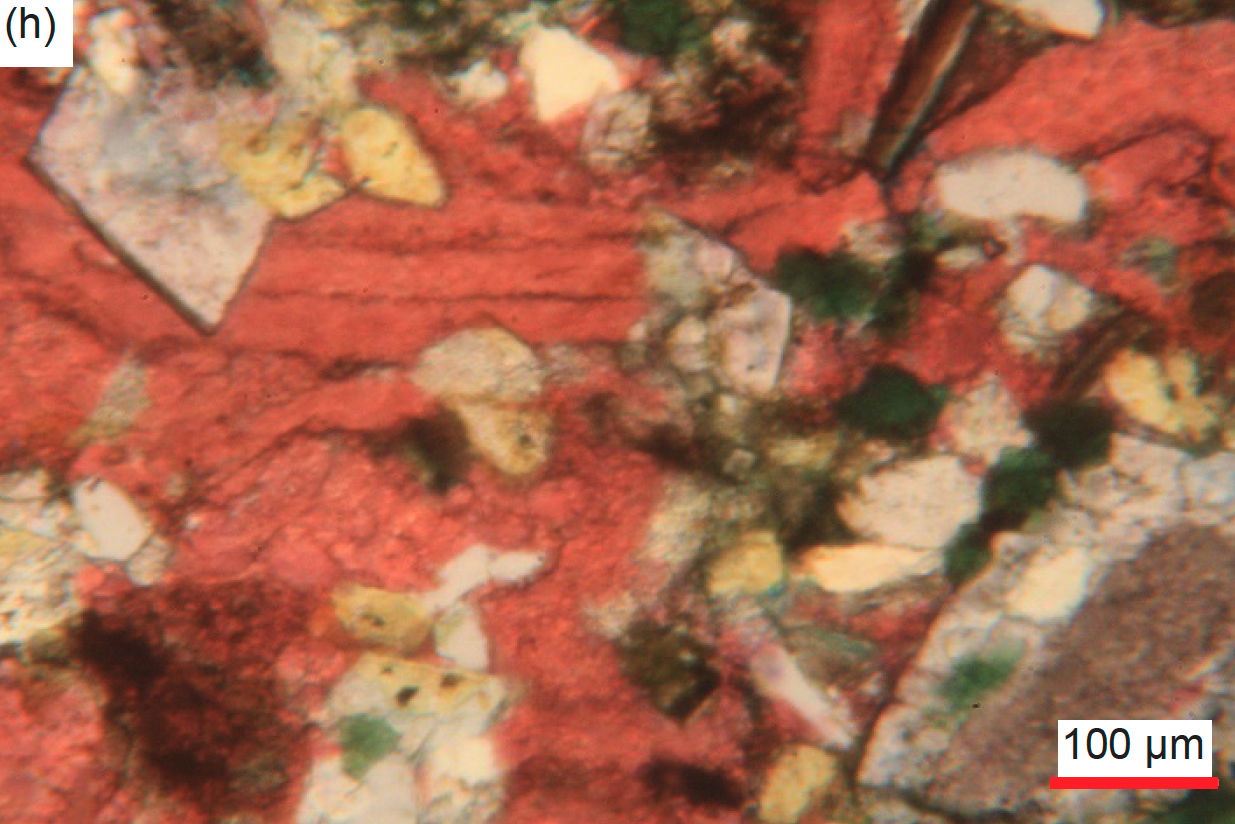
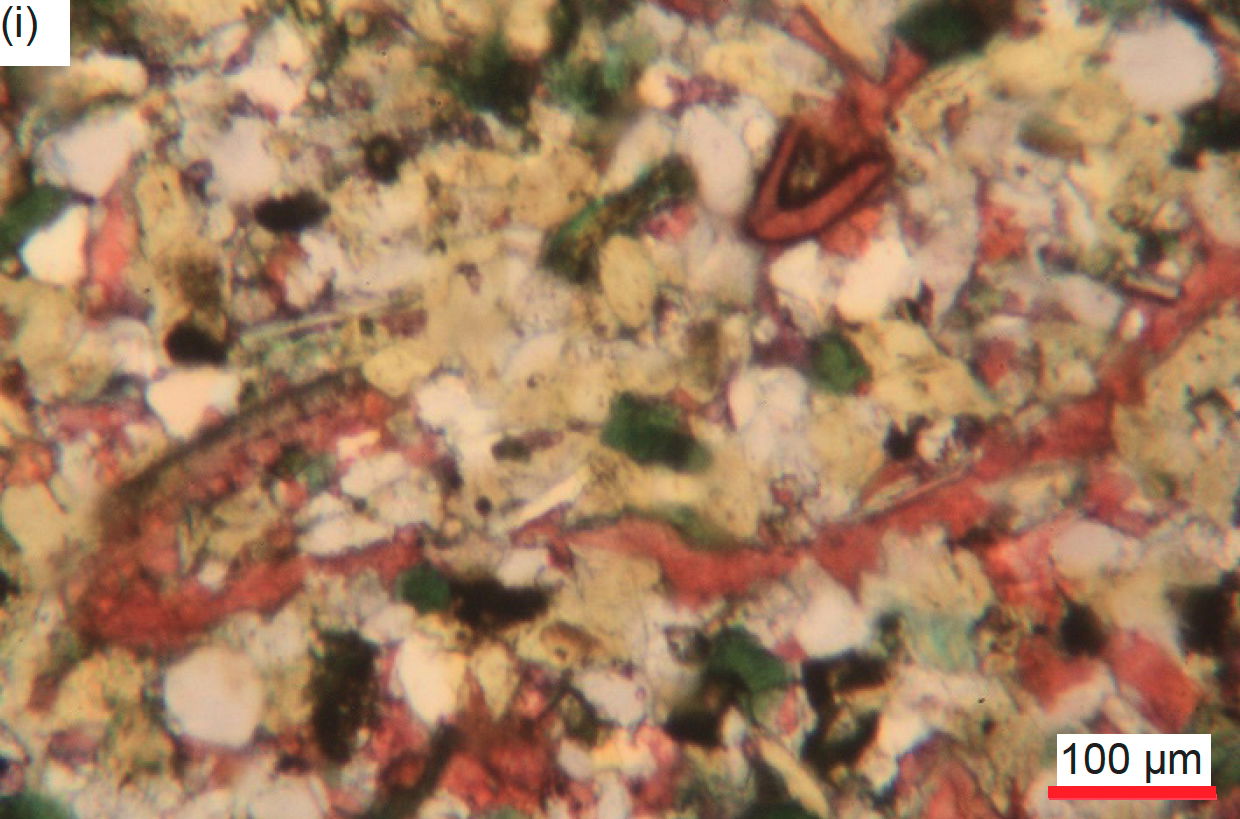
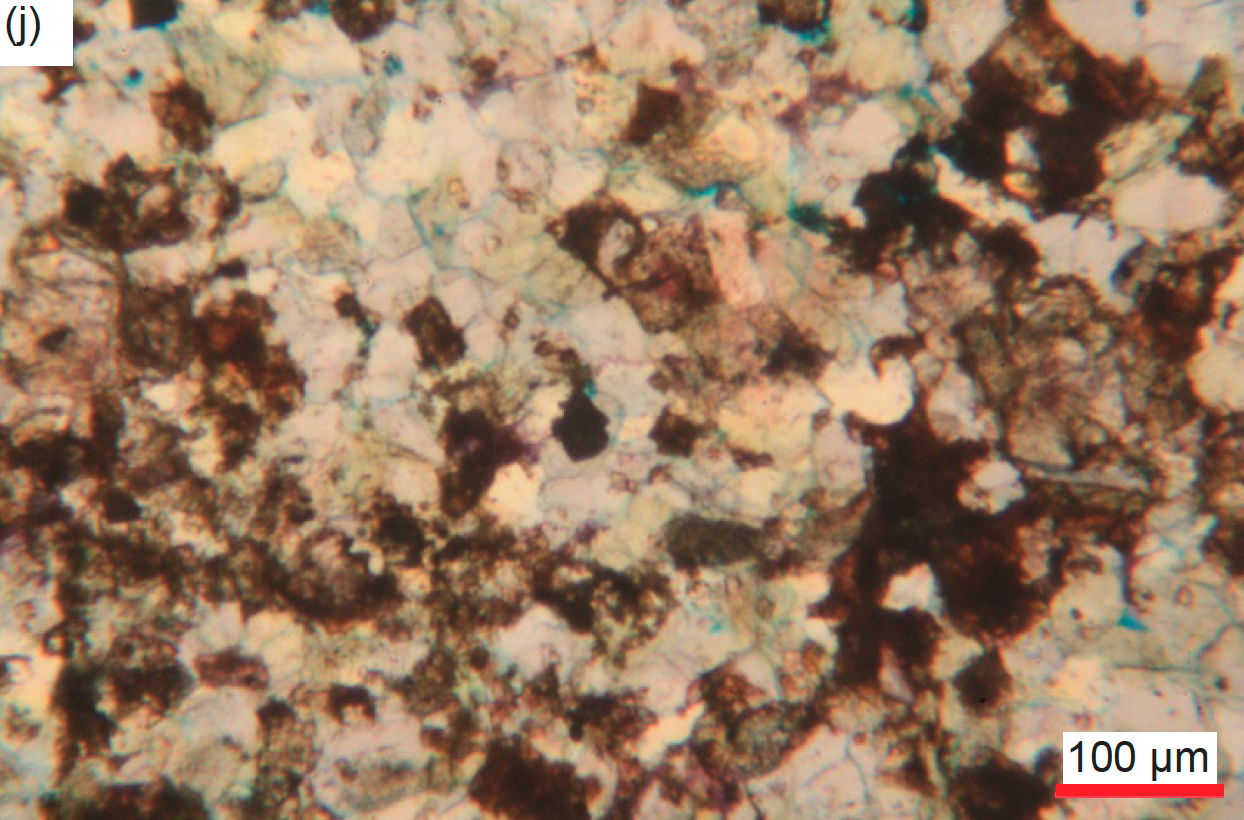
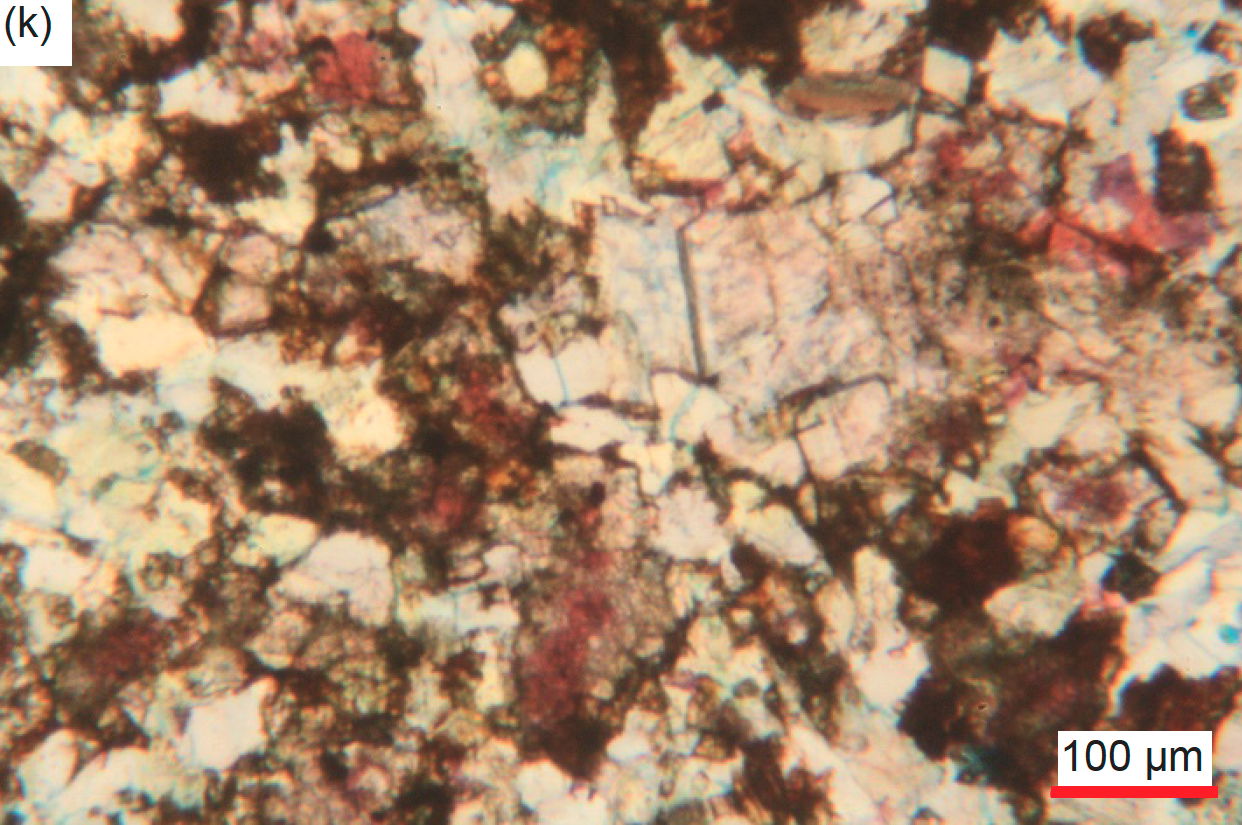
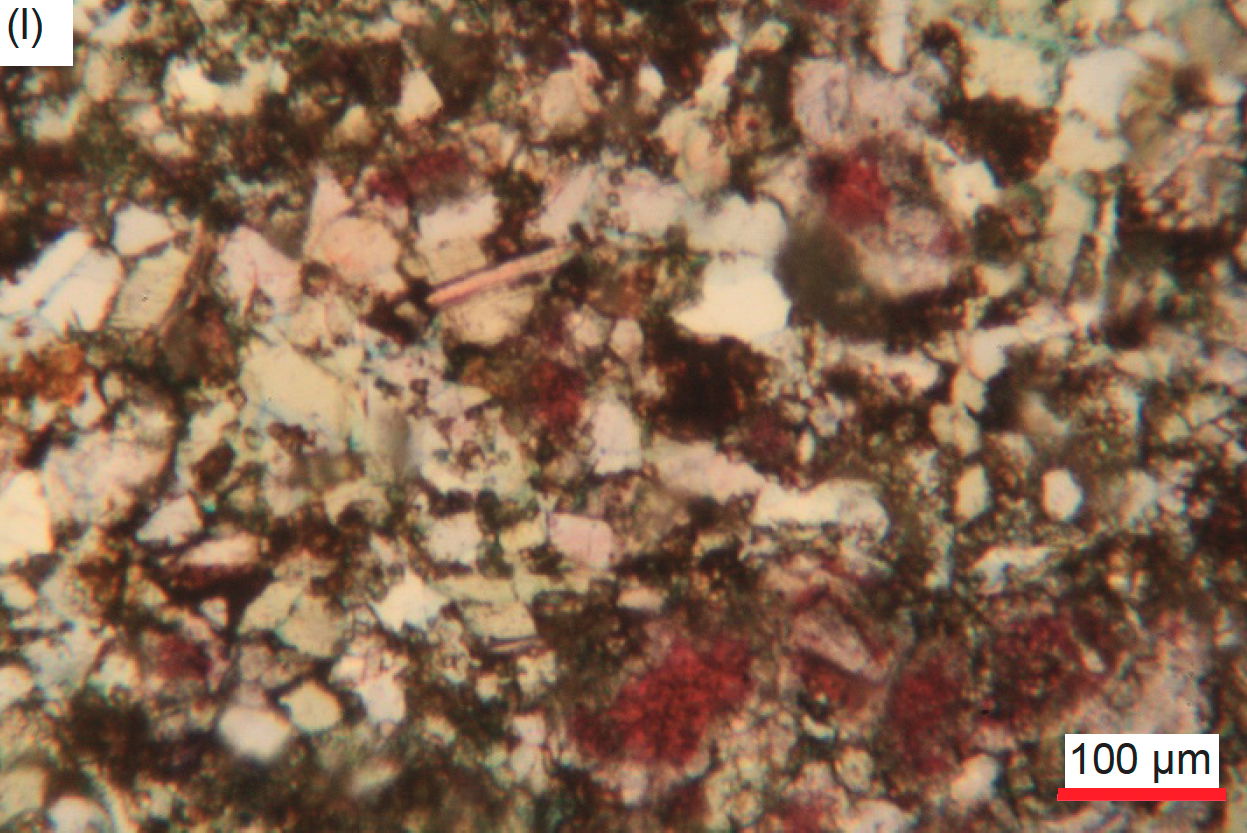
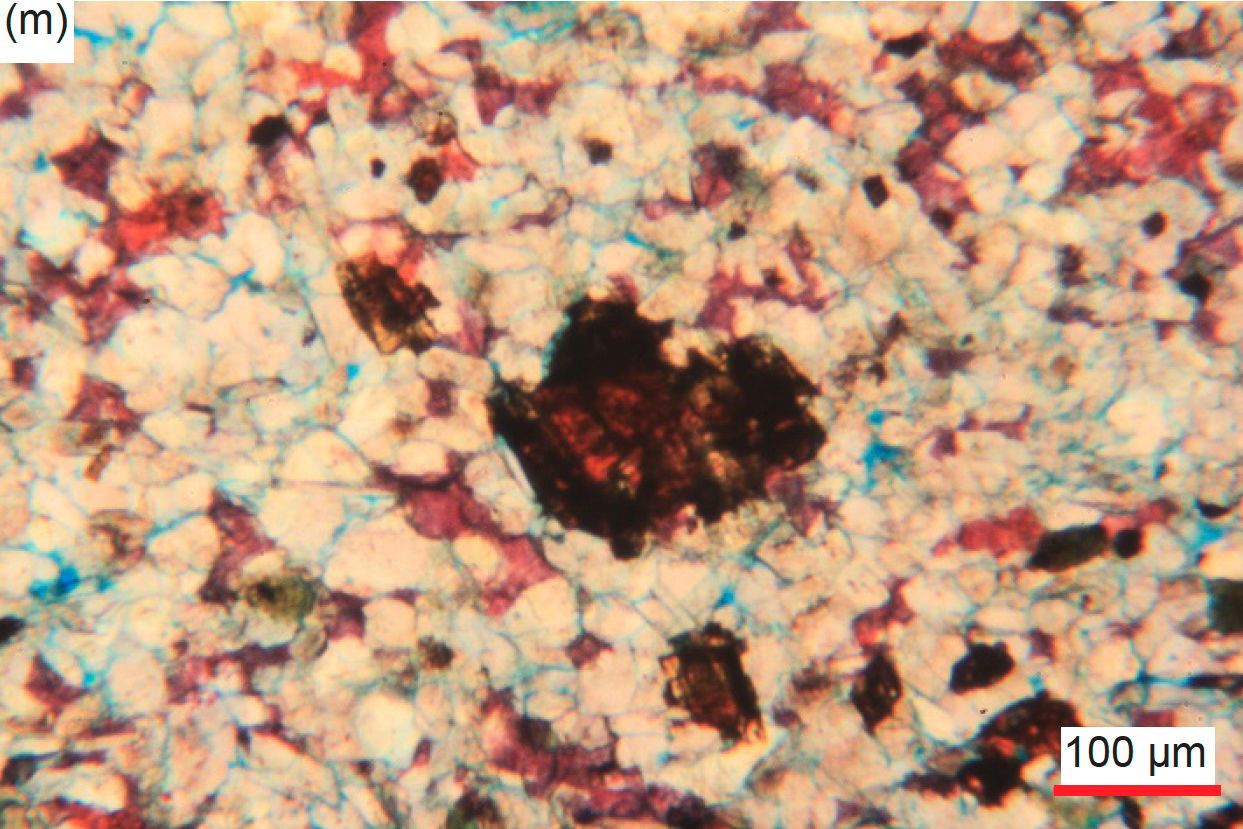
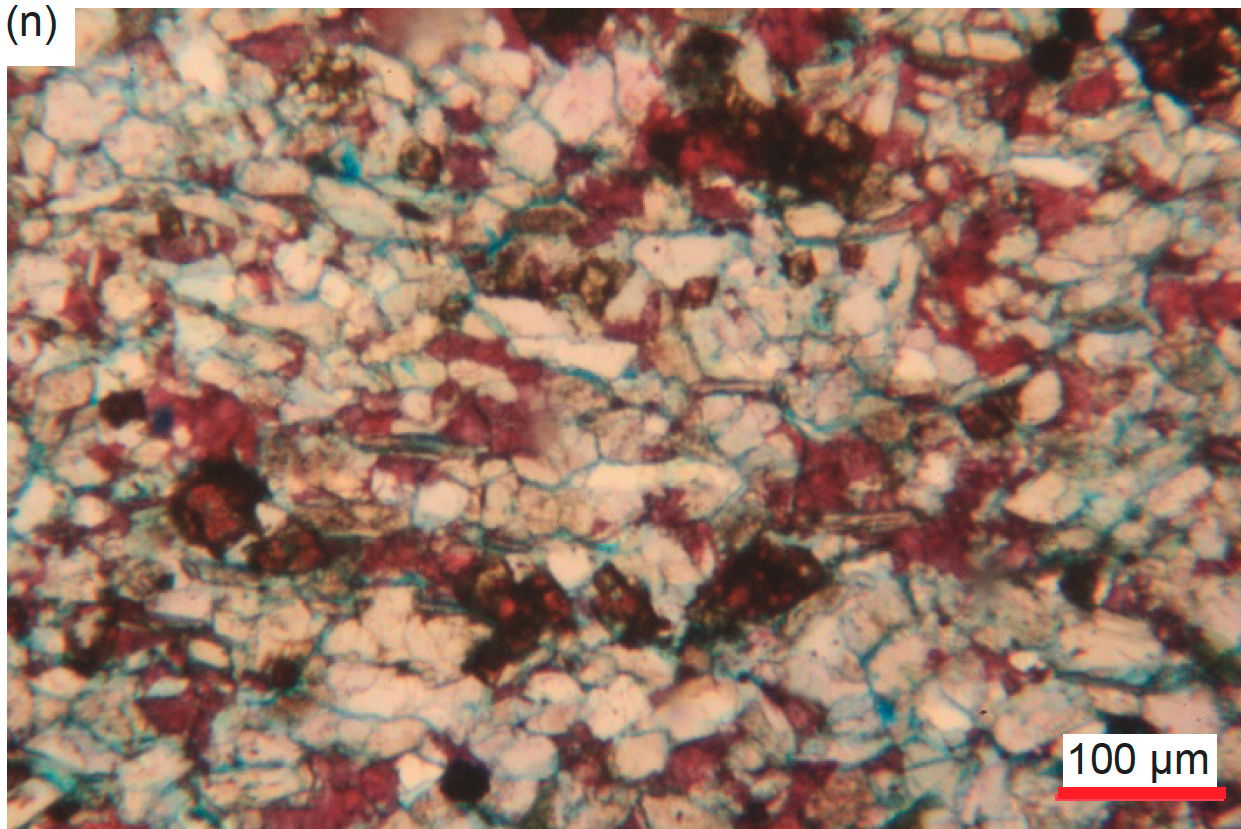
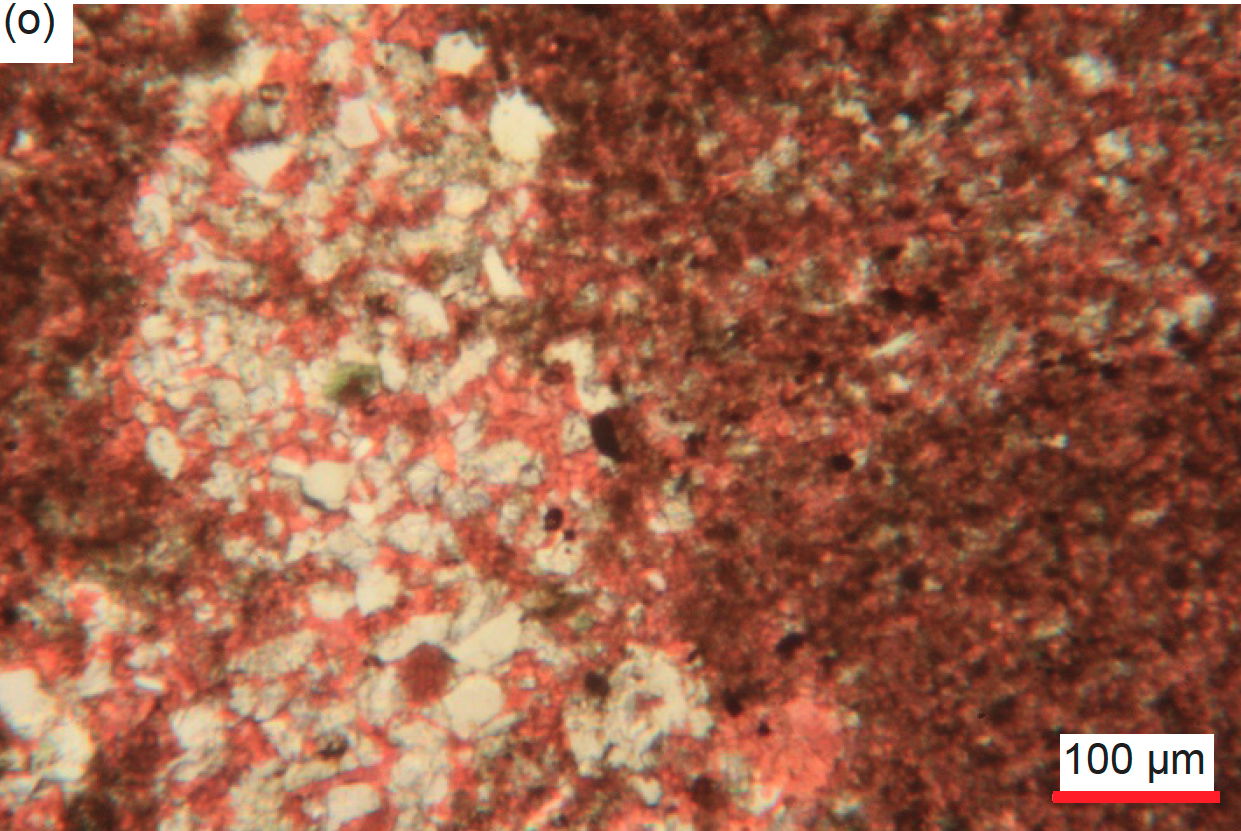
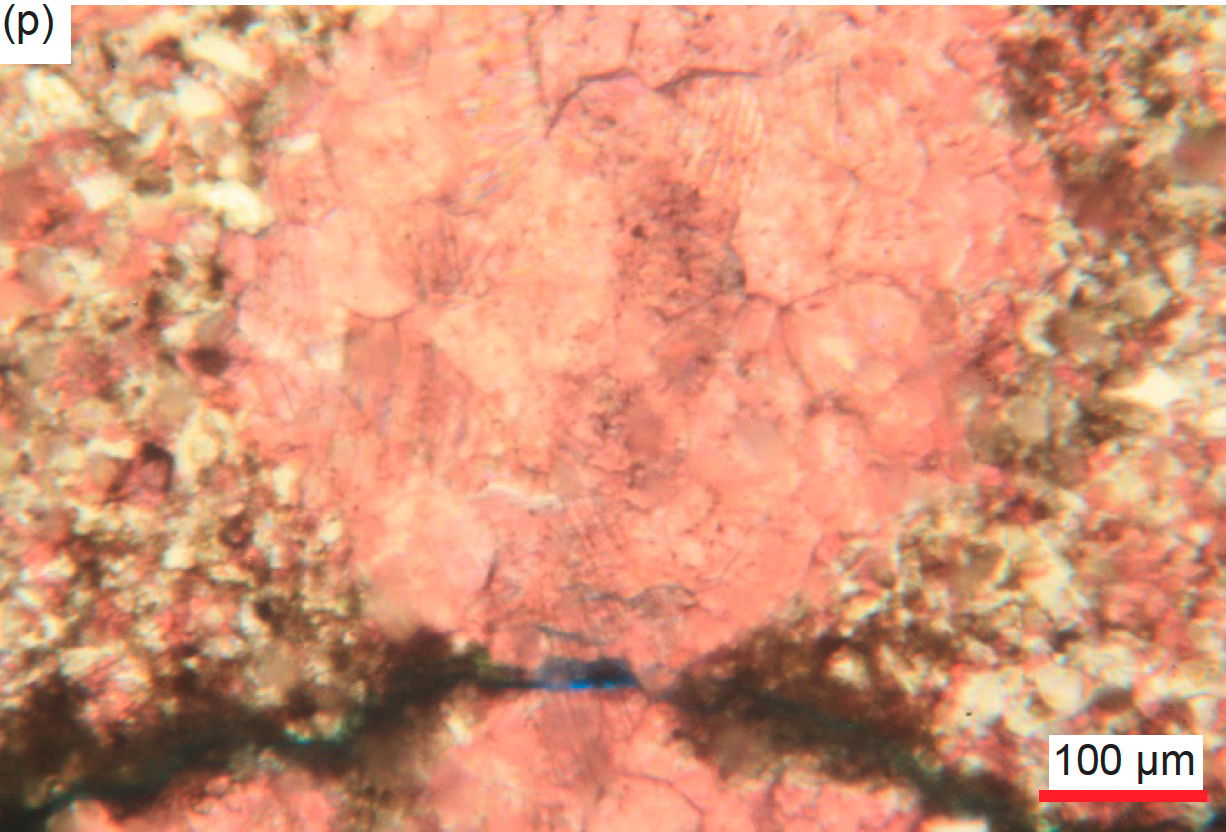
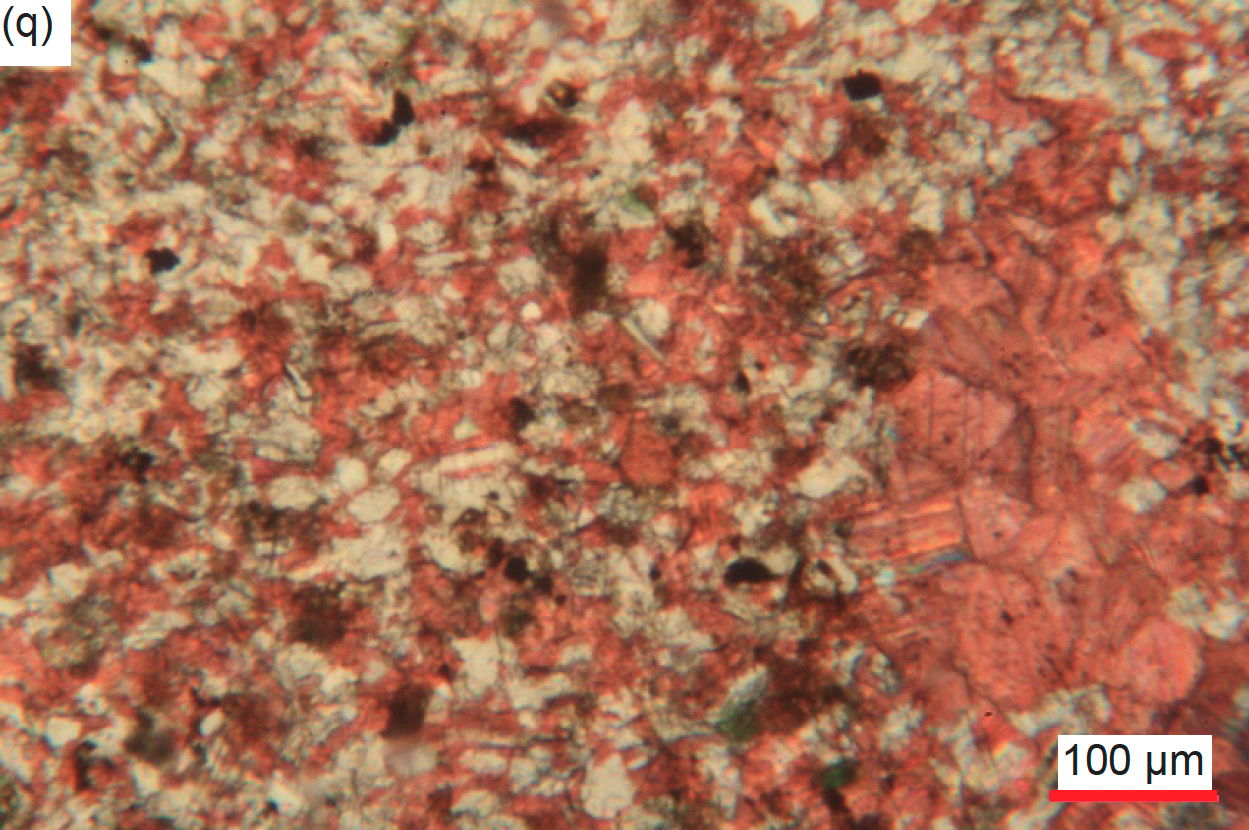
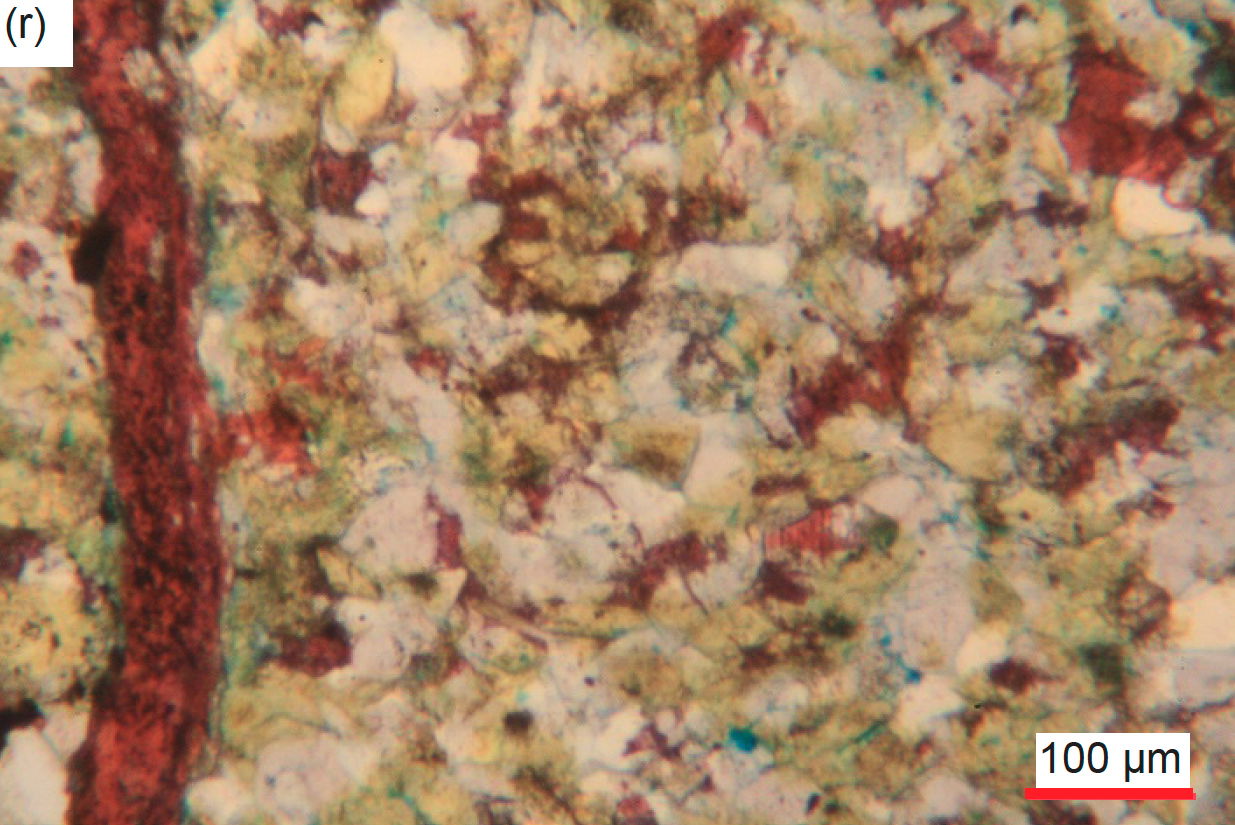
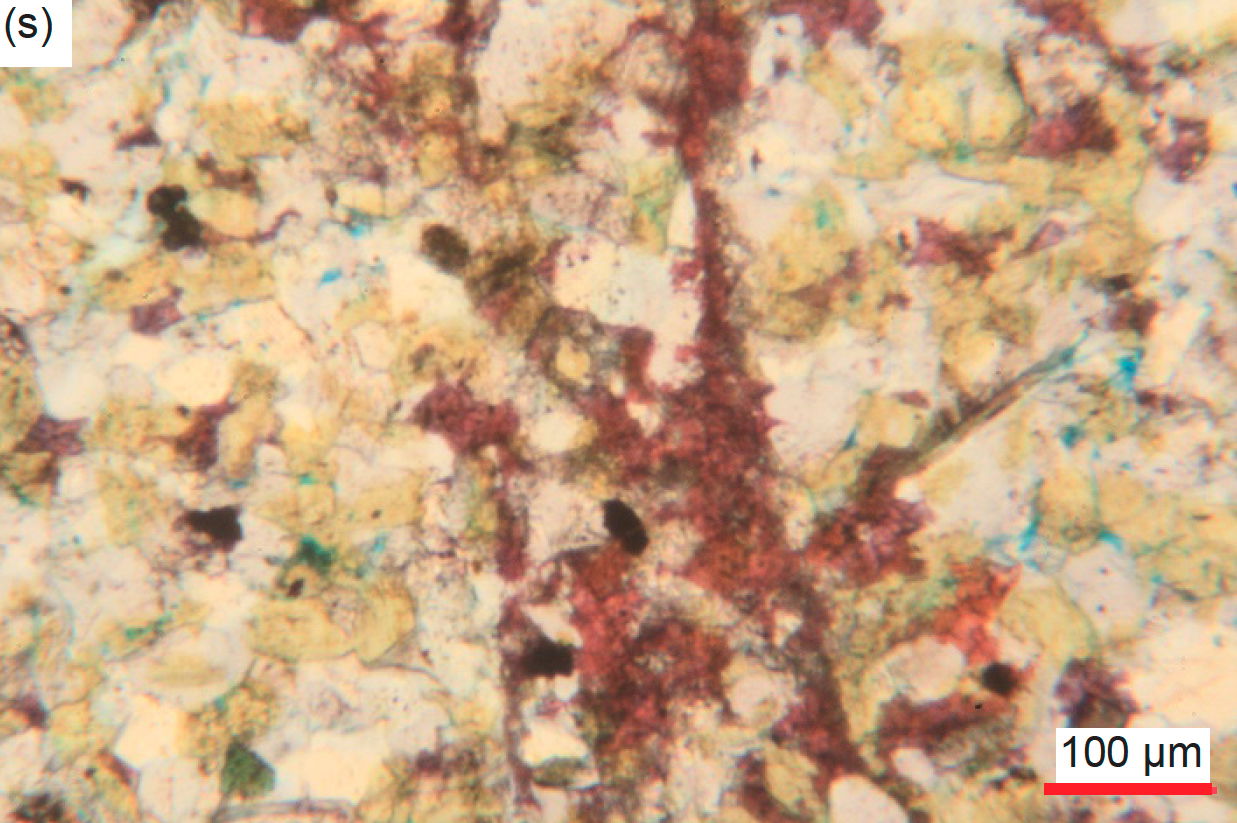
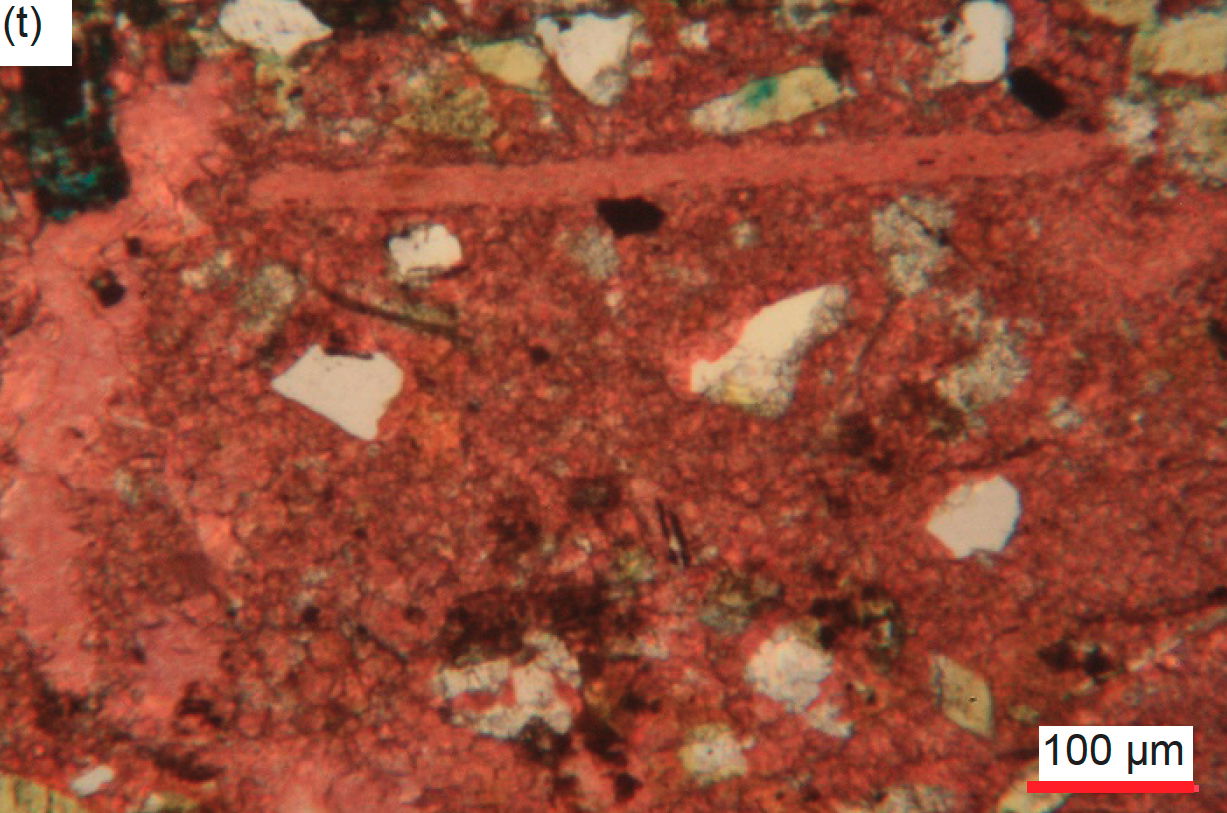
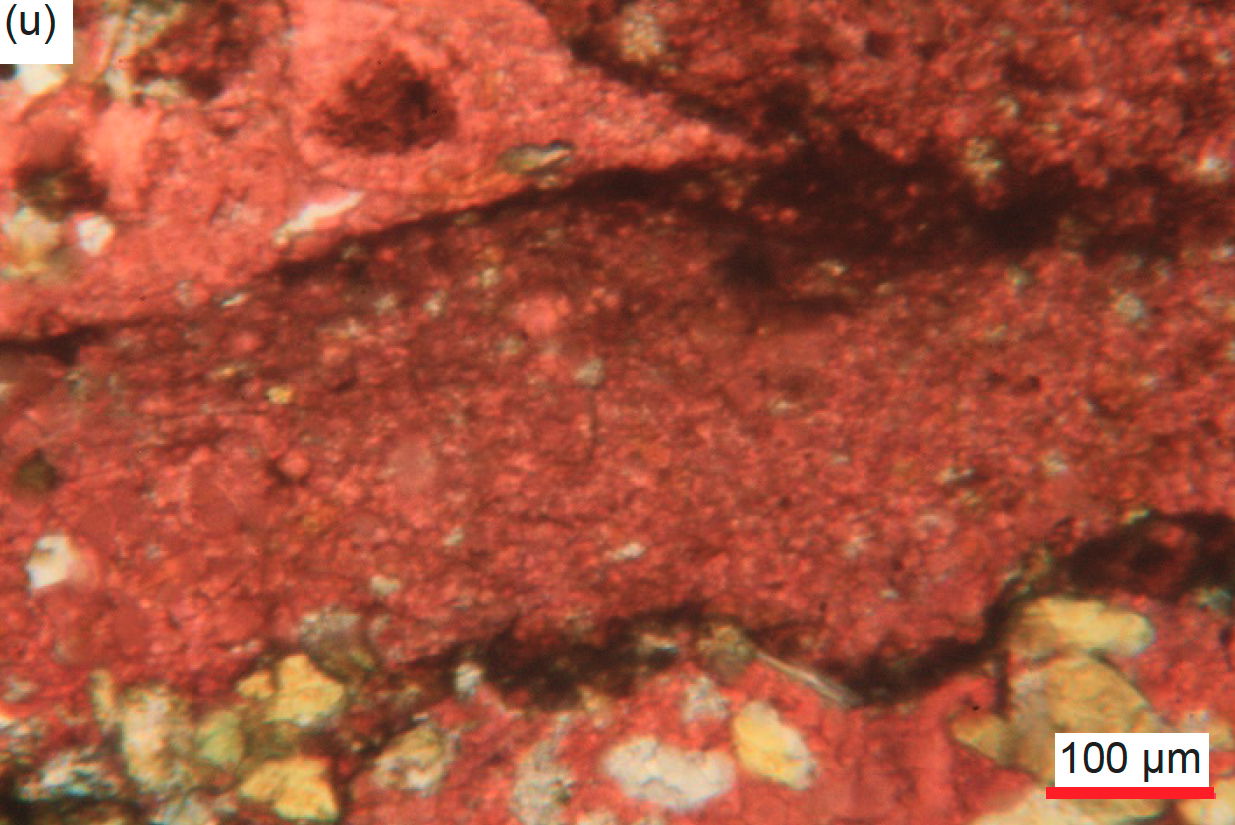
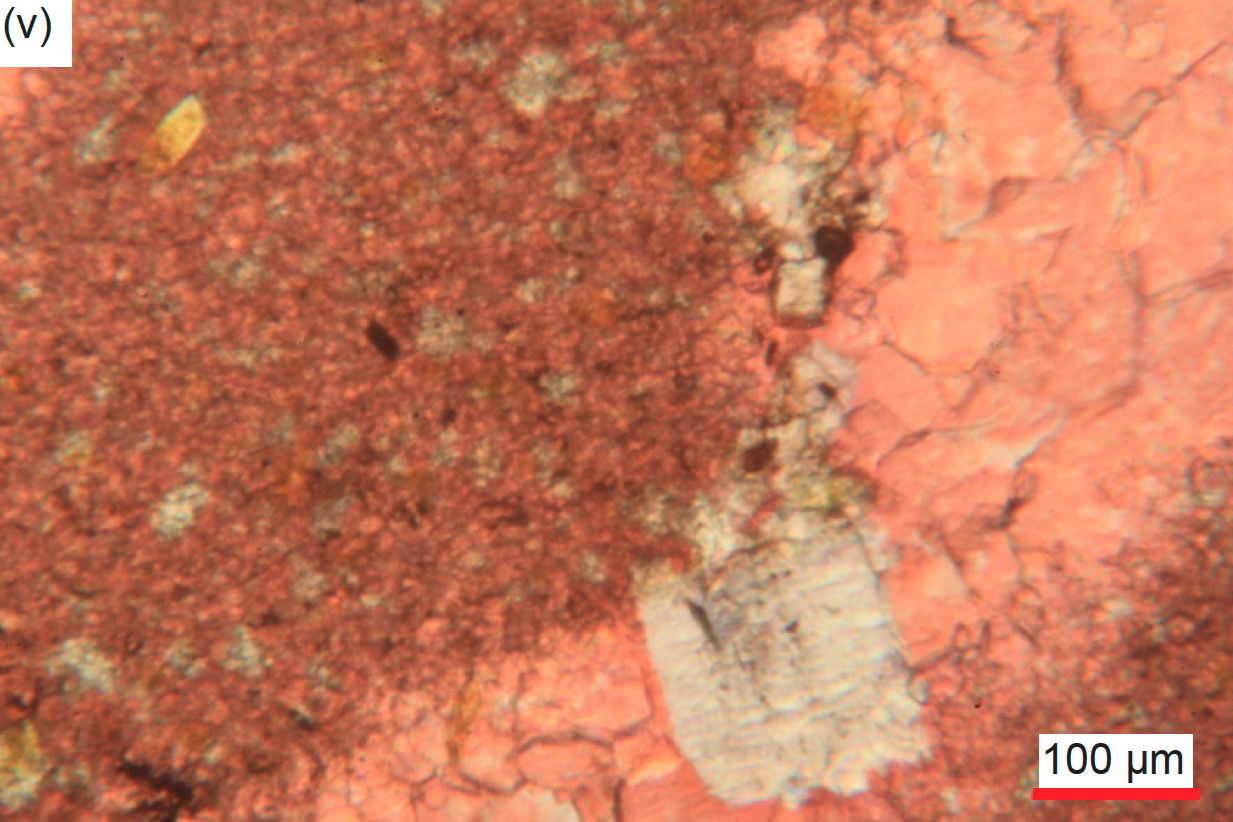
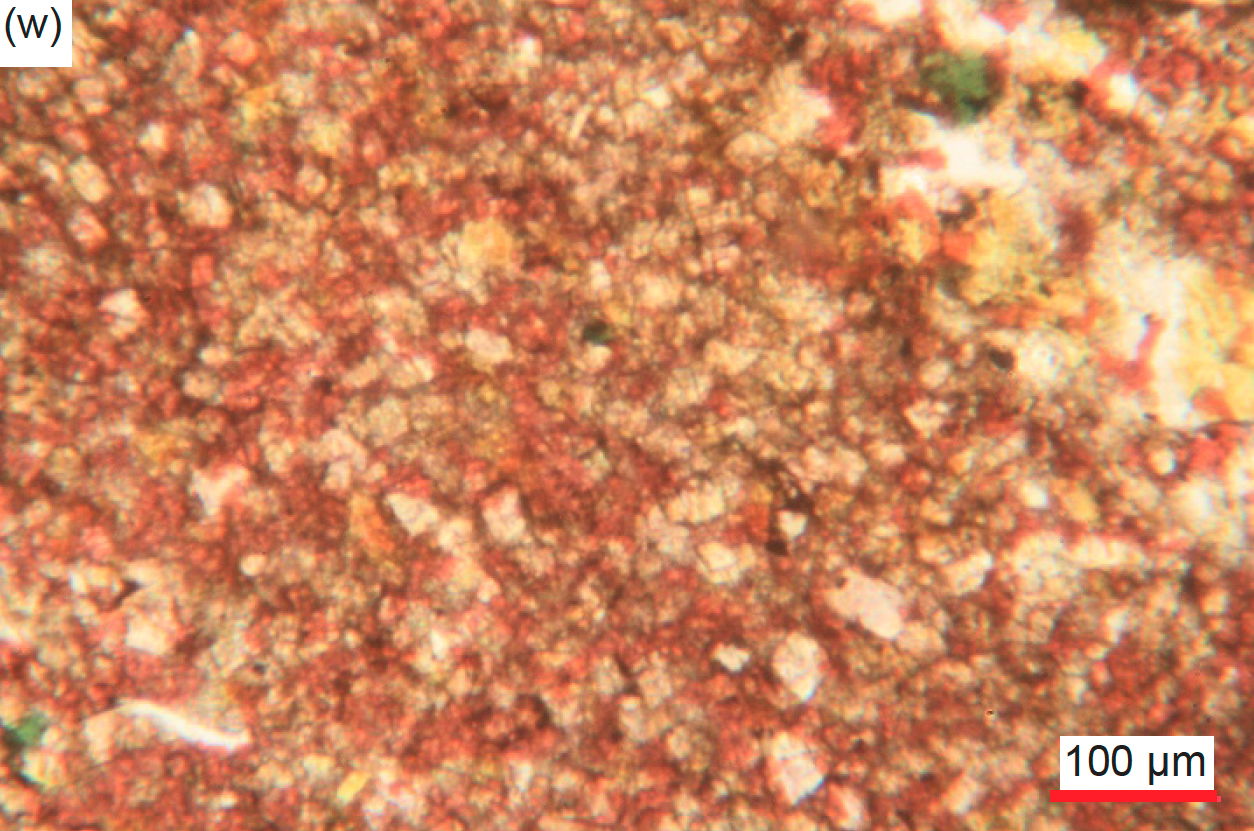
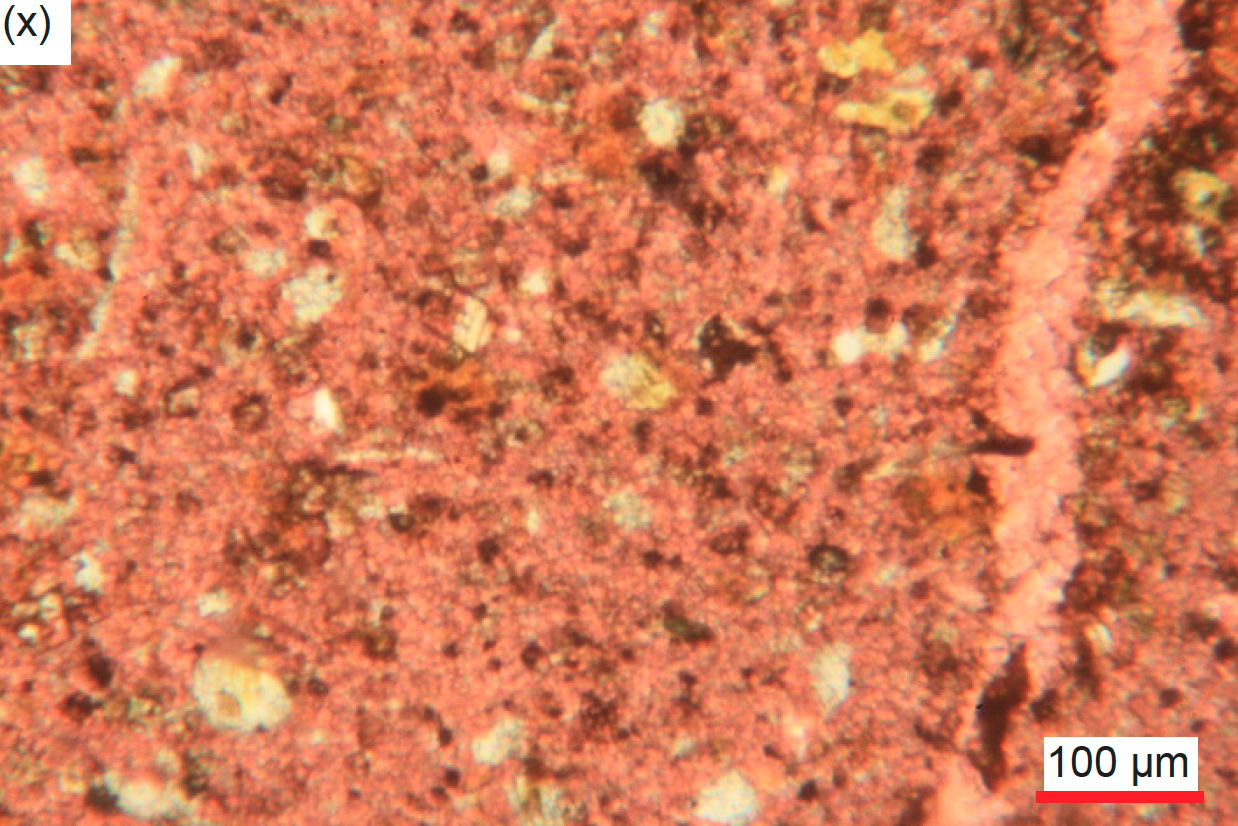

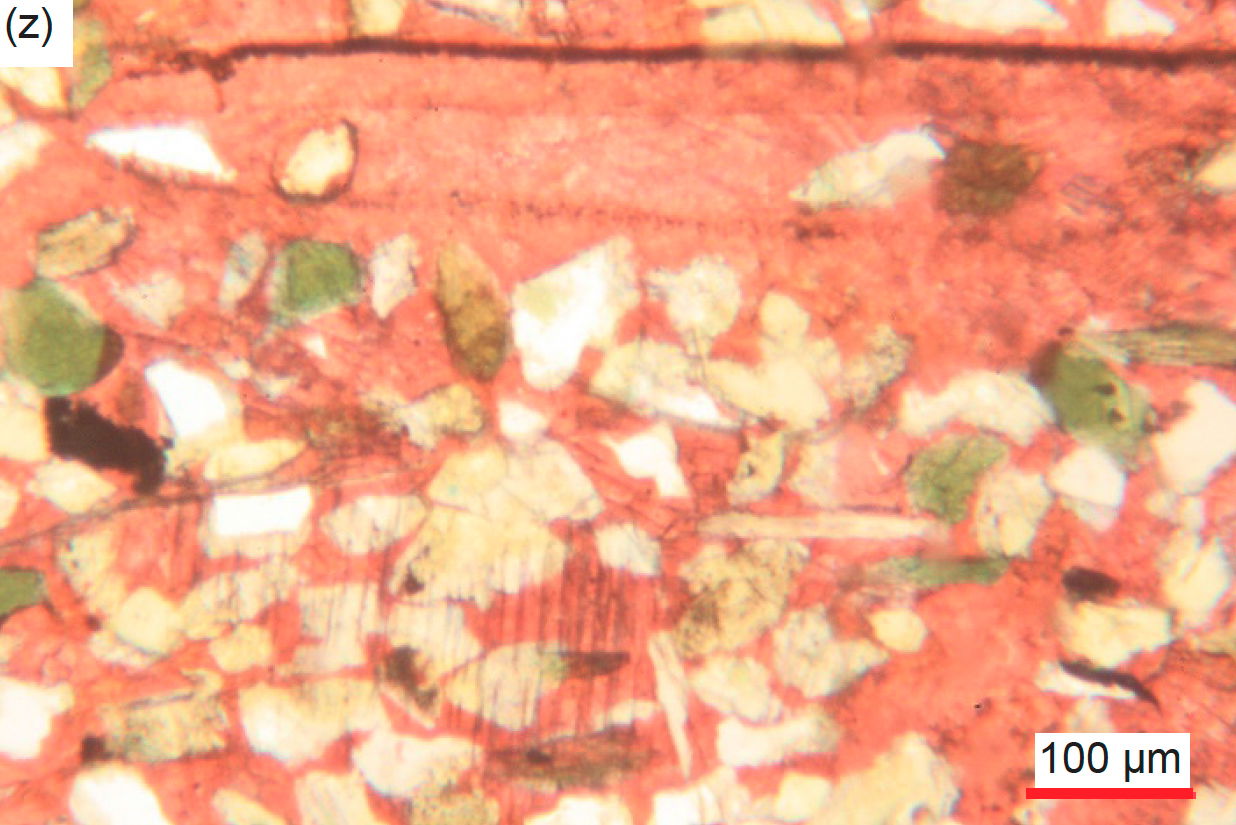
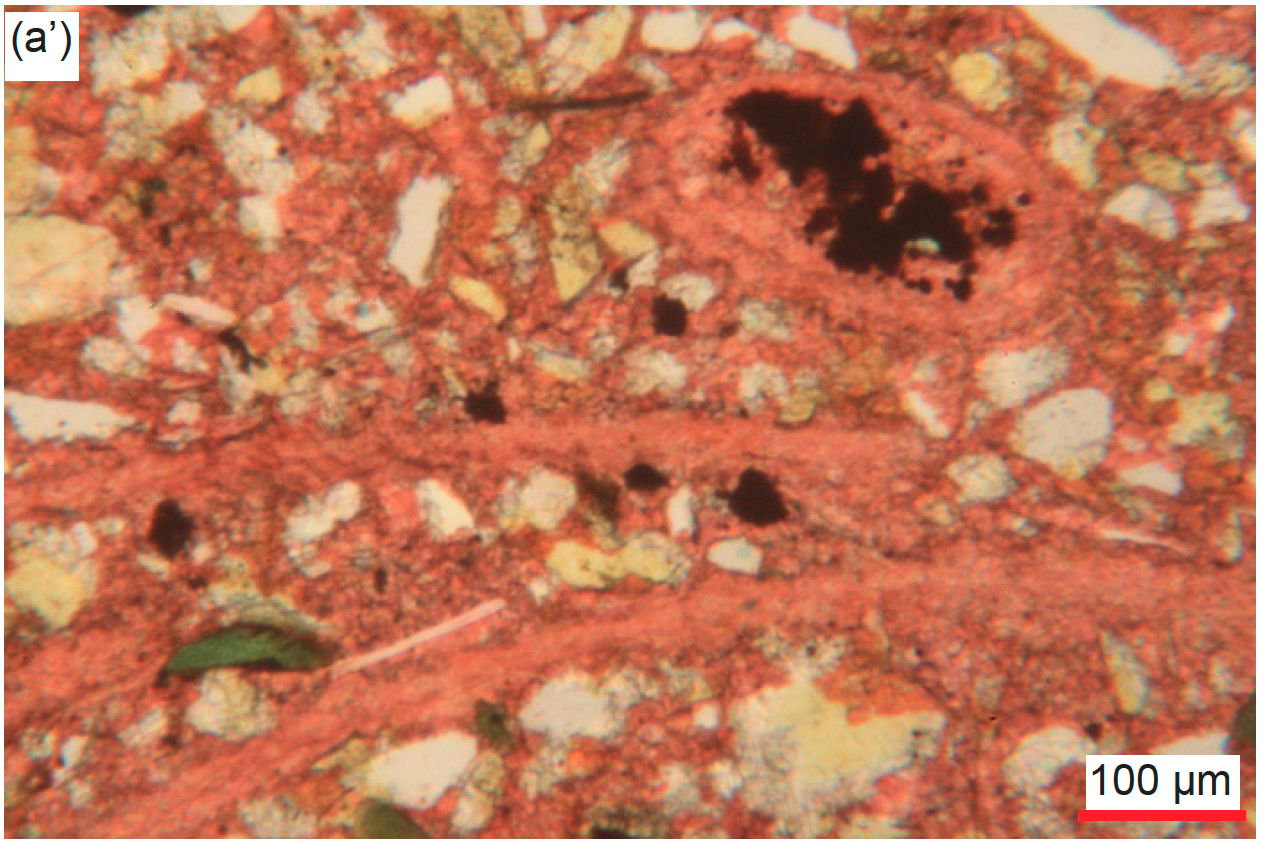
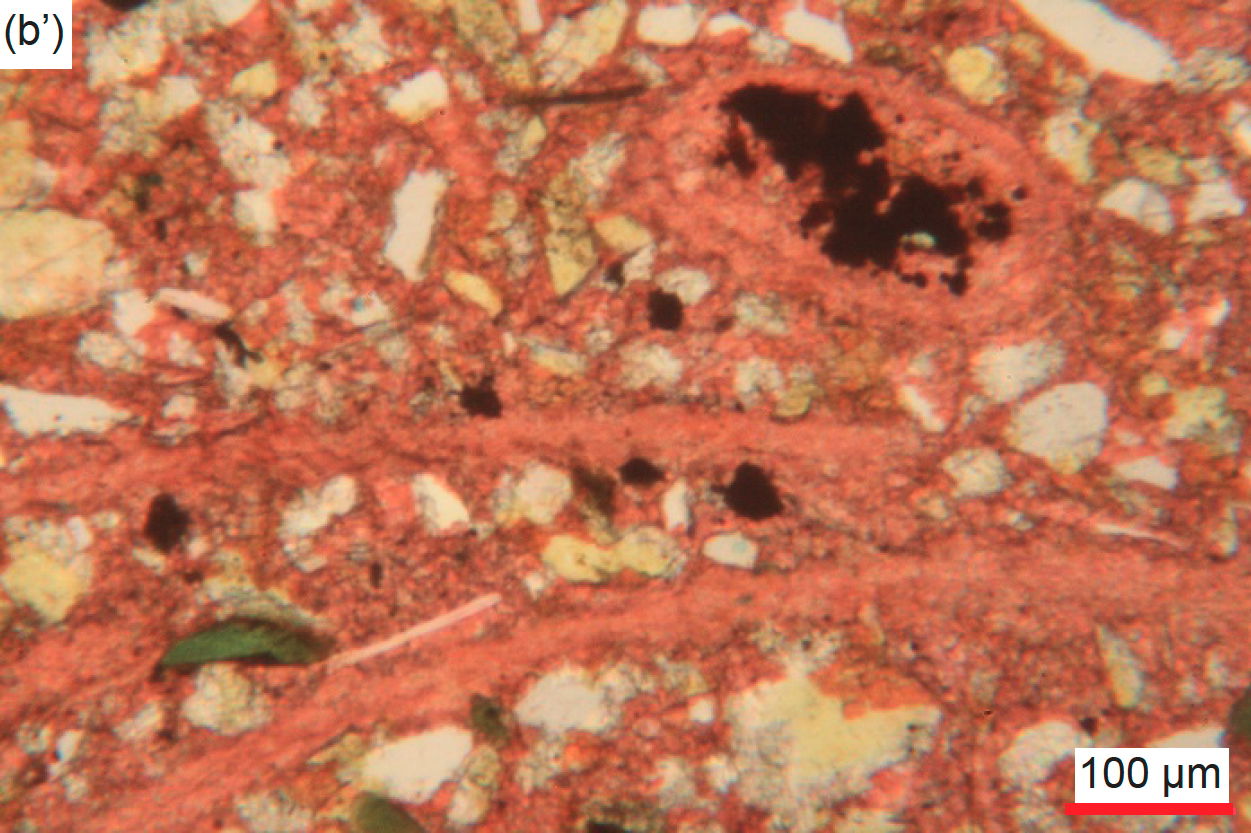
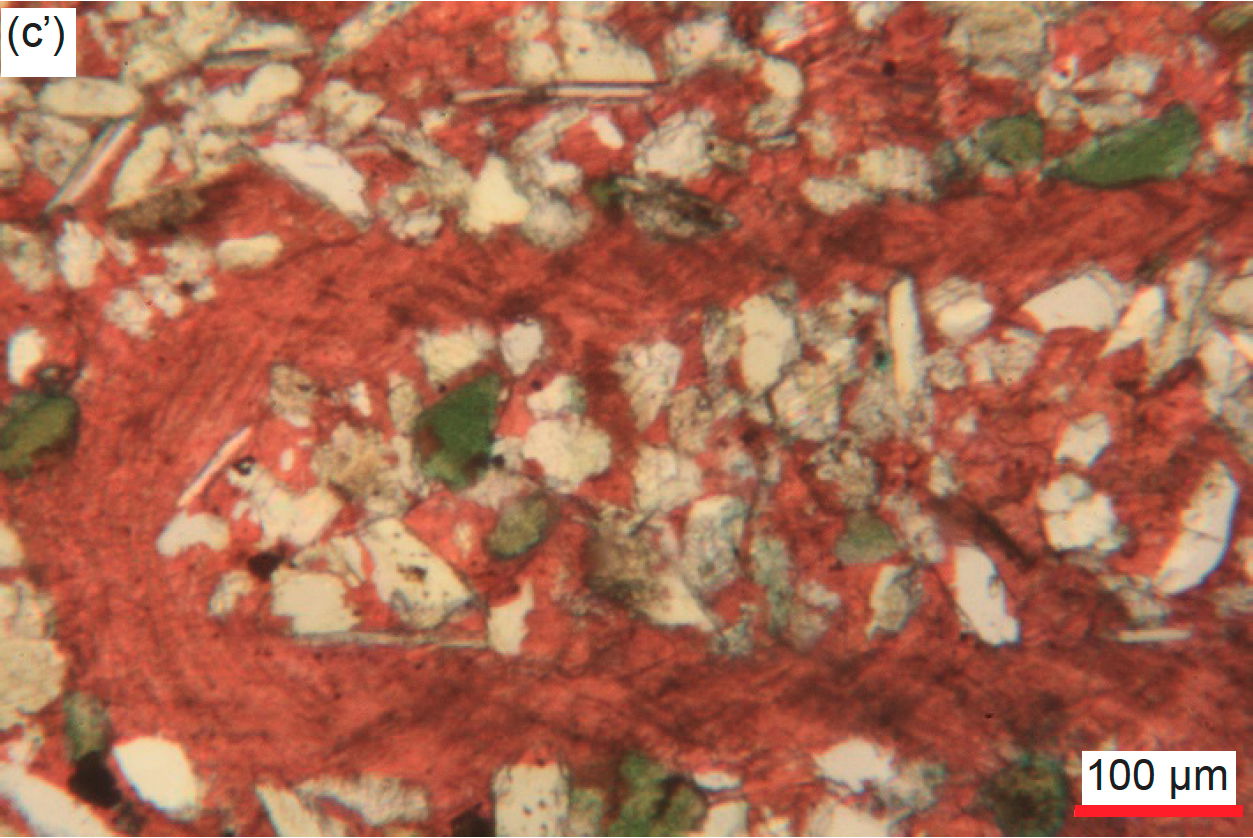
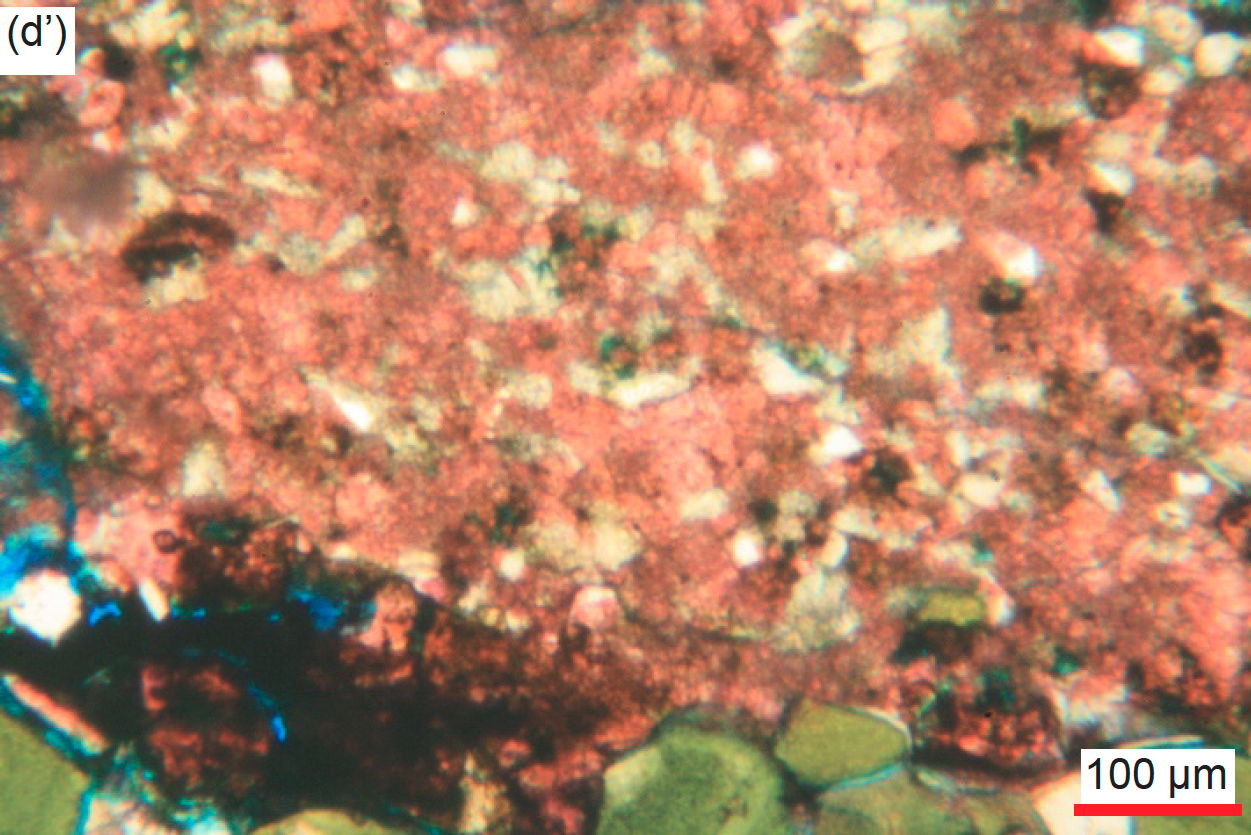
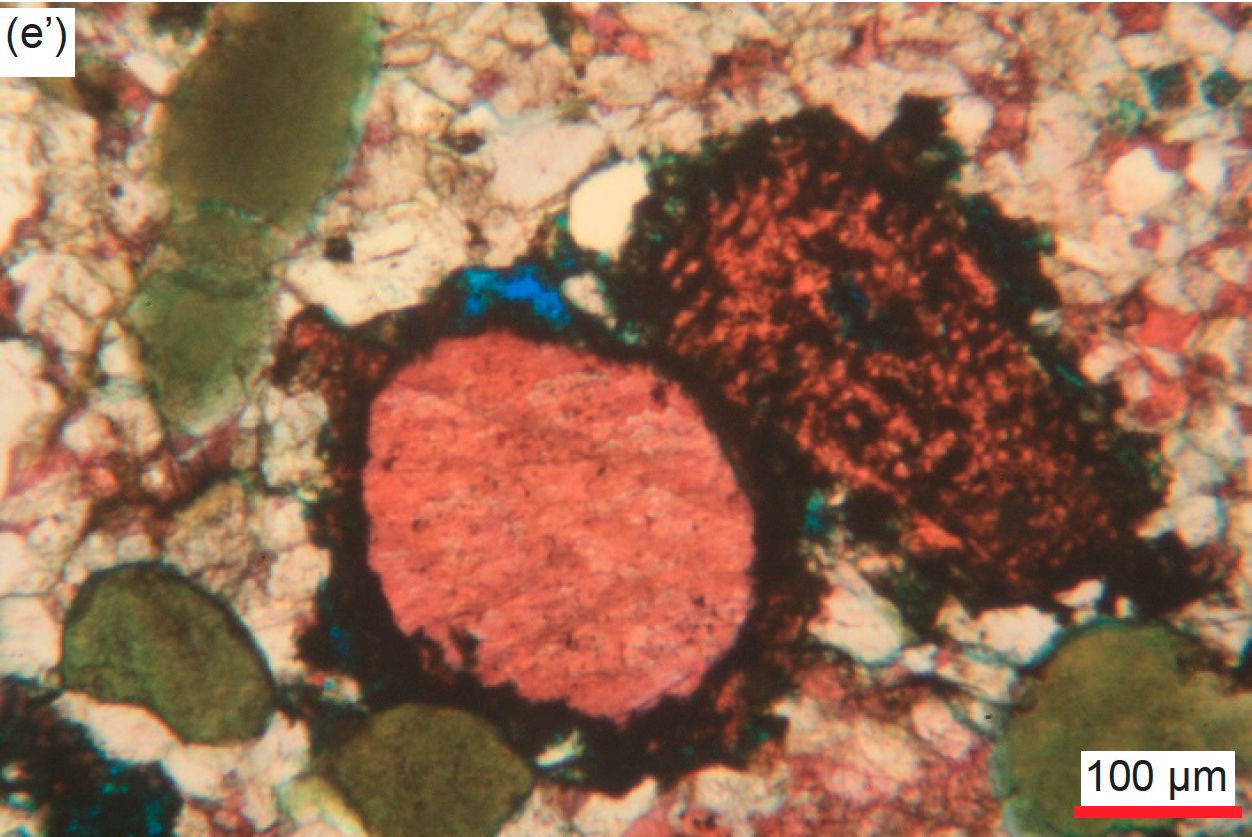
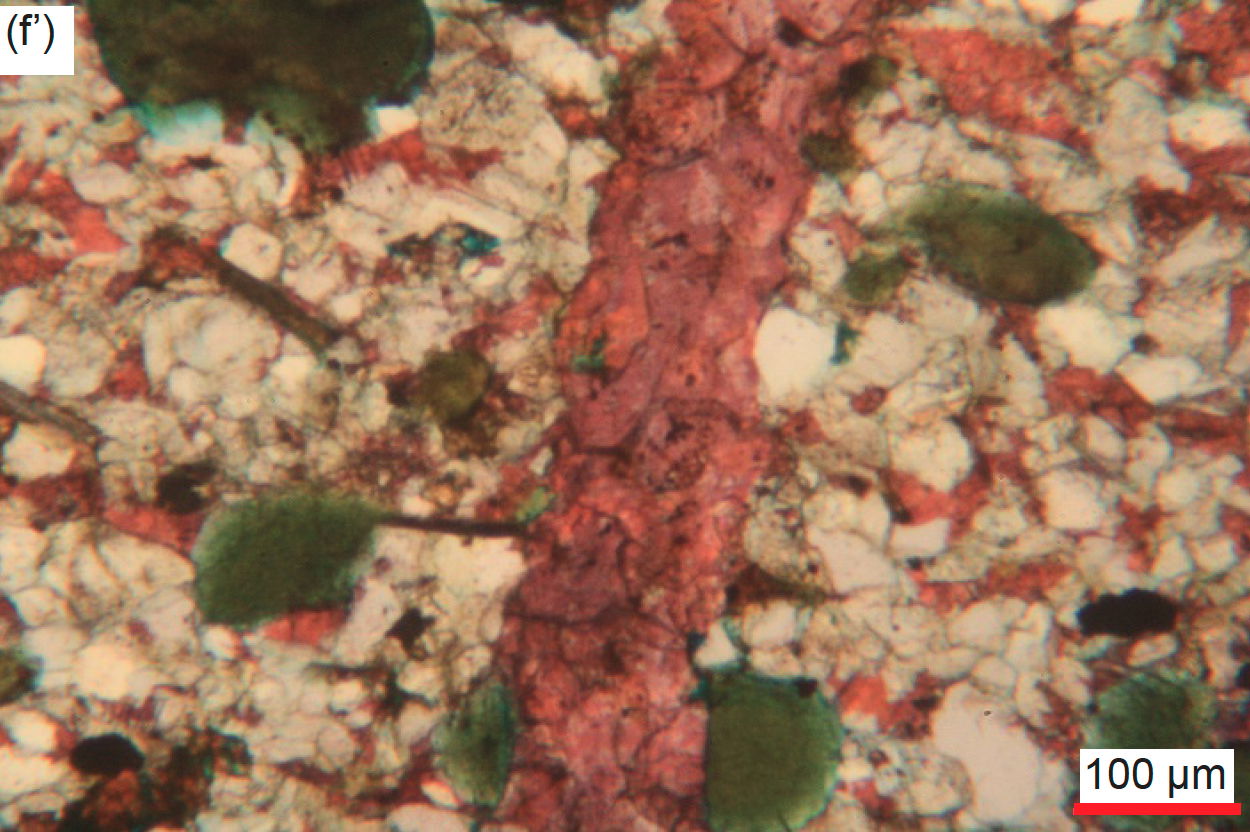
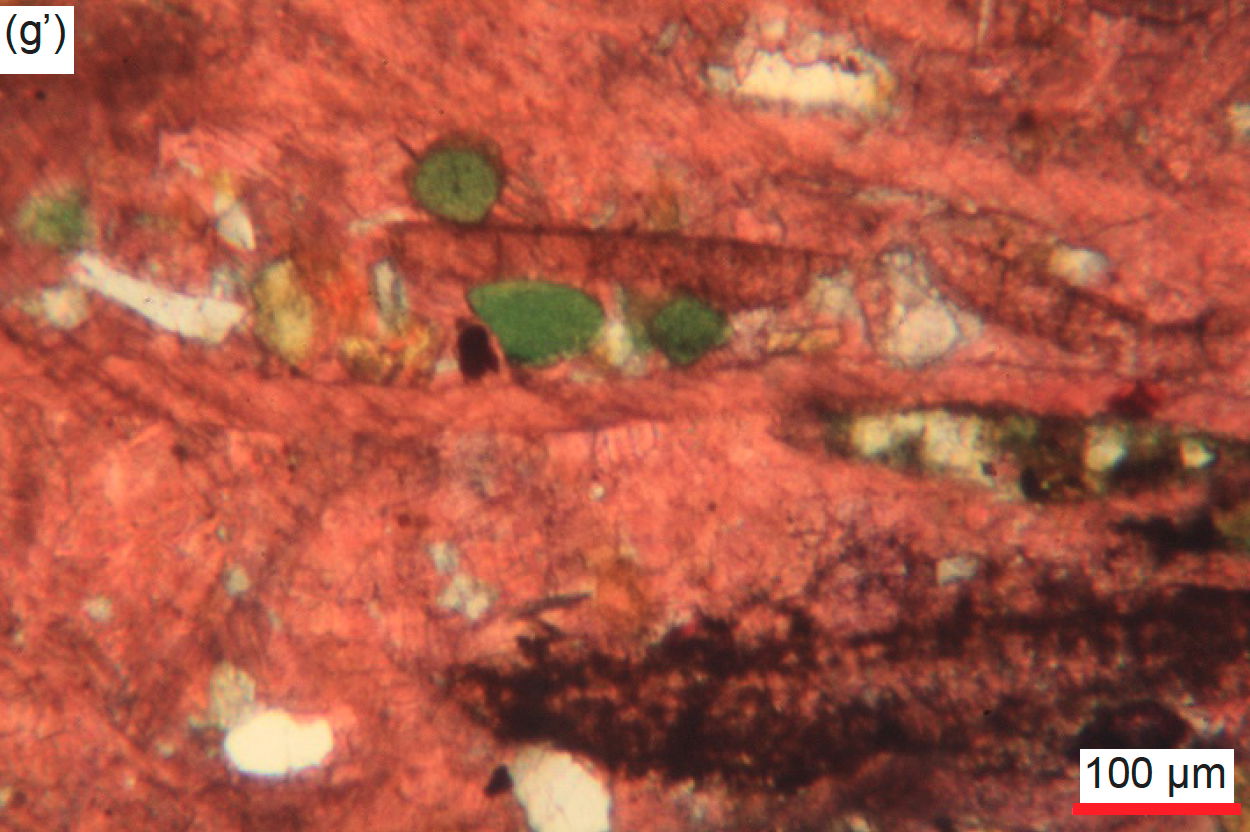
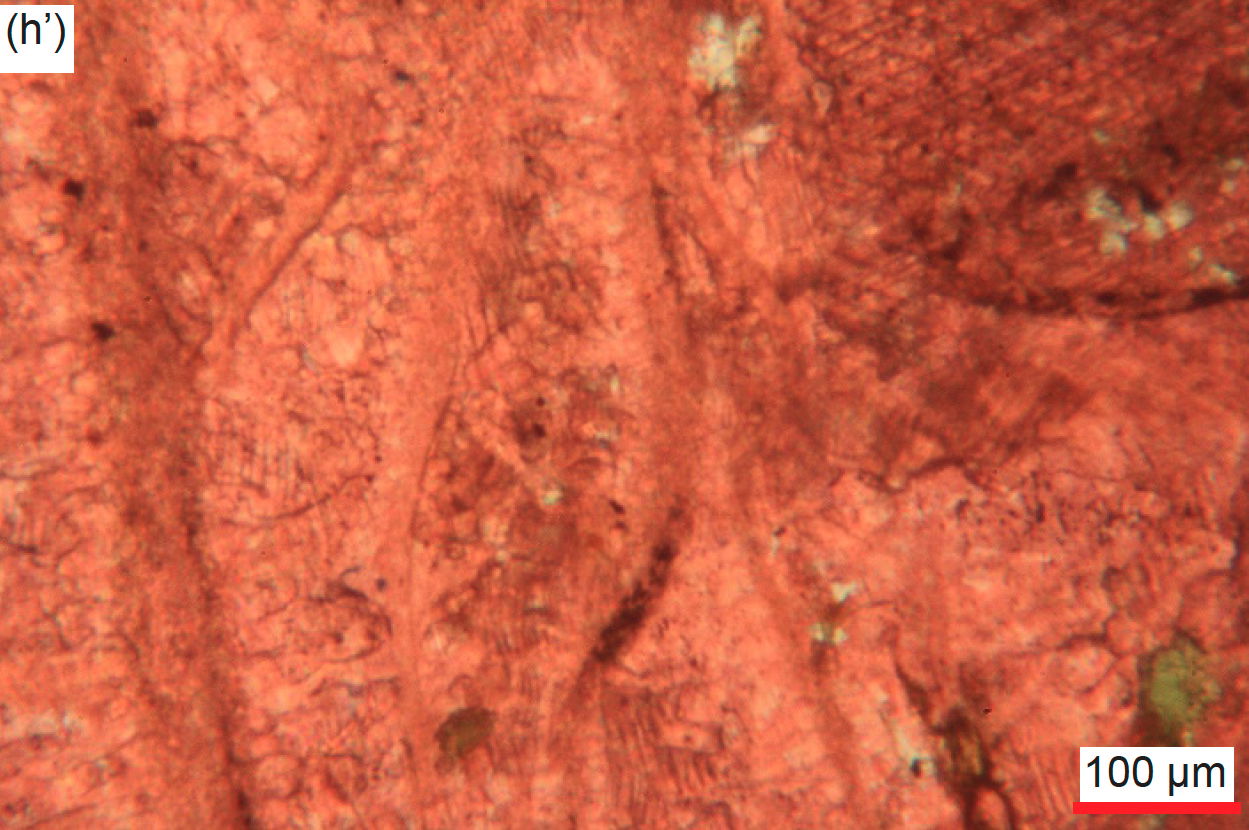
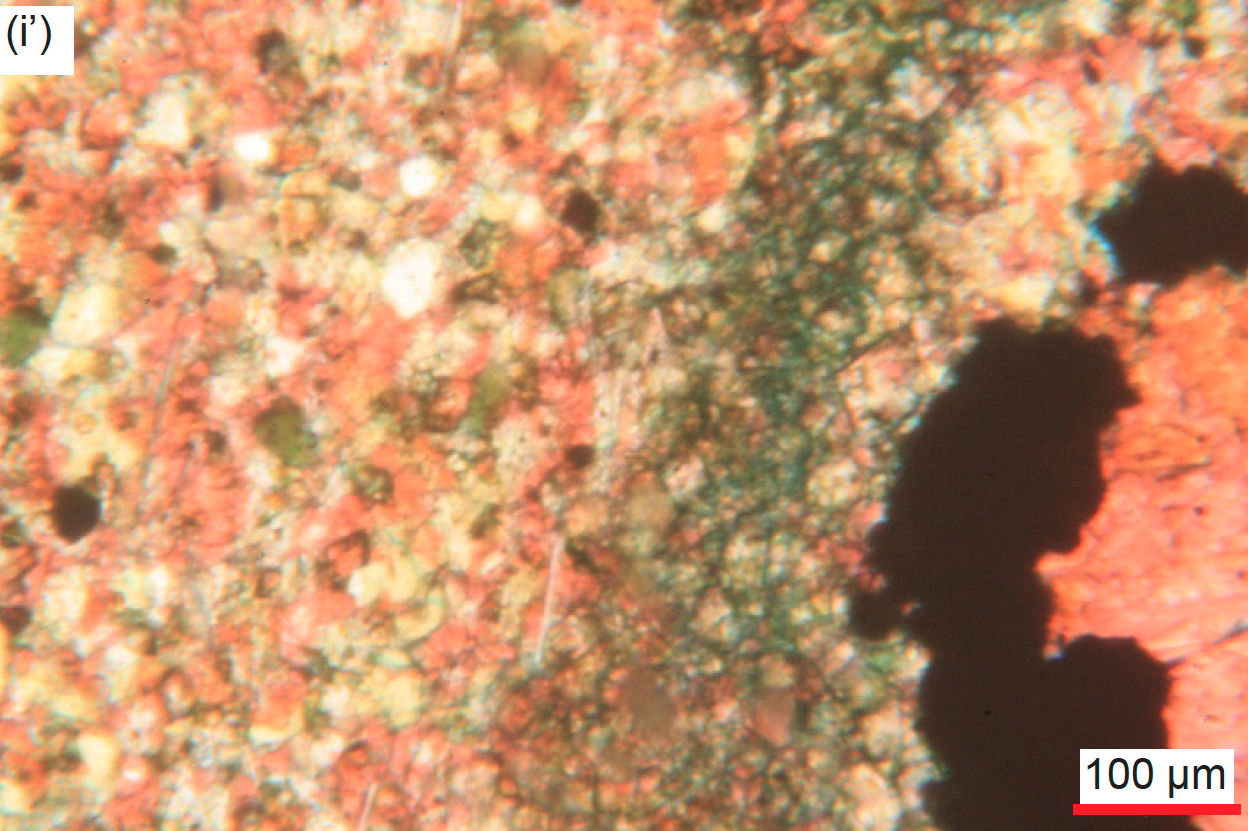
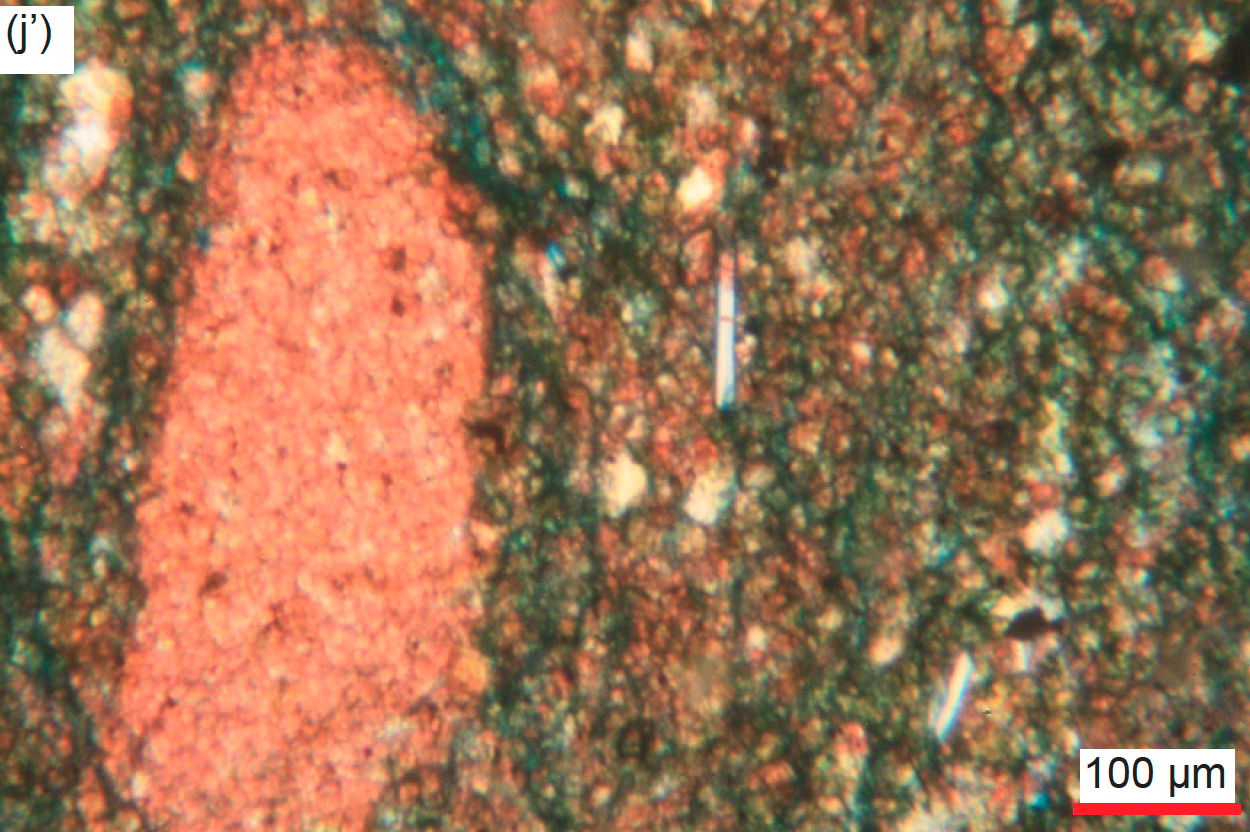
Fig. 33. A representative set of photomicrographs at various scales (as indicated) showing the calcite grains and crystals in the Muav Formation samples. Distal samples: (a), (b) MLS-01, (c), (d) MLS-02, and (e), (f) MLS-03. Matkatamiba fold samples: (g) – (i) MFML-01, (j) – (l) MFML-02, (m), (n) MFML-03, (o) – (q) MFML-04, (r), (s) MFML-05, (t), (u) MFML-06, (v) – (x) MFTB-01, (y) – (a’) MFTB-02, (b’), (c’) MFTB-03, (d’) – (f’) MFTB-04, (g’), (h’) MFTB-05, and (i’), (j’) MFTB-06.
Several medium and large recrystallized calcite crystals appear to be sub-angular to sub-rounded clasts that are surrounded by a matrix consisting of small and very small calcite crystals (some of which also look like clasts) with detrital K-feldspar and quartz grains included. Similarly, two larger rounded and ovoid patches of calcite matrix, one spattered heavily with iron oxides and both consisting of recrystallized calcite, are outlined by heavy iron-oxides-staining and also appear to be like “pellets” or rounded clasts. This potentially suggests that some of the detrital calcite may have been derived from the erosive destruction of precursor limestones within the source rocks.
Dolomite is present in all but one of the fifteen samples (fig. 34), usually subordinate to calcite varying from 1.5% to 31.1%, but in one sample dolomite predominates at 81.9% (table 2). The dolomite grains are often easy to identify because they frequently occur as internally clean rhomboidal crystals, though some of the larger crystals have characteristic internal “skeletal” growth zones marked by iron oxides, with heavily iron-oxides-stained cores and “clean” outer rims, likely the result of their growth from altering the predominant very-fine-grained calcite (micrite) matrix in which they are solidly wedged in continuum with it. The subordinate scattered sub-angular to rounded dolomite grains and fragments, and rhombs in most samples range in size from tiny to medium-large. They are usually randomly distributed in the calcite matrix which they are replacing, though in places they are clumped together separately with tiny patches of the calcite matrix between them. Some sub-euhedral to irregular patches of recrystallized dolomite have detrital quartz and K-feldspar grains embedded in them, while some very small to small, irregular sub-round calcite grains, some of which look like framboids or “rosettes” and have their perimeters surrounded by dolomite suggesting dolomite replacement of calcite. In some places, medium to large clumps of the very small densely-packed dolomite matrix grains have cores with the pink stain indicative of calcite, so this is also evidence that dolomite has replaced calcite. In several samples, some scattered minor tiny to small dolomite grains appear to partially replace similar-sized K-feldspar grains and even some edge-on muscovite flakes.
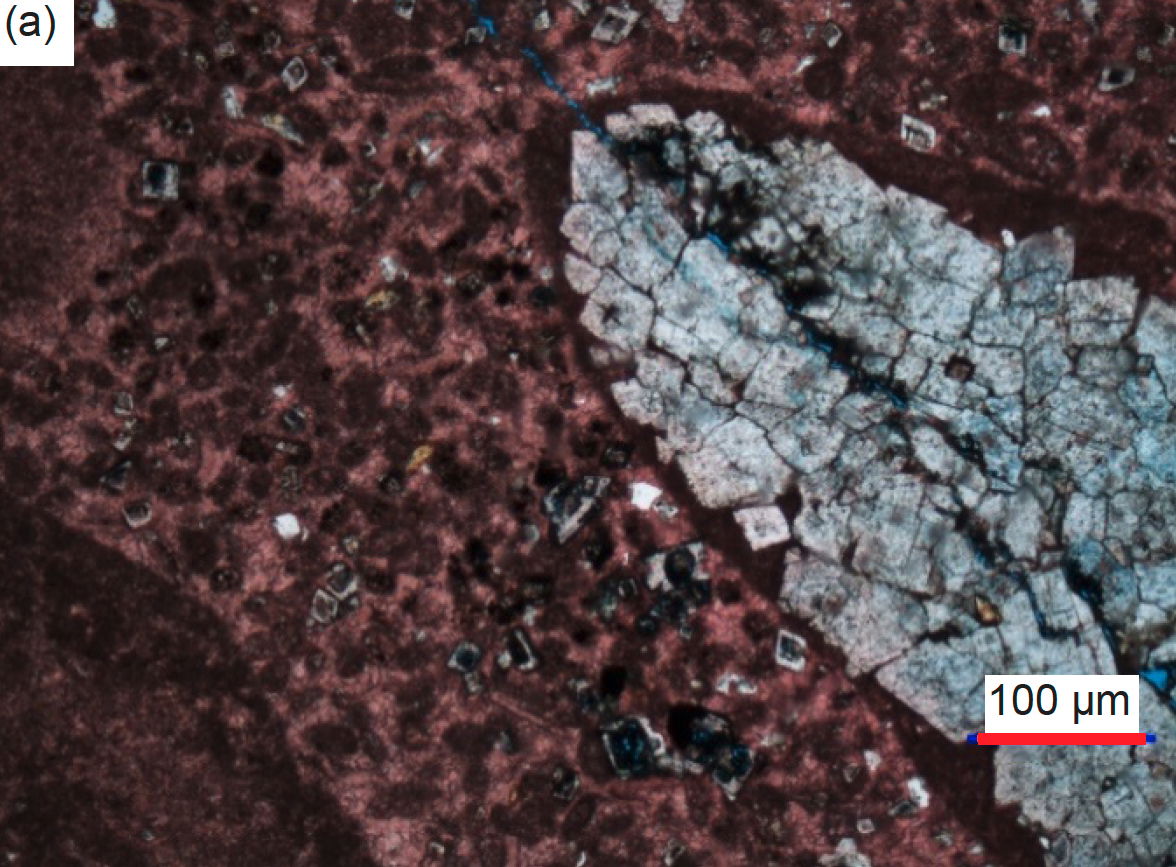
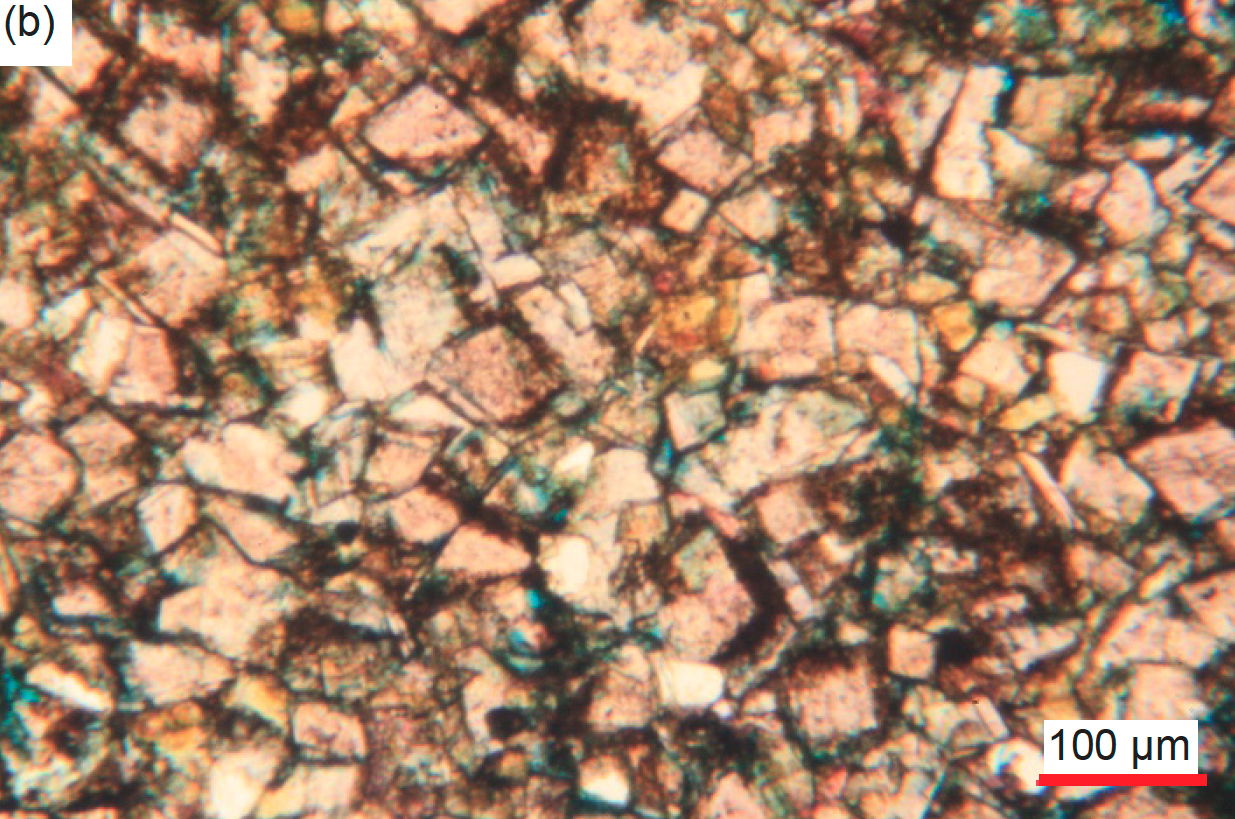
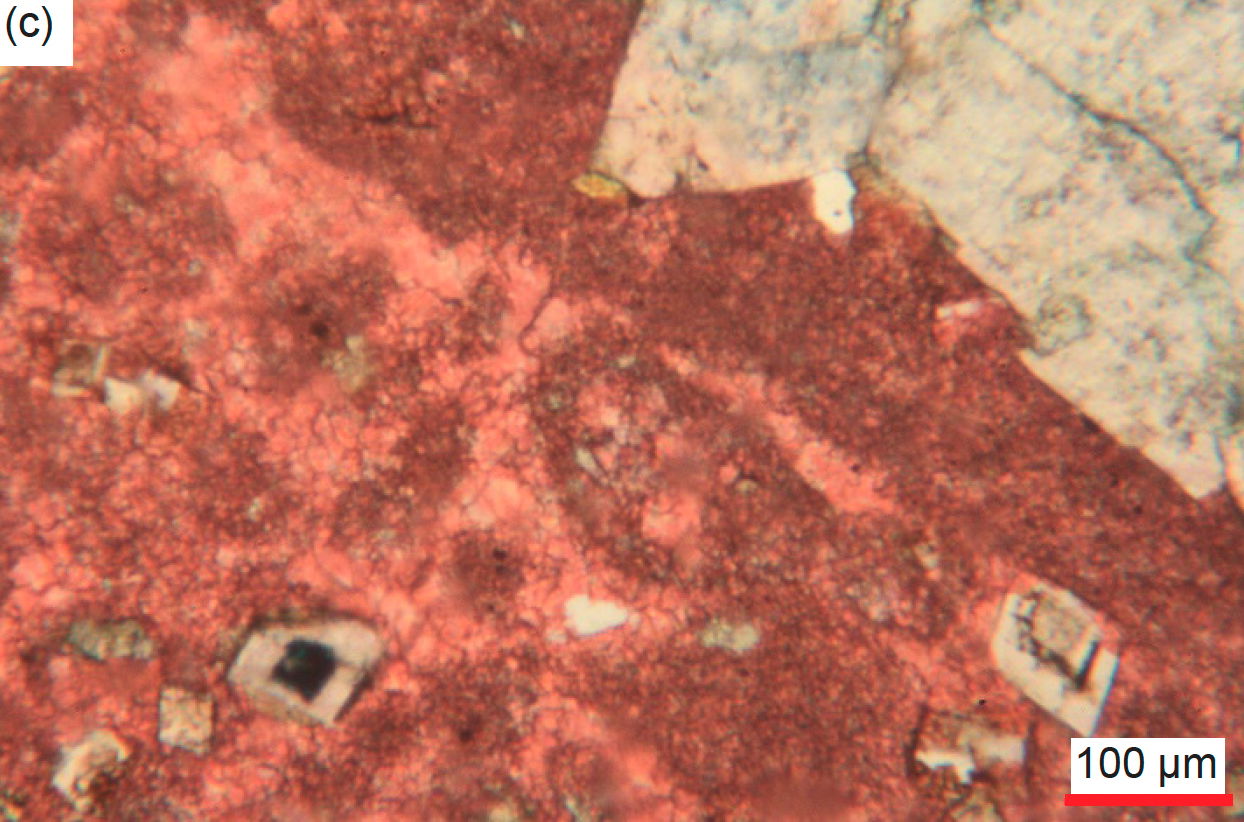
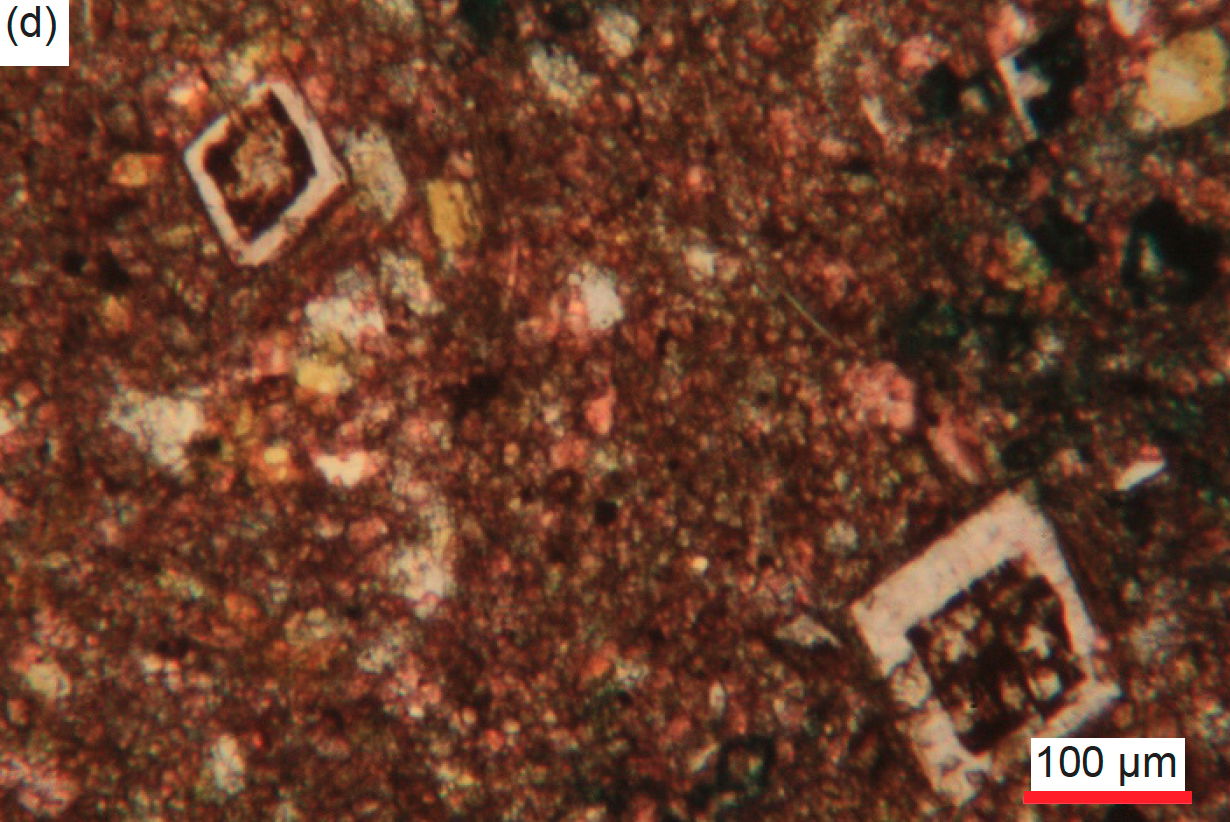
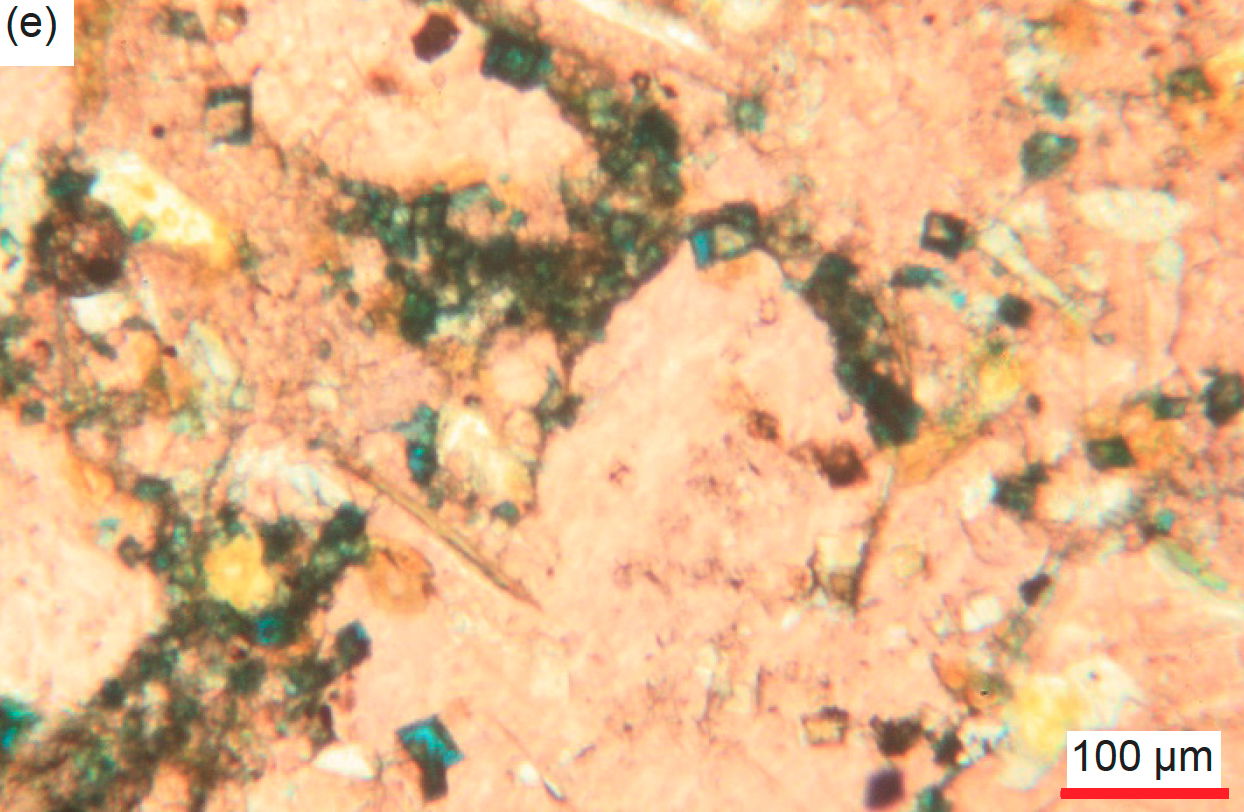
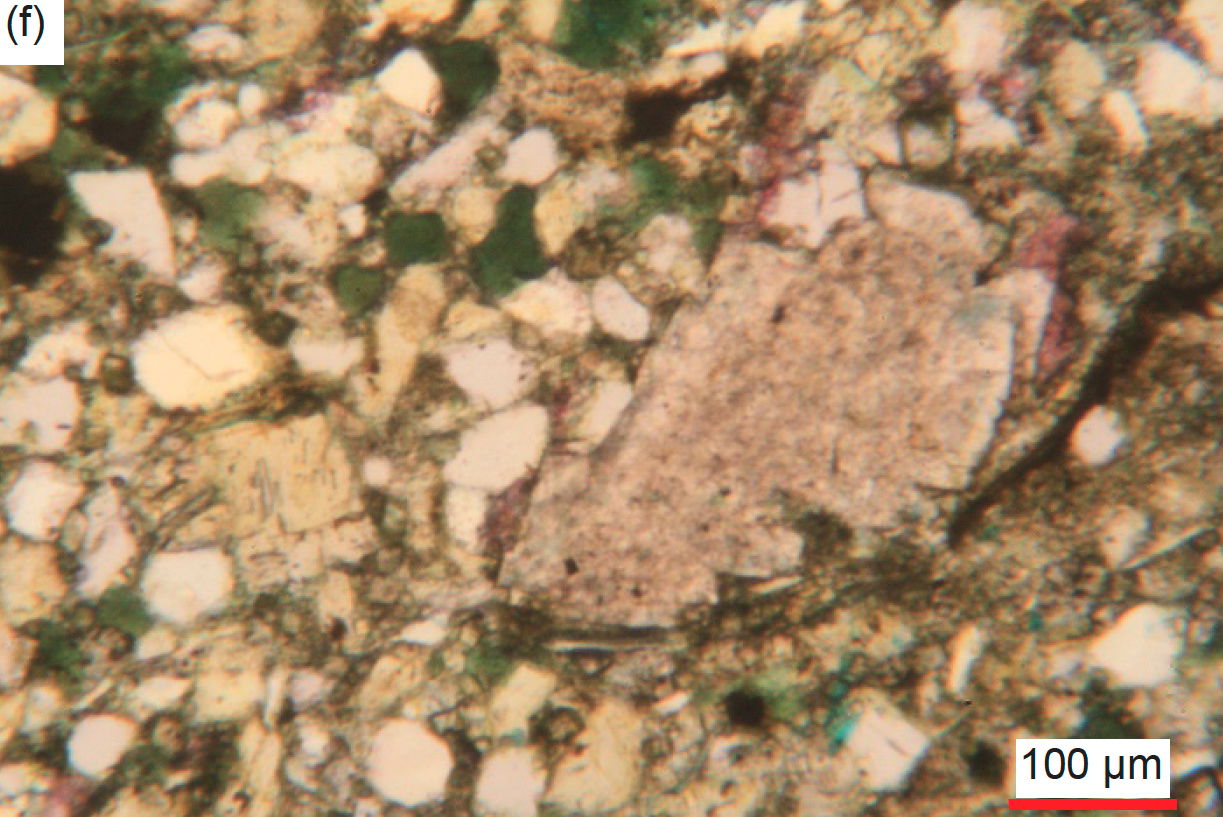
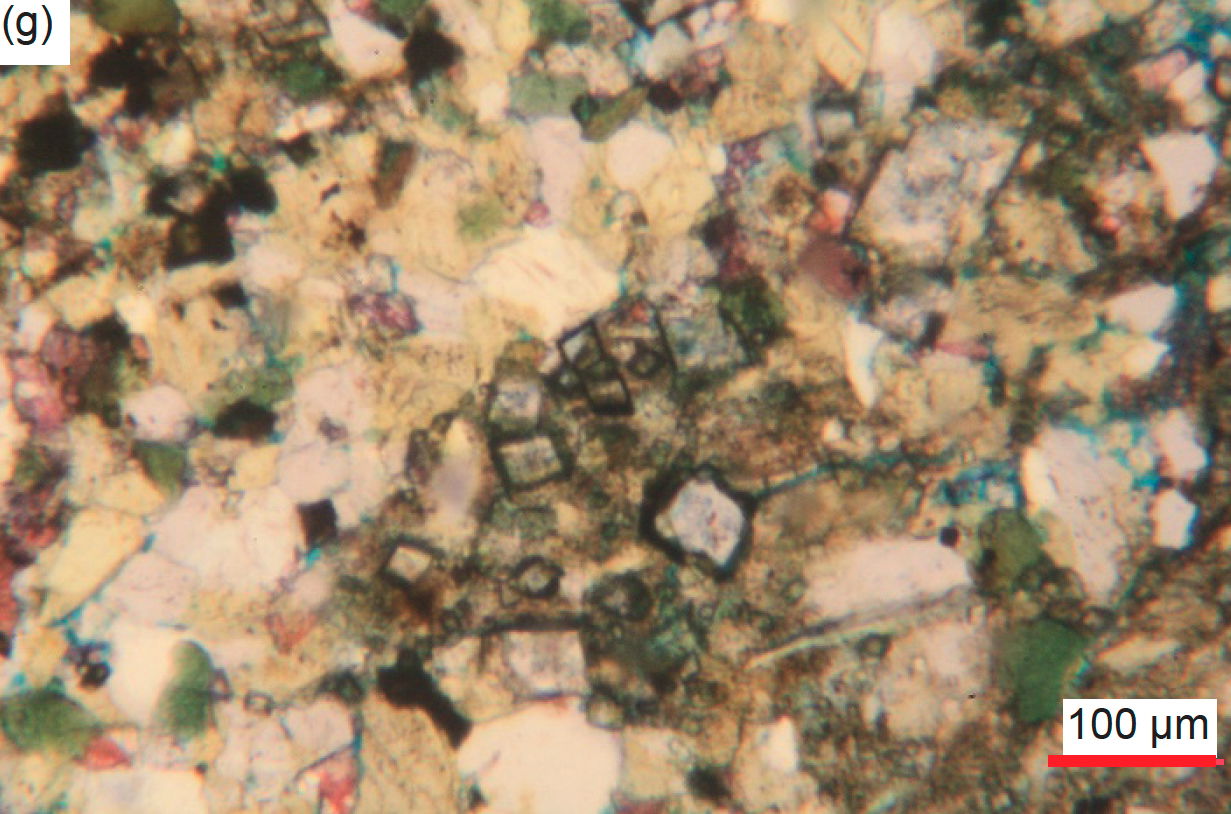
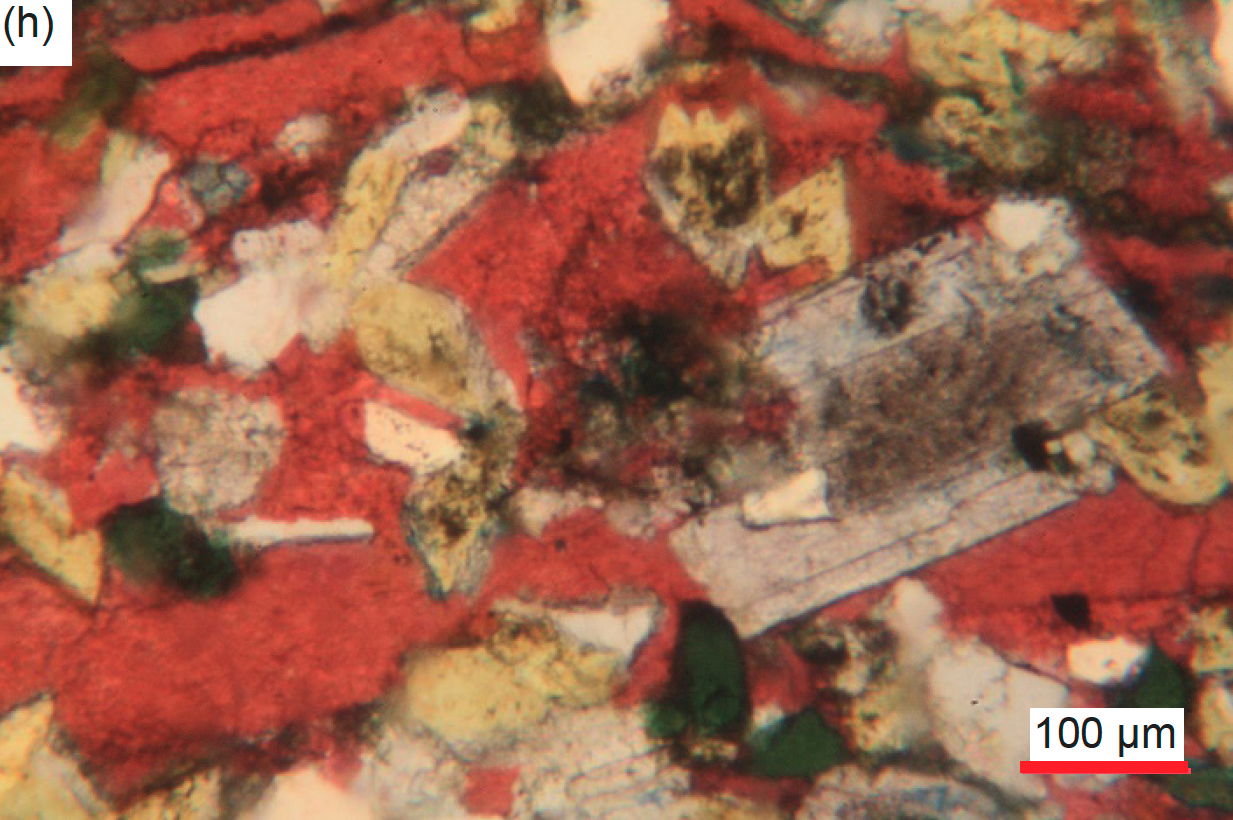

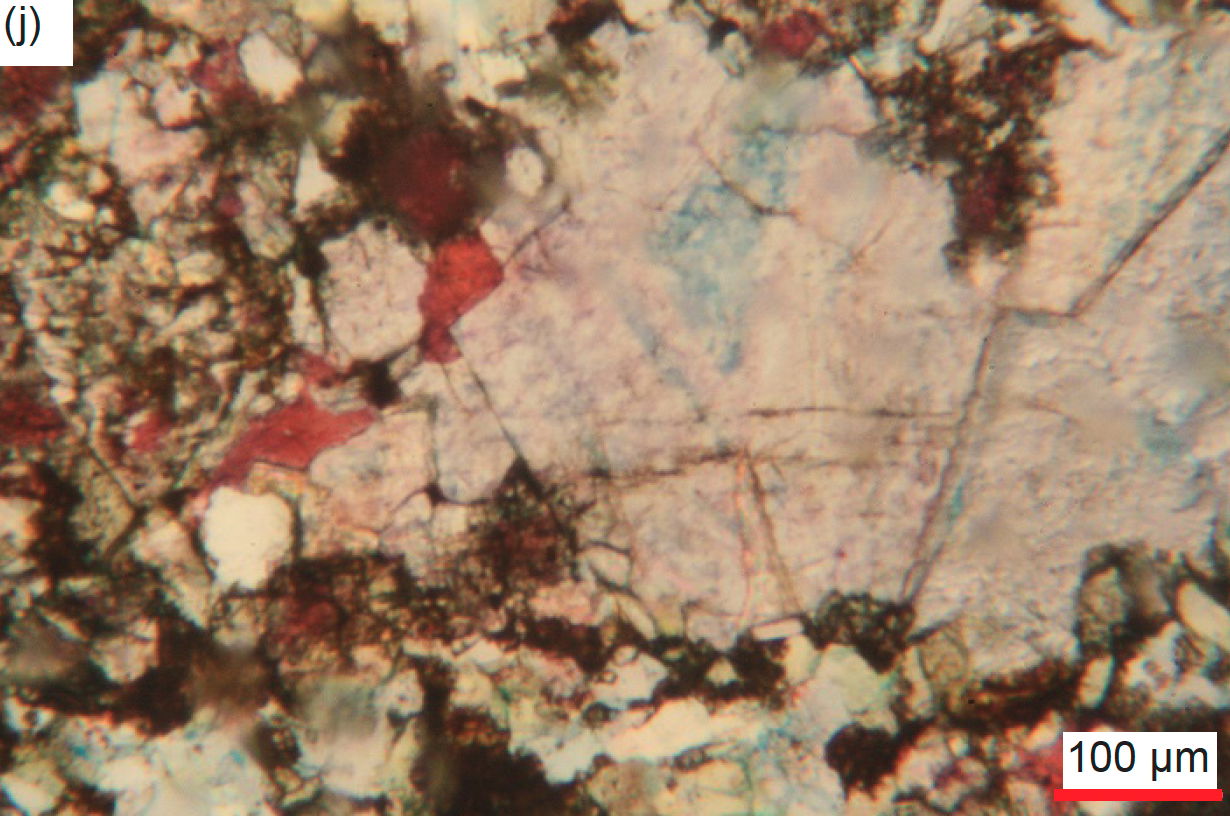
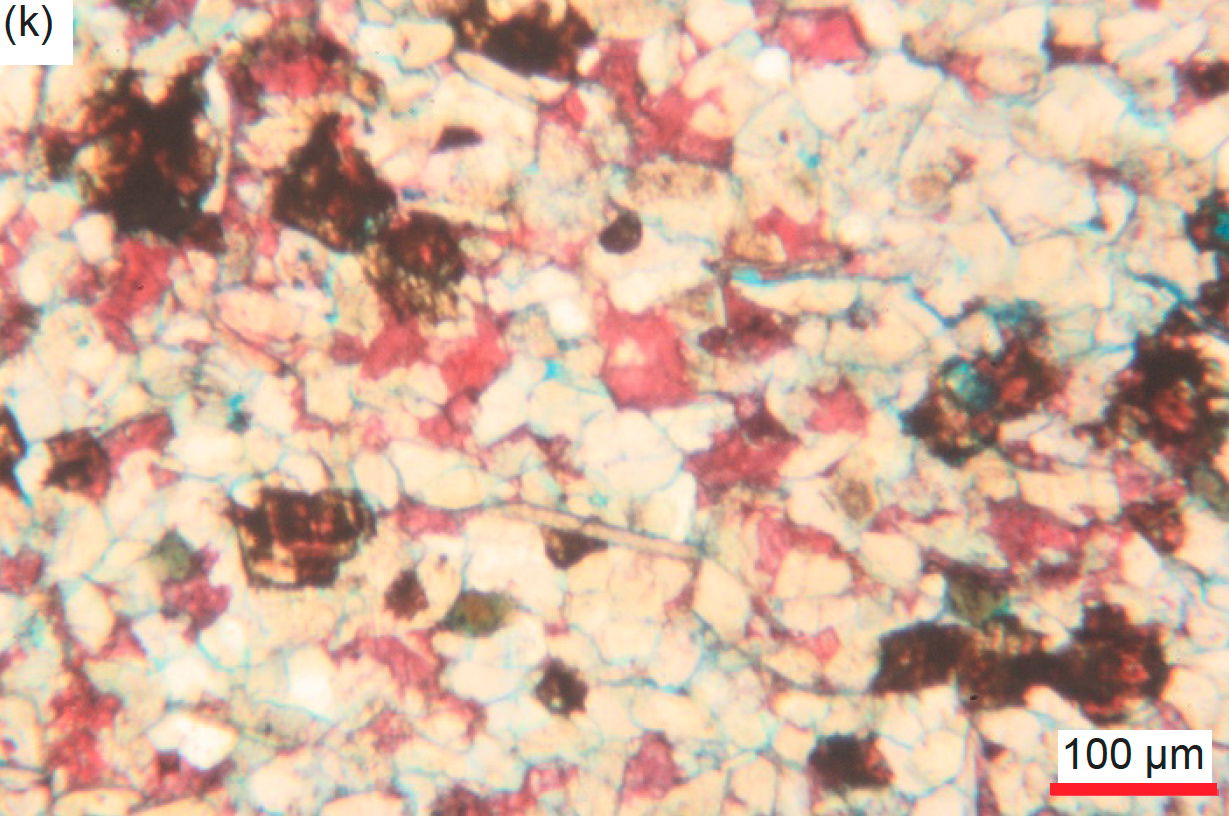
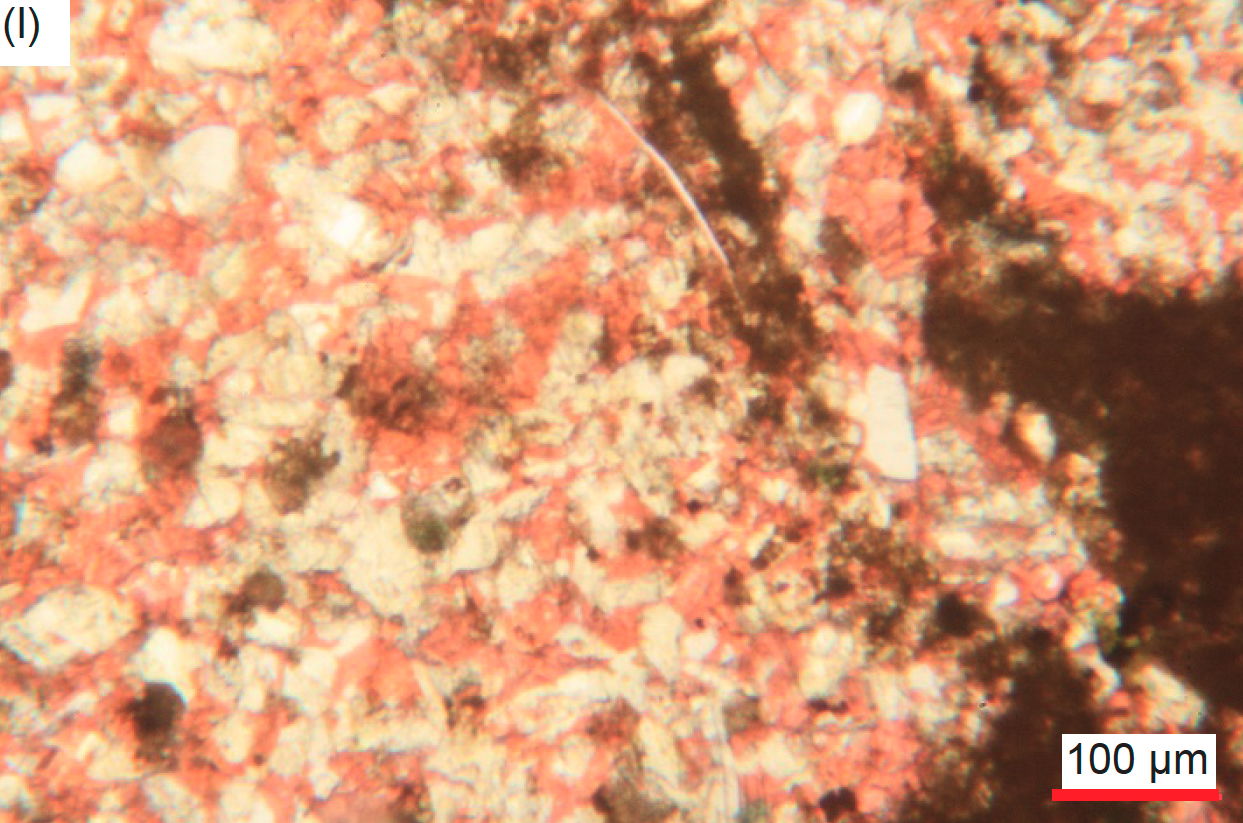
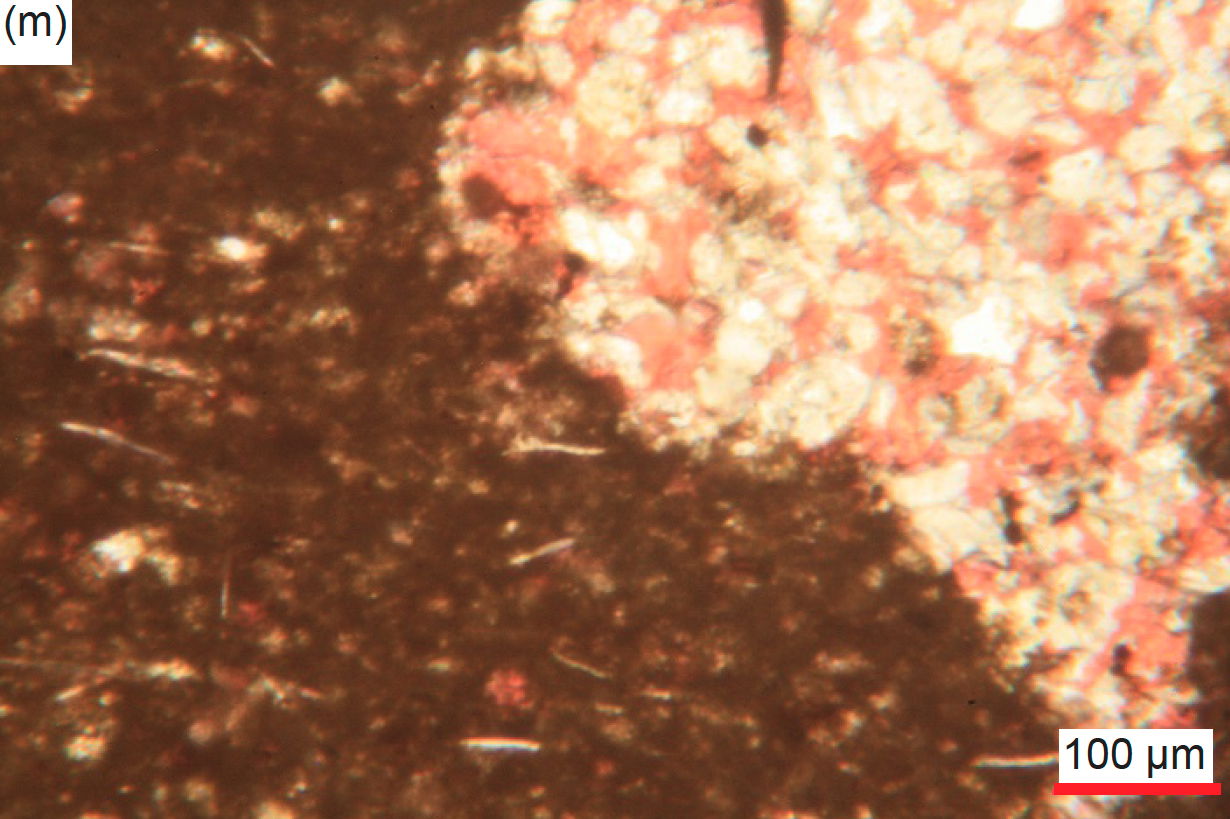
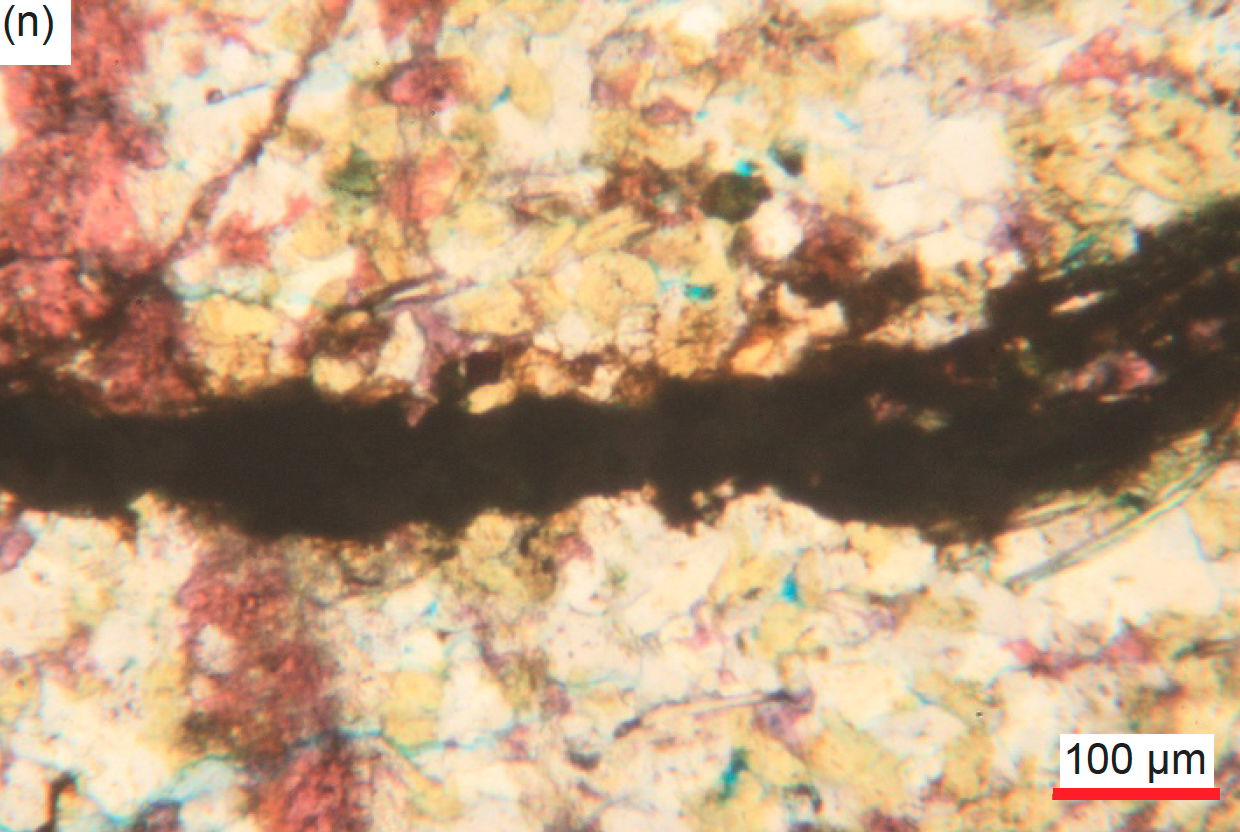
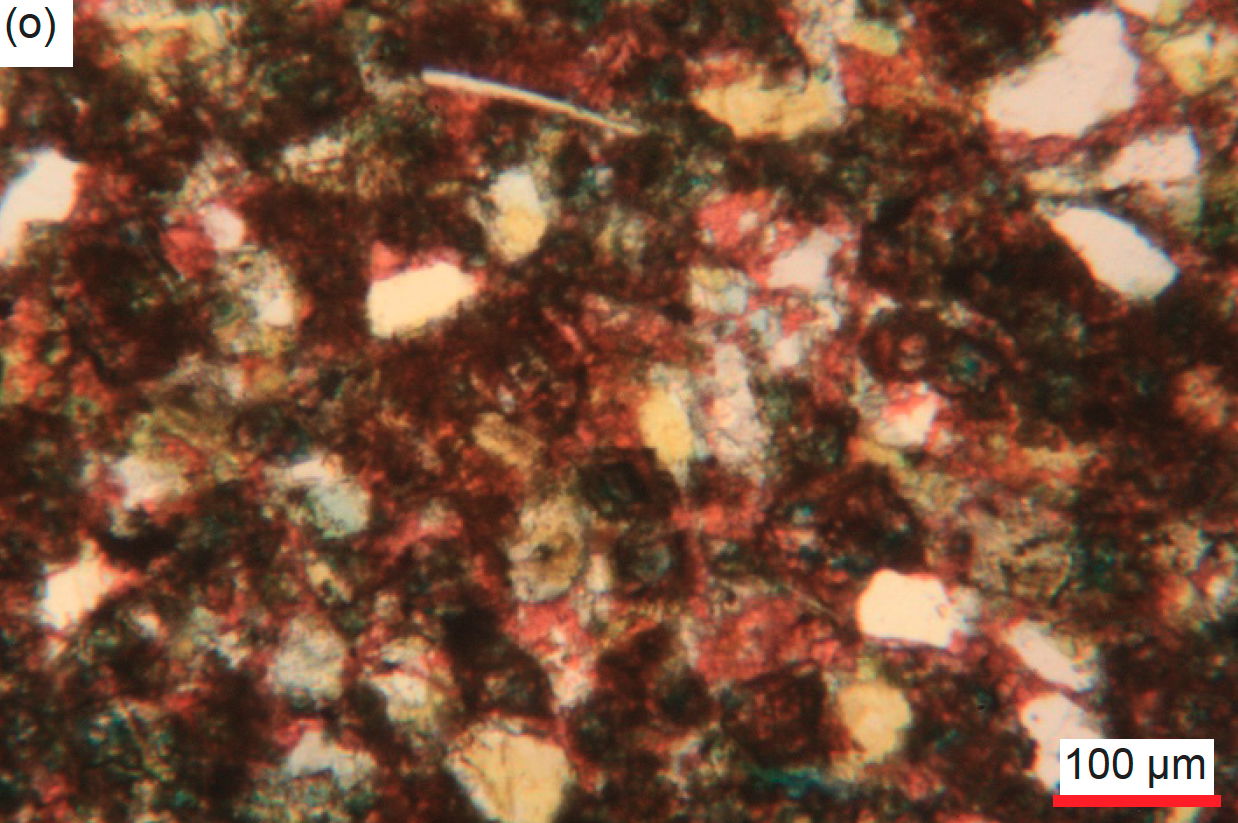
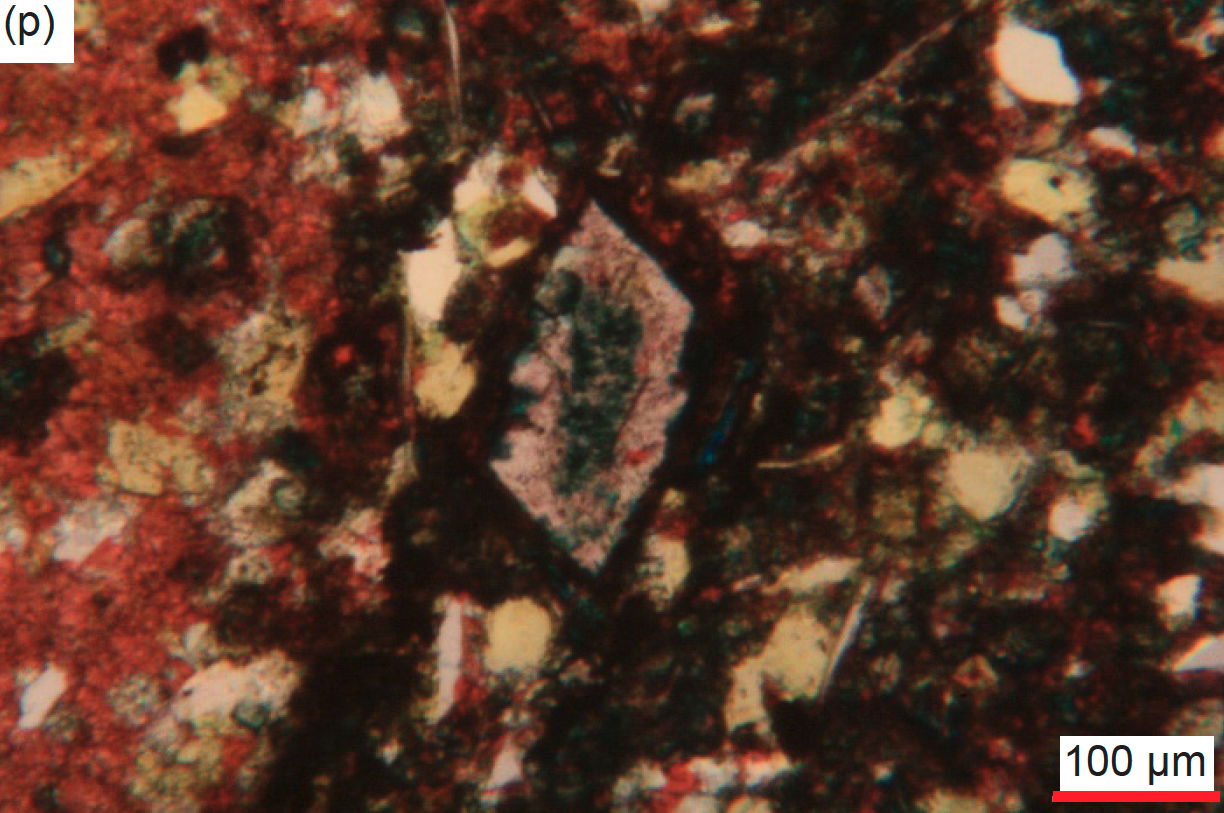
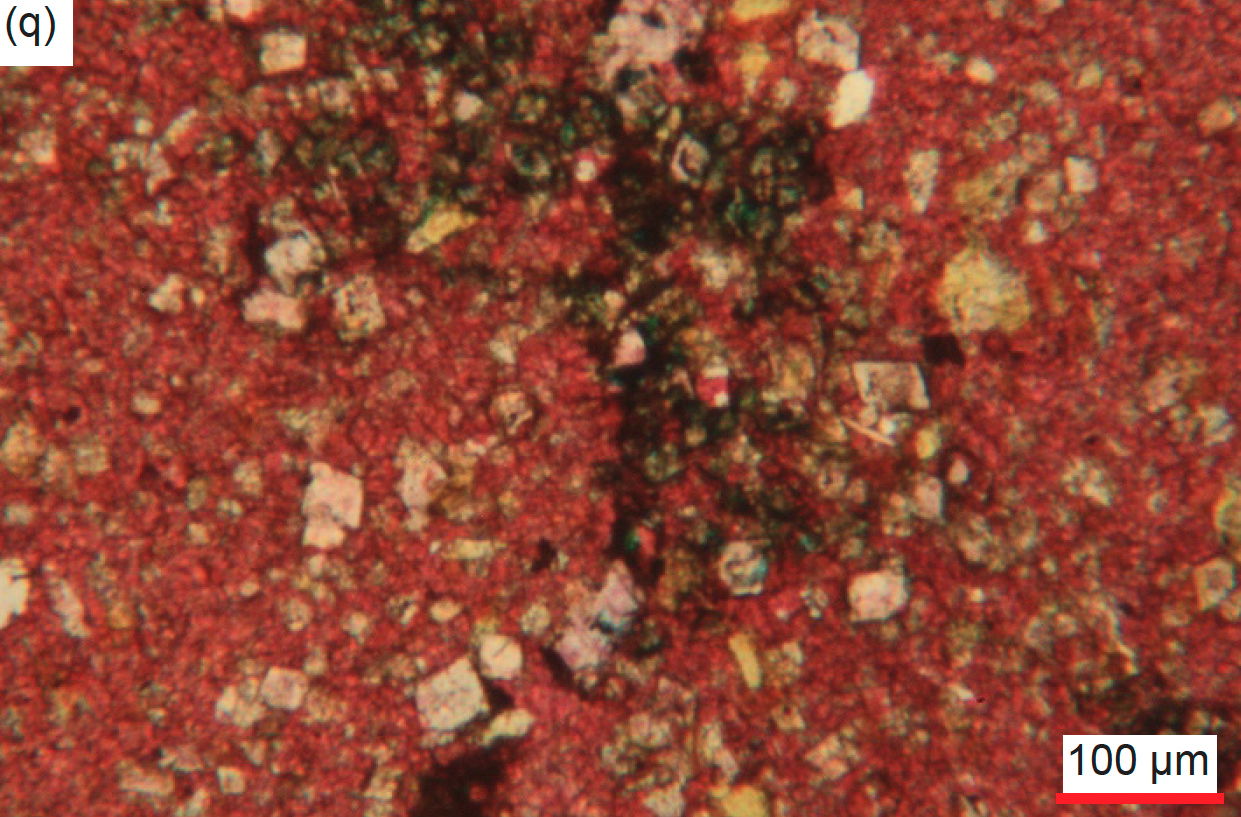
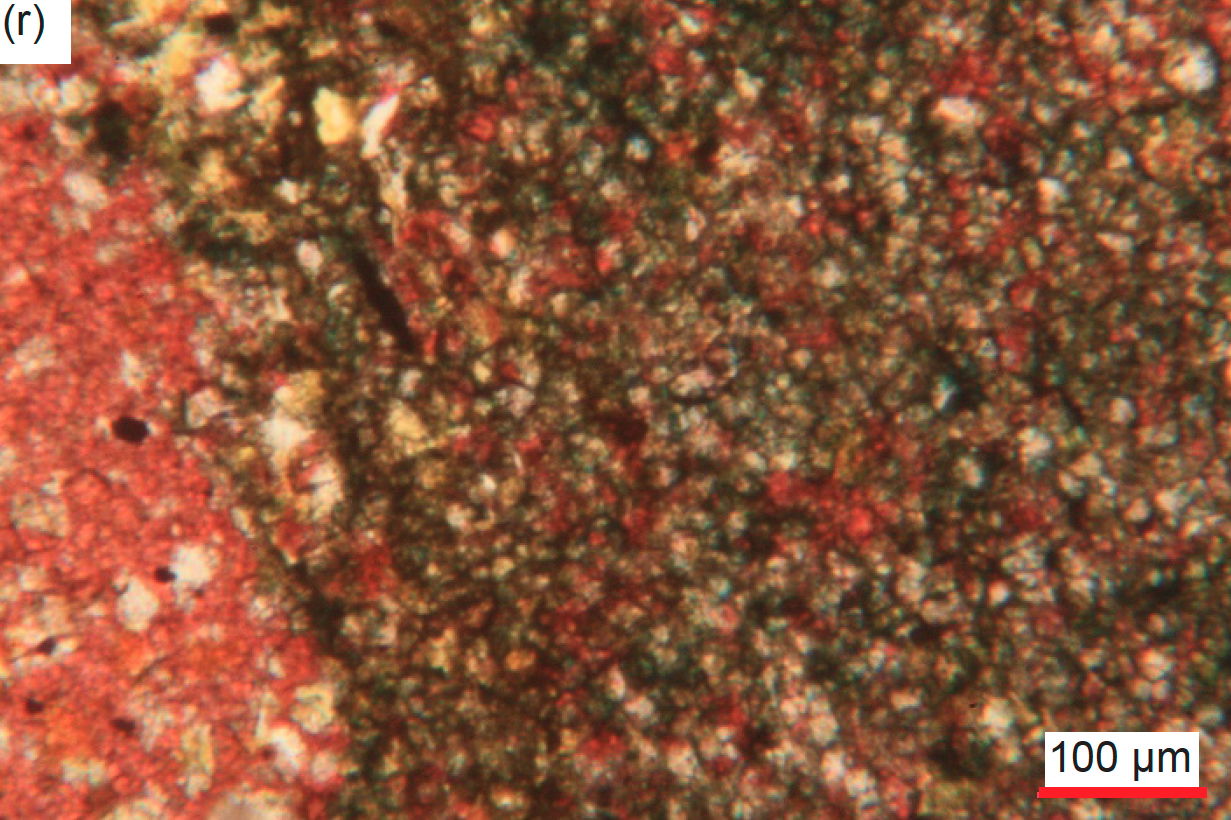
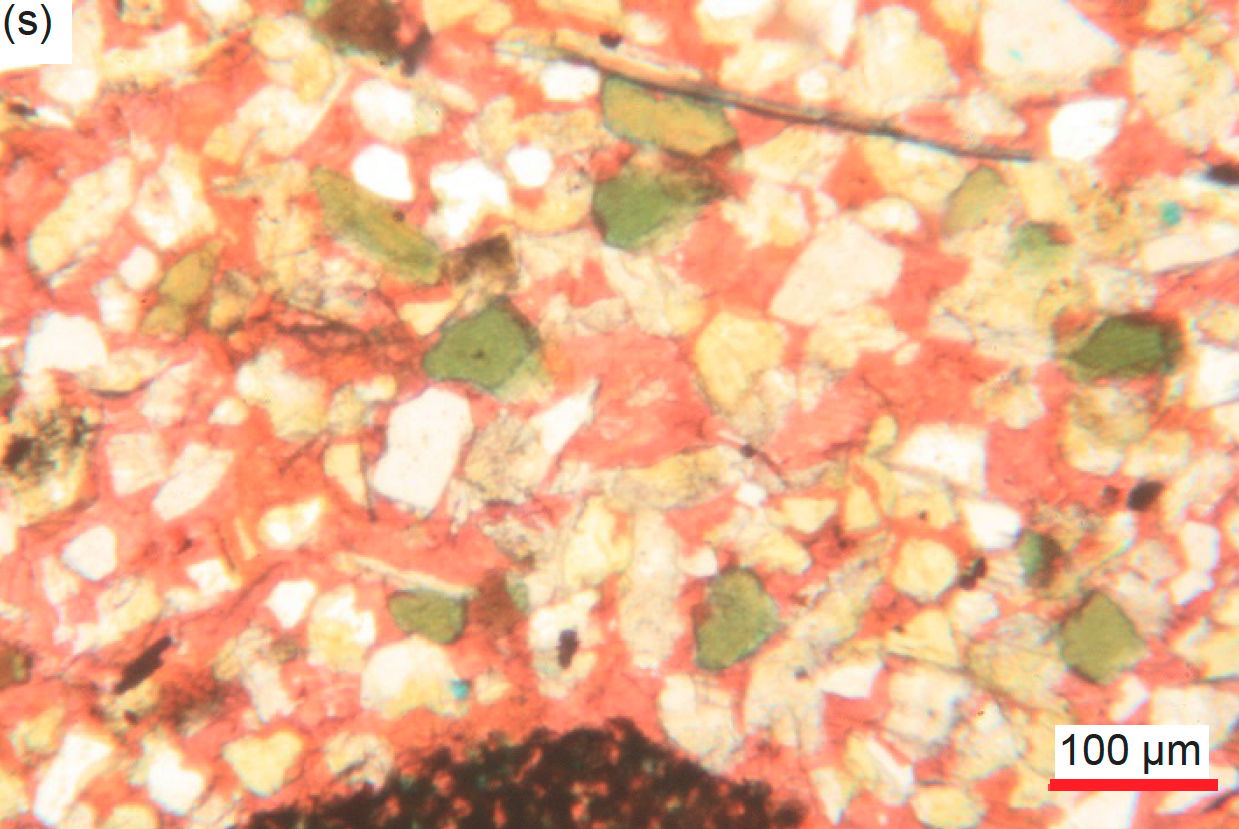
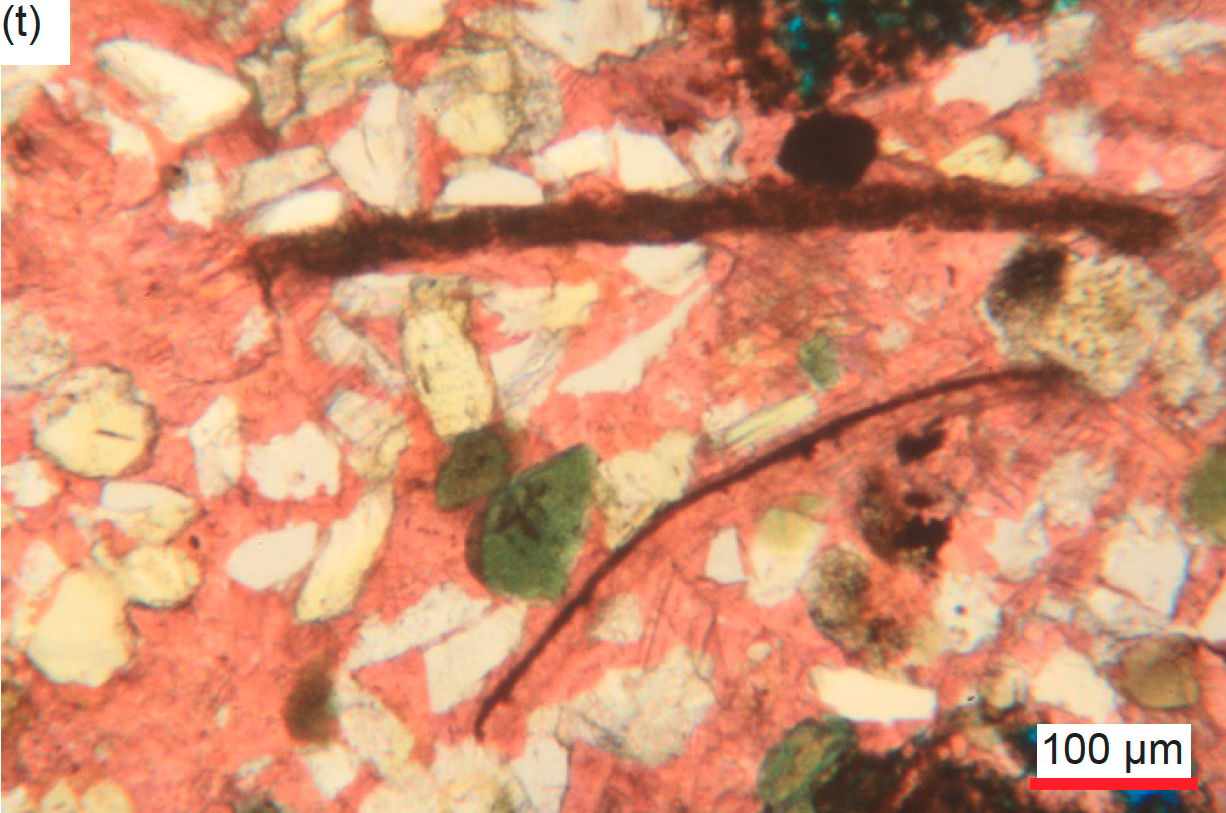
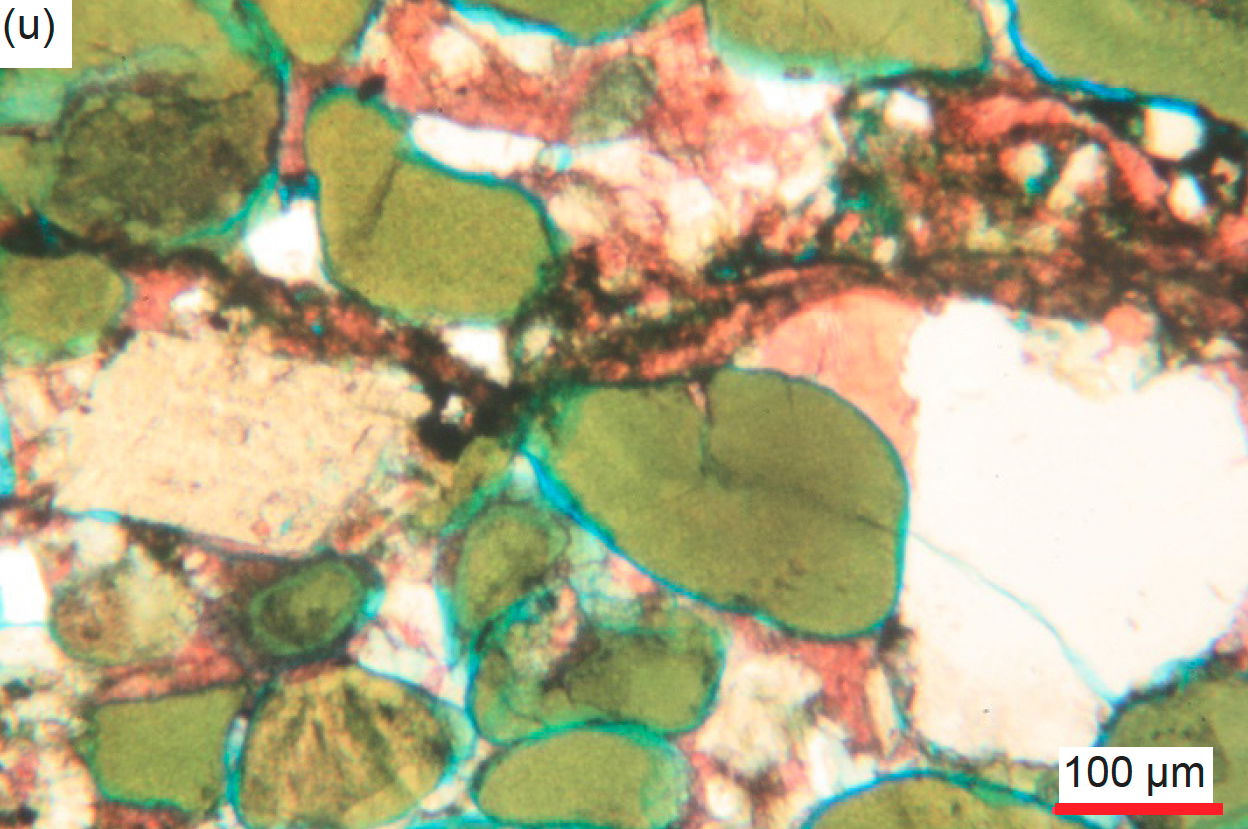
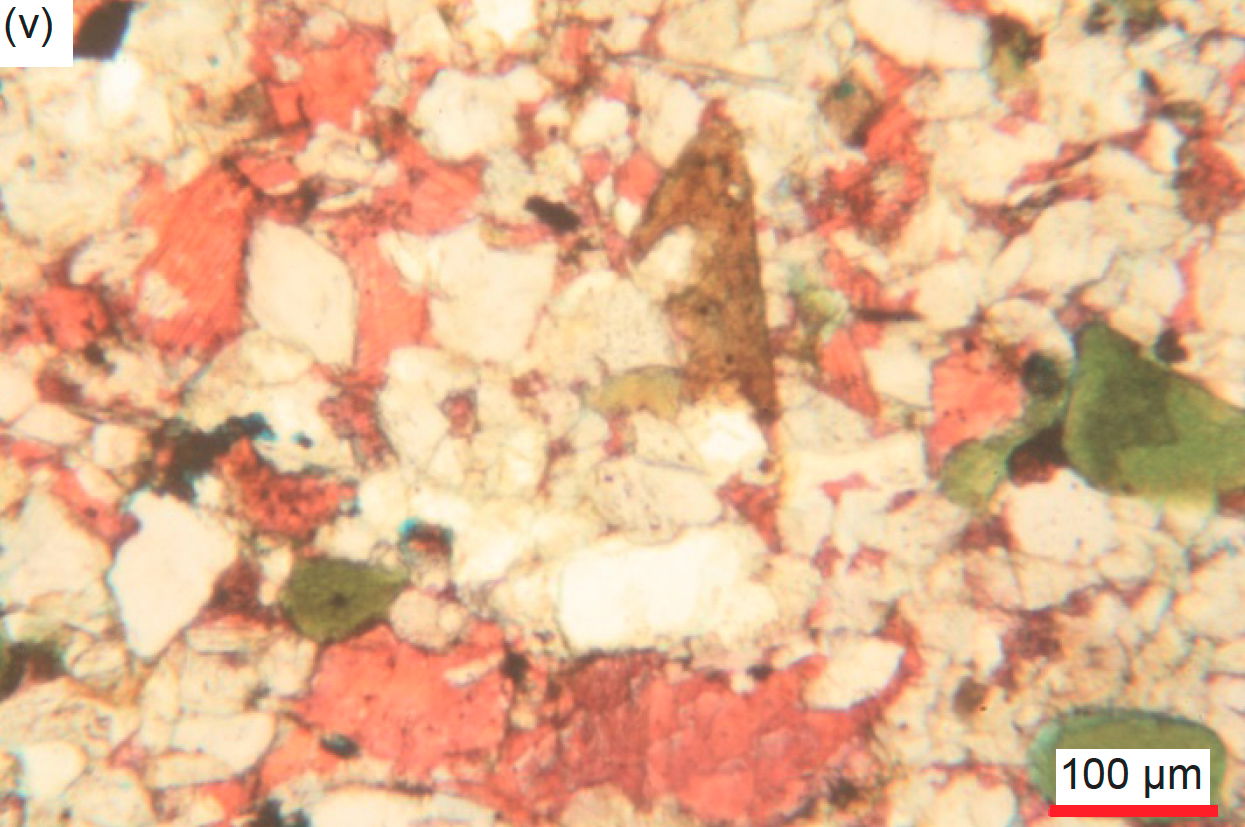
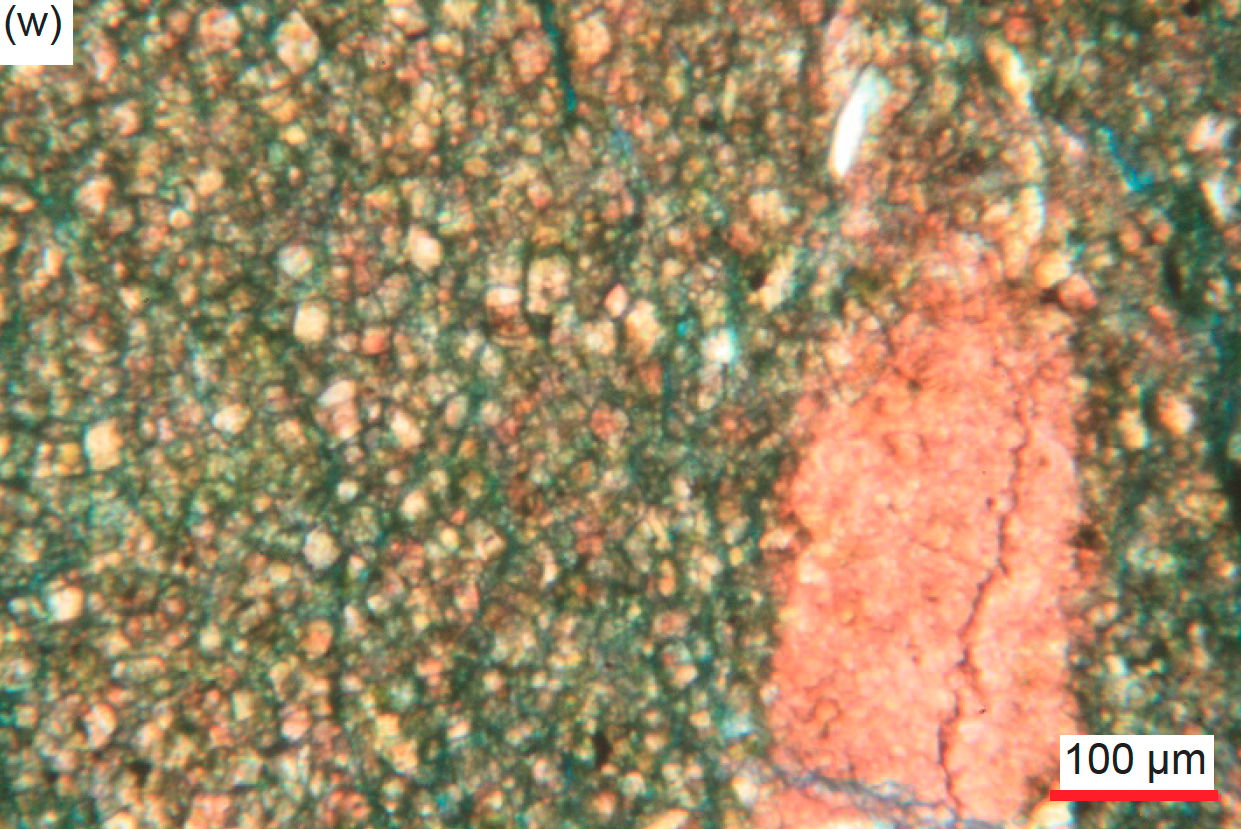
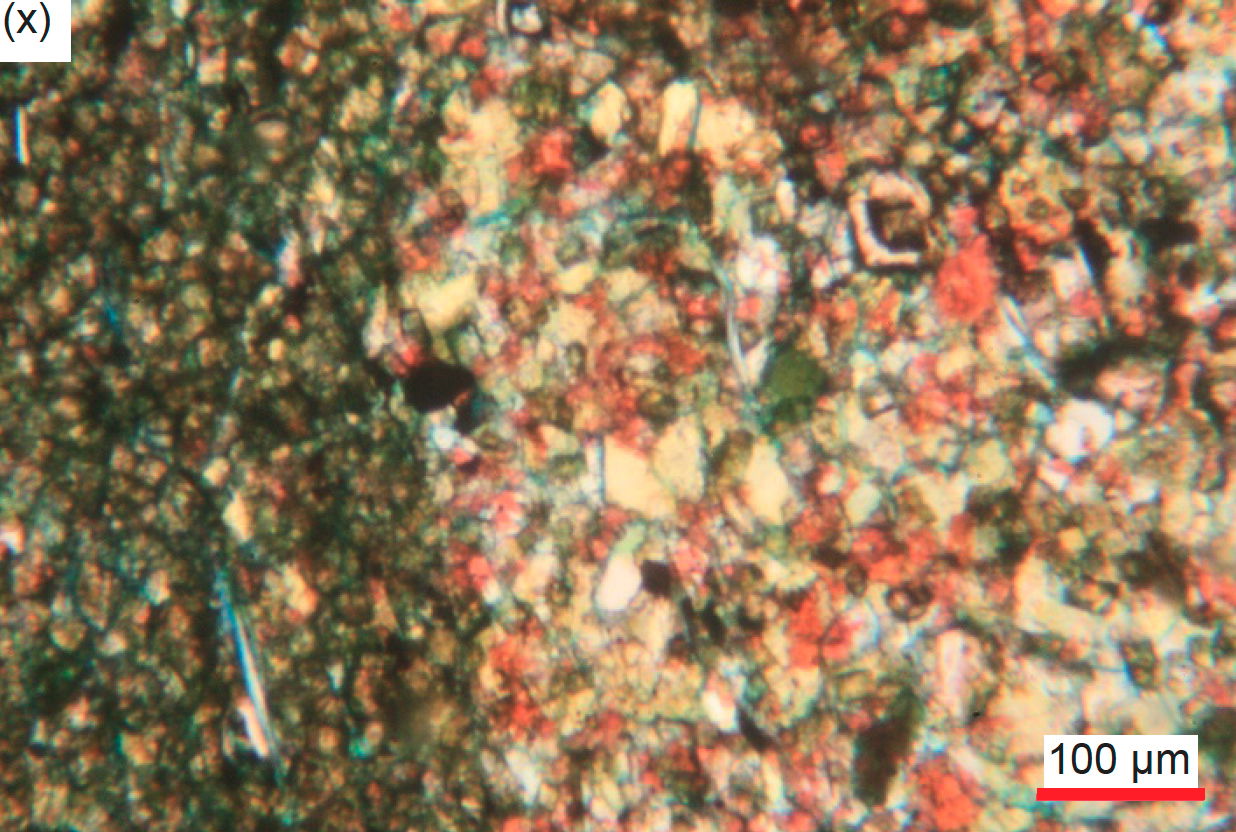
Fig. 34. A representative set of photomicrographs at various scales (as indicated) showing the dolomite grains and crystals in the Muav Formation samples. Distal samples: (a) – (c) MLS-01, (d) MLS-02, and (e) MLS-03. Matkatamiba fold samples: (f) – (h) MFML-01, (i), (j) MFML-02, (k) MFML-03, (l), (m) MFML-04, (n) MFML-05, (o), (p) MFML-06, (q), (r) MFTB-01, (s) MFTB-02, (t) MFTB-03, (u), (v) MFTB-04, and (w), (x) MFTB-06.
All but one of the samples have fractures, which are sometimes filled with veins, irrespective of the samples being from the limb and hinge zones of the Matkatamiba fold or distal to the fold (fig. 35).
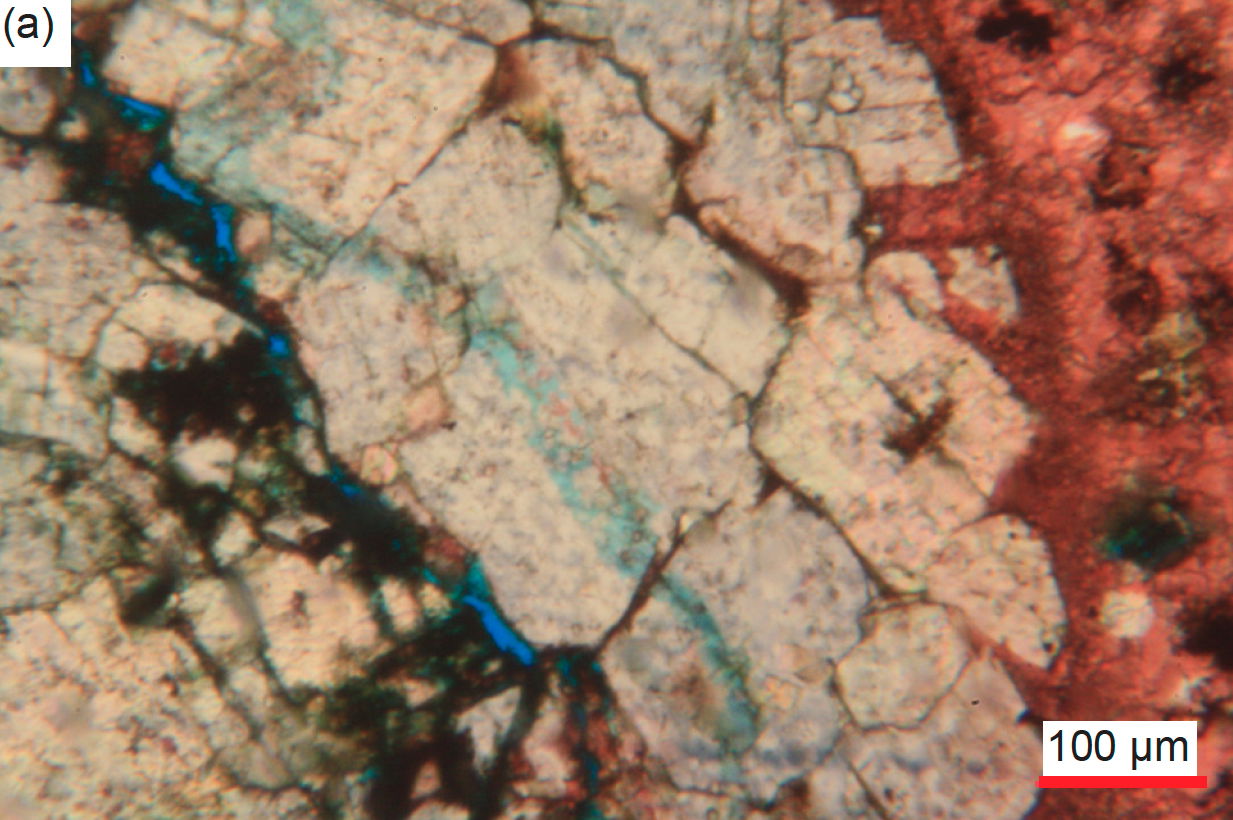
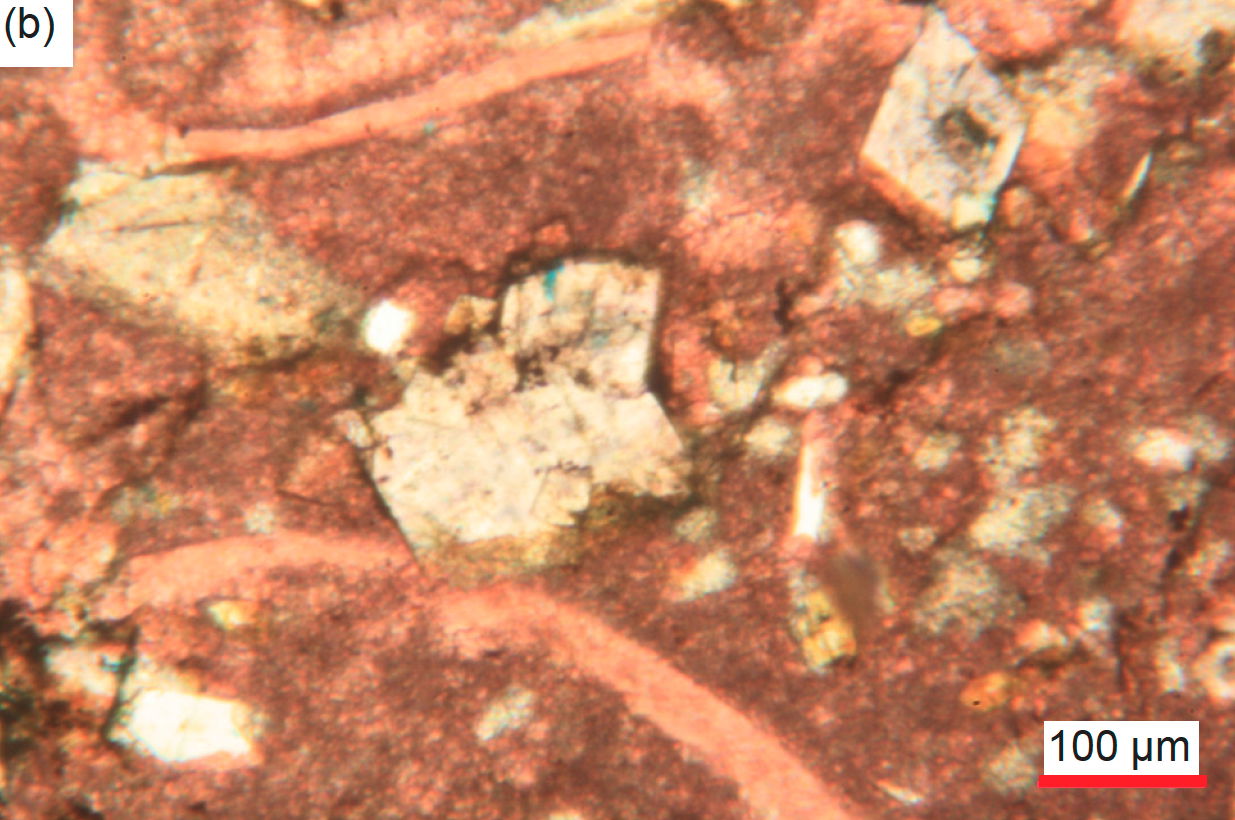
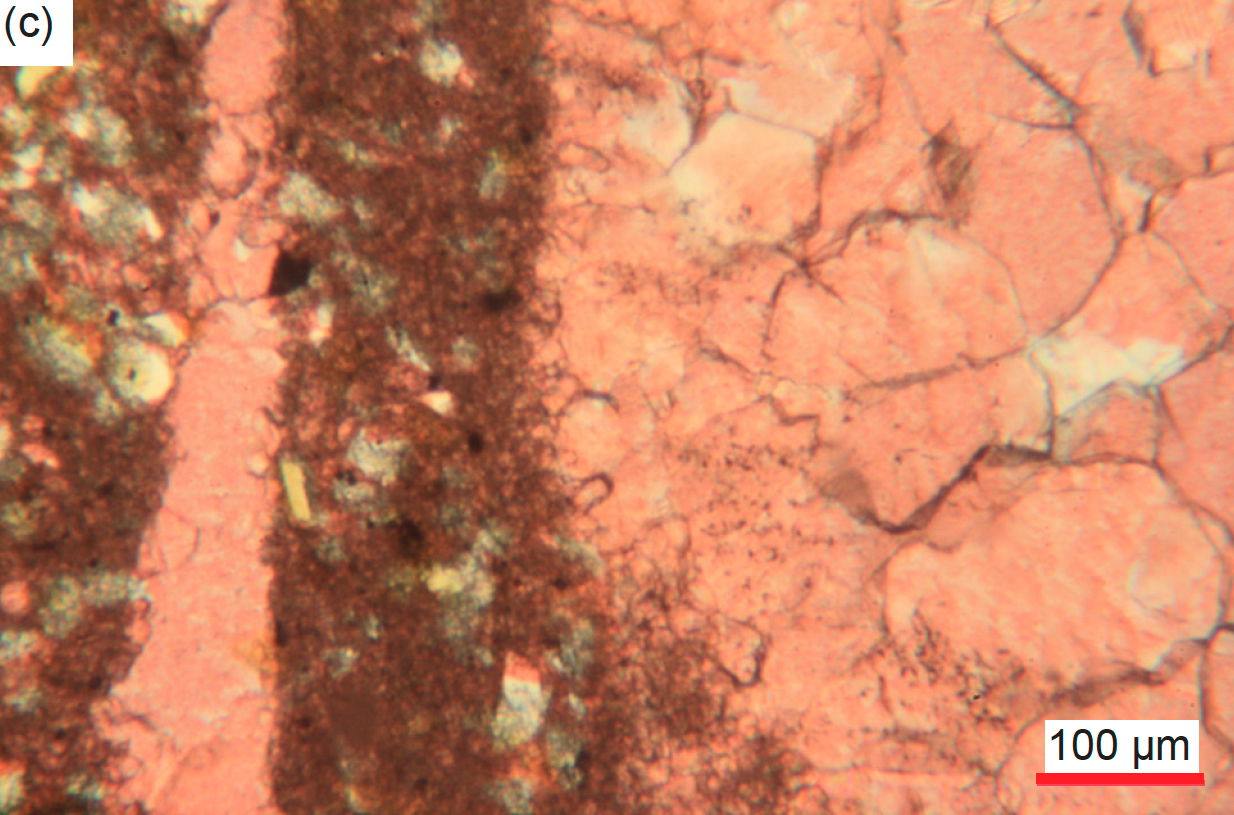
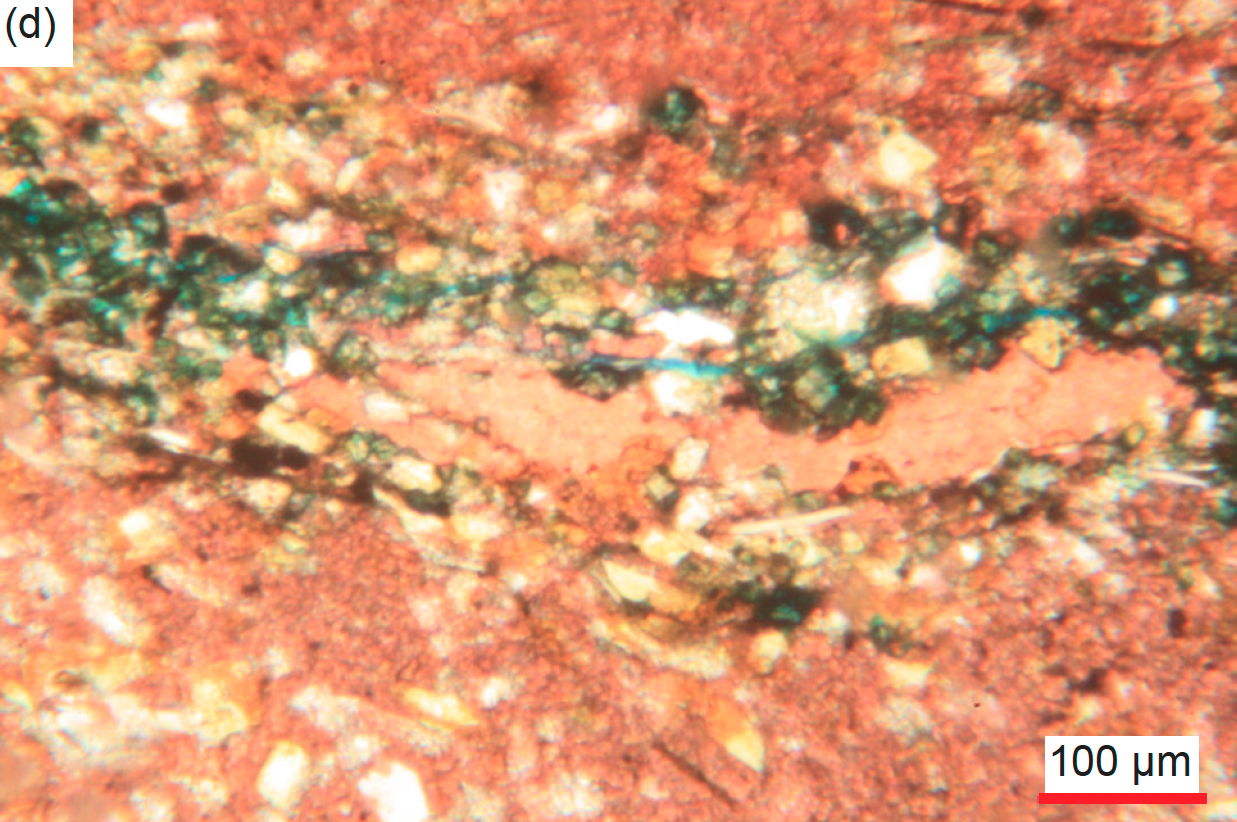
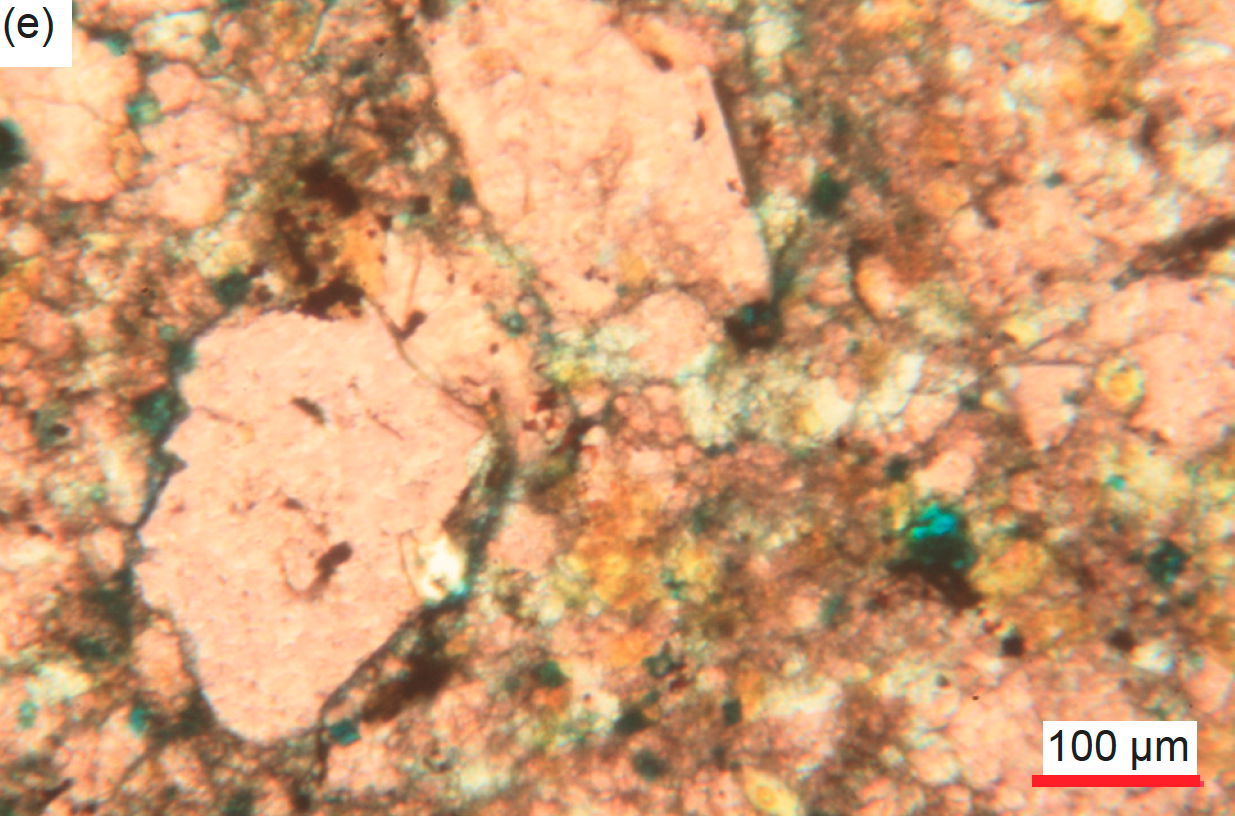
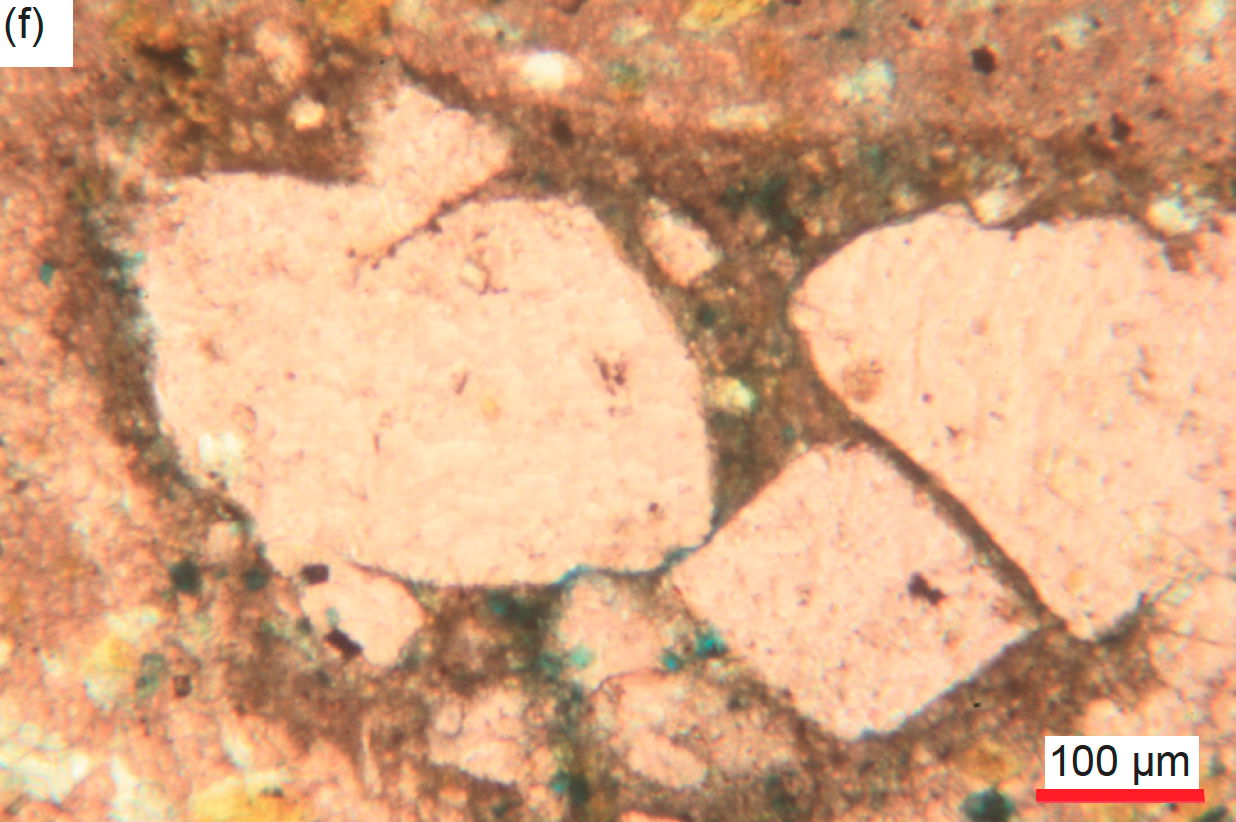
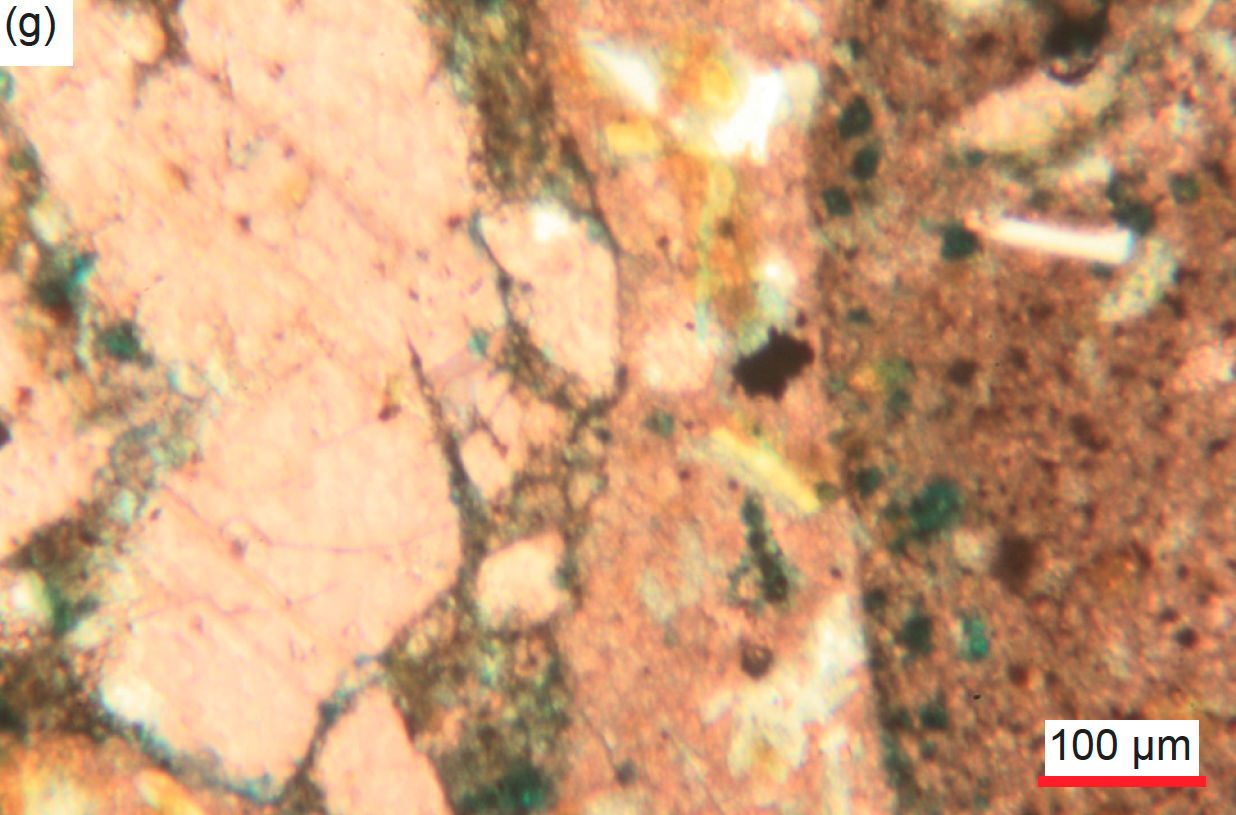
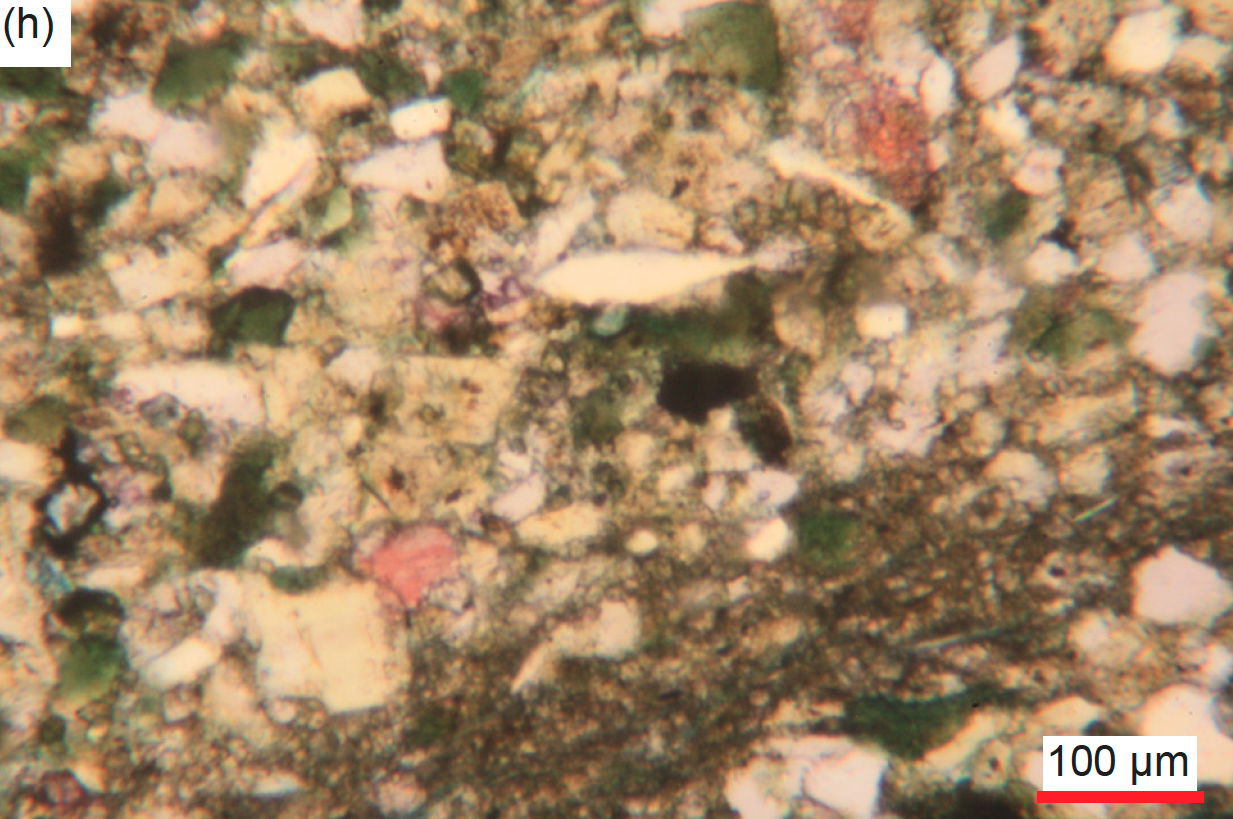
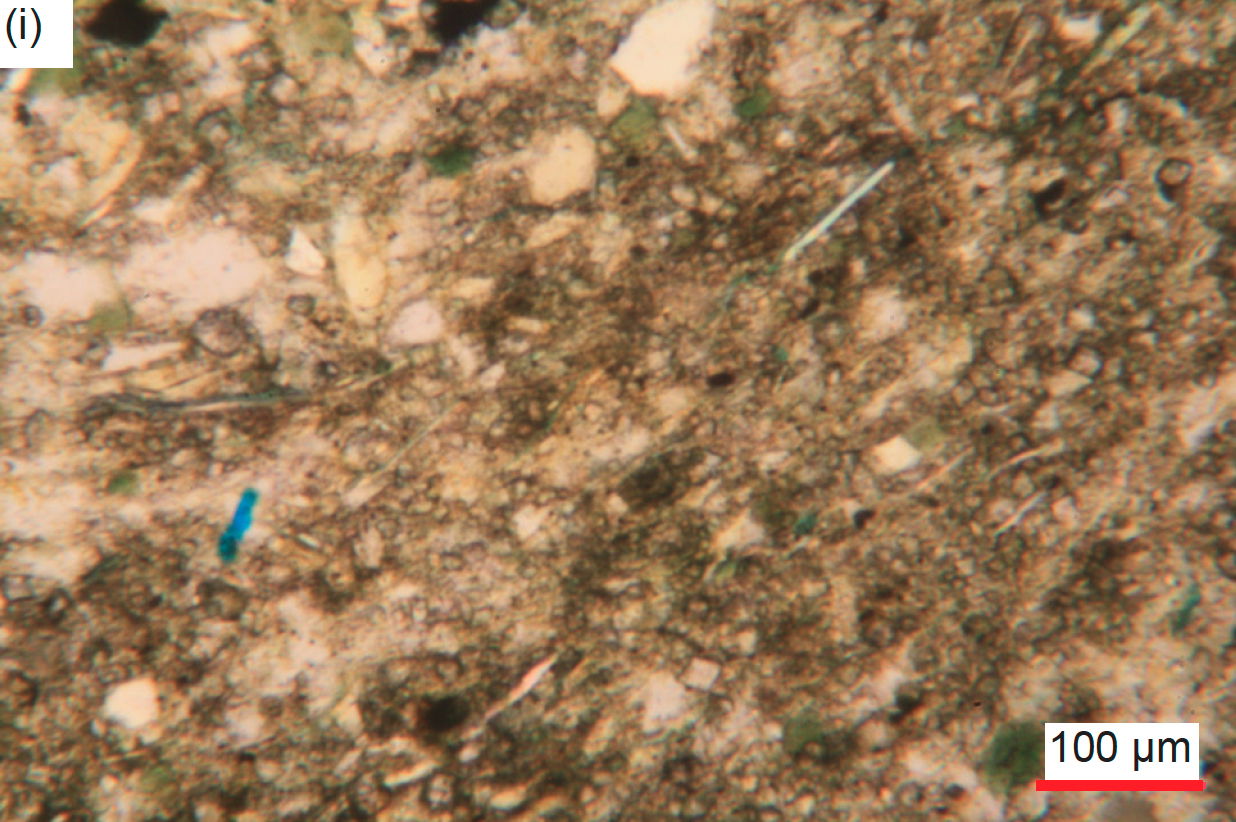
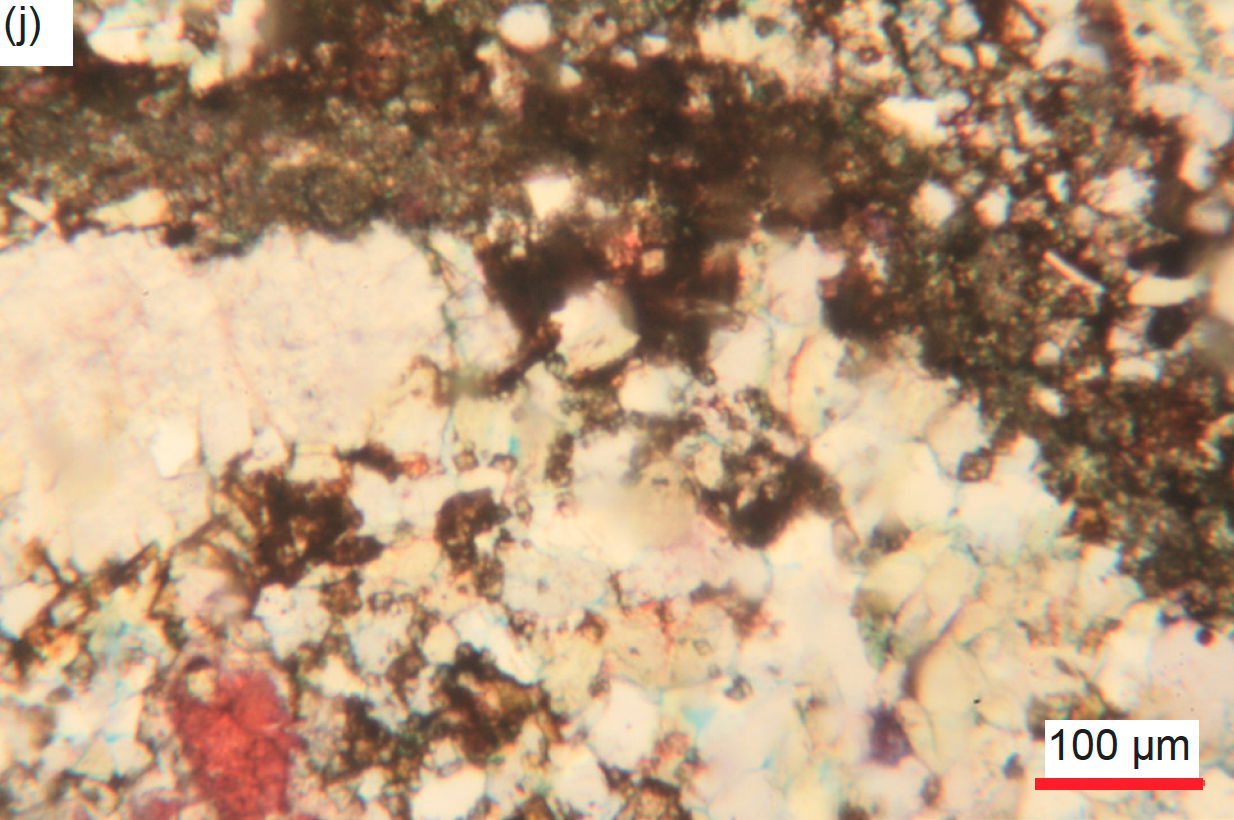
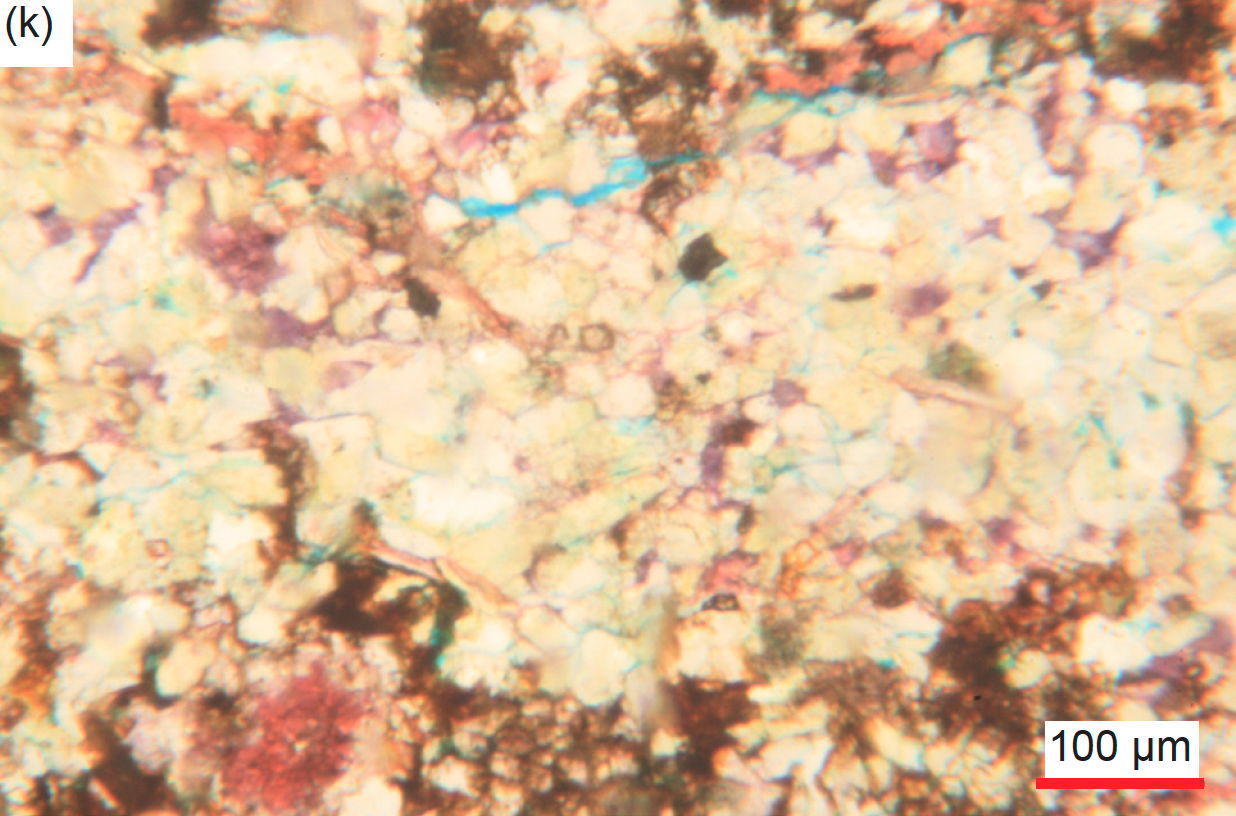
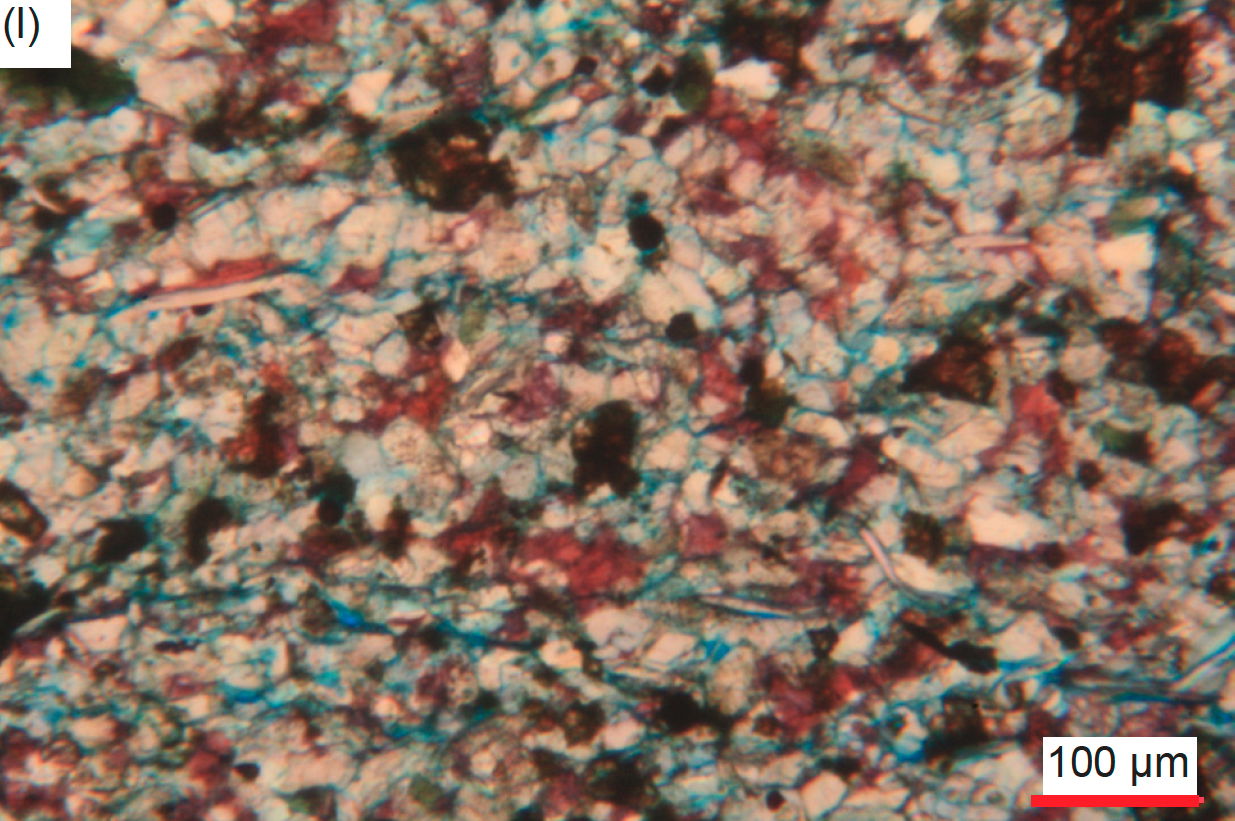
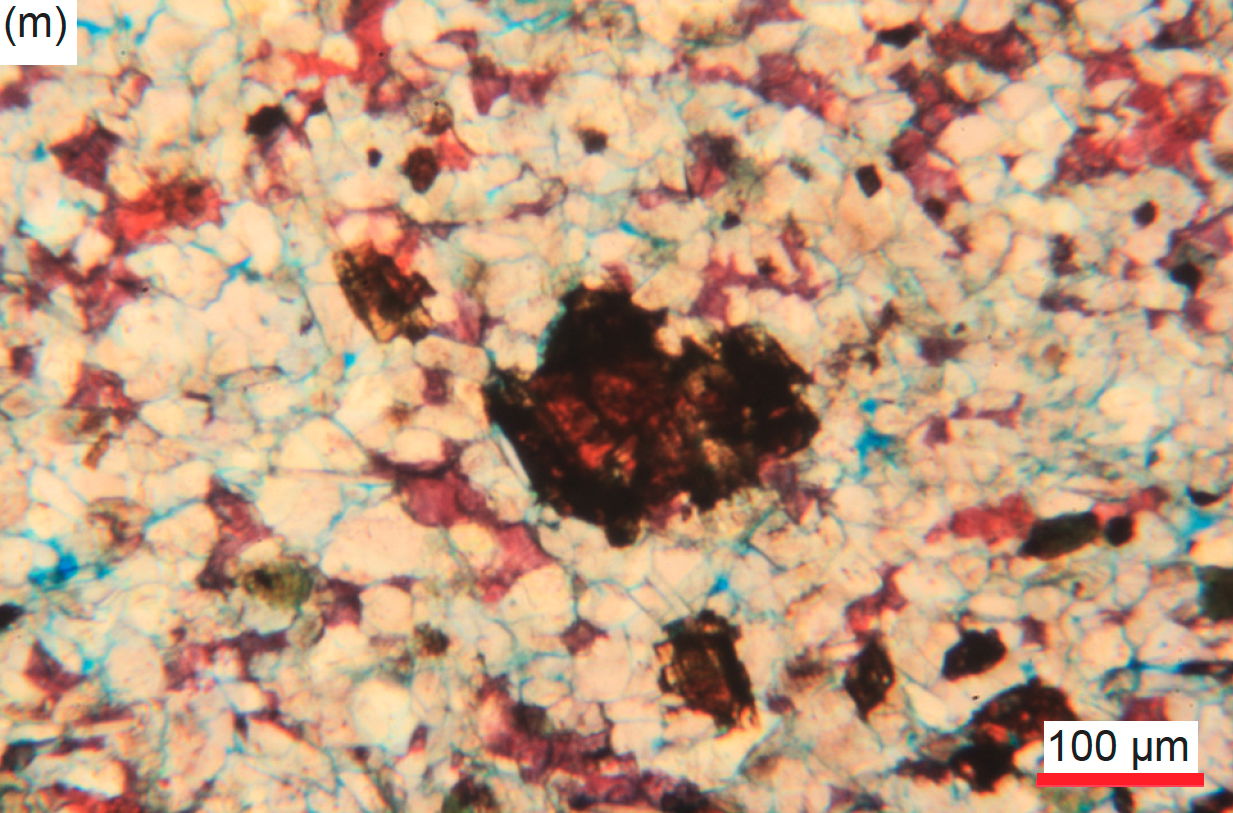
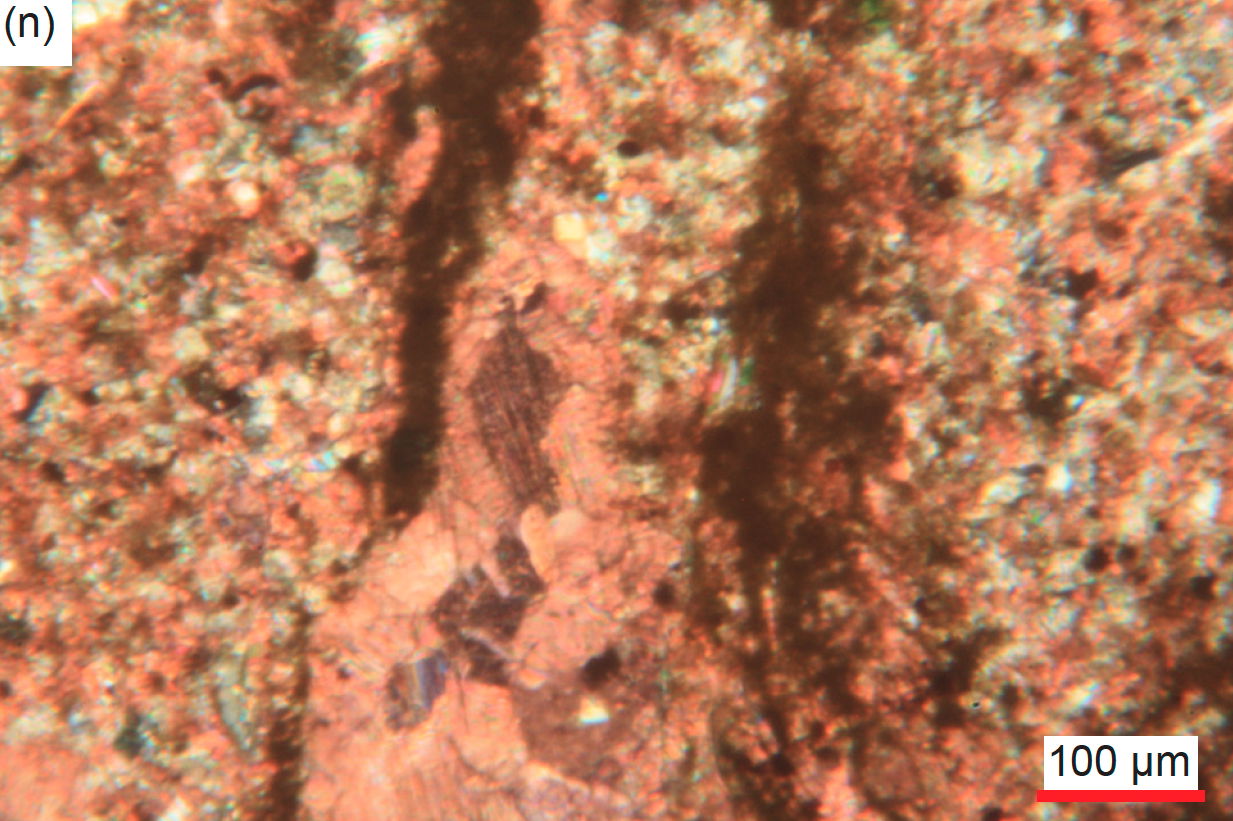
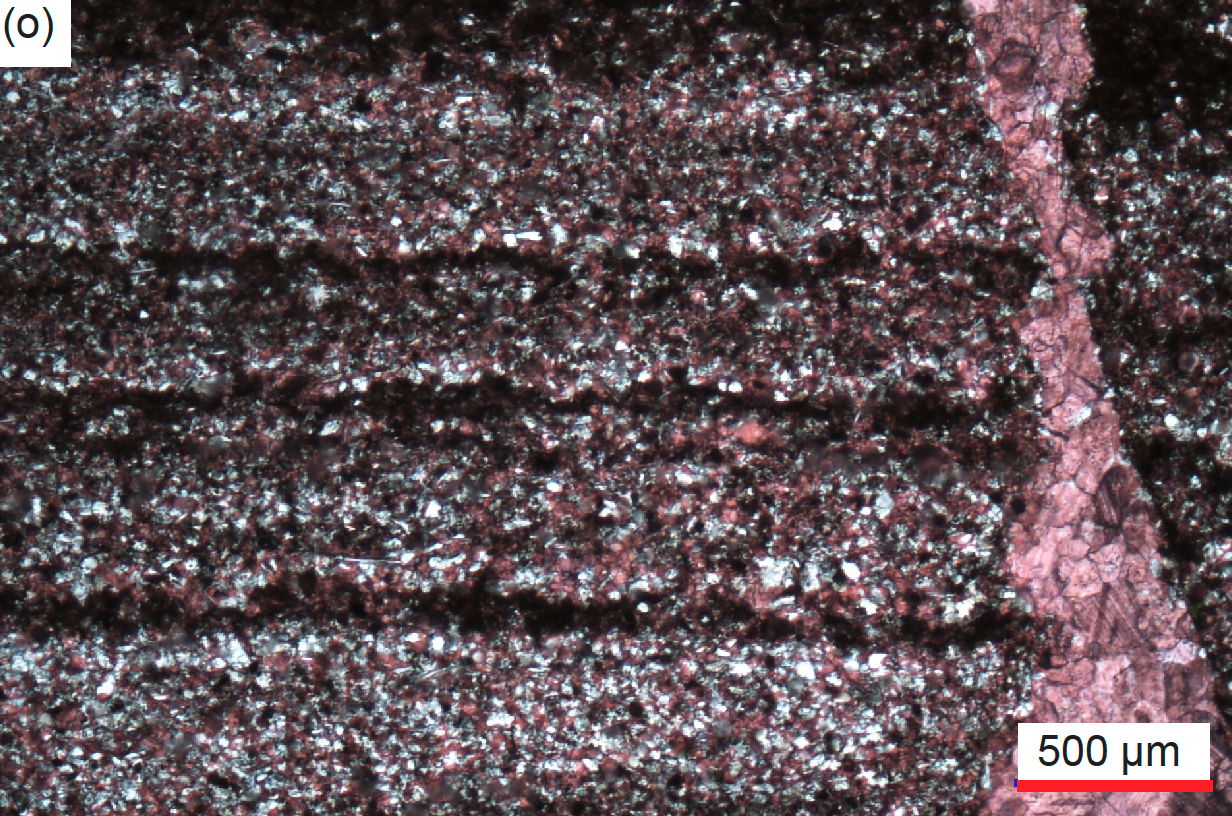
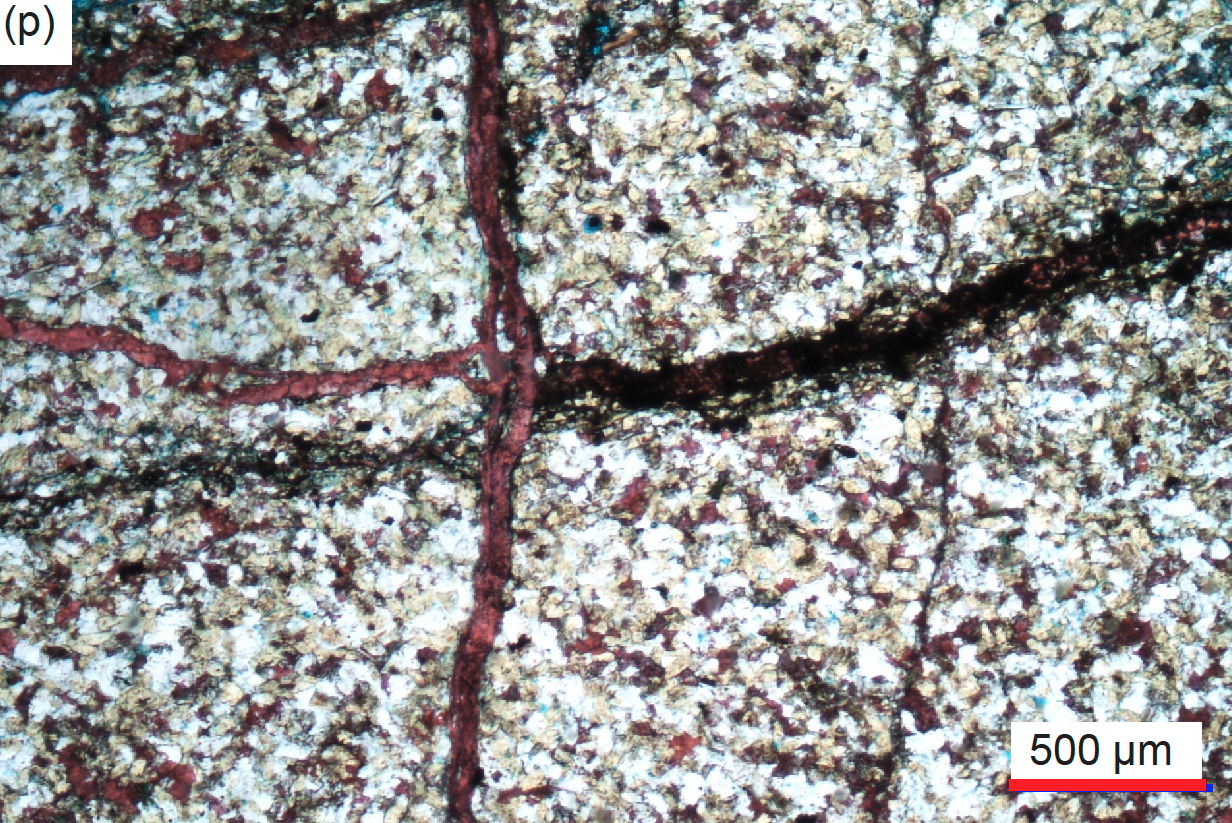
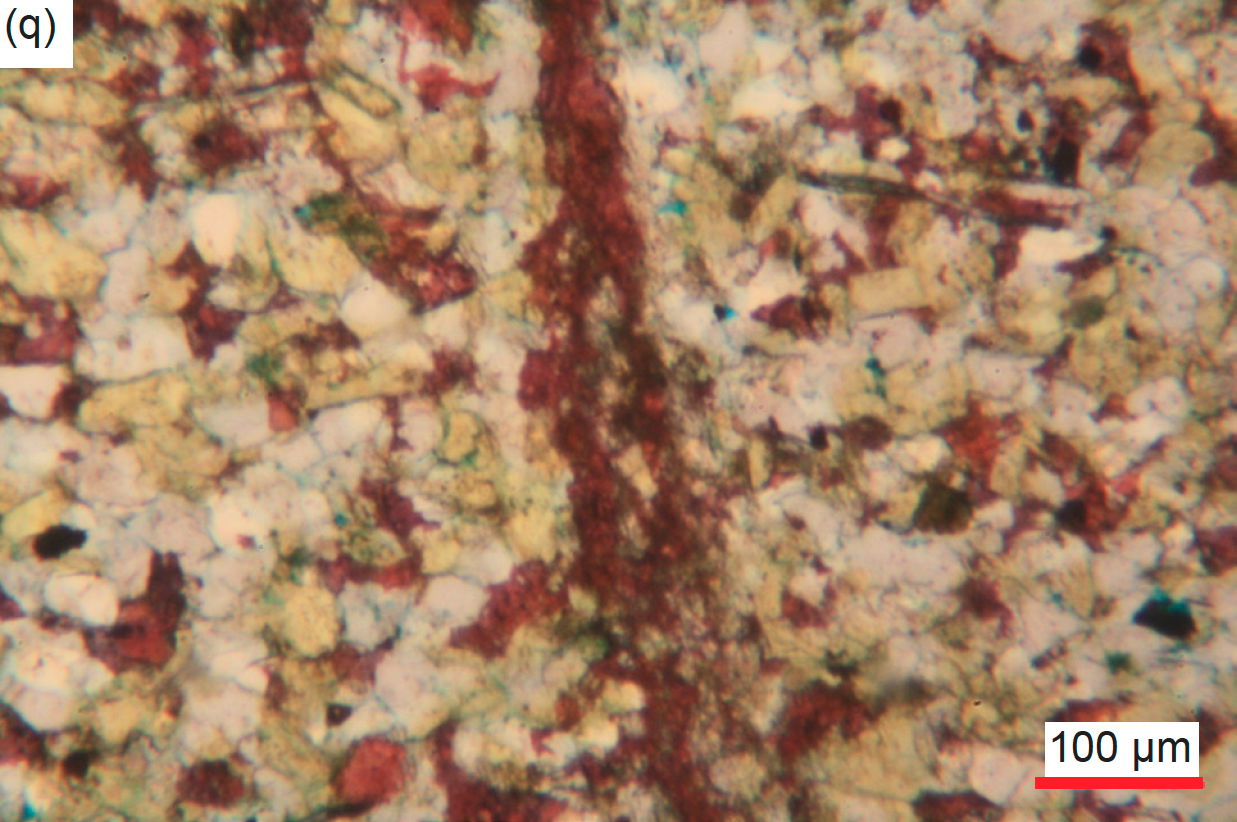
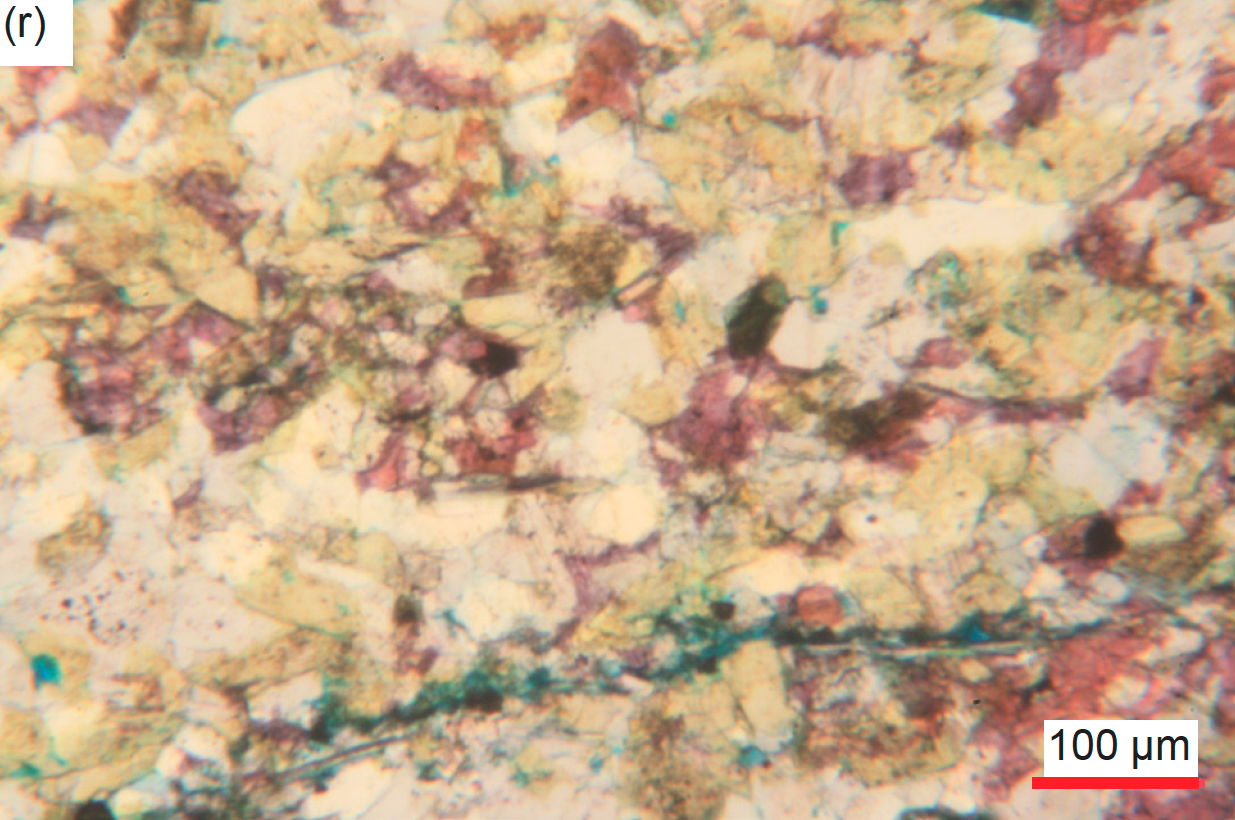
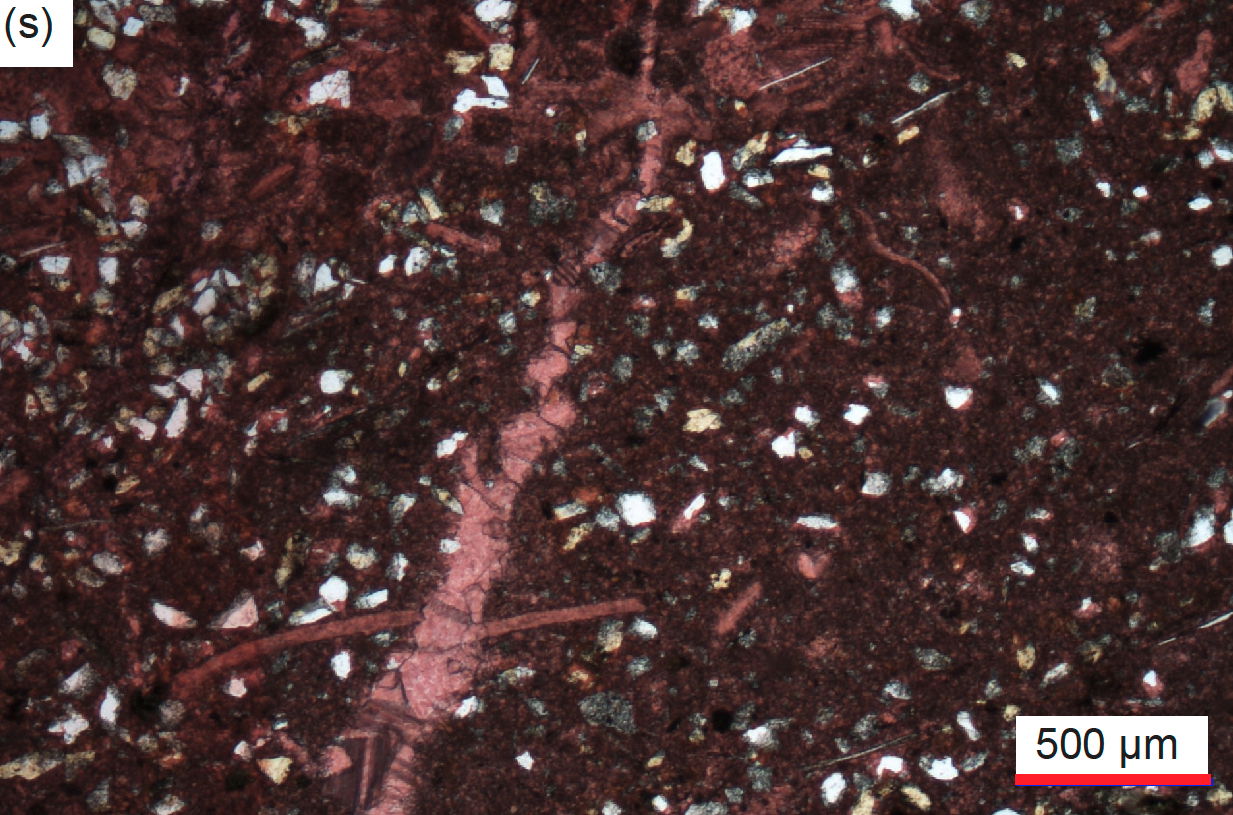
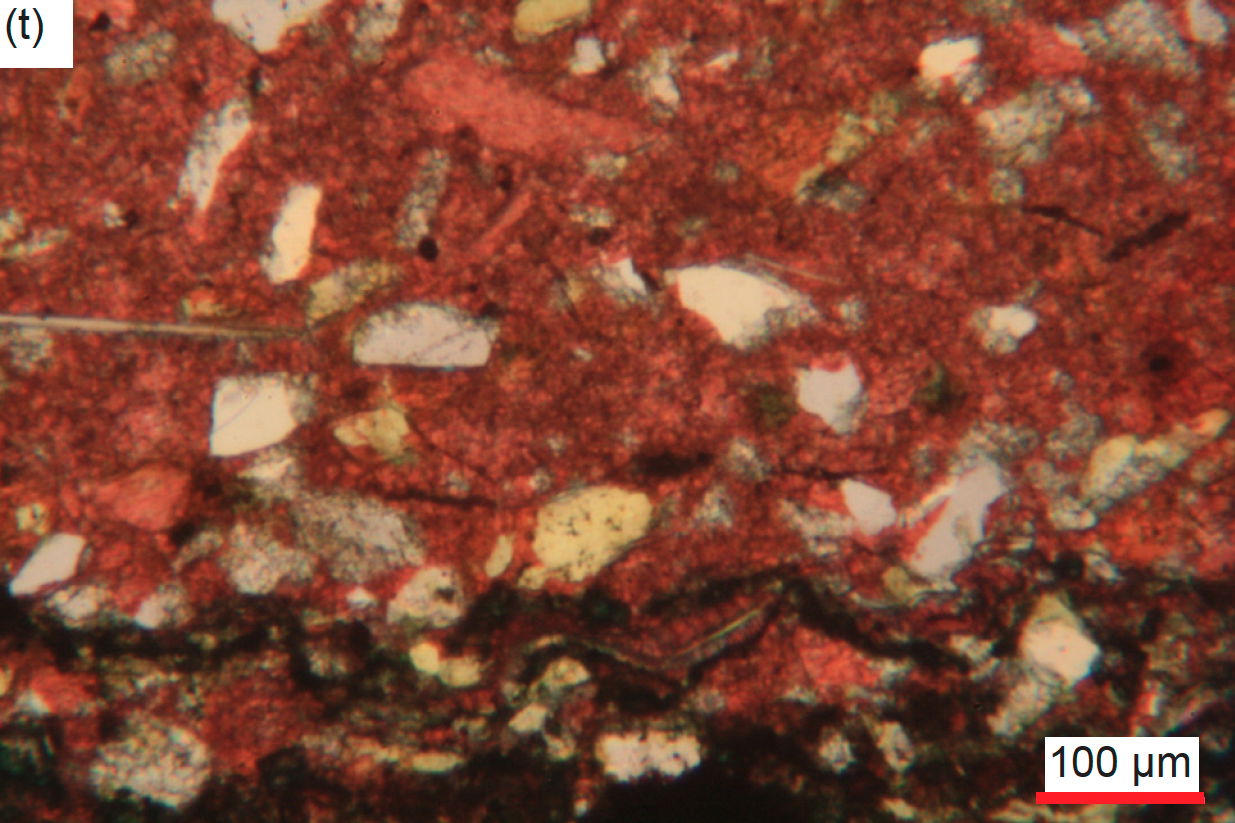
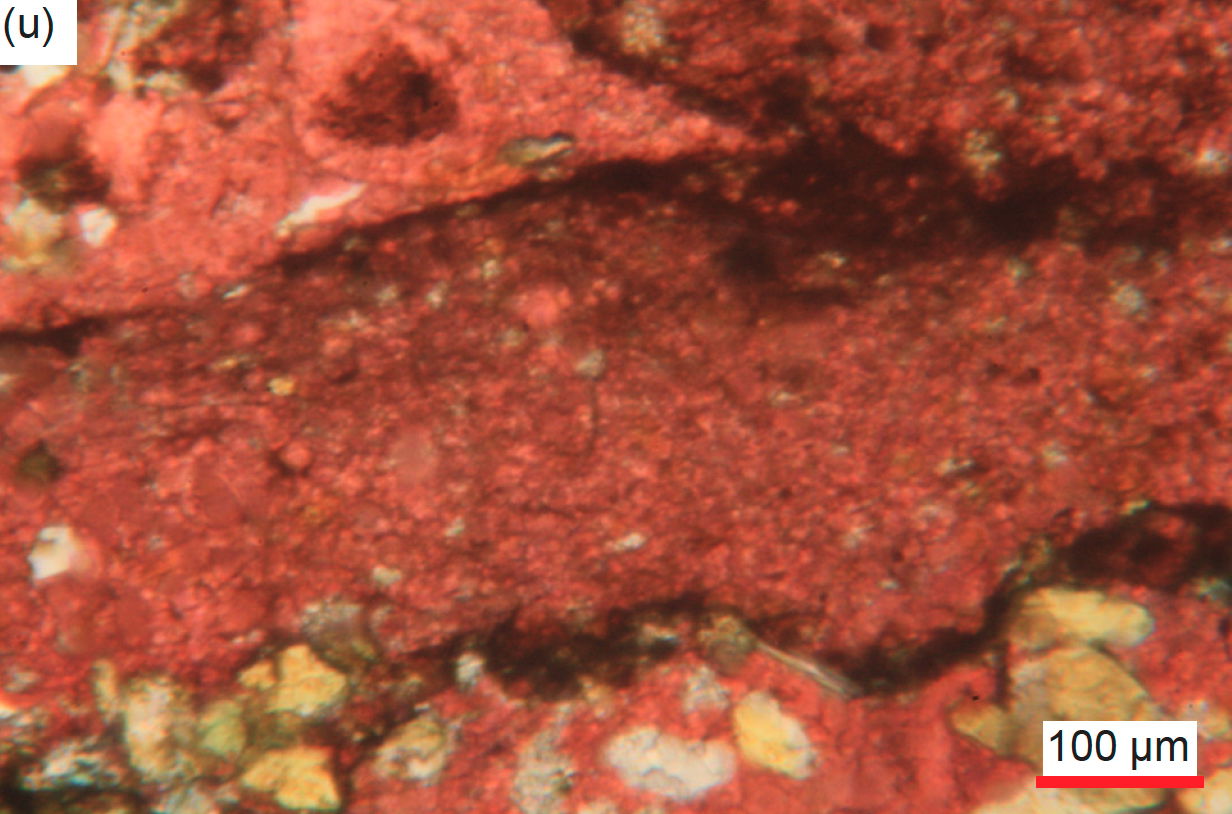
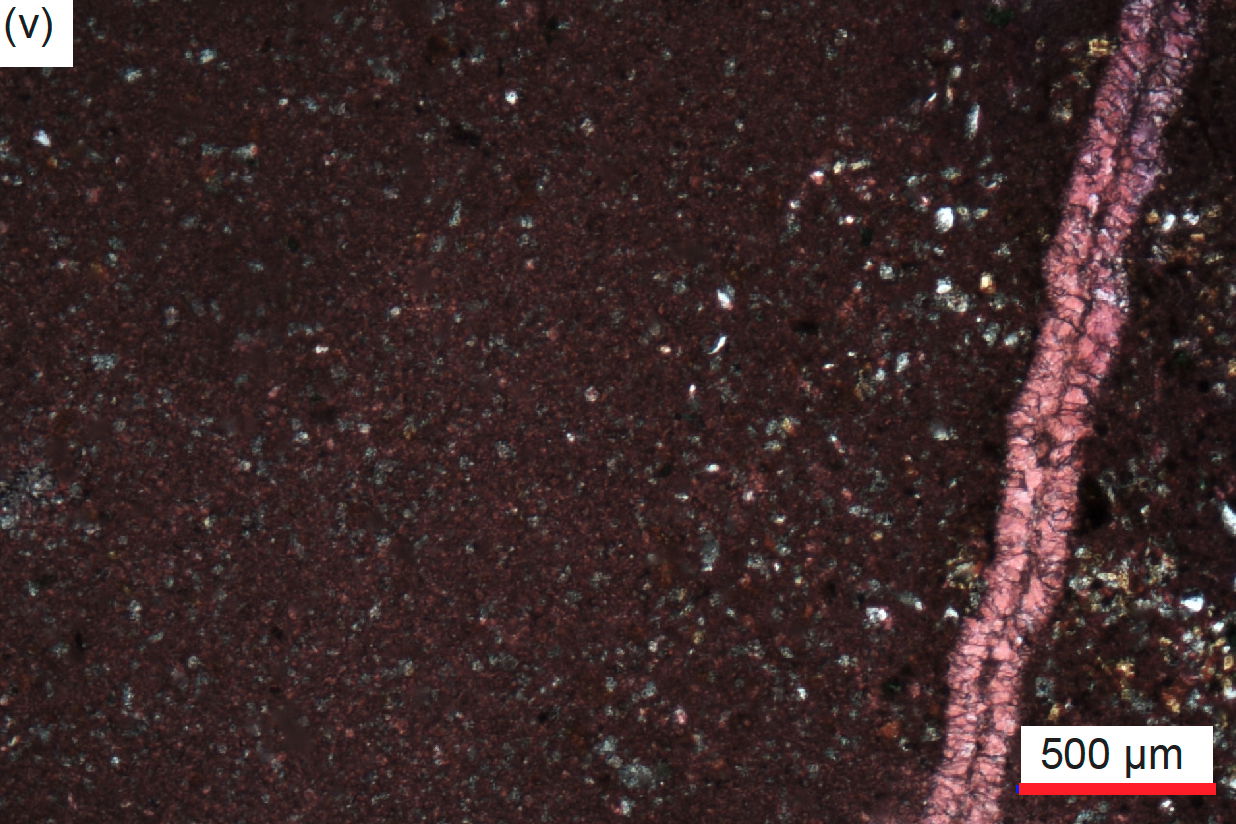
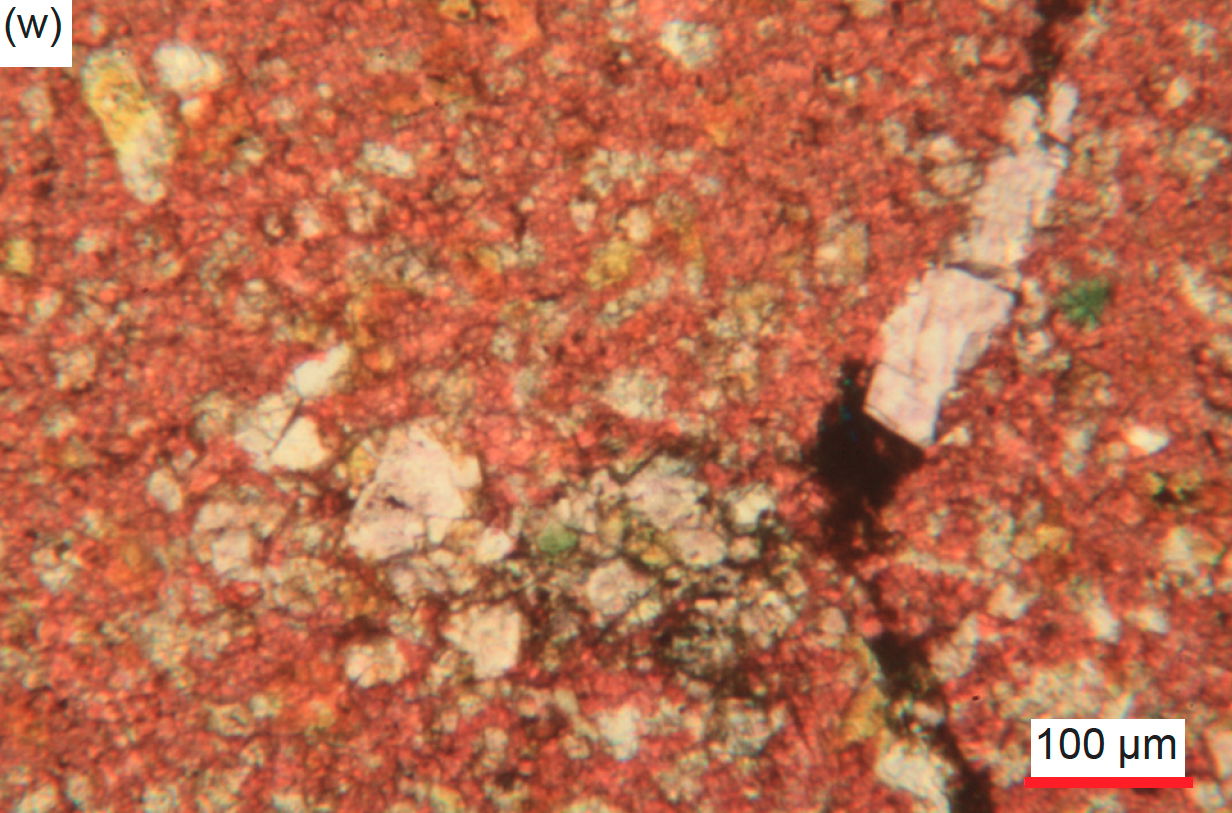
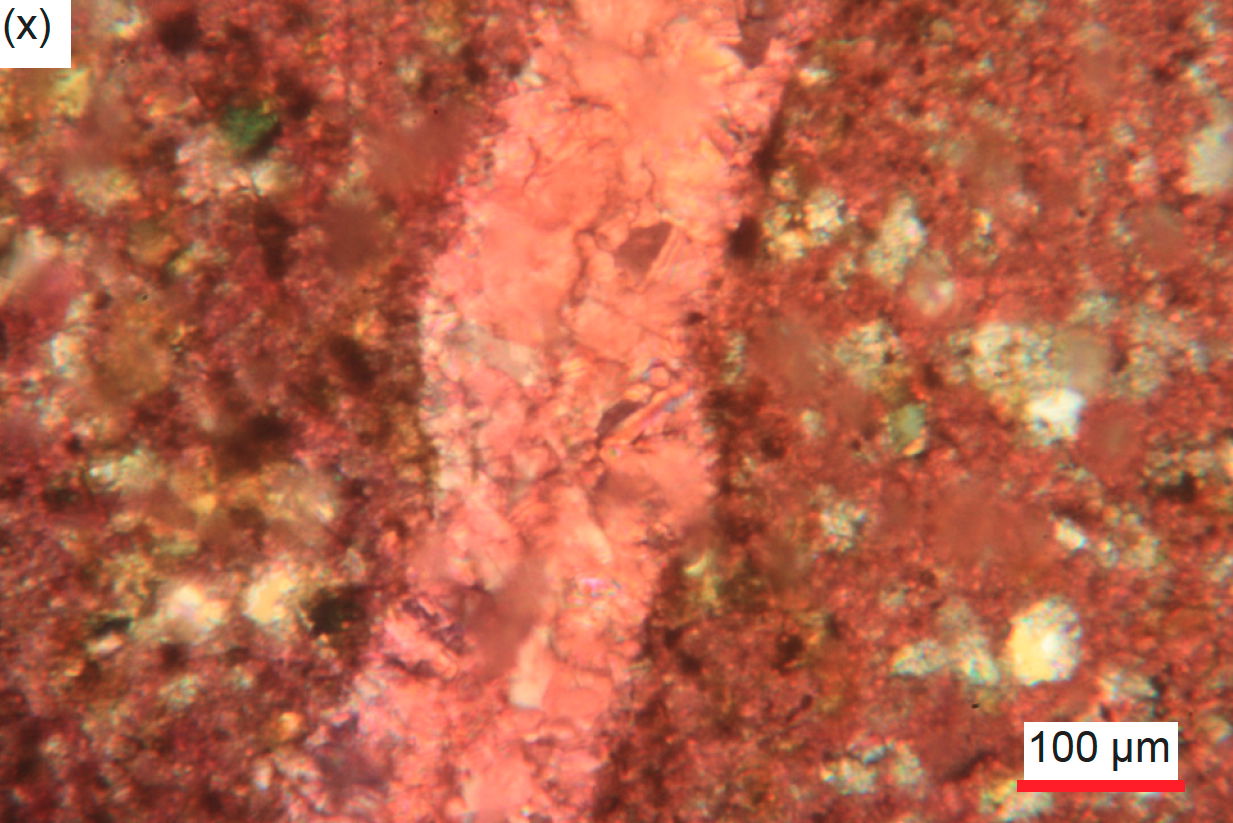
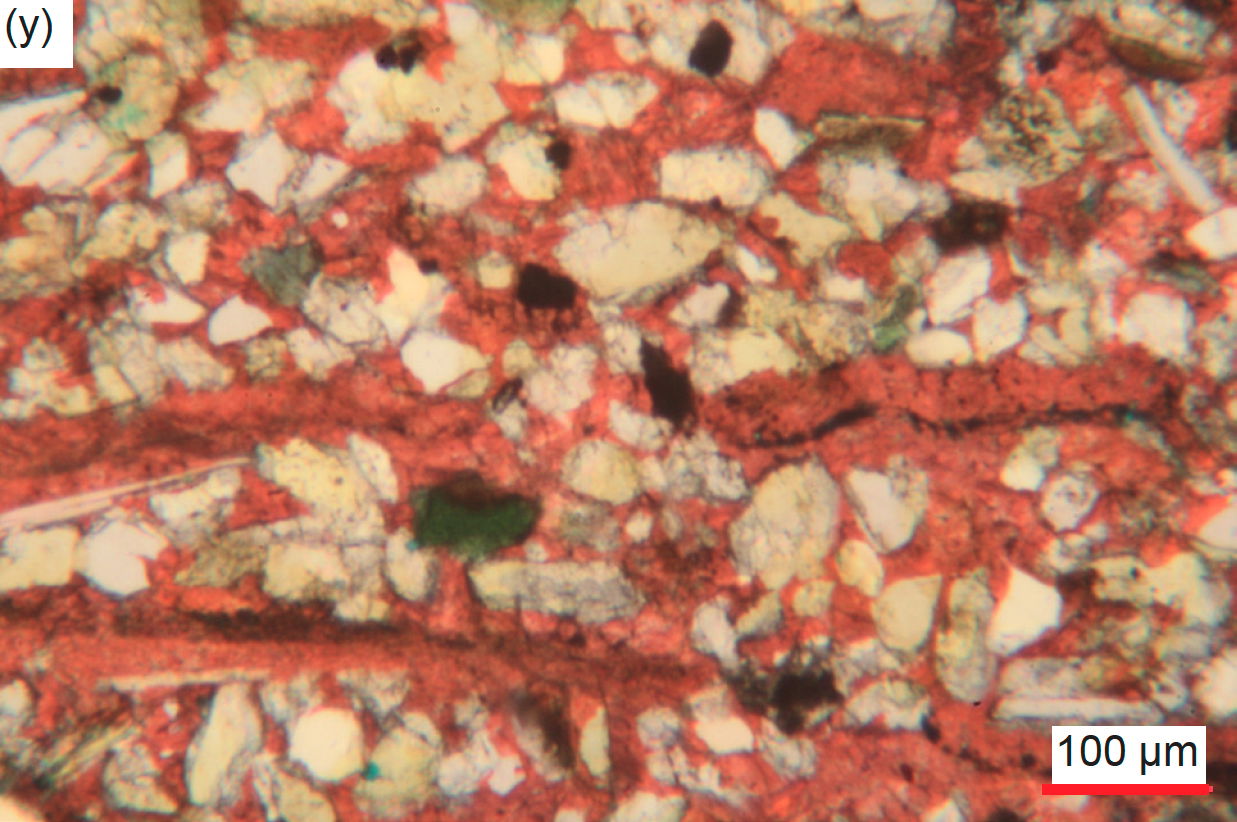
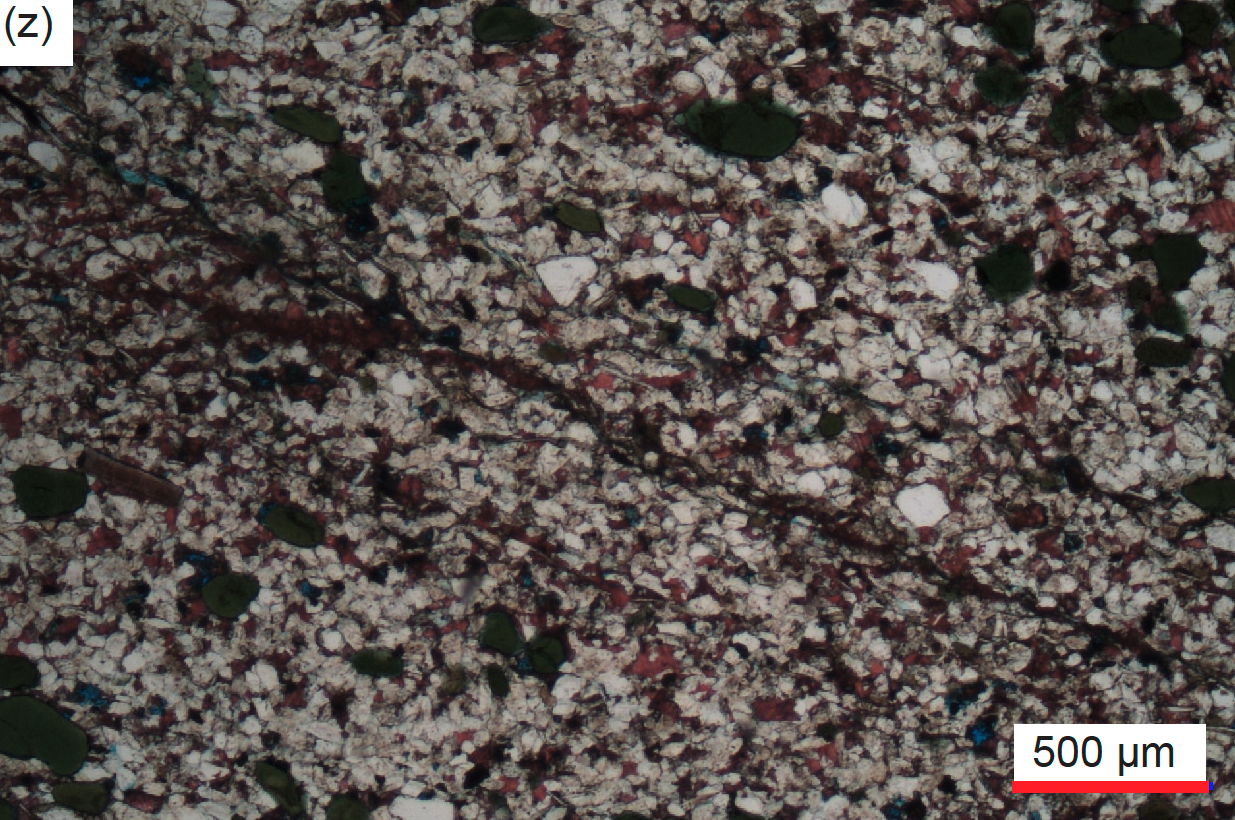
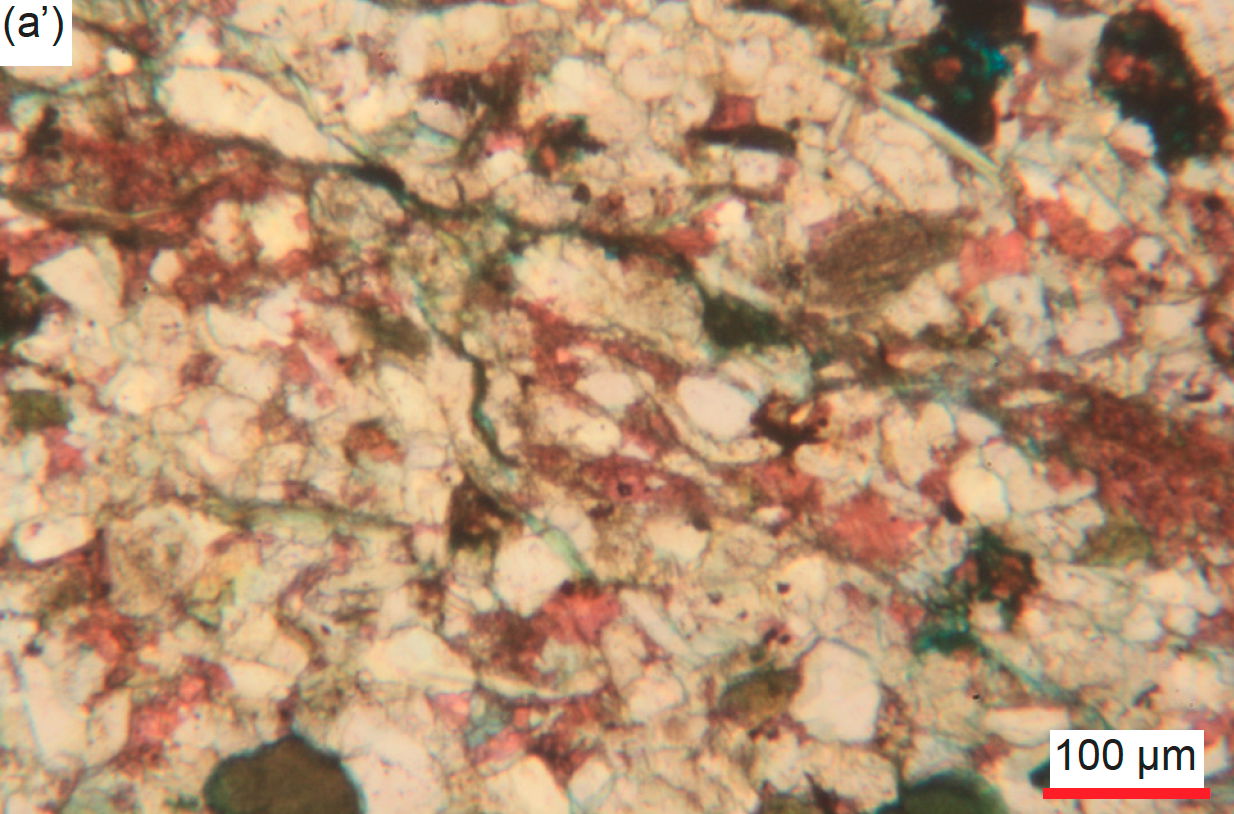
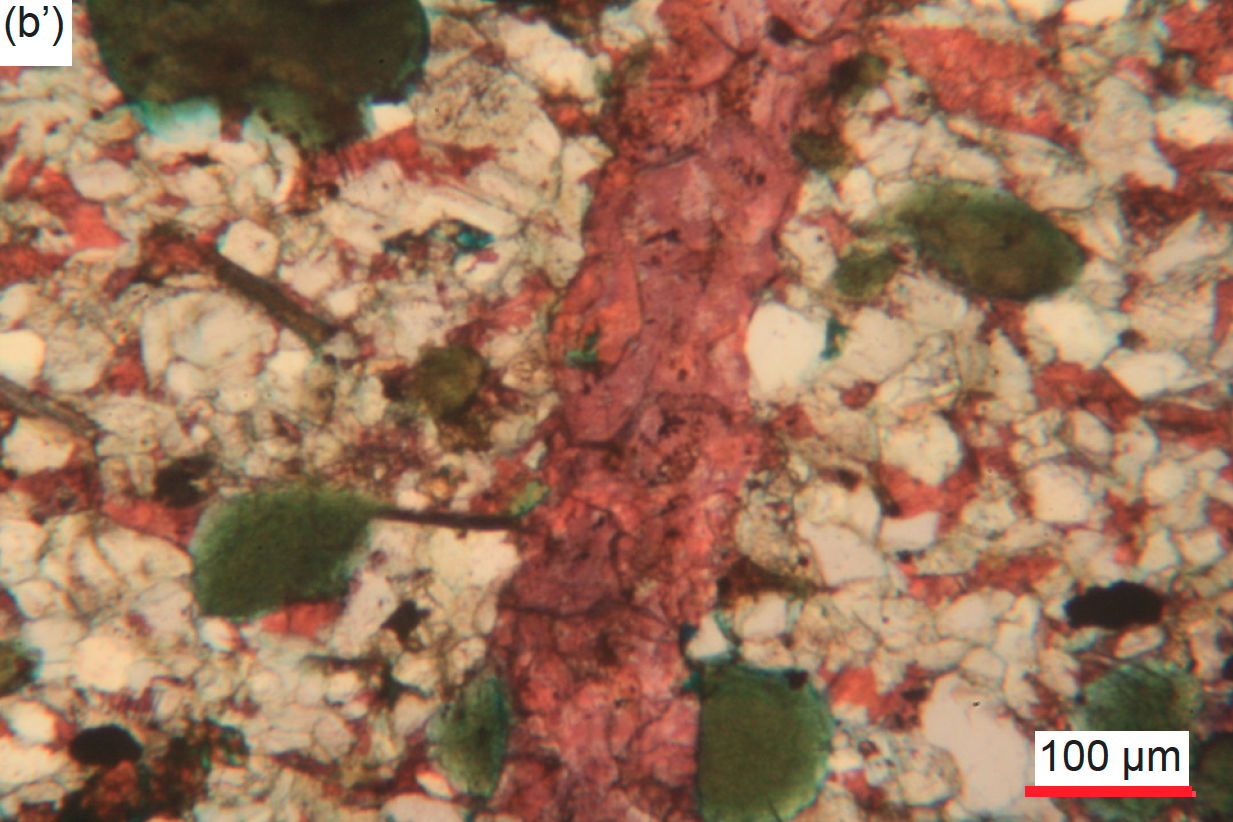
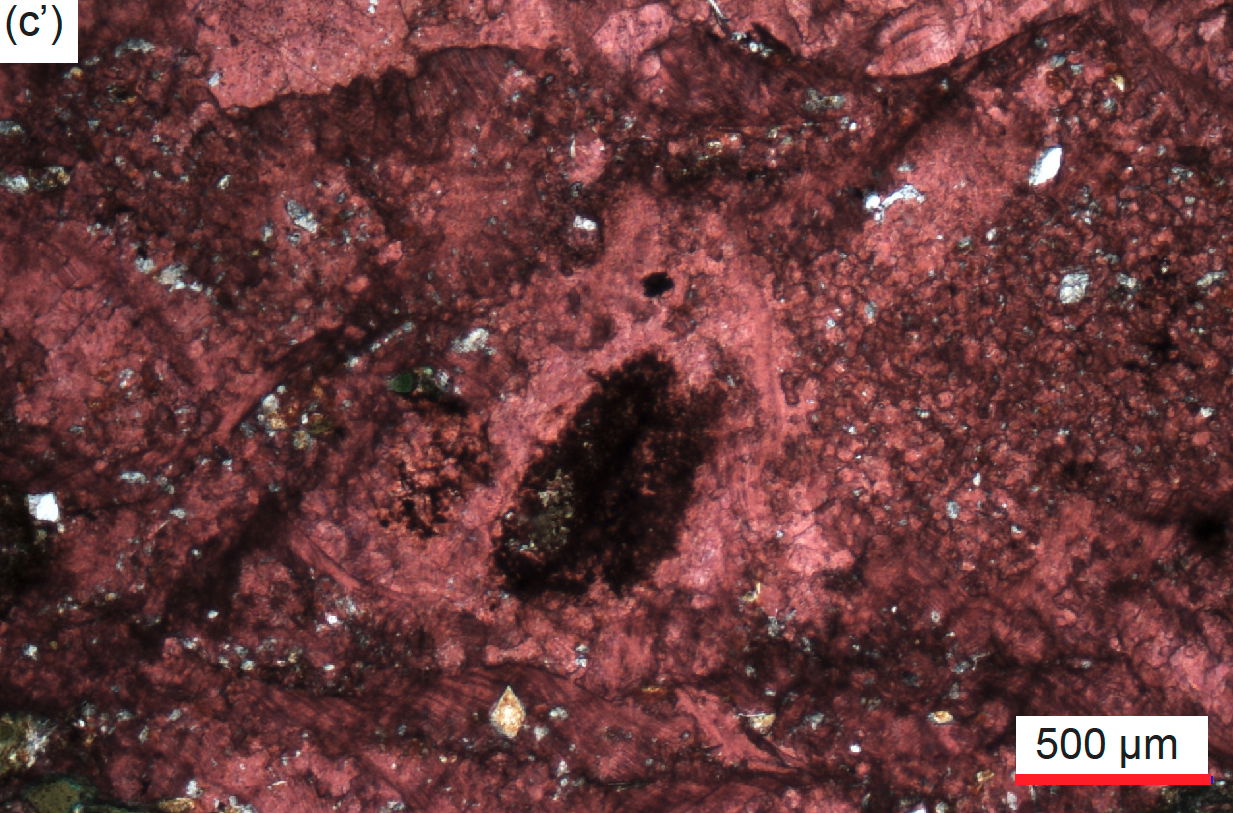

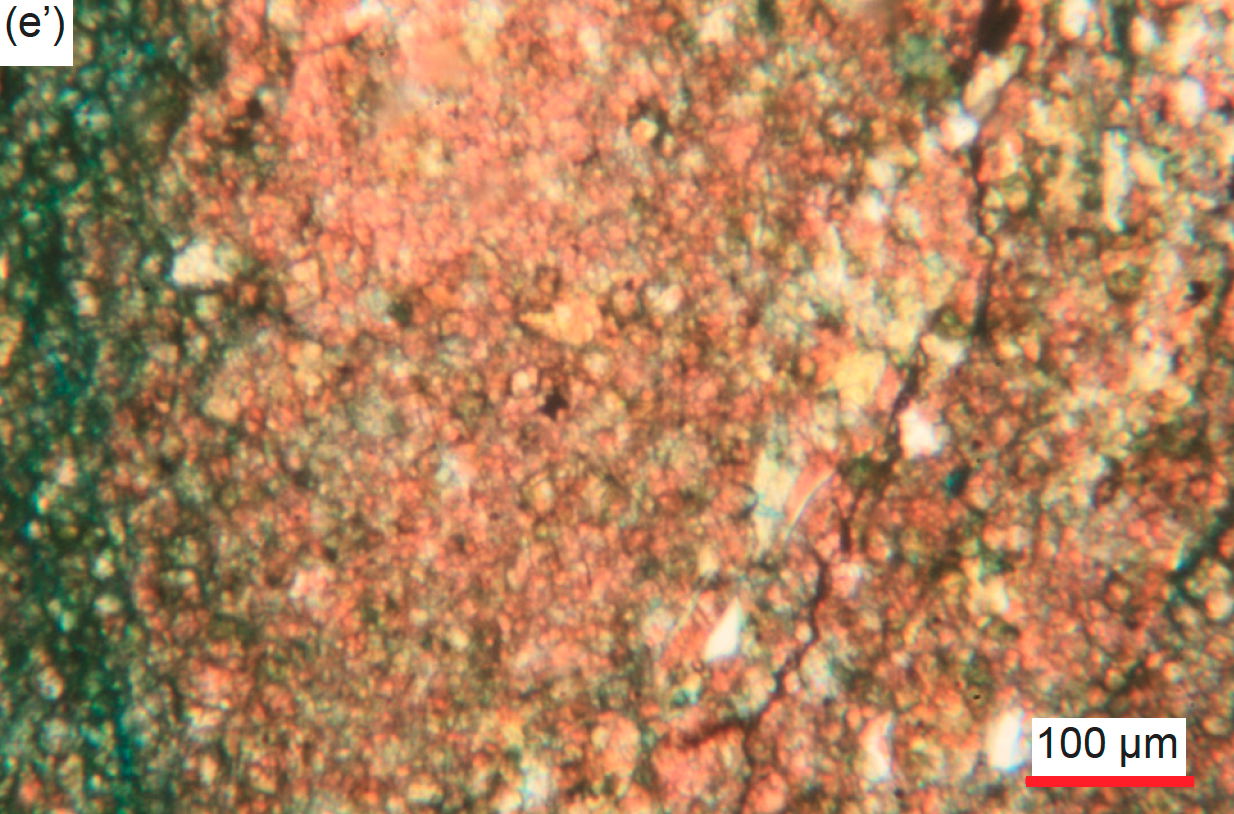
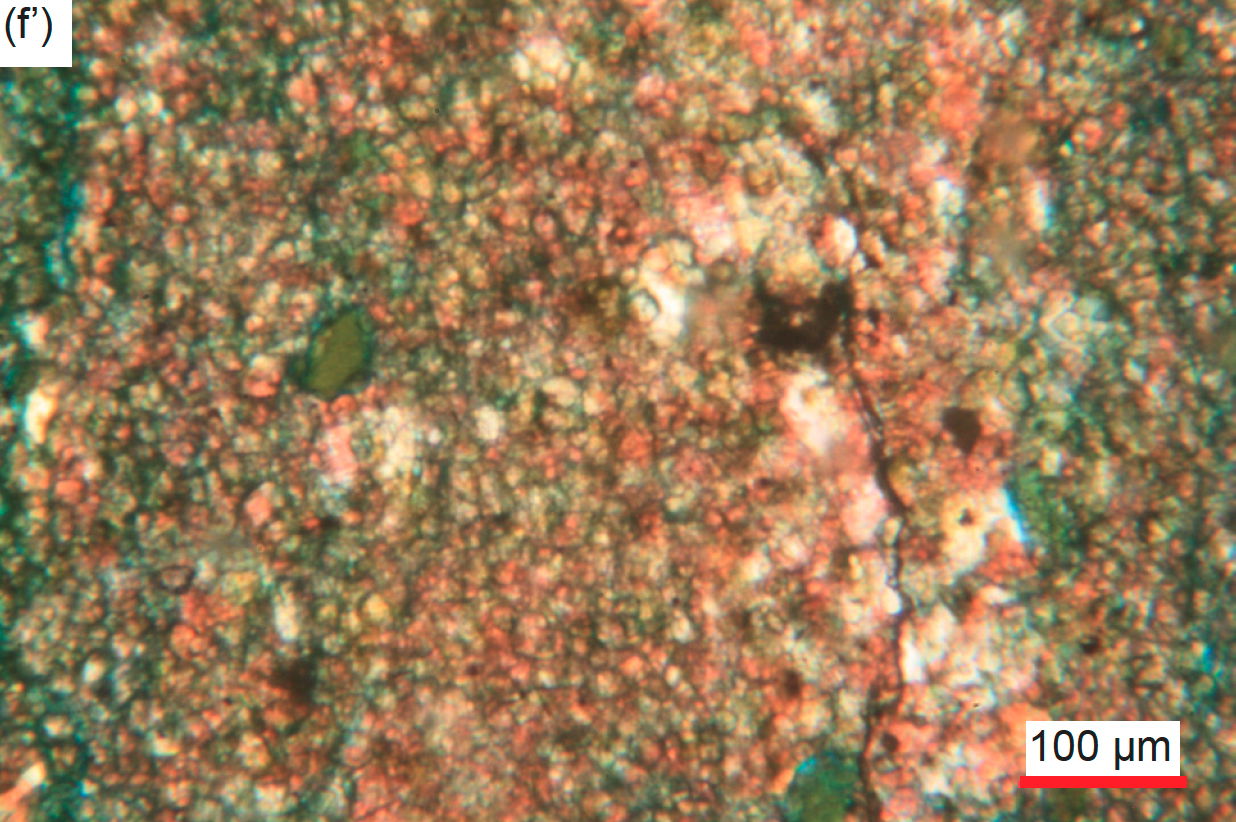
Fig. 35. A representative set of photomicrographs at various scales (as indicated) showing the fractures and veins in the Muav Formation samples. Distal samples: (a), (b) MLS-01, (c), (d) MLS-02, and (e)–(g) MLS-03. Matkatamiba fold samples: (h), (i) MFML-01, (j), (k) MFML-2, (l), (m) MFML-03, (n), (o) MFML-04, (p)–(r) MFML-05, (s)–(u) MFML-06, (v)–(x) MFTB-01, (y) MFTB-02, (z)–(b’) MFTB-04, (c’), (d’) MFTB-05, and (e’), (f’) MFTB-06.
It is also apparent that soon after deposition while still soft the laminae in several samples were disturbed or deformed, as some of the fine-grained silt moved through breaks in the micrite laminae, intruding like diapirs and veins as “injectites,” for example, sample MFML-04 (figs. 23n and 35o). Furthermore, in sample MFML-06 (fig. 23e), the soft-sediment deformation completely disturbed the original laminae, so they formed alternating “blobs” and “swirls.” And in other samples that are dominated (>50%) by quartz and K-feldspar grains (for example, MFML-01 and -05, figs. 23d and h, respectively), post-depositional fracturing occurred perpendicular and obliquely to the laminations to slightly offset them, with the fractures filled by thin calcite veins. In some parts of the rock fabric, the interlocking mosaic of quartz and K-feldspar grains appears to be fractured without significant displacement at an oblique angle to the bedding by a network zone of fractures (figs. 23h and 35p, r, t and d’), making the quartz and K-feldspar grains smaller, angular, and even elongated aligned parallel to the fracturing (fig. 35r).
Some edge-on muscovite flakes lie along and within fractures, probably having facilitated the location of the fractures which are often at the same low angle to the bedding as are other fractures in those samples (for example, figs. 32e’ and 35m). In contrast, in one sample, even though the muscovite flakes are usually parallel to one another, they are also parallel to apparent fractures and other lineations which are all perpendicular to the denoted bedding,
In sample MFTB-04 (fig. 23l), two thick veins consisting of small calcite crystals of various shapes at different extinction angles cross-cut the rock fabric almost perpendicular to the bedding, meandering around glauconite grains but cutting through quartz and K-feldspar grains and separating their pieces (fig. 35b’). Elsewhere, a thick double small-medium-sized crystal width calcite vein cross-cuts the regular fine-grained calcite matrix at an angle almost perpendicular to the bedding (MFTB-01, fig. 35v, x). And in another sample (MFML-05), thin parallel stringers and veins of calcite, sometimes accompanied by elongated blotches and stringers of iron oxides, cross-cut the rock fabric approximately both parallel and perpendicular to the bedding and appear to fill fracture zones, sometimes close together or even anastomosing (fig. 35p, q). One of these thin veins of calcite cross-cuts the rock fabric at a lower oblique angle to the bedding with the calcite generally iron-oxides-stained at the vein edges which are at a fairly consistent width apart (fig. 35p). In all these instances, there does not appear to have been any fracturing, crushing or dislocation of mosaic grains during the introduction of the veins along the fracture planes and zones. Elsewhere along another possible fracture, at an oblique angle almost perpendicular to the bedding, the calcite matrix has been recrystallized to adjoining, very small, almost non-iron-oxides-stained calcite crystals (similar to those scattered through the matrix).
The calcite veins in some samples are sometimes accompanied within them or as a separate veinlet by what appear to be very small sub-euhedral grains of dolomite that may either be replacing the calcite or mosaic K-feldspar grains—for example, MLS-01 (fig. 35a), MLS-02 (fig. 35d), MFTB-01 (fig. 35w), and MFTB-06 (fig. 35e’ and f’). Sometimes this dolomite alteration accompanying a calcite vein network also spreads into the adjoining mosaic, having altered the mosaic grains and particularly replaced the calcite cement. In one sample, what appears to be fractures cross-cutting the rock fabric roughly perpendicular to the bedding are filled either with several adjoining elongated, medium-sized “clean” dolomite crystals or with strings of tiny heavily iron-oxides-stained dolomite rhombs, accompanied by elongated patches and streaks of heavy iron oxides.
Finally, in sample MFTB-04, a small-medium-sized subrounded quartz grain is fractured but not displaced, with recrystallization healing through the fracture zone which parallels at the same angle a nearby edge-on muscovite flake and the fractures elsewhere through the rock fabric (fig. 25u).
Overall, given the variations in the quantities of the various detrital mineral and fossilized shell contents and the occurrences of fractures and veins between adjacent samples at the same stratigraphic levels in the fold, there are otherwise really no significant differences in the detrital condition of the minerals and their textures between the samples, whether from either the hinge or limb zone of the fold, or from locations distant to the fold. This confirms the observation that lithification must have occurred after the folding. Otherwise, if lithification had occurred before the folding the ductile deformation required would have changed the detrital characteristics of the grains in response to the applied heat and pressure.
The Cement
The primary cement binding the detrital grains together in all these samples of the Muav Formation is calcite (figs. 24 and 36). It is evident that in all samples this calcite essentially filled all of the initial pore spaces between the deposited silt and very fine sand grains during and subsequent to compaction and during dewatering. The cement appears to be in pristine condition, that is, still in its original condition from precipitation during lithification. However, some recrystallization of the calcite cement must have subsequently occurred, likely followed by some sporadic dolomite alteration of the calcite. Thus, a close look at the rock fabric and the calcite cement, the recrystallized calcite, and the dolomite alteration under the petrographic microscope, supplemented by scanning electron microscope (SEM) imaging, is necessary to confirm and thus support the observation that lithification occurred after the deformation. However, if lithification occurred before the deformation of these limestone beds in the fold, then the calcite cement might show evidence of being fractured by the deformation but then being healed.
Petrographic Microscope Observations
The detrital calcite grains (micrite) are generally a uniform darker, even dirty, color and display a fine granular texture so that the even finer-grained calcite cement binding them together is virtually indistinguishable (for example, fig. 36a, d, g, s, w, z, b’). Where the detrital calcite grains and calcite cement have been recrystallized, it is very obvious because the new calcite grains and crystals are larger and “cleaner,” being a brighter pink color (due to the staining applied during thin section preparation) (for example, fig. 36b, c, f, h–j, l, p–v, x, i’, m’–n’). In some of the lowermost Havasu Member samples from the fold, the recrystallized calcite cement is only indicated by the displayed cleavage planes (for example, fig. 36e’, g’, j’).
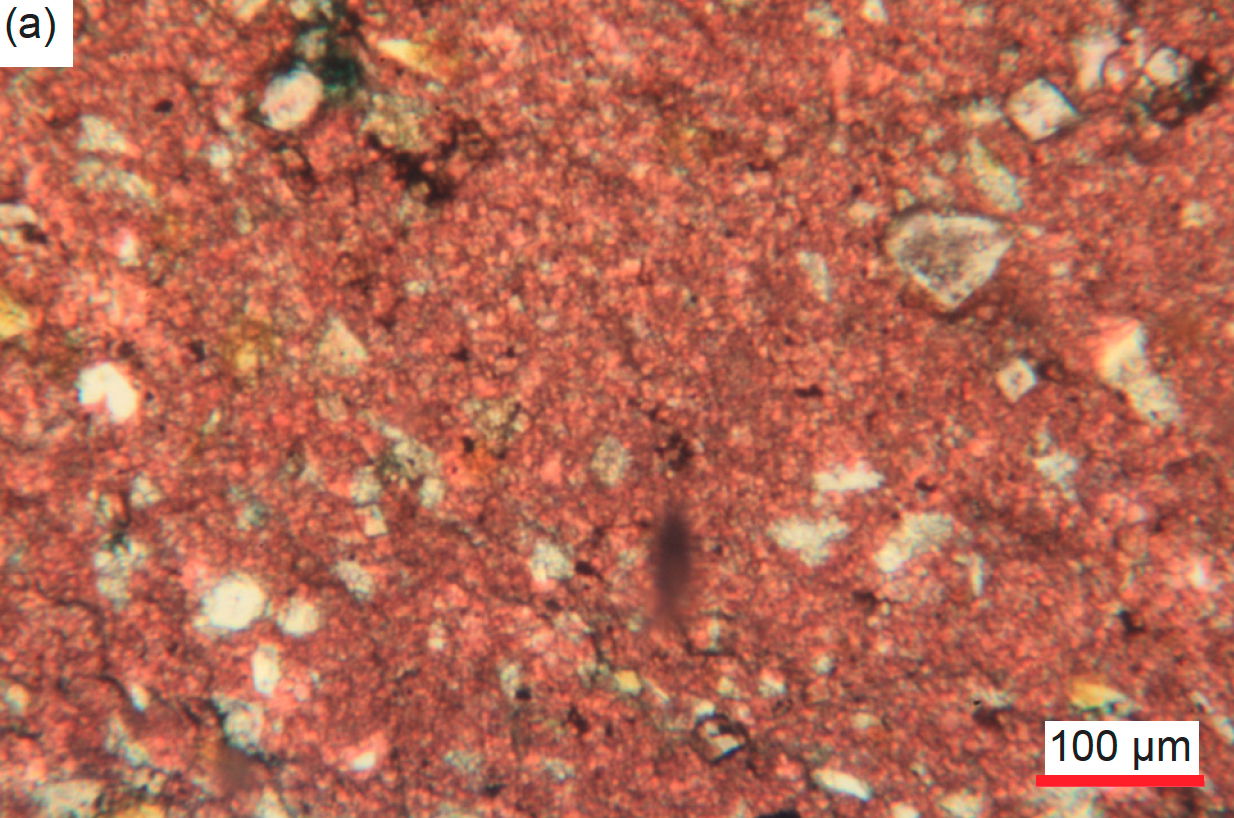
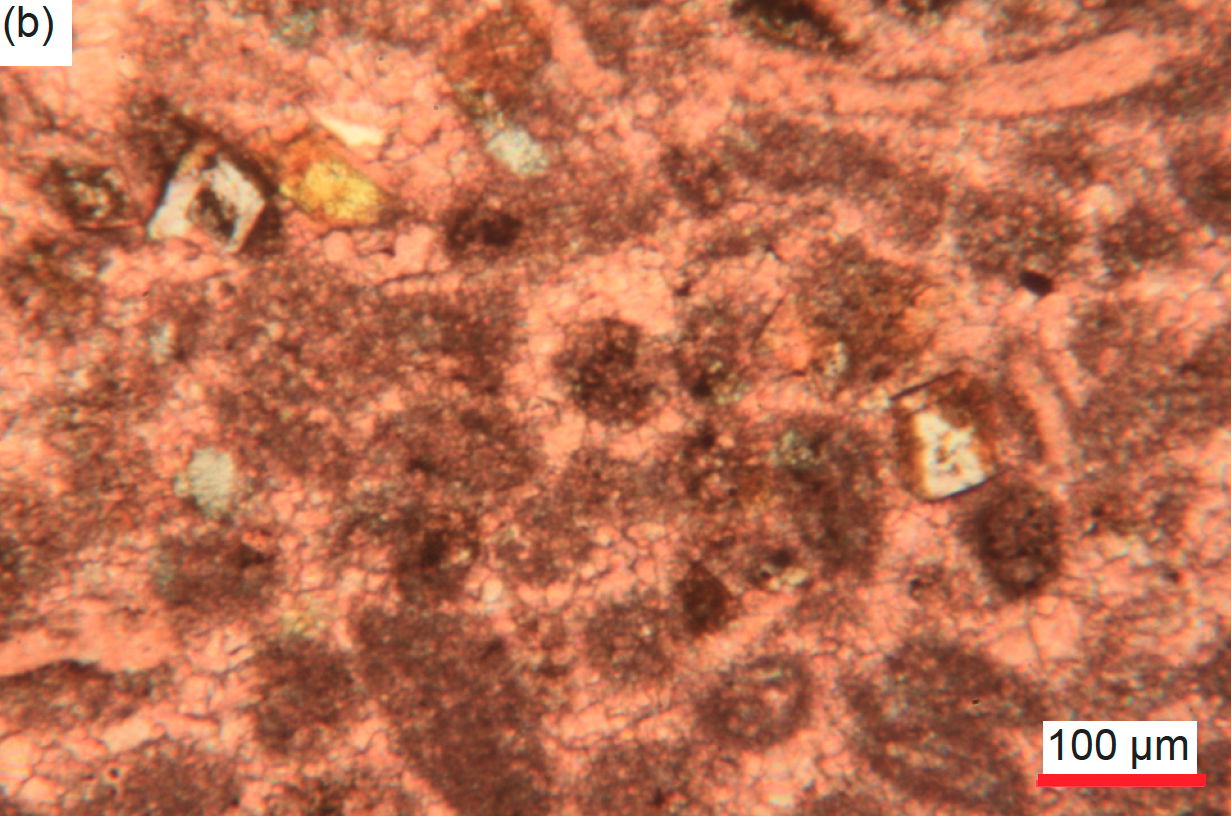

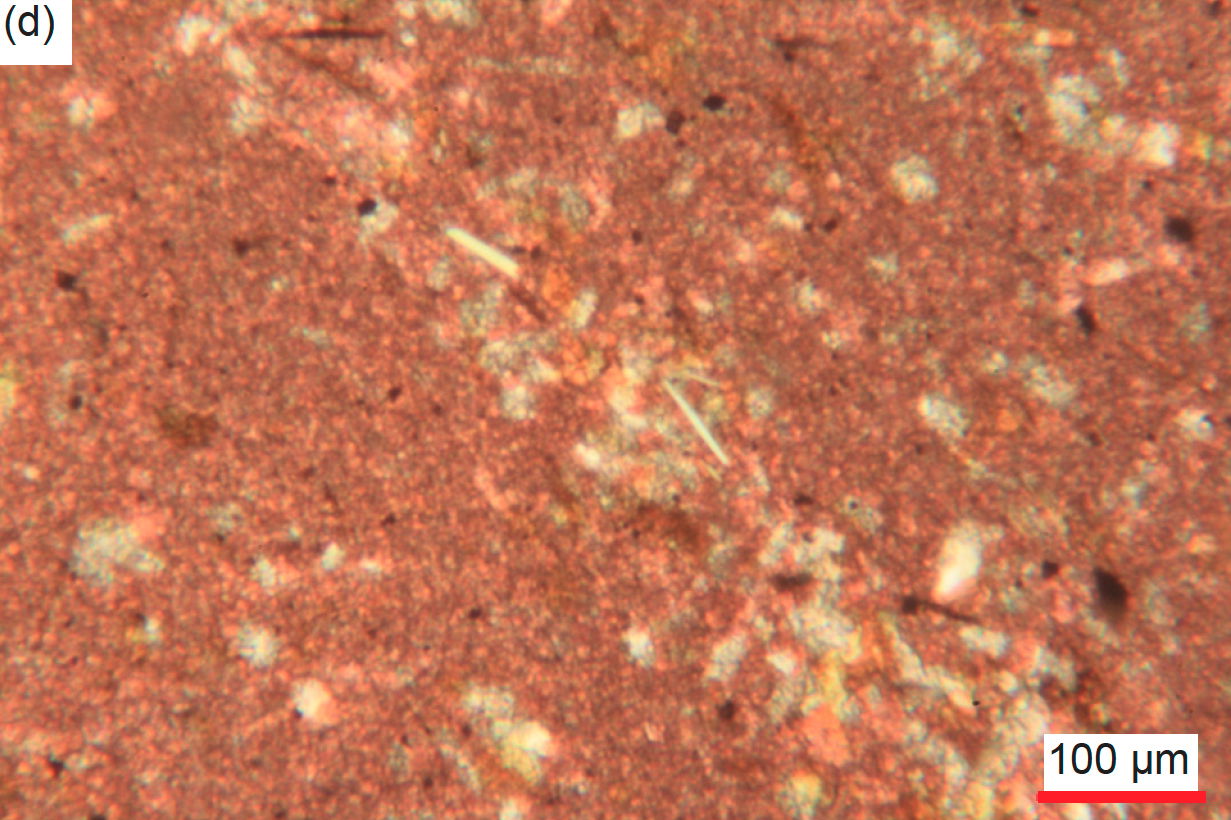
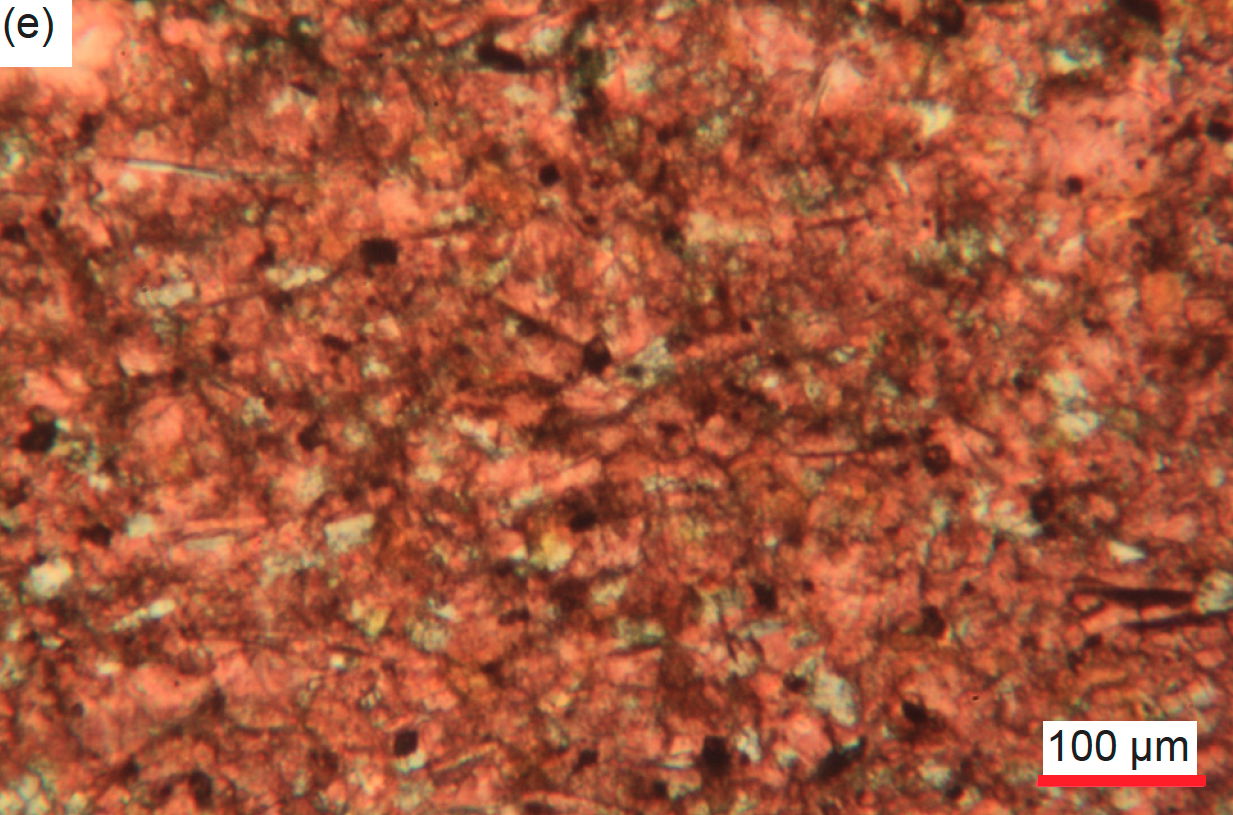
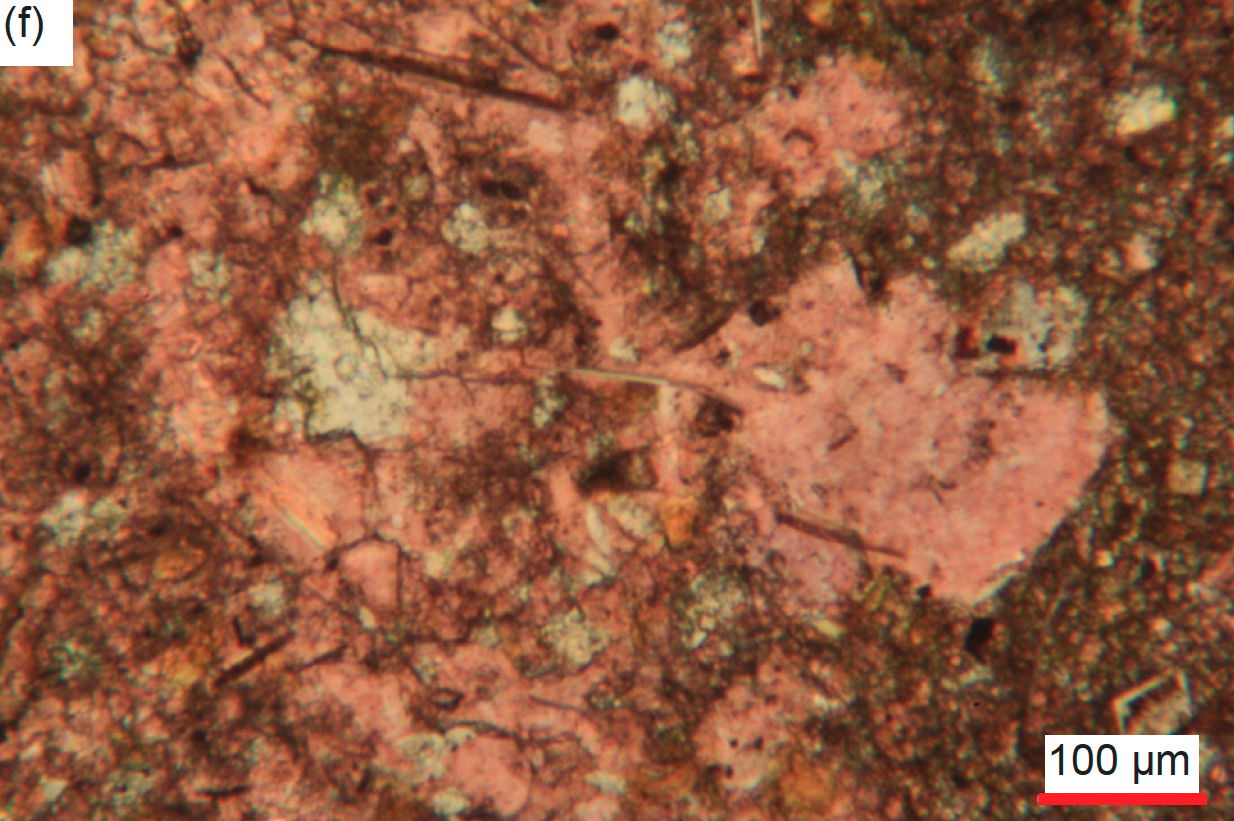
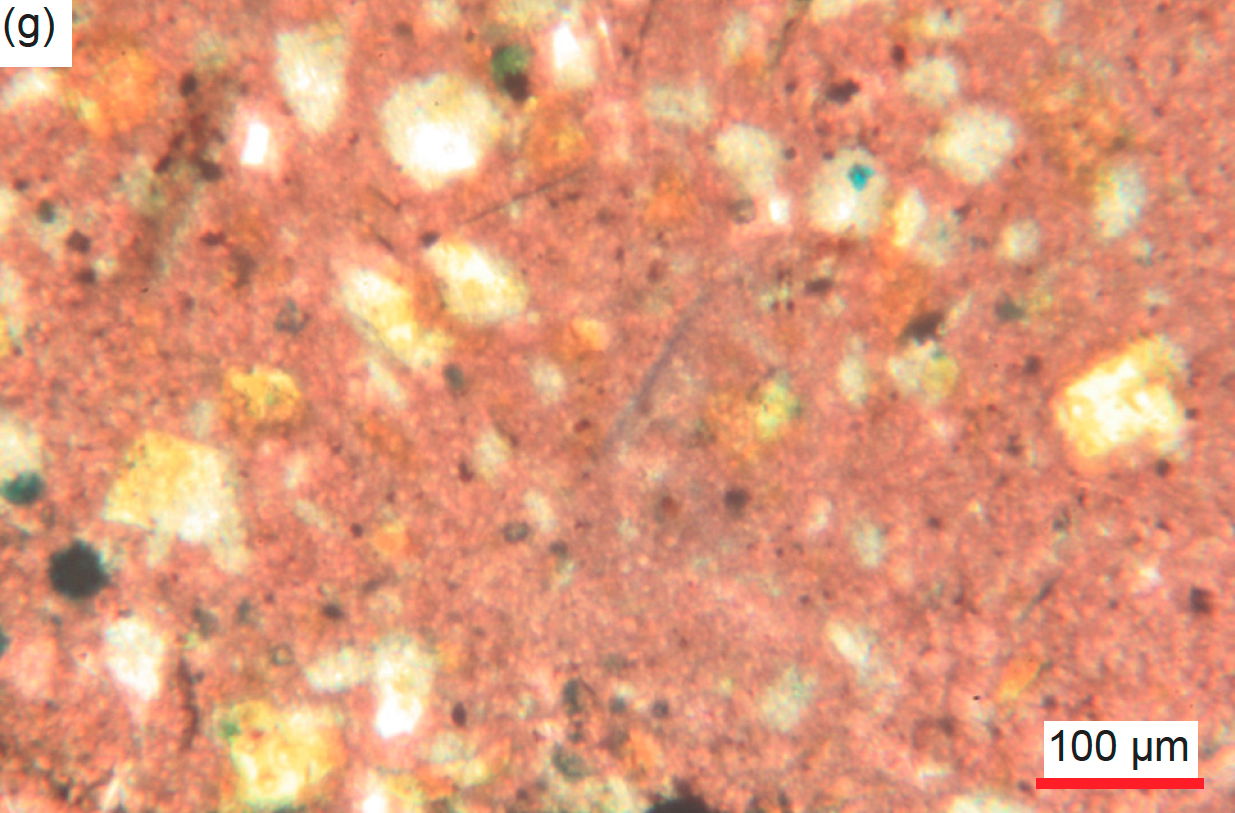
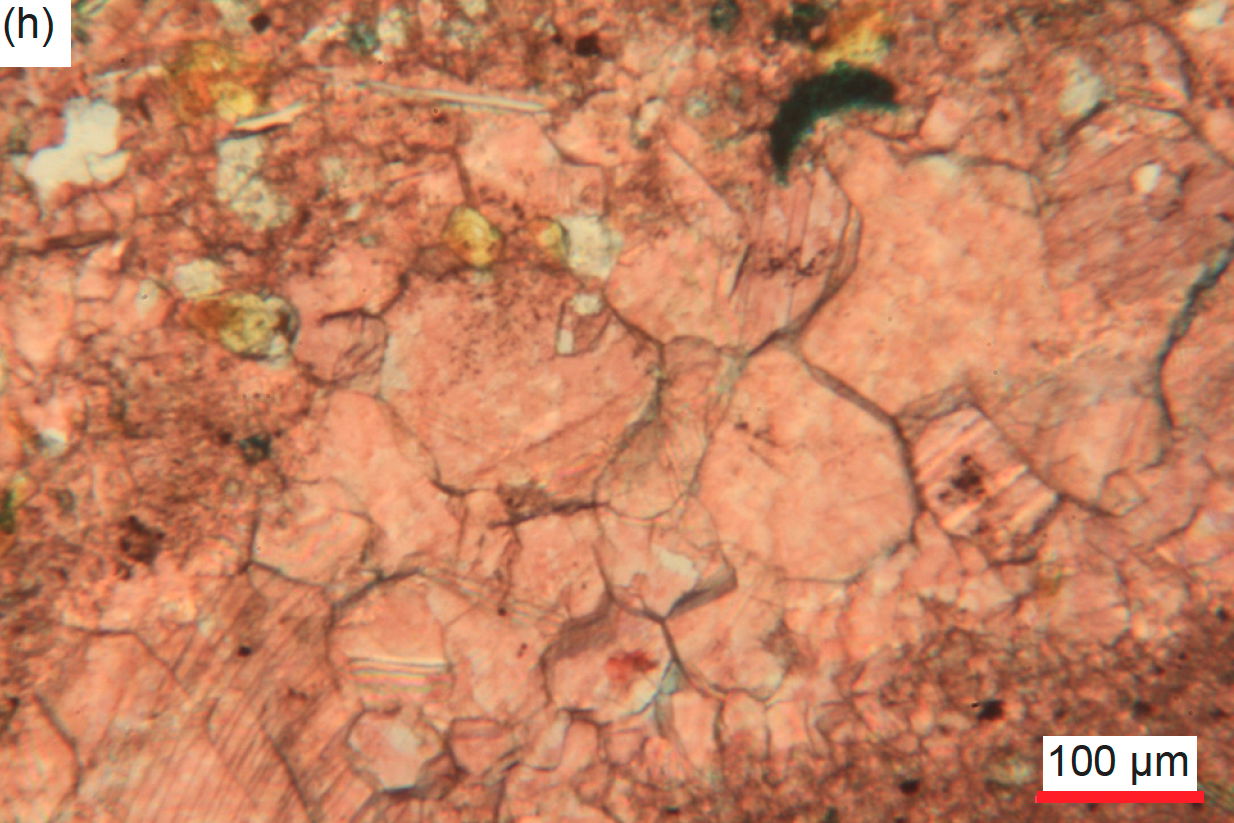
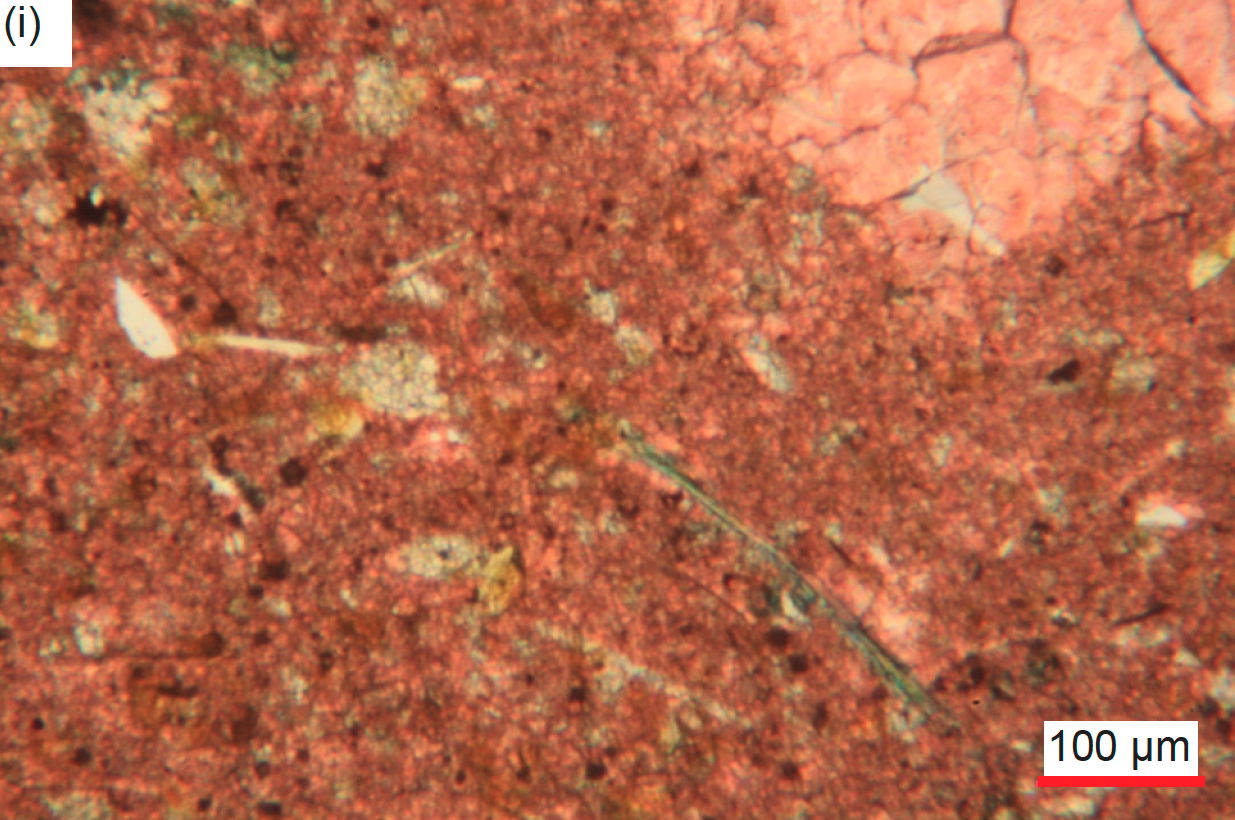
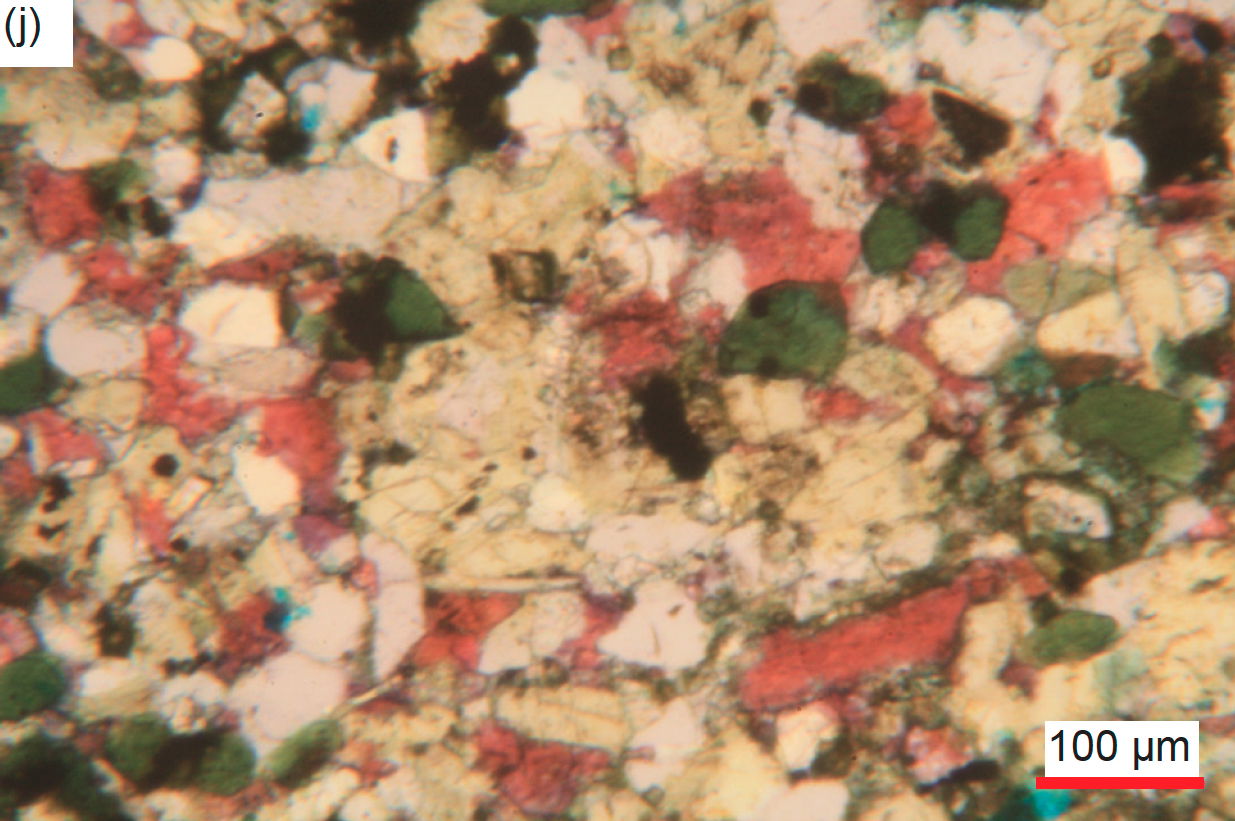
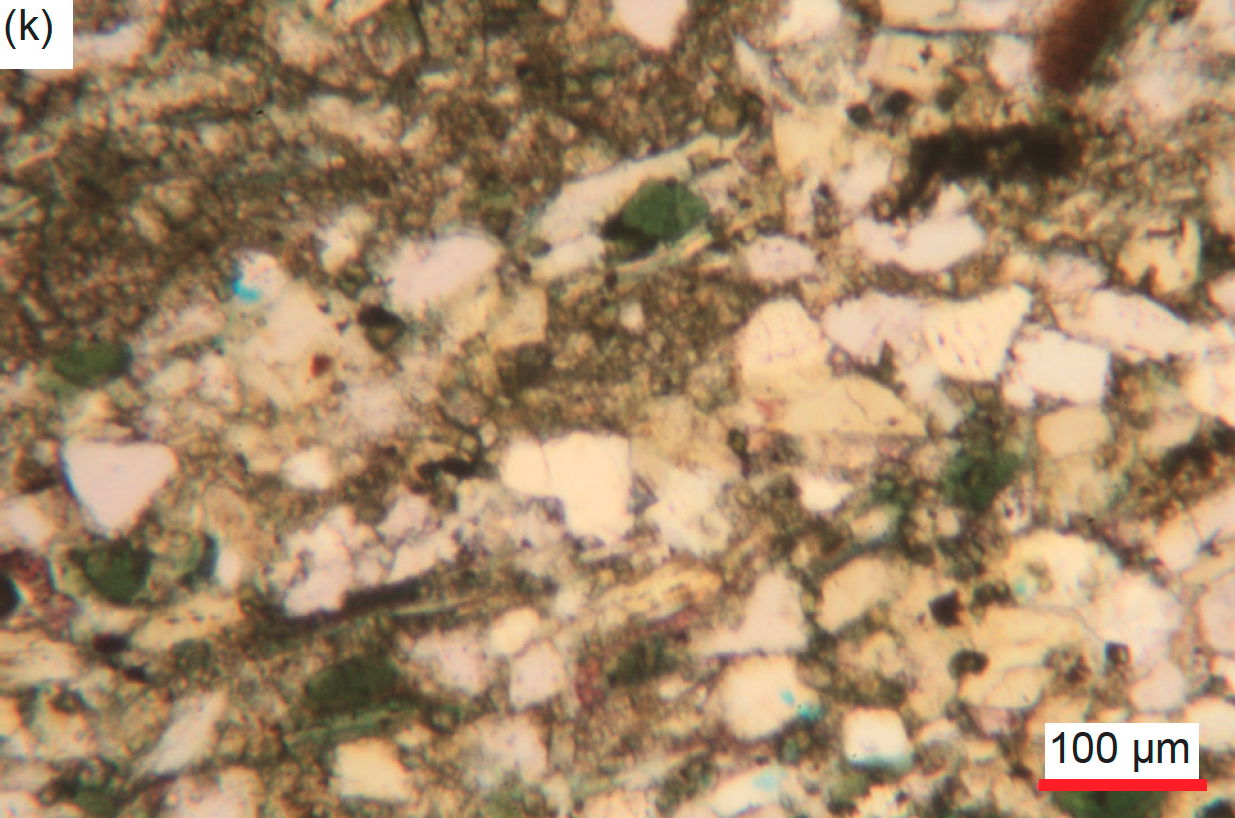
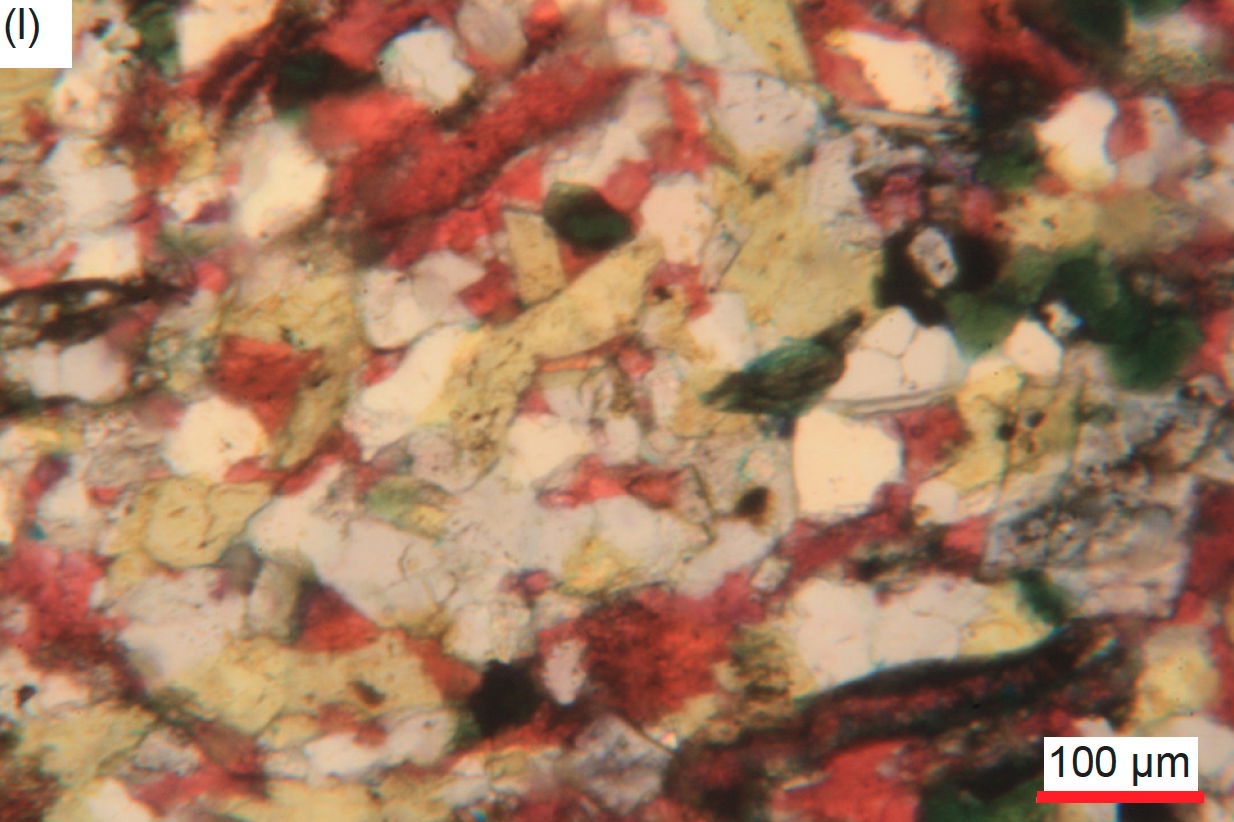
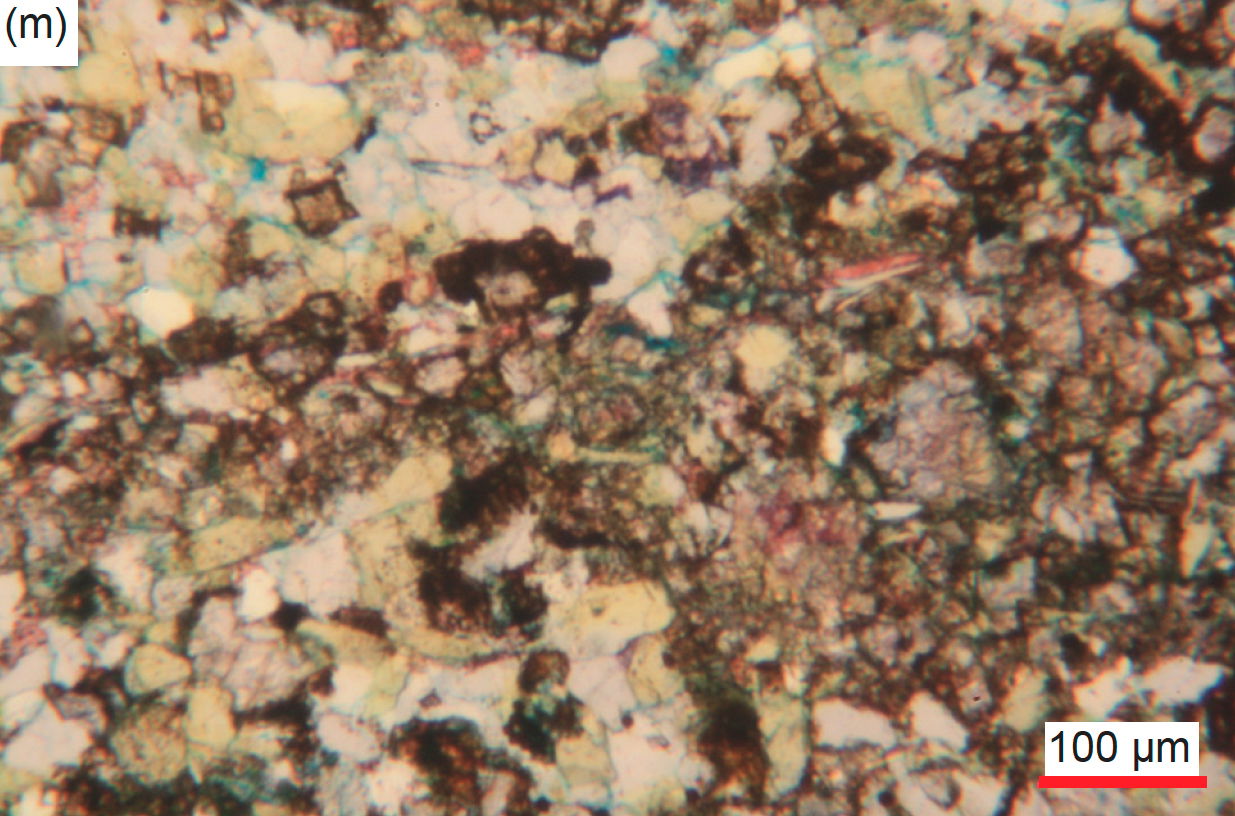
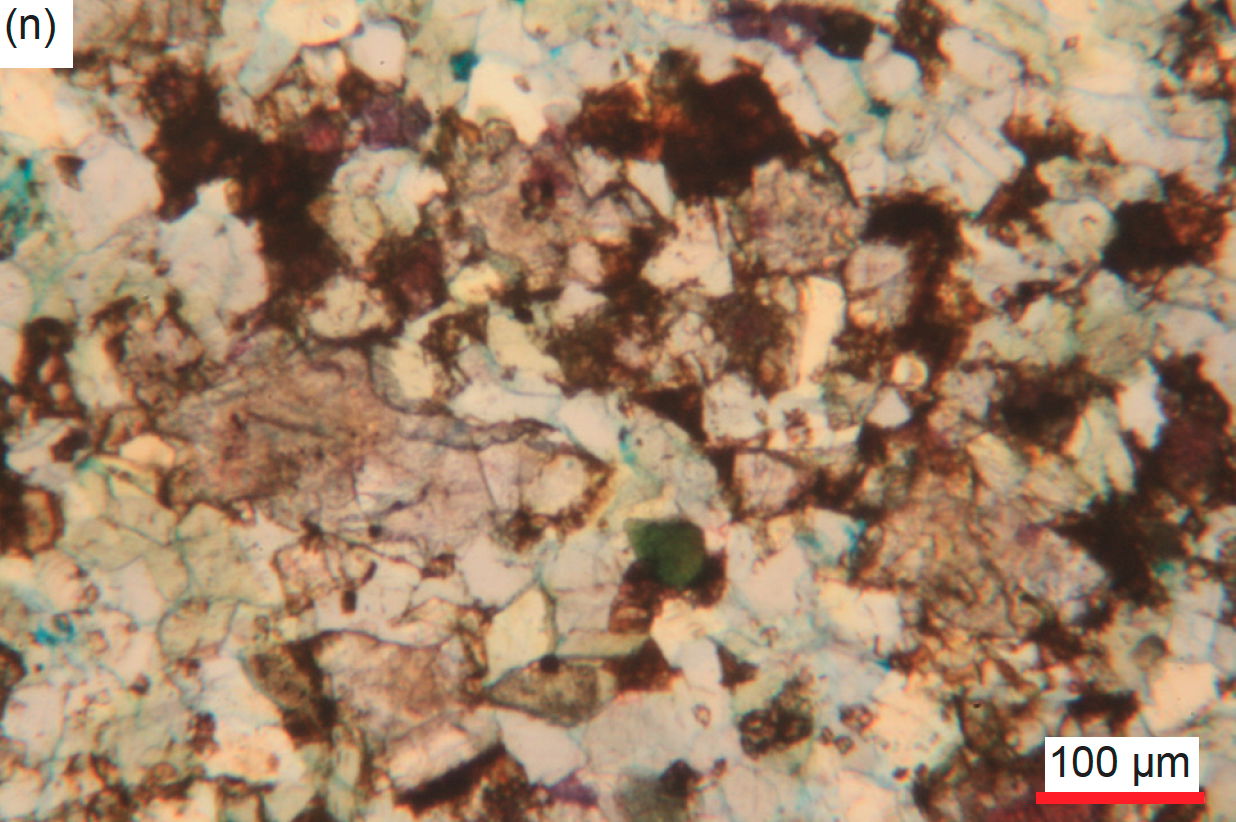
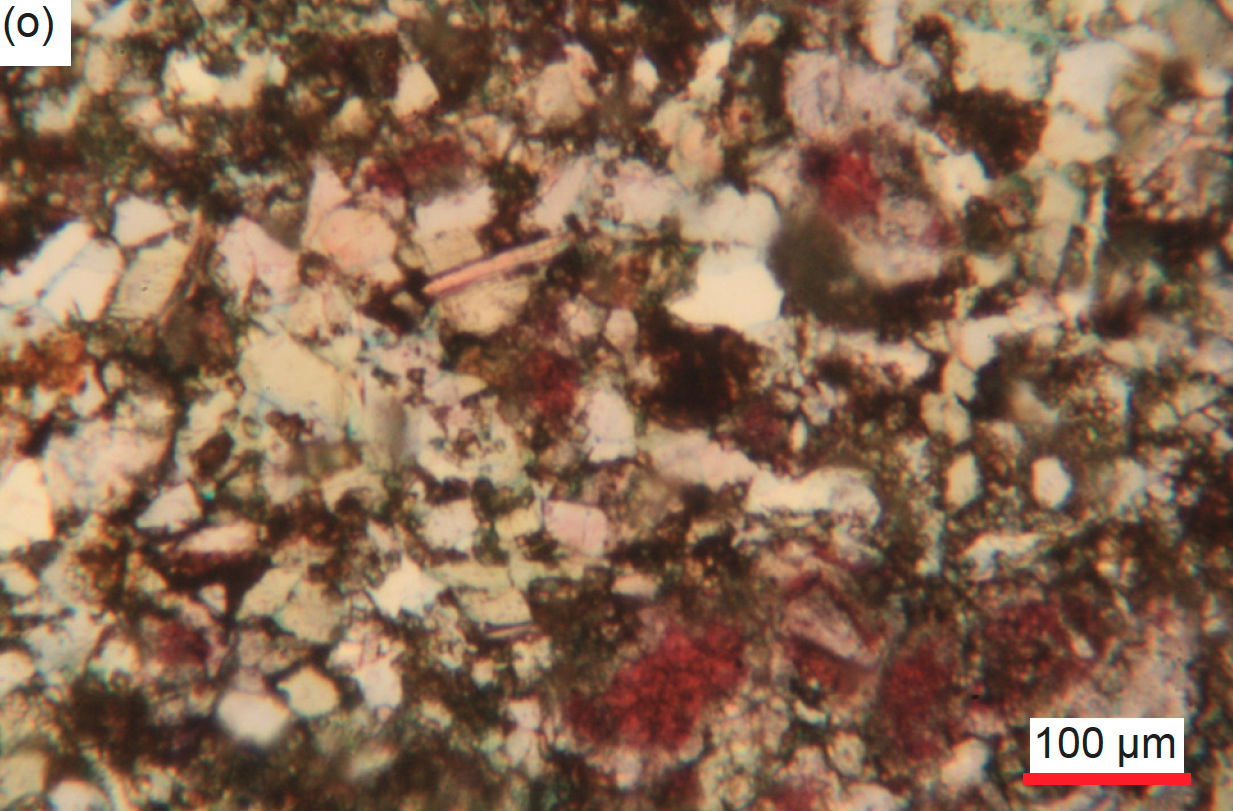
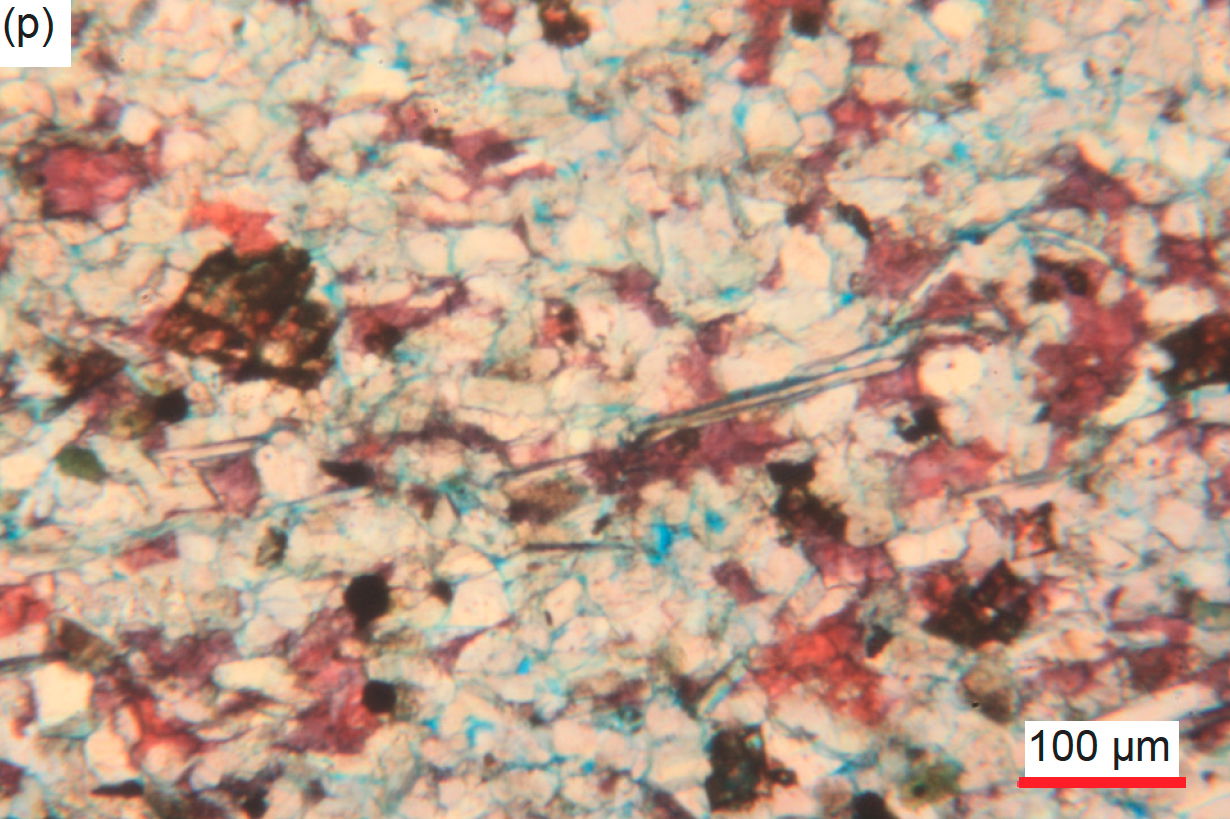
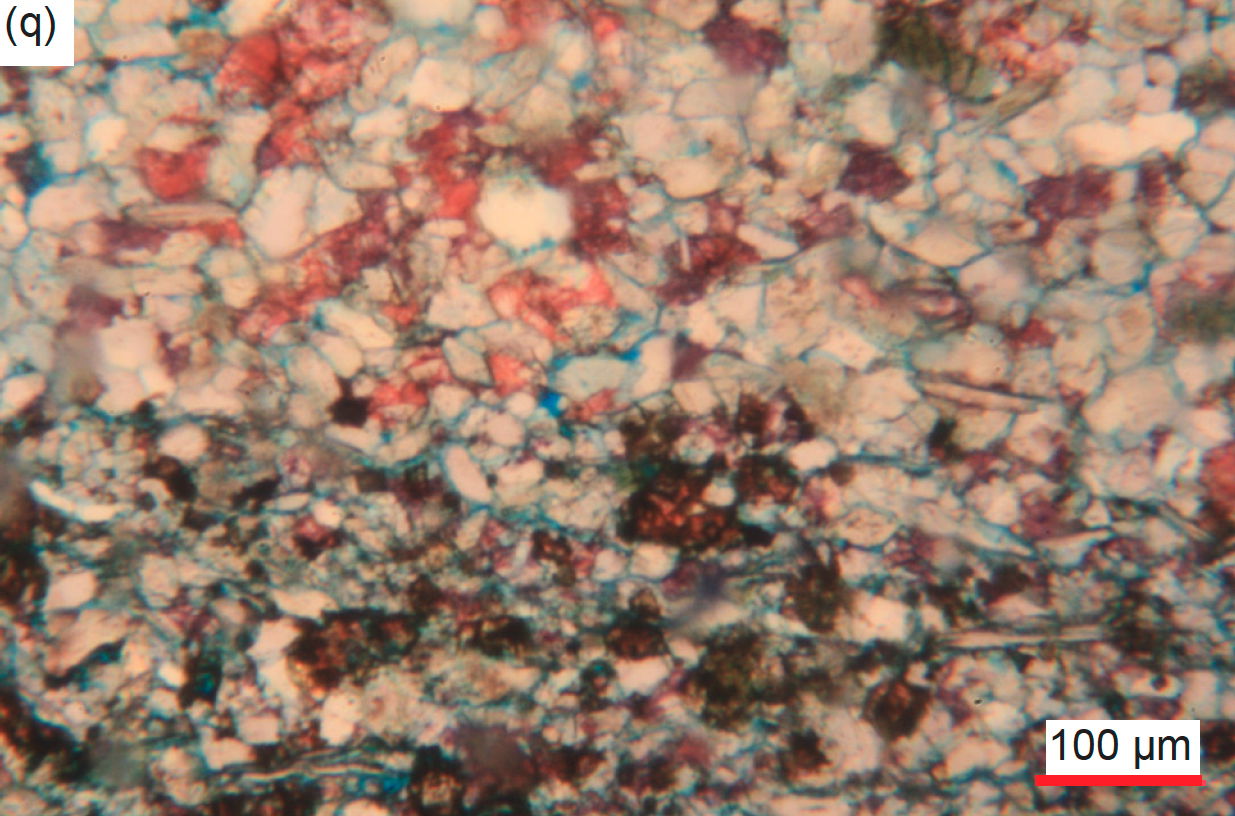
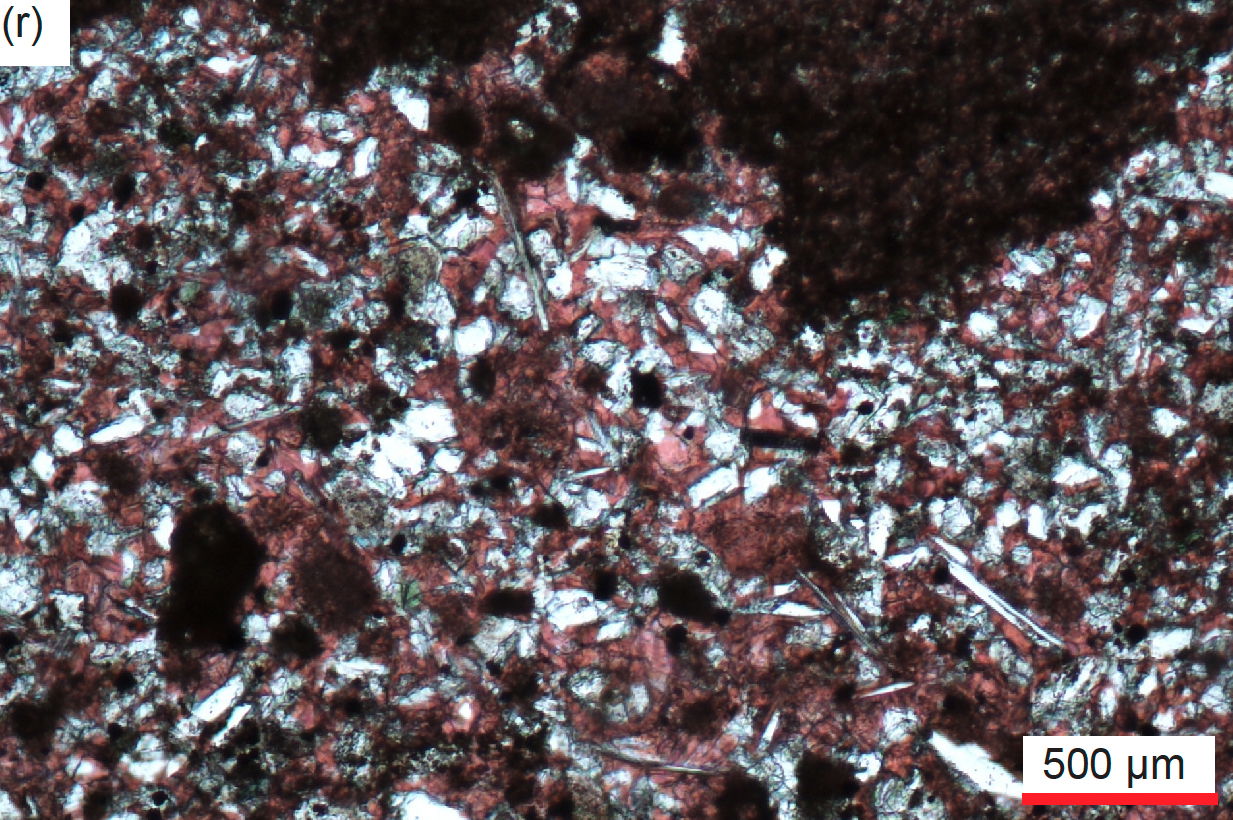
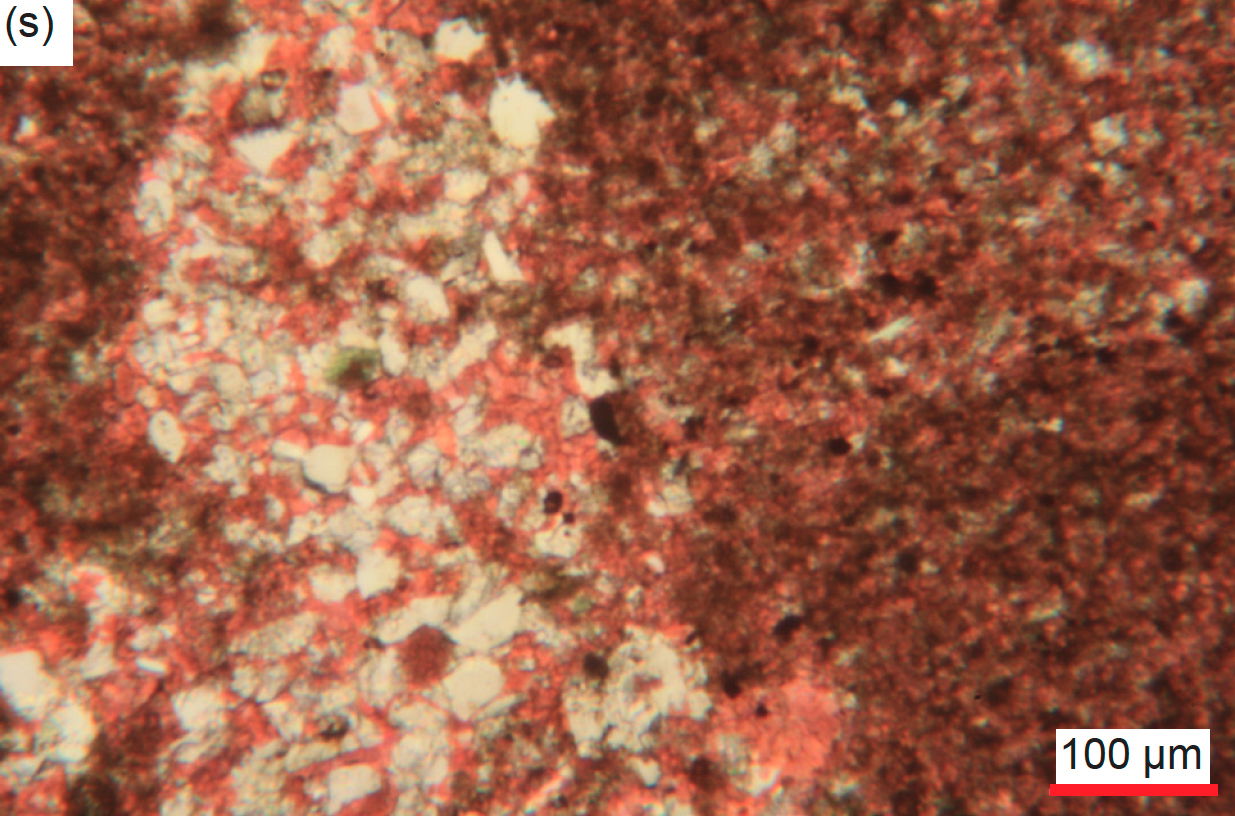
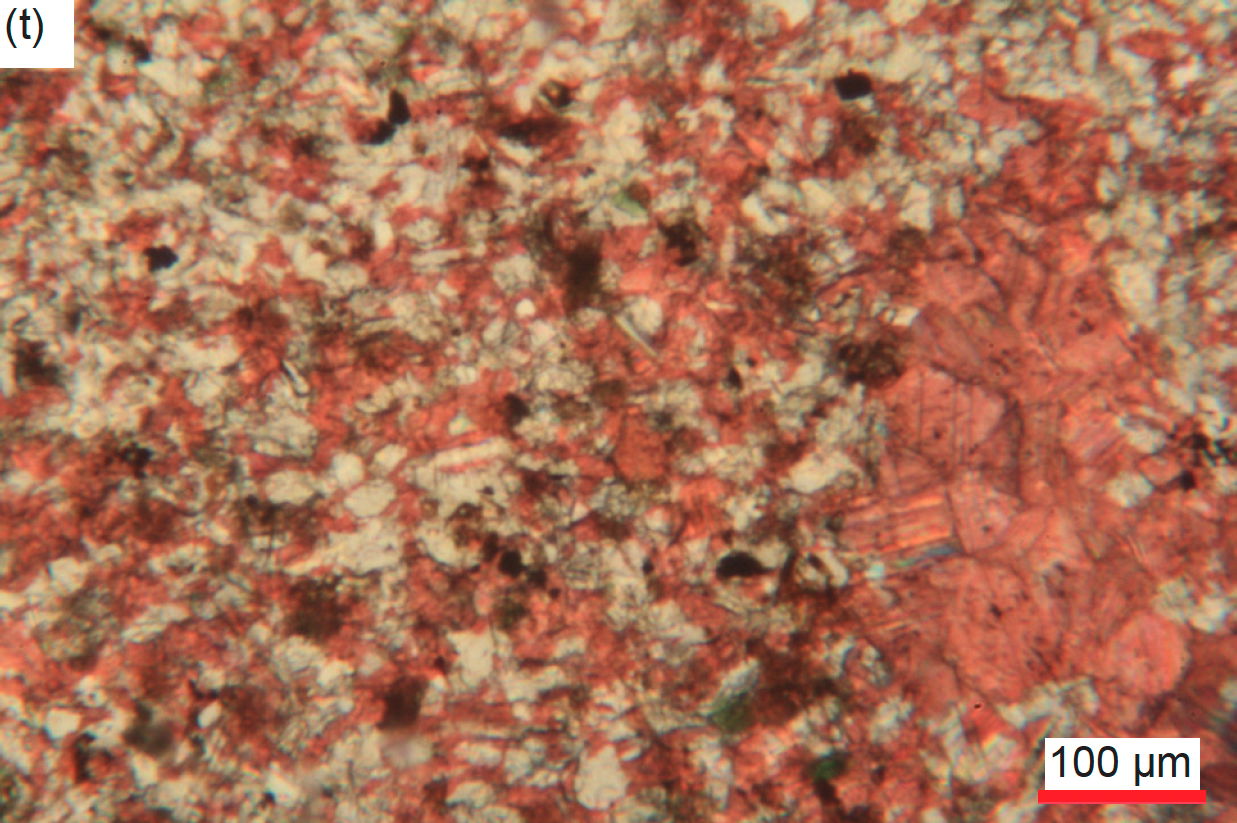
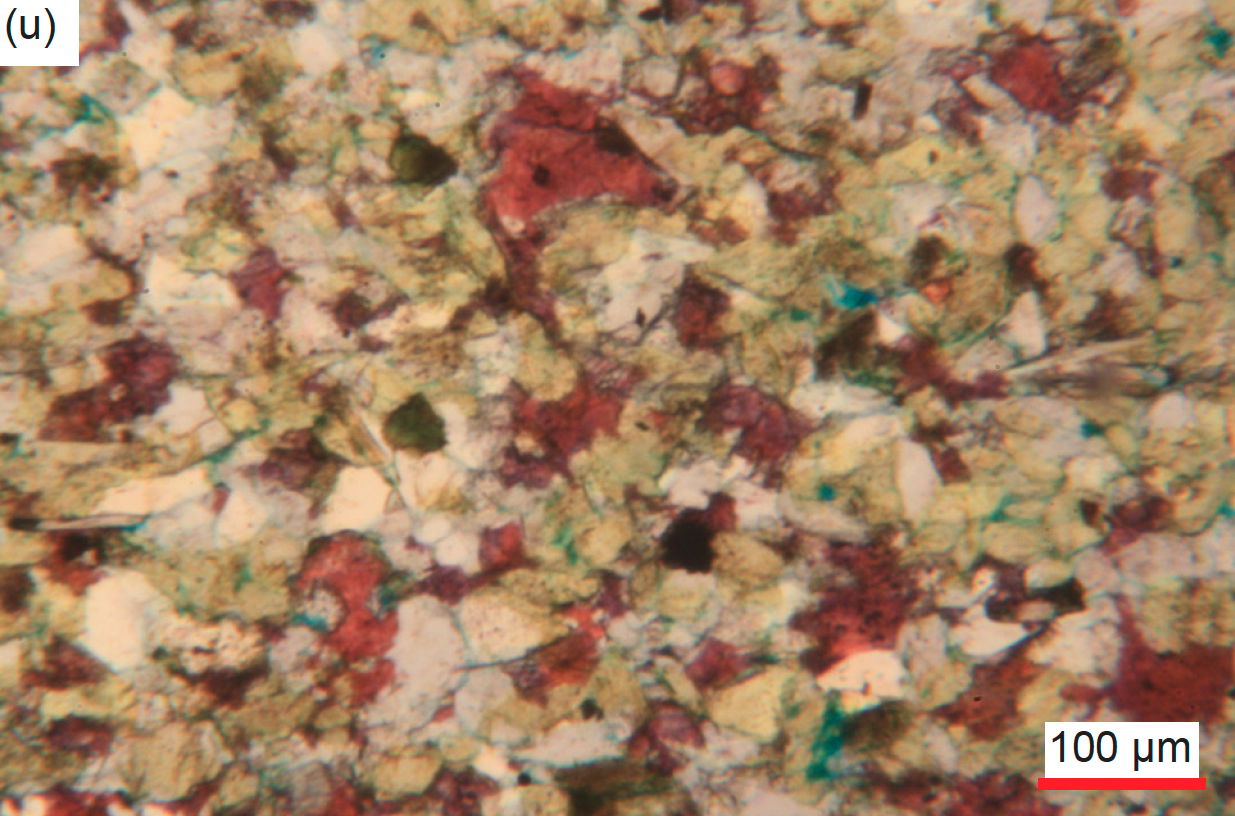
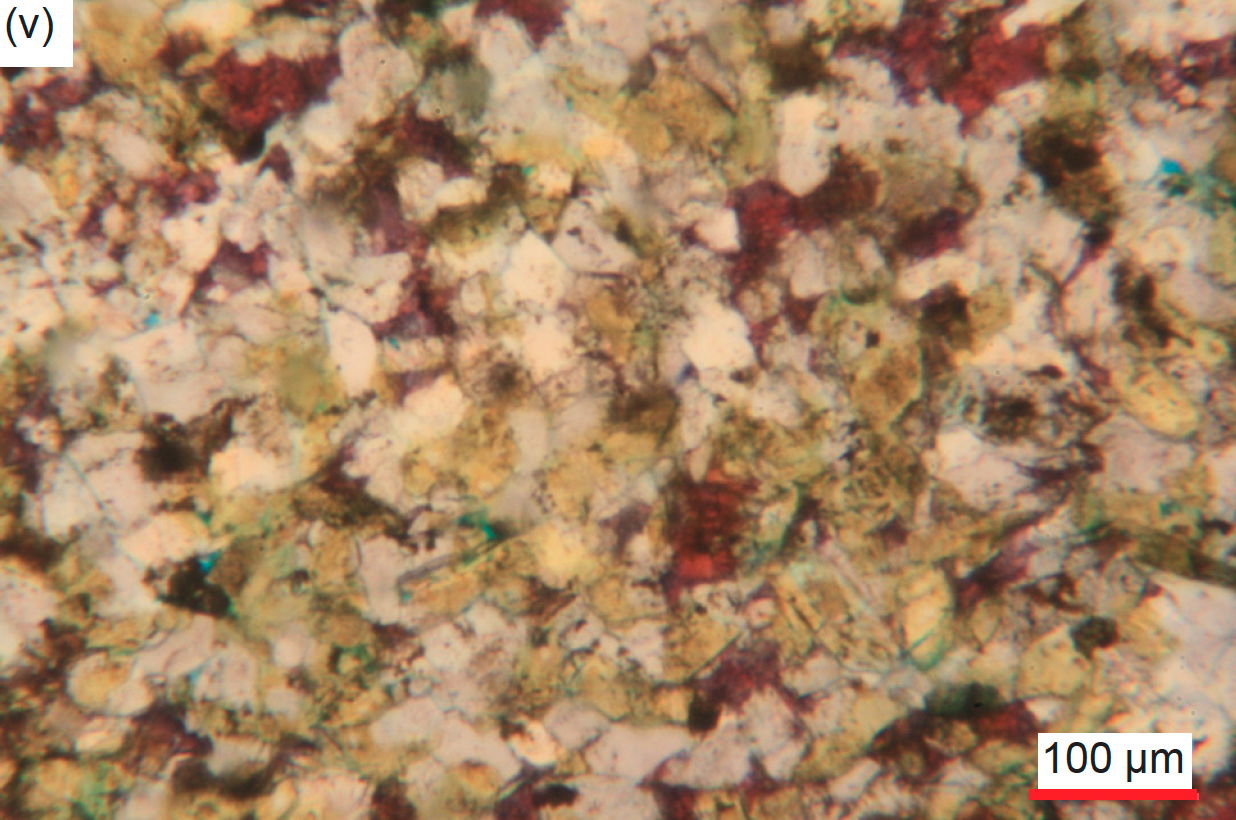
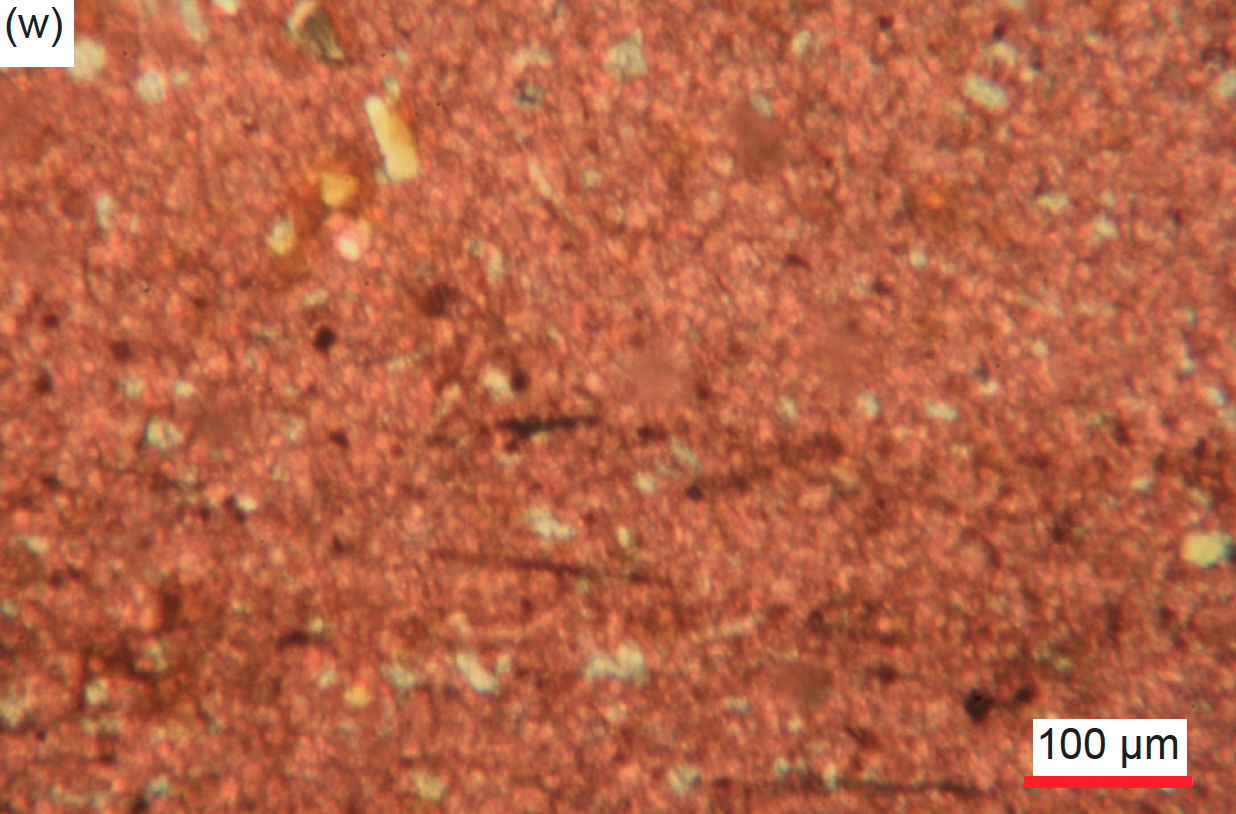
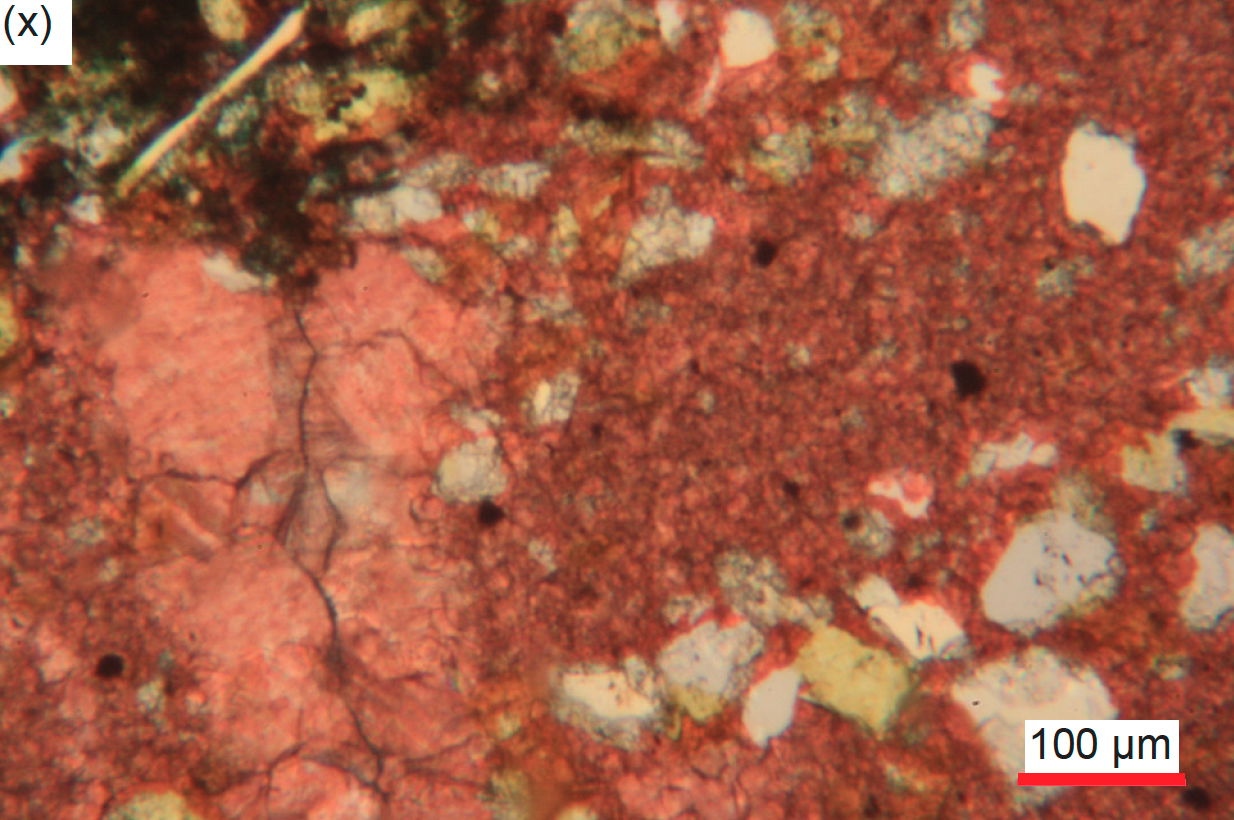
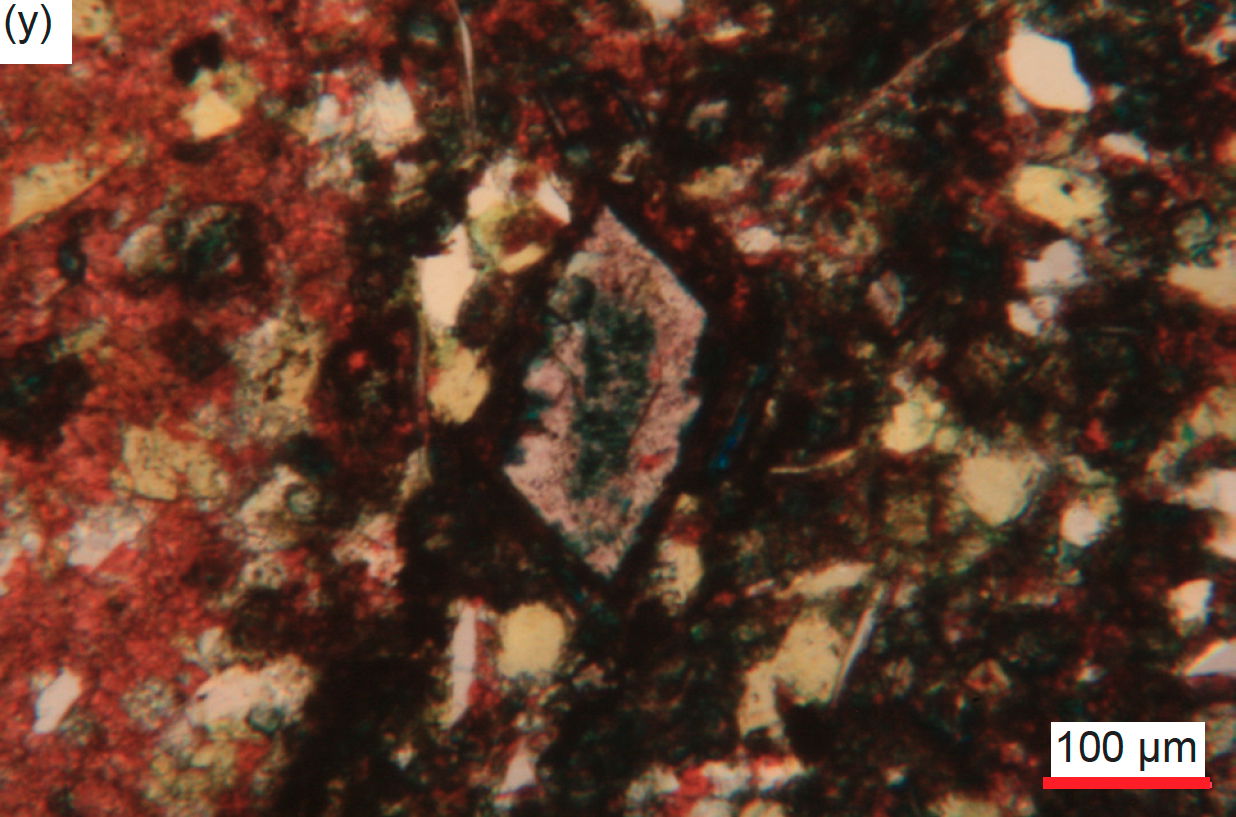
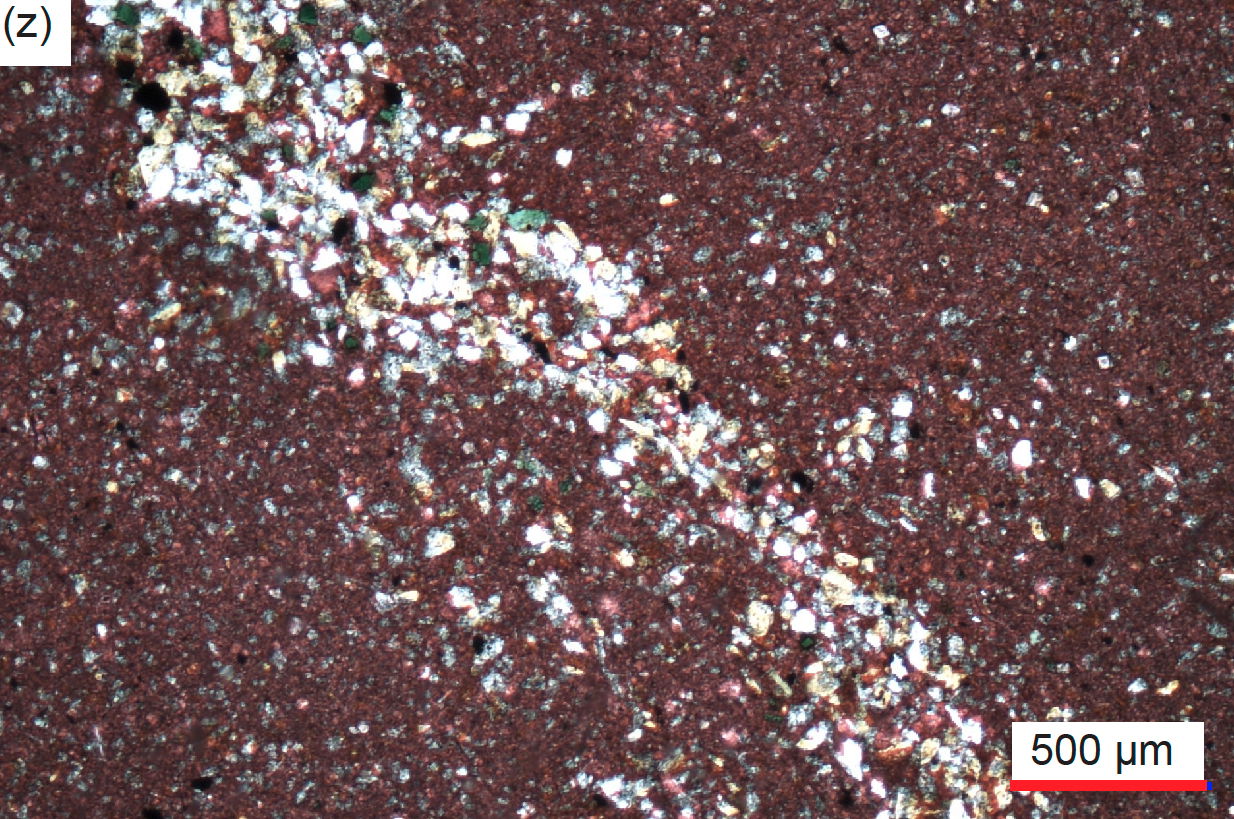
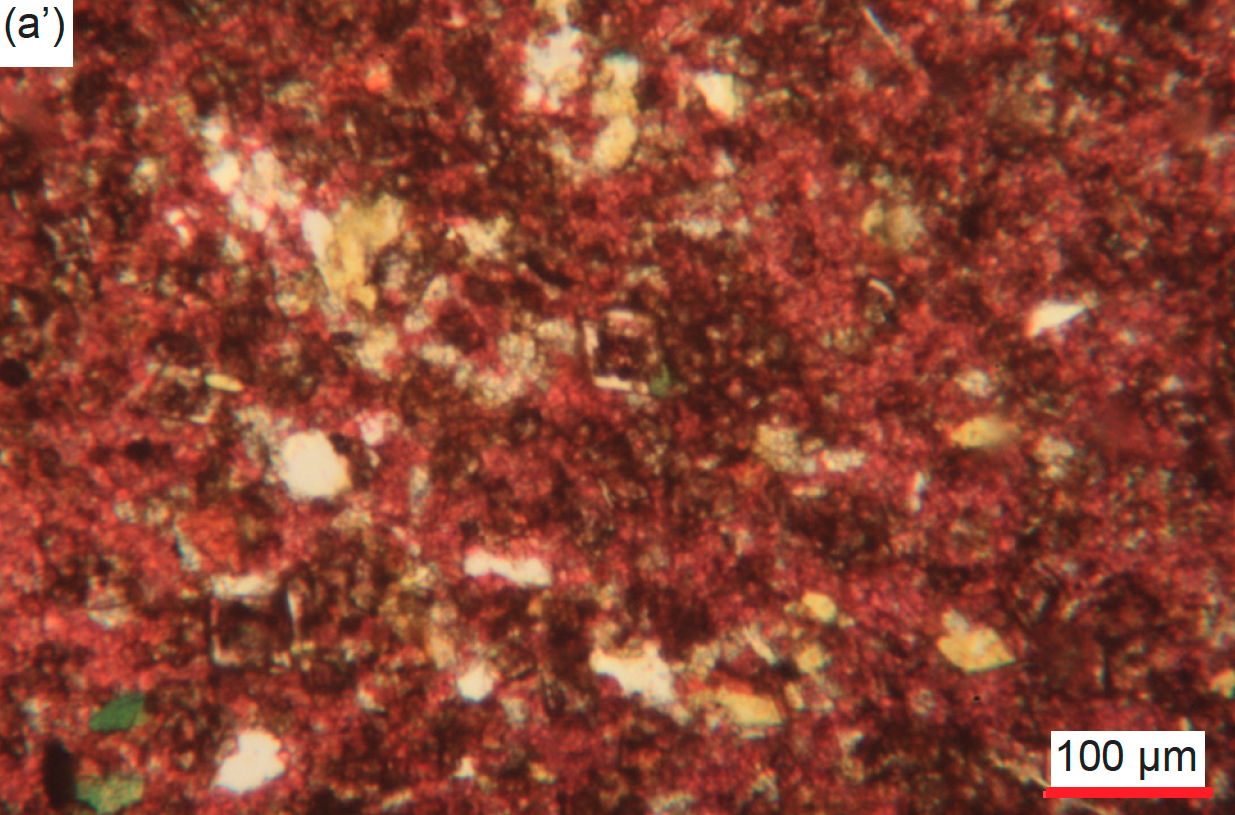
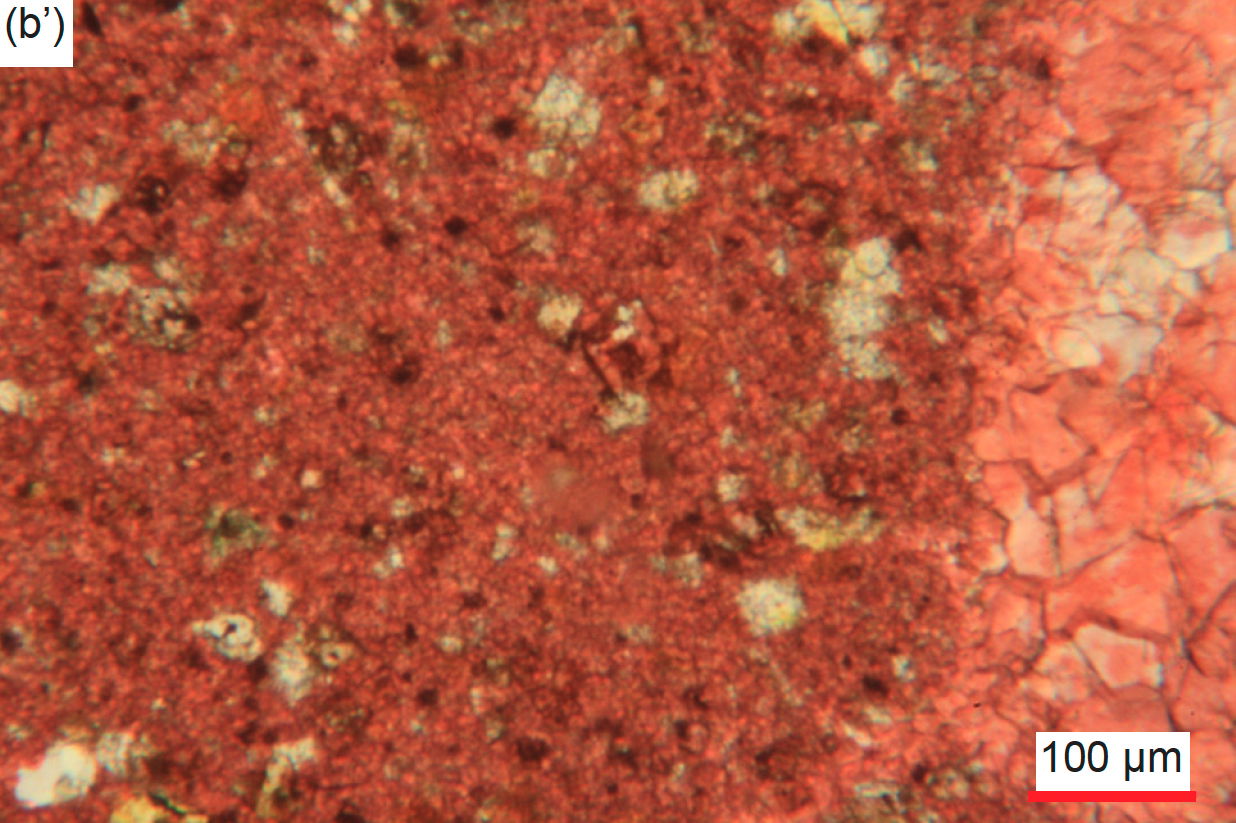
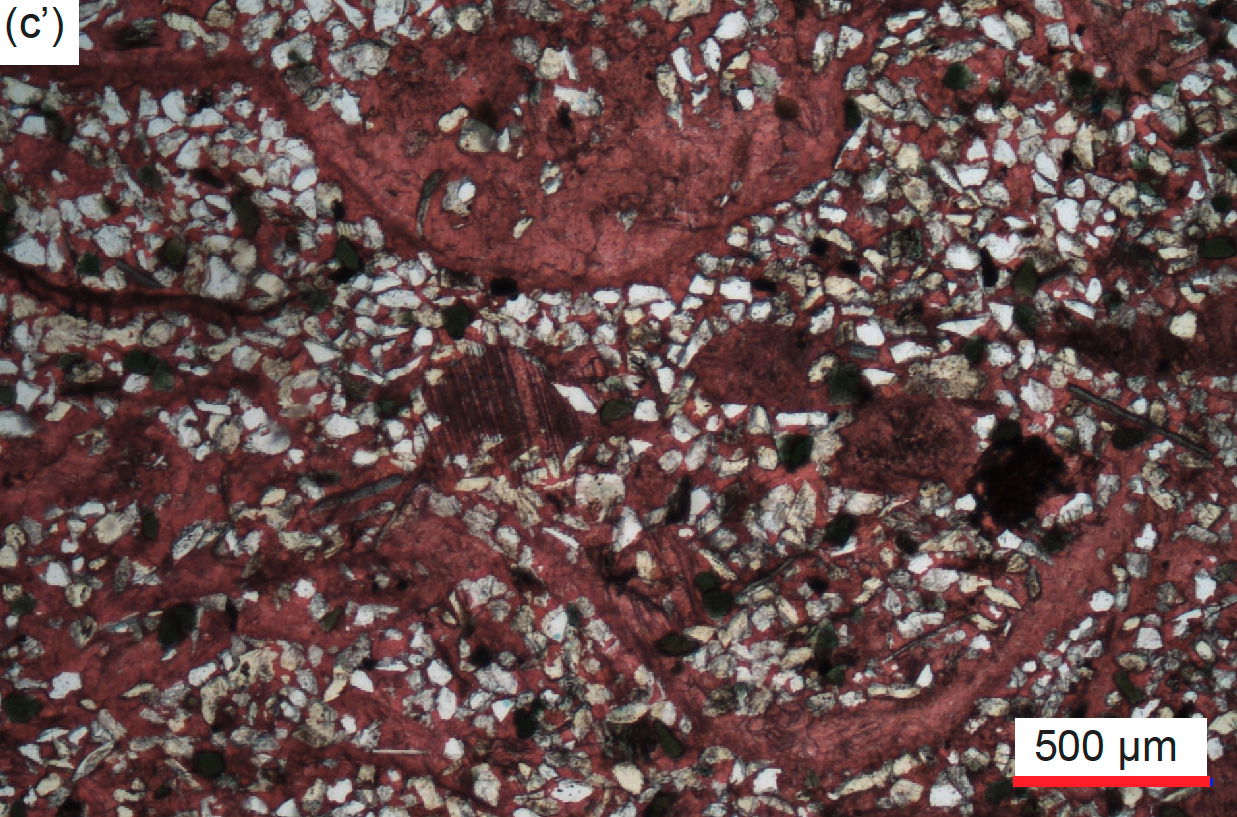
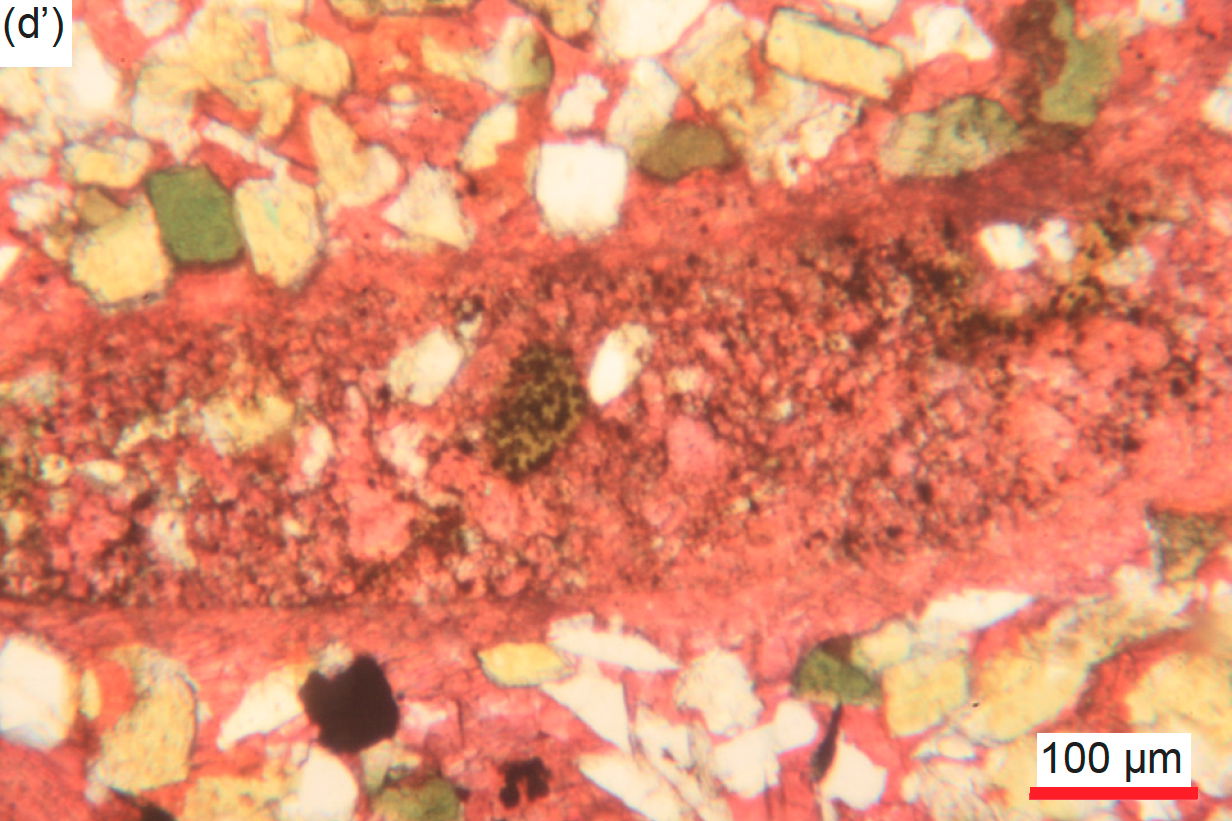
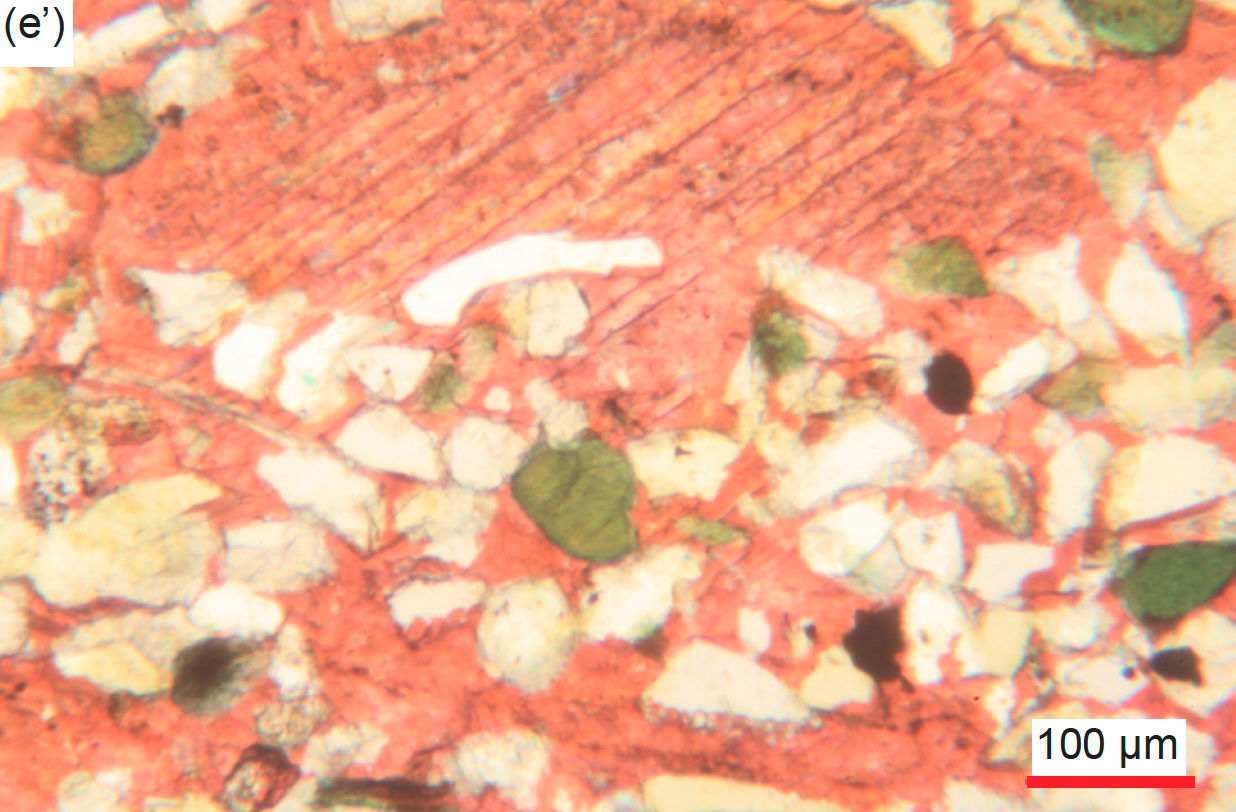
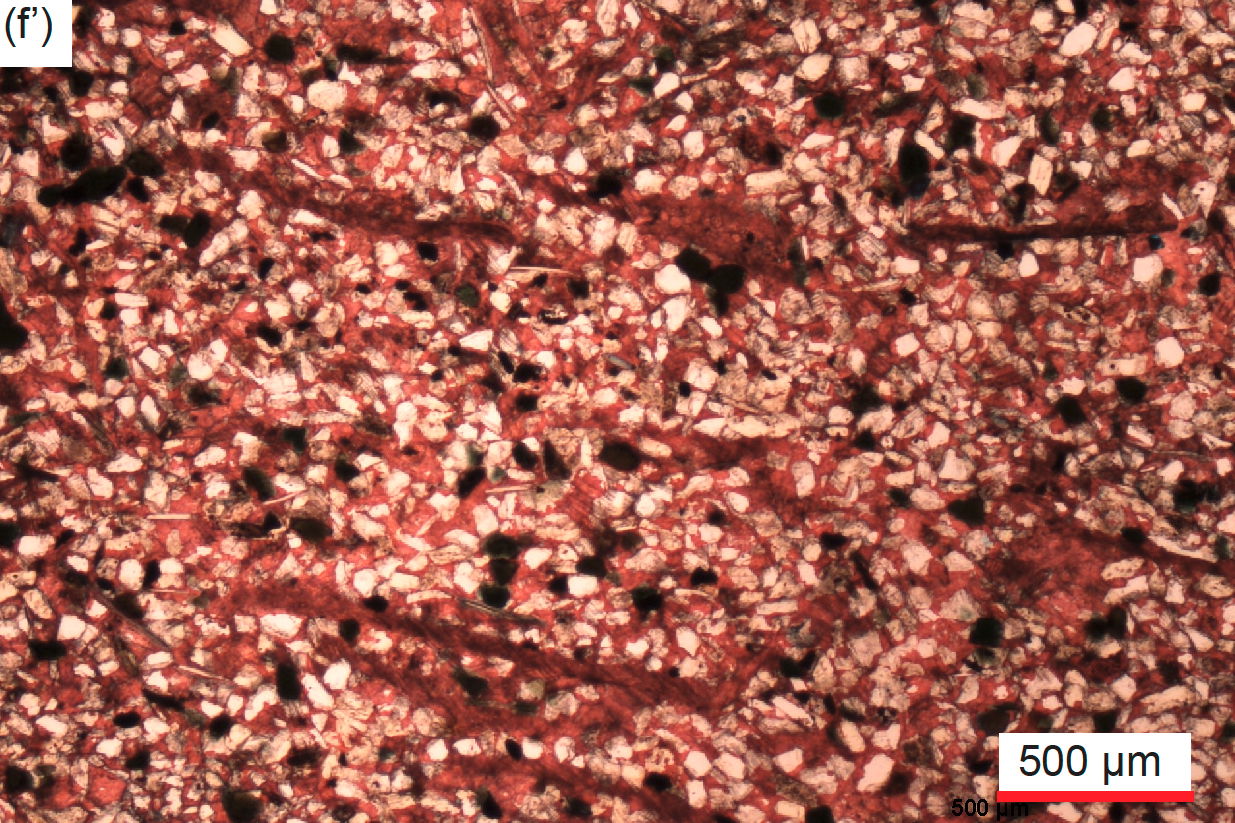
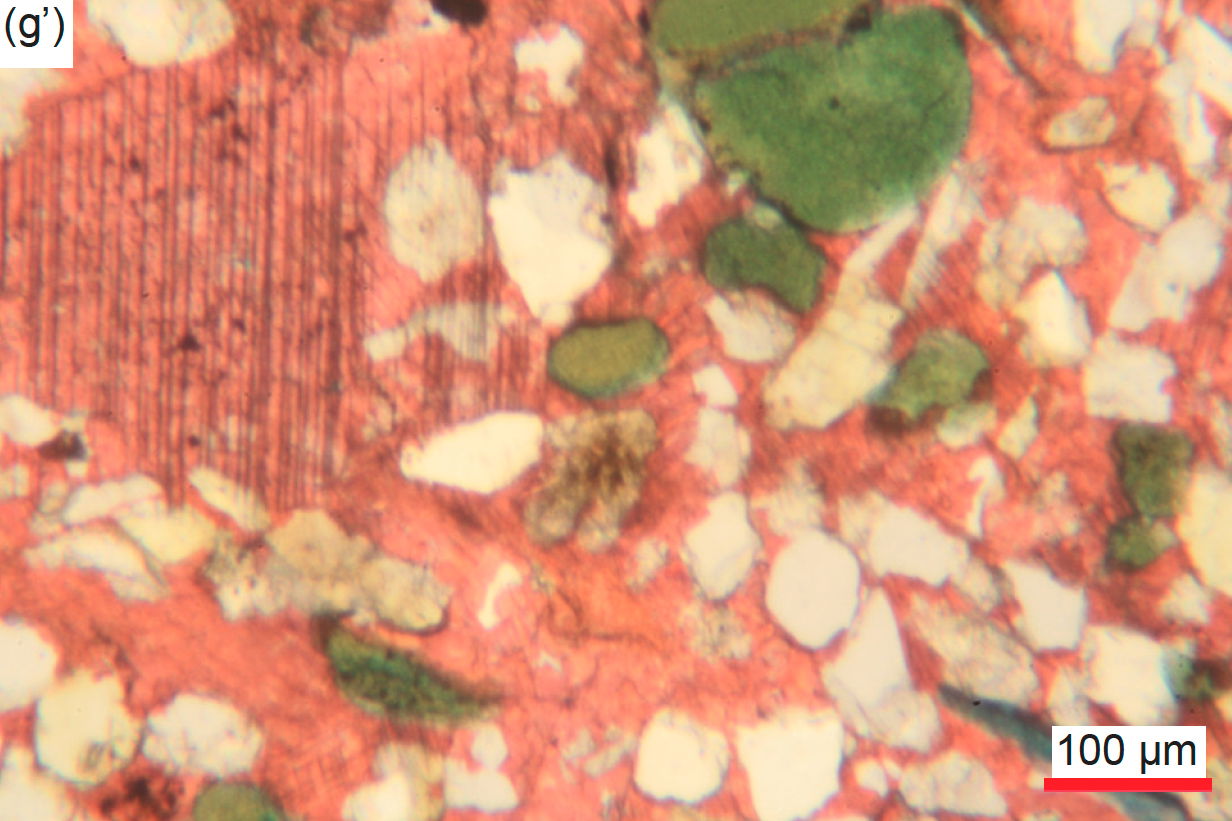
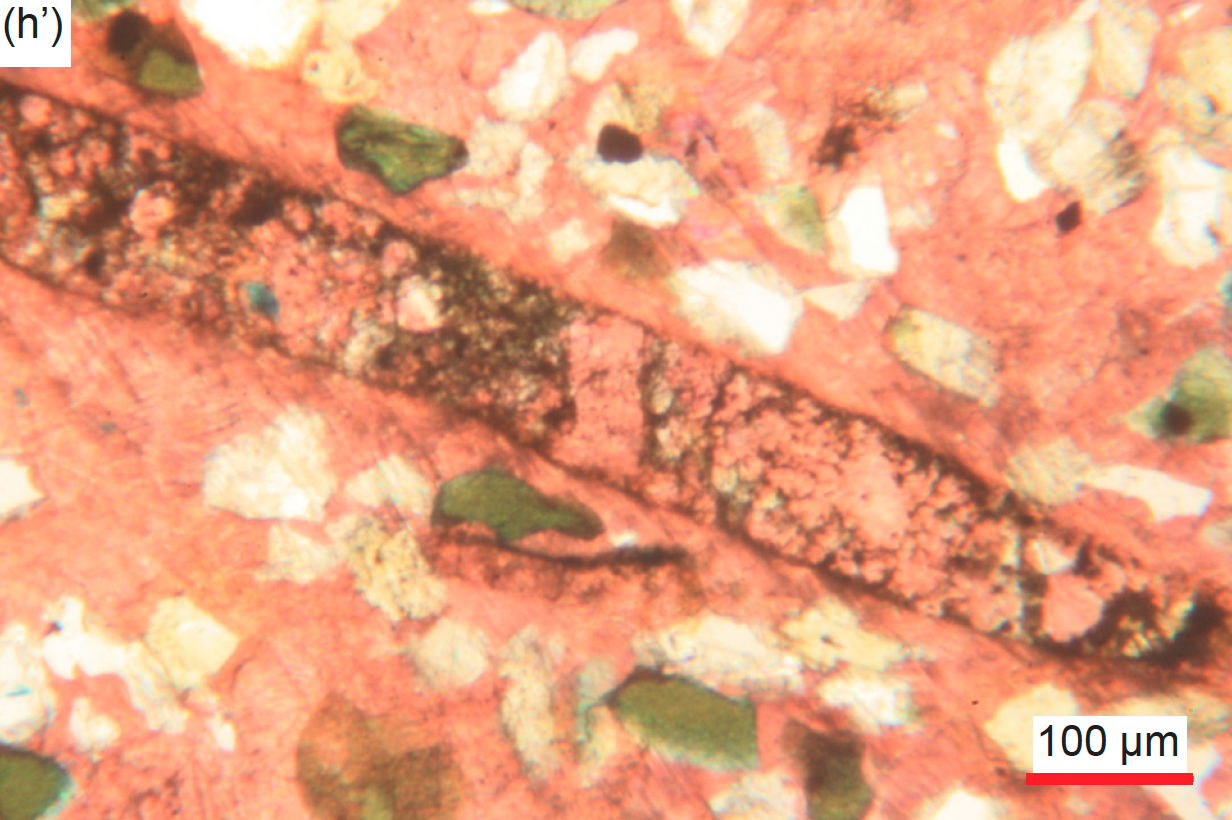
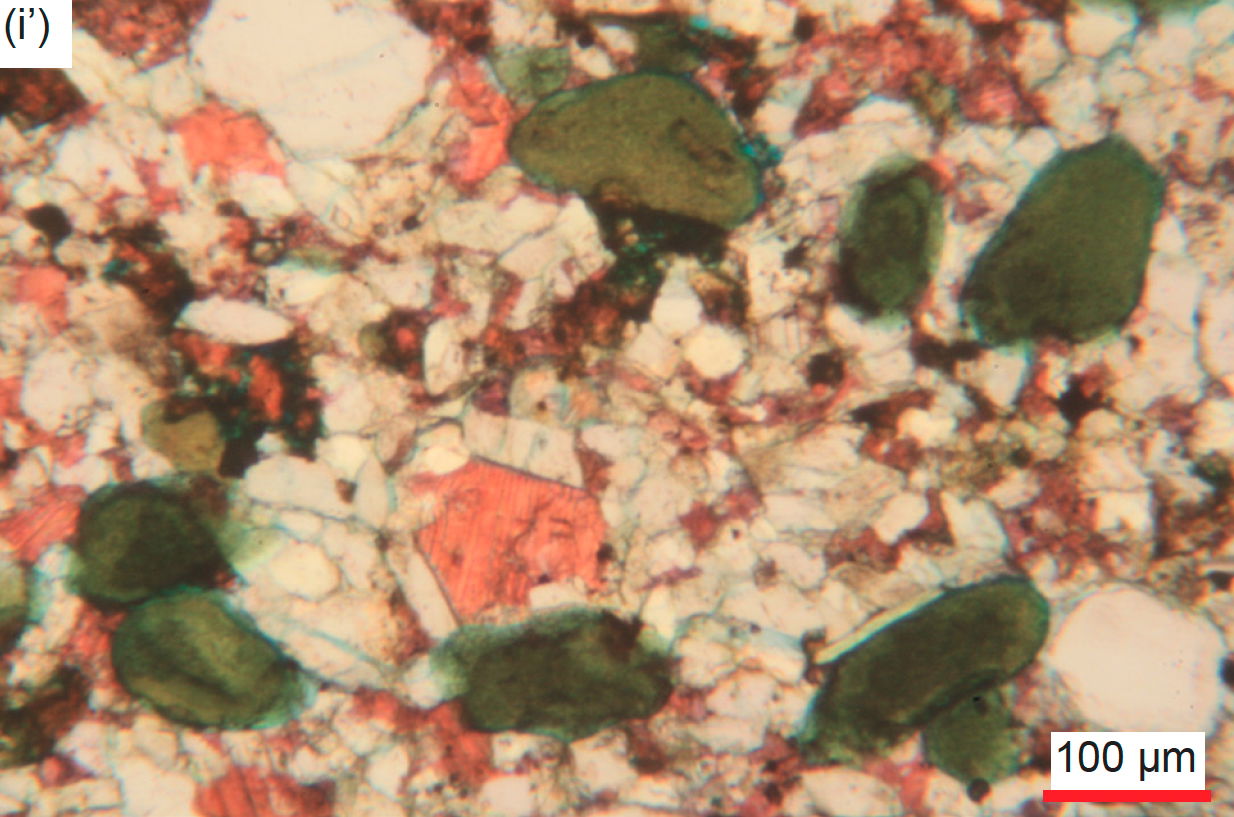
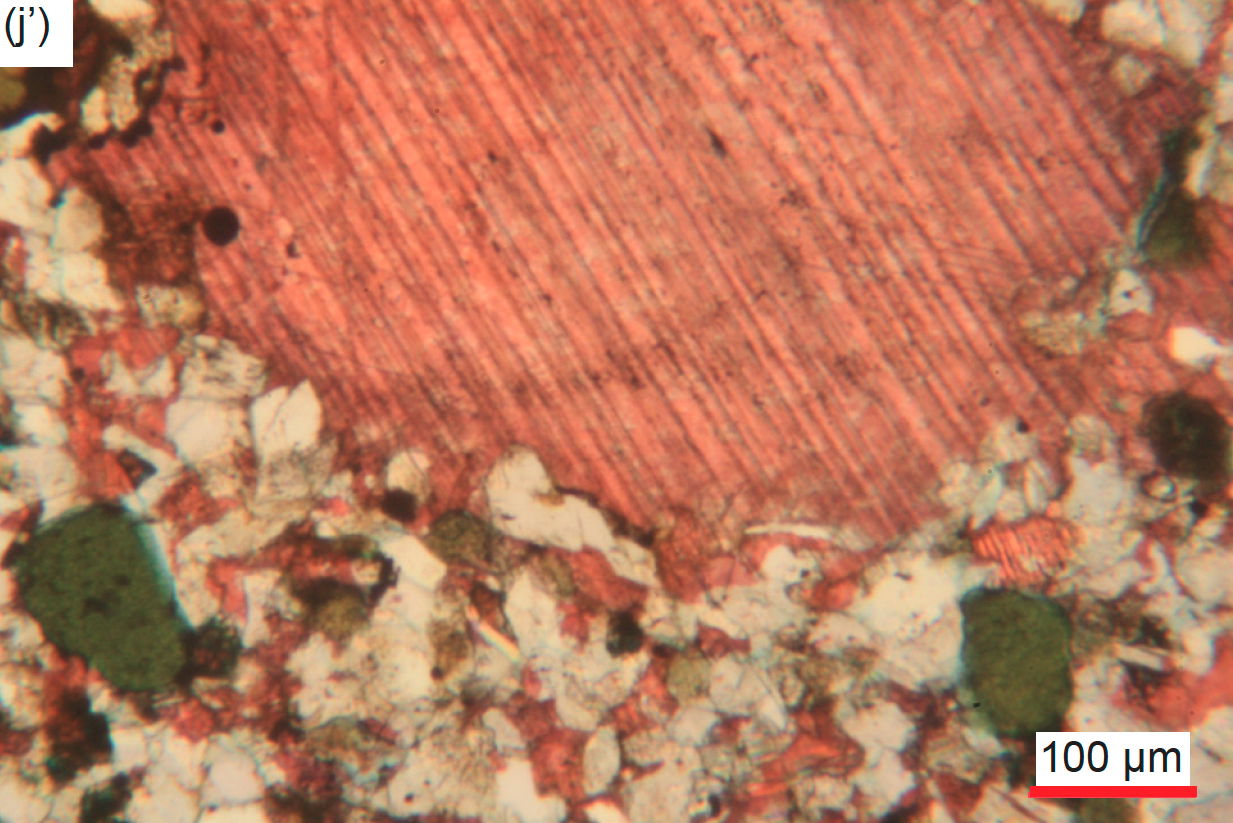
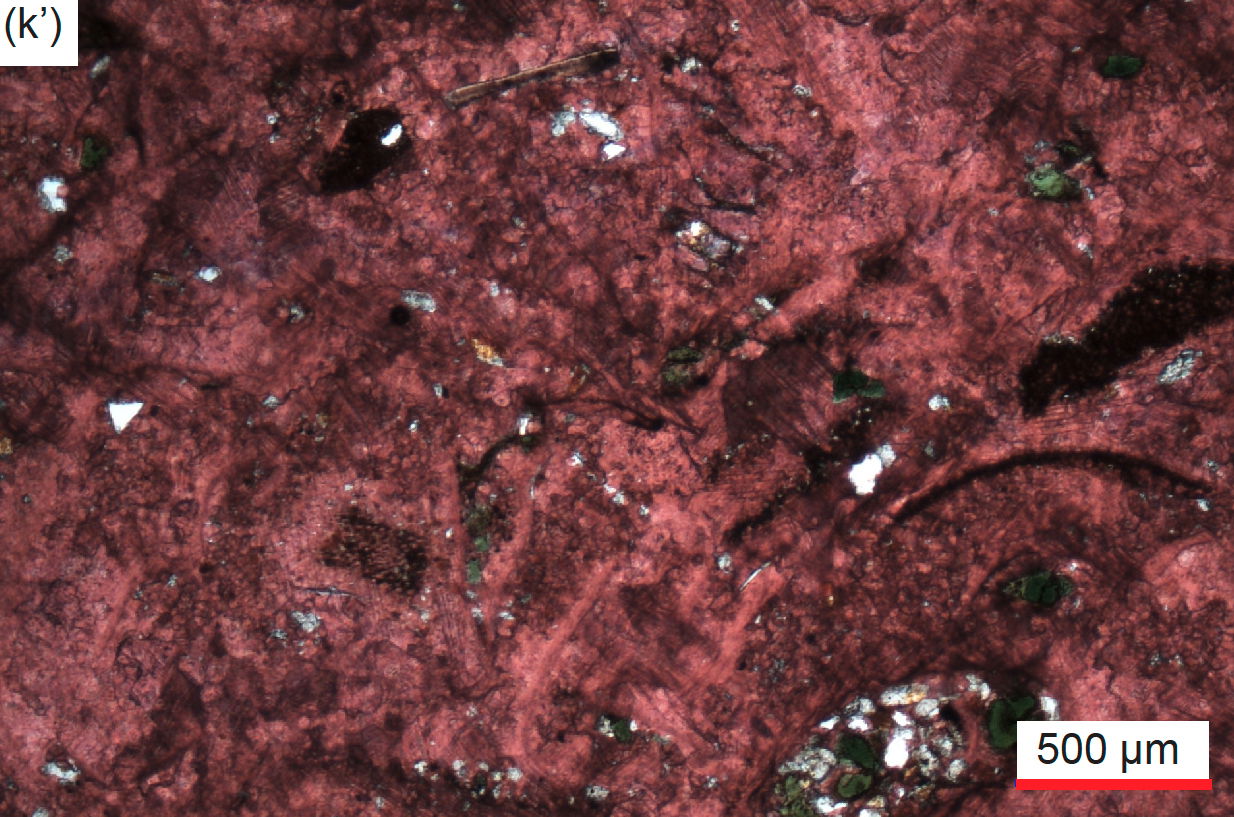
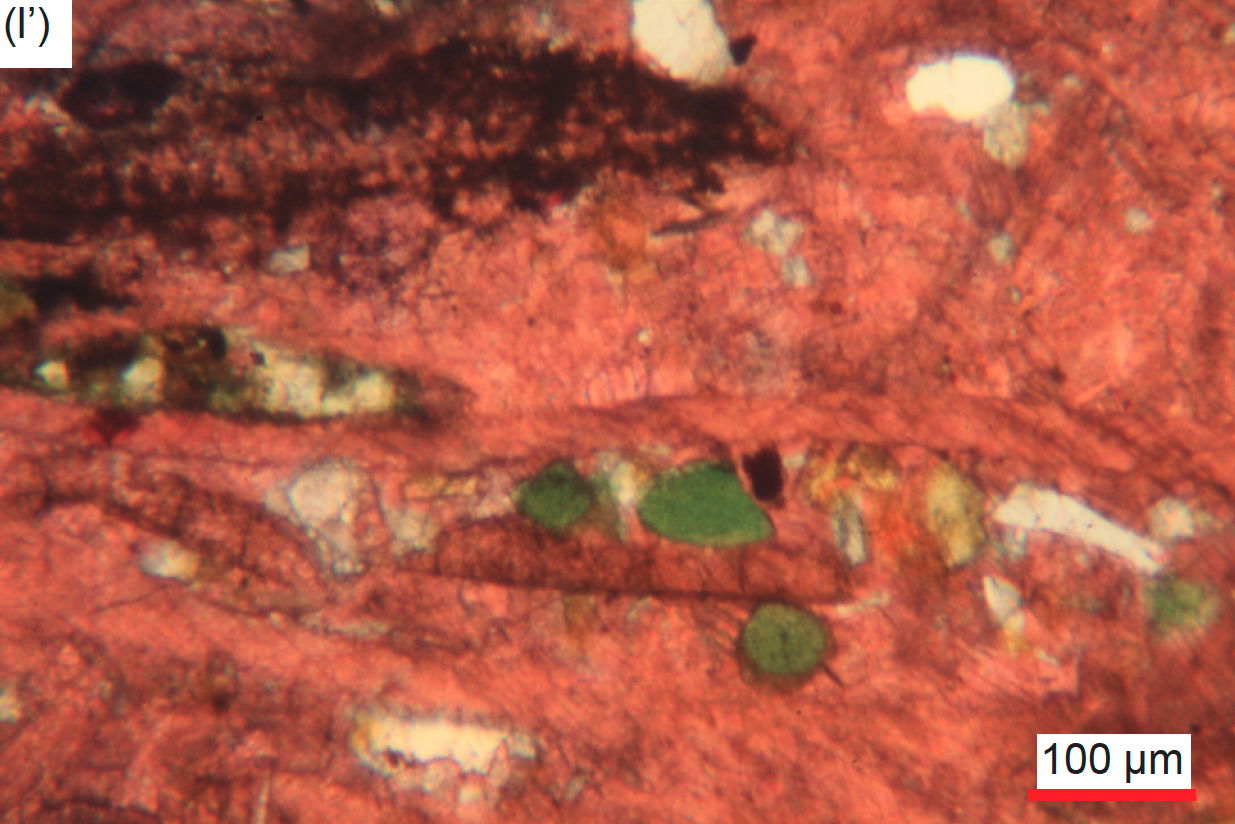
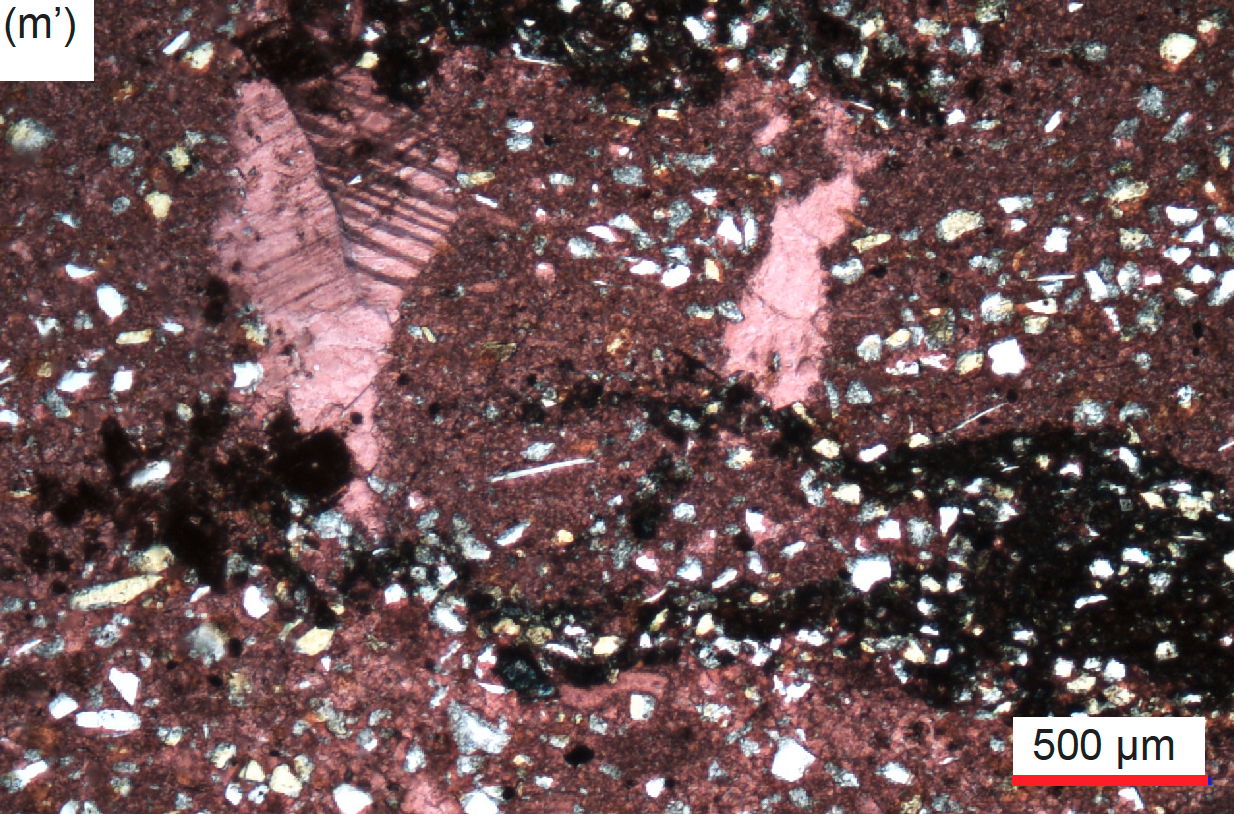
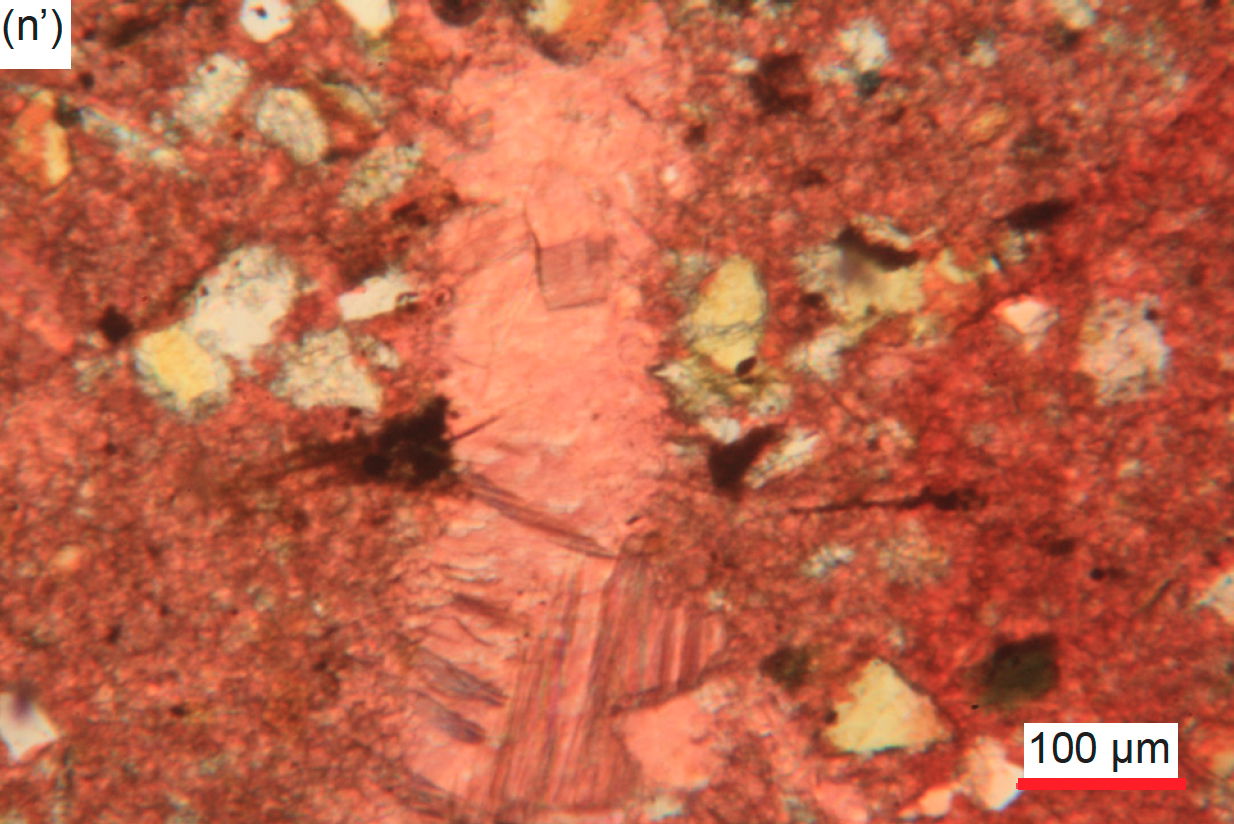
Fig. 36. A representative set of photomicrographs at various scales (as indicated) showing the cement in the Muav Formation samples. Distal samples: (a)–(c) MLS-01, (d)–(f) MLS-02, and (g)–(i) MLS-03. Matkatamiba fold samples: (j)–(l) MFML-01, (m)–(o) MFML-02, (p), (q) MFML-03, (r)–(t) MFML-04, (u), (v) MFML-05, (w)–(y) MFML-06, (z)–(b’) MFTB-01, (c’)–(e’) MFTB-02, (f’)–(h’) MFTB-03, (i’), (j’) MFTB-04, (k’), (l’) MFTB-05, and (m’)–(n’) MFTB-06.
In some samples, there are numerous scattered recrystallized tiny to very small and small-medium interstitial calcite grains and occasional rhombs, pink-stained and often iron-oxides-stained (sometimes heavily), usually isolated between other mosaic grains (quartz and K-feldspar) but sometimes connected to one another in small to very large patches (the latter with tiny quartz grains embedded in them), all acting as cement (fig. 36b, c, e, d’). The calcite cement grains sometimes have been recrystallized to form large and even huge platy crystals (with characteristic cleavage evident), or sometimes have formed large patches of recrystallized calcite, that in either instance engulf some of the mosaic quartz and K-feldspar grains (fig. 36c, f, h, t, x, e’, g’).
Occasionally within the calcite matrix where it is less iron-oxides-stained some scattered or clumped together tiny-very small calcite crystals are evident and elsewhere there are small, medium, and large blotches, some irregularly-shaped, and thick linear patches of very small to small-medium bladed tabular calcite crystals with no staining of iron oxides evident, all due to recrystallization (Fig. 36a, c, e, i, r–t, w, b’, f’, k’, m’–n’). Sometimes these calcite crystals are at various angles grouped together or are medium and large interlocking platy and sub-euhedral with different extinction angles grouped together, sometimes in unusual patterns enclosing iron-oxides-stained blotches. Elsewhere very small or small recrystallized non-iron-oxides-stained calcite crystals are either thinly scattered or regularly spaced densely through the ultra-fine-grained iron-oxides-stained calcite matrix, with scattered tiny specks and small blotches of iron oxides still present, and sometimes patches of the cleaner recrystallized calcite grains merge with the surrounding iron-oxides-stained dense calcite matrix (fig. 36a, d, i, s–t, w–x, b’, and n’).
In some cases, what is likely recrystallized calcite matrix occurs as long and thick, ragged-edged, or round irregular-edged (framboid-like with possible sieve-like texture), micro-crystalline masses that are also iron-oxides-stained, particularly around their edges (figs. 33g, j–l, e’, and 36m–o). Some calcite grains have tiny spots of dolomite replacement around some of their edges (figs. 33g, l, and 36a’), while sometimes the calcite and particularly dolomite cement appears to encroach on mosaic grains such as quartz (fig. 36d, m, y, and n’). Large irregularly-shaped patches of recrystallized calcite engulf several mosaic quartz and K-feldspar grains as well as including some “clean” dolomite grains, so perhaps this recrystallization happened after dolomitization of some of the calcite (figs. 33d, h, p, v, and 34h). Some iron-oxides-stained very small to small, irregular sub-rounded calcite grains which look like framboids have their perimeters surrounded by dolomite replacing the calcite (figs. 33k–l, and 36o). Another area consists of a very large platy calcite crystal with very few K-feldspar and quartz grains embedded in it, but with remnants of the regular ultra-fine-grained calcite matrix (with more K-feldspar and quartz grains set in it) from which it recrystallized (fig. 36f, d’, and h’). Several sharply defined areas of the densely iron-oxides-stained ultra to fine-grained calcite matrix are ovoid in shape, surrounded by relatively “clean” recrystallized matrix (figs. 33e, 35g, and 36b and c). Sometimes the calcite matrix has been recrystallized into various shapes from thin and thick linear to irregular ovoids to micro-crystalline large patches, relatively free of iron oxides, consisting of very small to small-medium, platy calcite crystals and rhombs at different extinction angles (sometimes with quartz and K-feldspar grains still embedded in them) (figs. 33d, h, o-n, 34h, 35c, g, n, and 36x, e’, j’ and m’-n’). Alternately, the large-huge patches of calcite matrix have been recrystallized into one or several larger calcite crystals (as evident from the distinctive single “rhomboidal” cleavage and each being at different extinction angles) that fully or only peripherally include quartz and K-feldspar grains and fragments.
Calcite replaces or coats several small or long, thick, bent, or broken edge-on muscovite flakes with frayed ends (figs. 32f, p, and h’, and 33j’). In other places, calcite appears to replace or coat some K-feldspar mosaic grains, either wholly, partially or along internal cracks (fig. 36c, e, g, x, a’, e’, and j’). And in another sample, some glauconite grains are partially altered and/or replaced by calcite stained with iron oxides especially heavily along internal cleavage cracks (fig. 30b). In sample MFTB-04 containing large glauconite grains or pellets there are several very large, elongated and flattened pores (or they could be dissolution holes as they are much larger than any of the mosaic grains) that are lined thickly with calcite heavily stained by iron oxides, with the calcite crystals grown inwards to infill the remaining spaces (fig. 30m).
In stark contrast, elsewhere some laminae consist of a much coarser-grained mosaic with about equally dominant very small to small interstitial calcite, and some tiny to very small dolomite, grains as cement and variably iron-oxides-stained with scattered specks of iron oxides, although adjoining areas are dominated either by interstitial carbonate cement (including some large patches of it) or by other mosaic grains (quartz and K-feldspar) (figs. 34g, i–j, o–p, r, w–x, and 36k, m–o, q, y, a’). In a few samples, dolomite forms the matrix with tiny to very small densely-packed grains and rhombs that are stained with iron oxides, which is minor in some areas but is a major part of the rock fabric in other areas (figs. 34a–e, g, i, o–r, w–x, and 36, m, o, y, a’). Any interstitial calcite grains likely represent remnants of the original limestone. Occasionally the dolomite matrix has been recrystallized into very small to large irregularly-shaped and raggedly-shaped or sub-euhedral to sub-angular crystalline patches (or sometimes micro-crystalline patches that have included other mosaic grains in them) or crystals that still cement some of the mosaic, or has been recrystallized into tiny, very small and small rhombs outlined by iron oxides. In one sample, there are often sharp lines of demarcation between bands of dolomite-dominated-matrix that predominates the rock’s fabric and of calcite-dominated-matrix (figs. 33i’, 34p, r, x, and 36m, q, and y). But even in the latter, dolomite grains and rhombs are scattered in the calcite matrix interstitial to the K-feldspar and quartz grains, suggesting variable incomplete dolomitization. Sometimes there are a few very small “clean” (iron-oxides-“free”) and “skeletal” structured dolomite rhombs scattered within both the calcite and dolomite dominated matrixes, which suggests some recrystallization of dolomite has occurred.
Overall, given the variations in the calcite cement, its recrystallization, and the occasional dolomite replacement that in places also forms the cement, between adjacent samples at the same stratigraphic levels in the fold, there are otherwise no significant differences in the cement and its textures between the samples, whether from either the hinge or limb zone of the fold, or from locations distant to the fold. This confirms the observation that lithification of the calcite cement and subsequent its recrystallization and patchy dolomite replacement must have occurred after the folding. Otherwise, if lithification had occurred before the folding the ductile deformation required would have fractured the cement and healed it by total recrystallization, that is, metamorphosed, in response to the applied heat and pressure.
SEM Observations
Whereas petrographic microscope observations produce two-dimensional images, the scanning electron microscope (SEM) produces three-dimensional images. This enabled closer examination of both the detrital calcite, quartz and K-feldspar grains and the calcite cement. Figs. 37–44 provide the SEM images at various recorded magnifications for selected samples—two distal samples (MLS-01 and MLS-3) (fig.1), three samples from the hinge zone in the fold (MFML-04, MFML-06, and MFTB-06). and three samples from limb zones of the fold (MFML-01, MFML-05, and MFTB-05) (fig. 22).
It should be noted again that the surfaces of the samples that were imaged were made by breaking the rocks open, which can result in broken grains and/or cement, which should be evident in the resultant images. However, there is far less sample preparation damage than expected. Most of the time, such induced fractures leave very tell-tale signs, which are not very evident here in these samples. Nevertheless, the features evident in the SEM images of these samples were found to be the same regardless of their locations, whether distal to the fold or from the hinge and limb zones of the fold. That observation is critical because it reinforces the conclusion from the petrographic microscope examination that the conditions within the Muav Formation since deposition of its constituent grains, principally calcite grains with accessory quartz grains, and K-feldspar grains and former laths, and scattered muscovite flakes, have been uniform throughout the extent of the rock unit within Grand Canyon. That is, conditions in the history of the limestone have not been different during deformation in this fold compared to the same sandstone distant from this fold. Detailed observations of each sample justify this conclusion.
Distal sample MLS-01 is from the massive, bedded limestone of the Kanab Canyon Member in ledges above Kanab Rapid (see fig. 1 for its location). The central area of fig. 37a is progressively magnified in fig. 37b–d. These images show the characteristic rhombohedral cleavage of calcite, especially obvious in the higher magnification of fig. 37c–d, with broken crystal faces due to the breaking apart of the rock fabric during sample preparation. Significantly, much of the left-hand side of fig. 37a displays the fine-grained micrite (lime mud) that was deposited to form this limestone, whereas on the right-hand side can be seen an extensive area of coarser-grained calcite, likely due to recrystallization of some of the micrite subsequent to deposition and during lithification and diagenesis. If that recrystallization had occurred as a consequence of elevated temperatures and pressures during deep burial and diagenesis, then it would be expected that all the micrite would have been recrystallized as the whole rock fabric would have been similarly affected. The magnification in fig. 37c–d of this recrystallized calcite shows the interiors of several broken calcite crystals which appear to be not solid throughout, suggesting either crystal growth as a framework rather than as a solid crystal, or more likely, so dissolution of the calcite subsequent to crystallization by subsequent groundwater action.
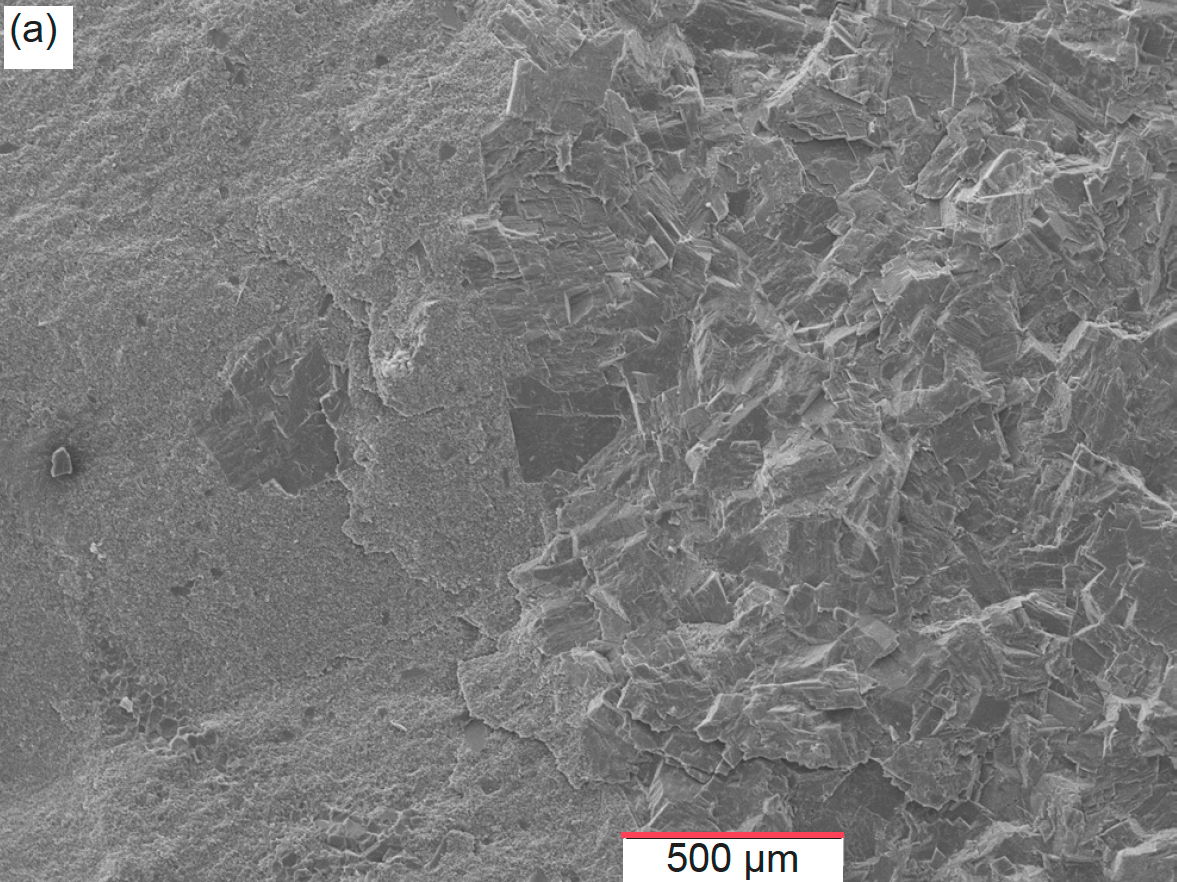
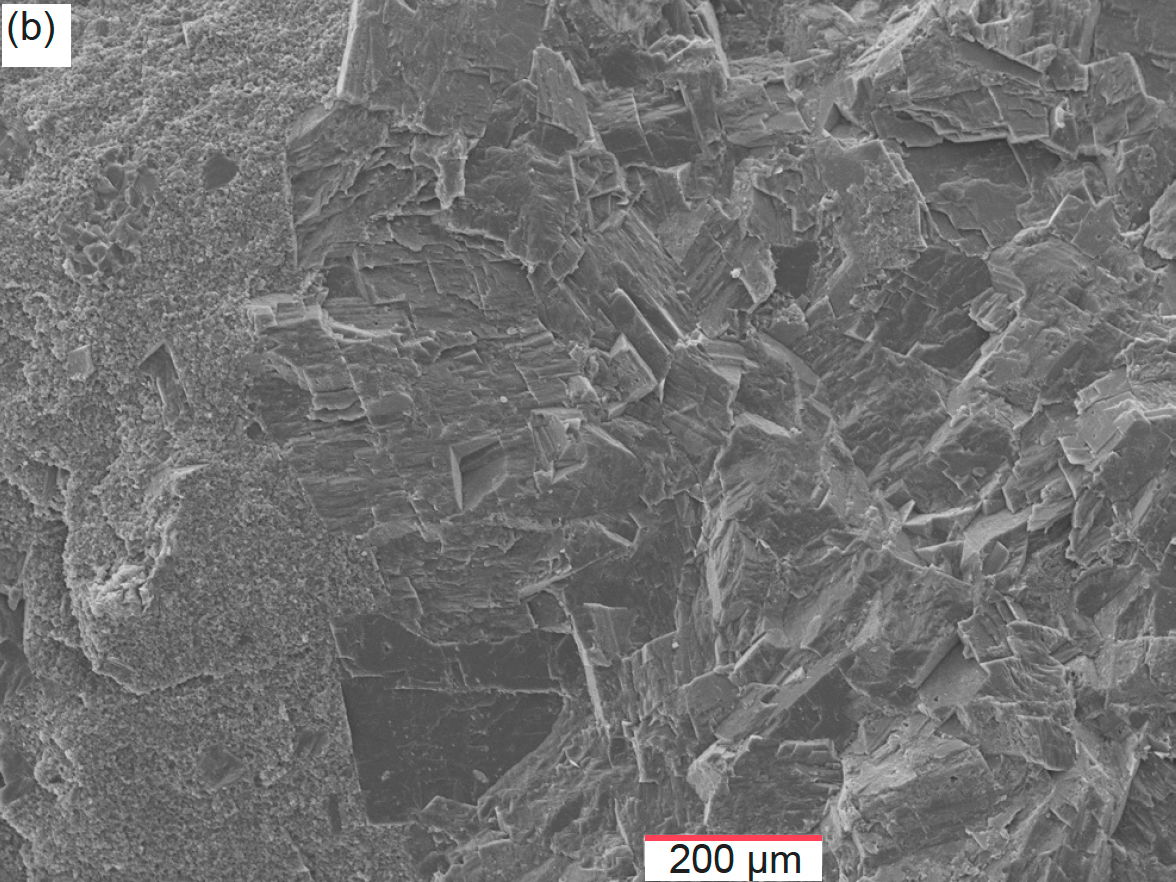
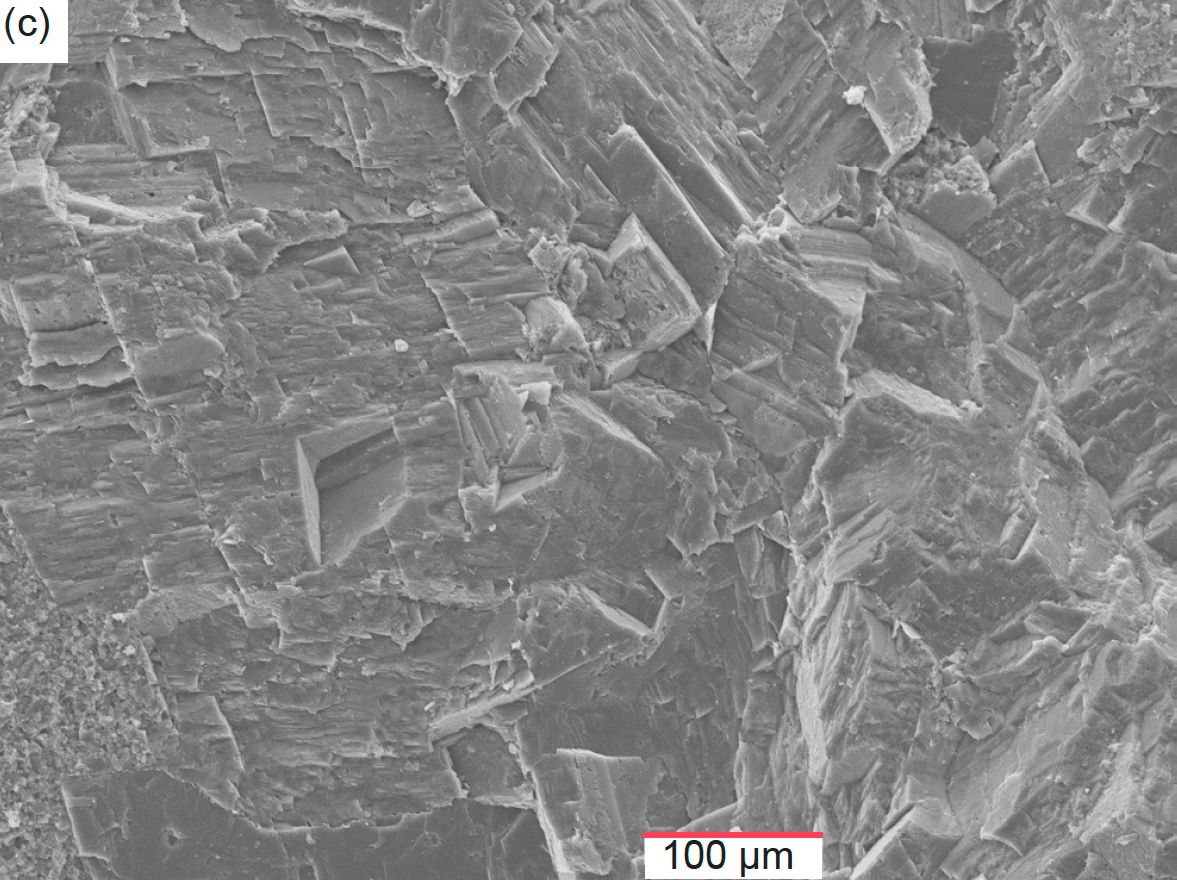
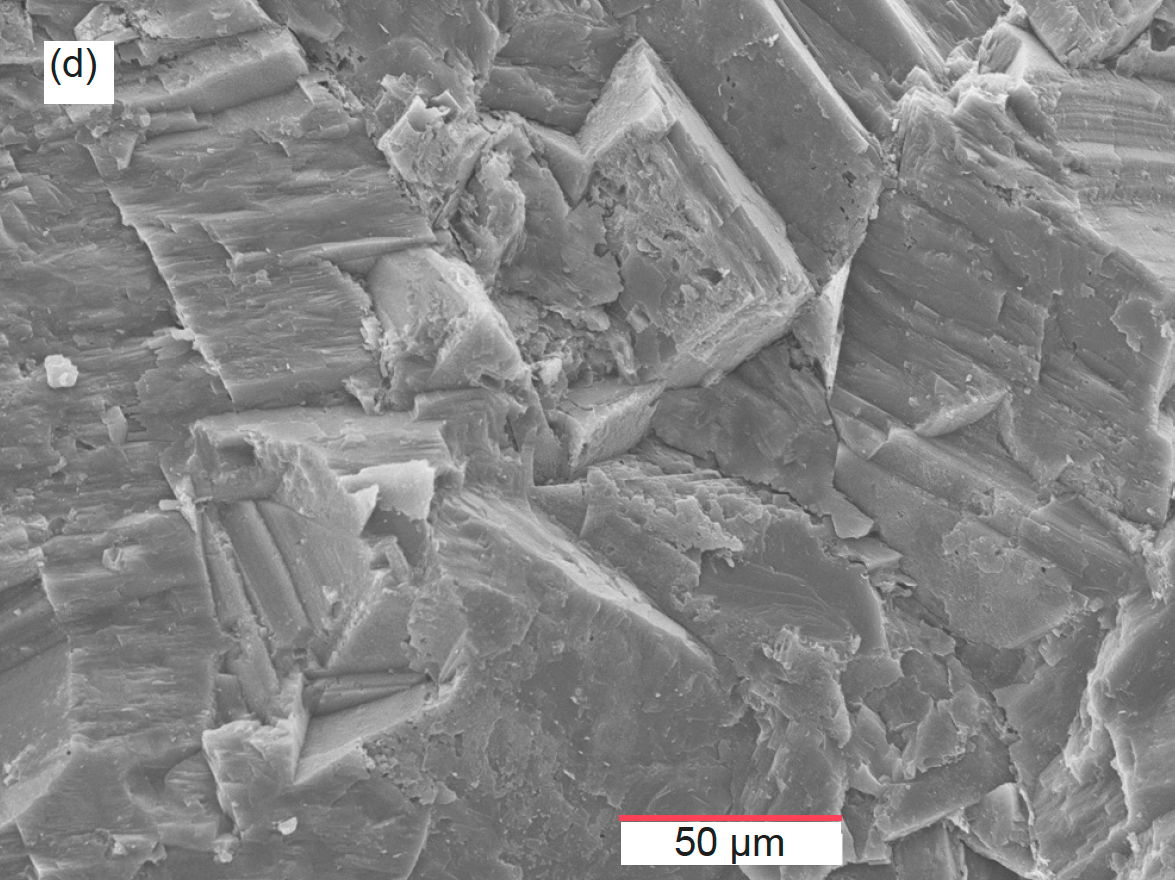
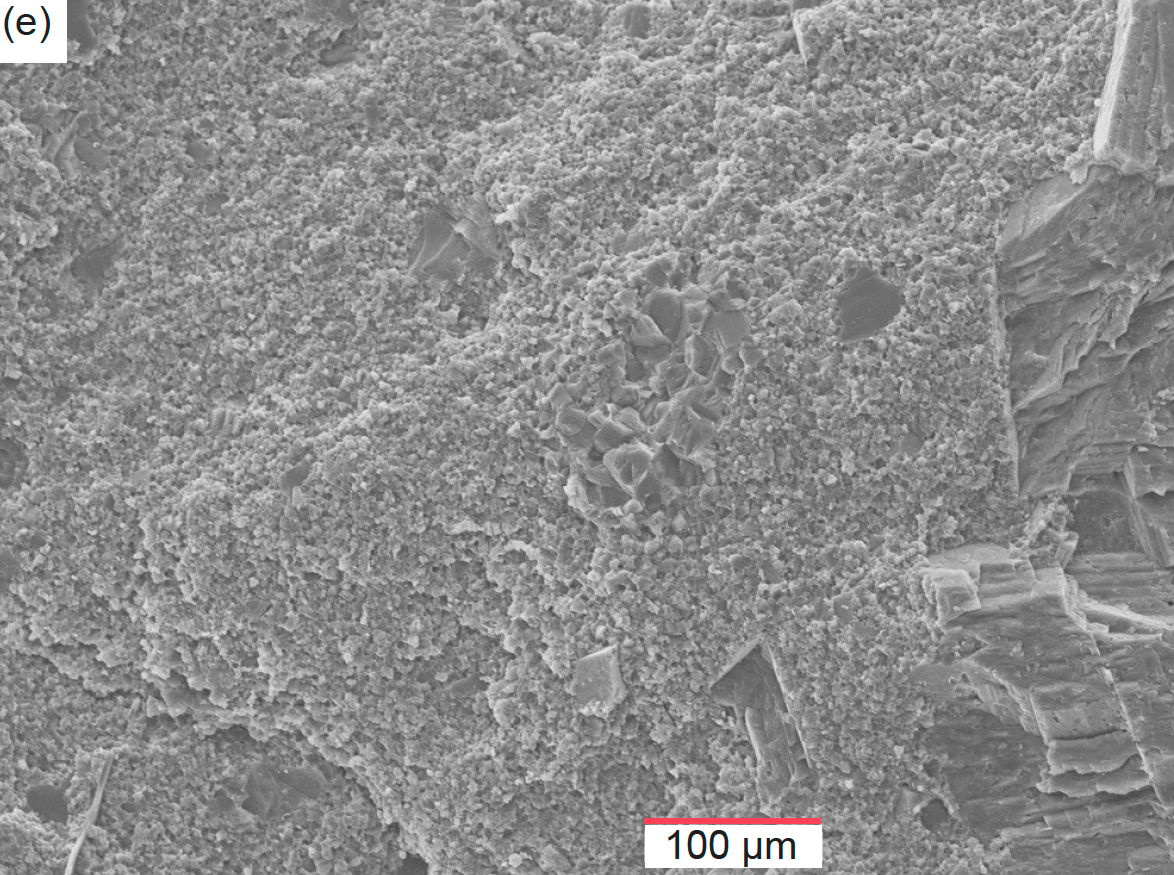
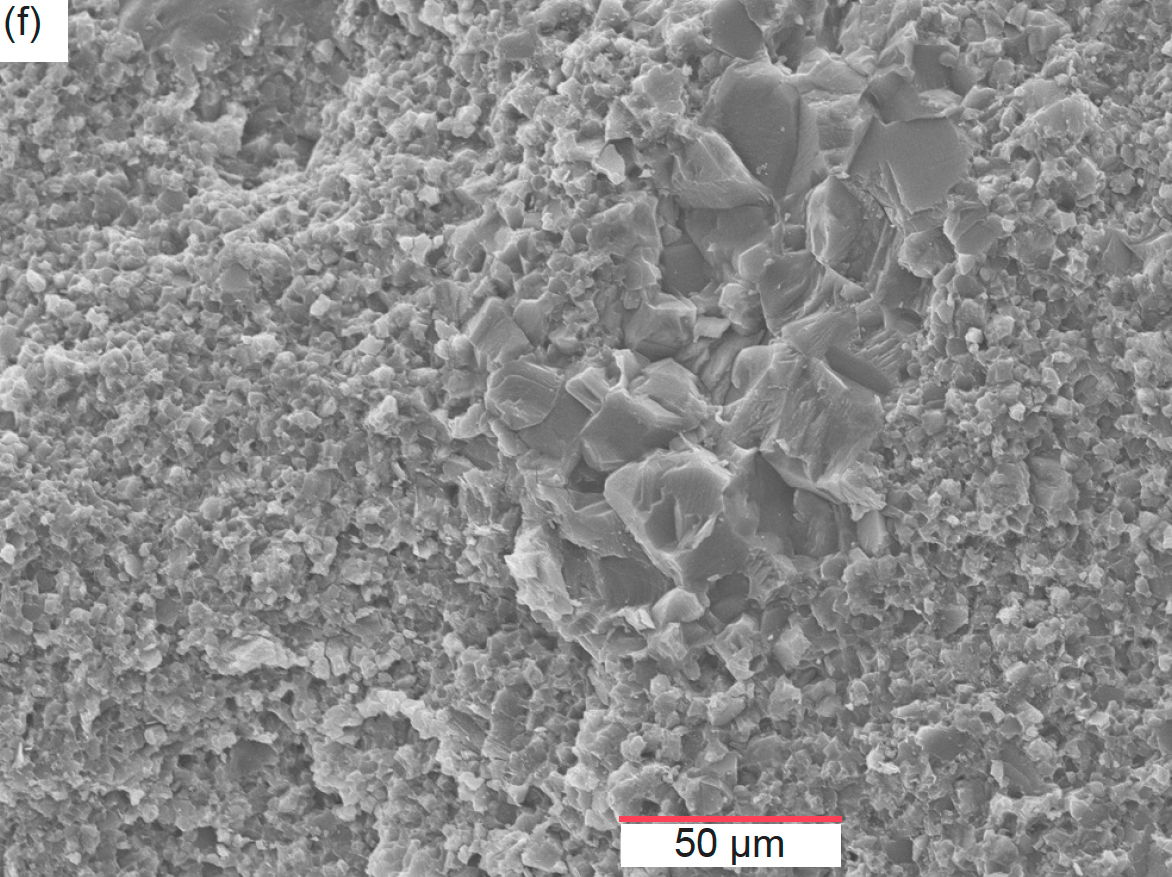
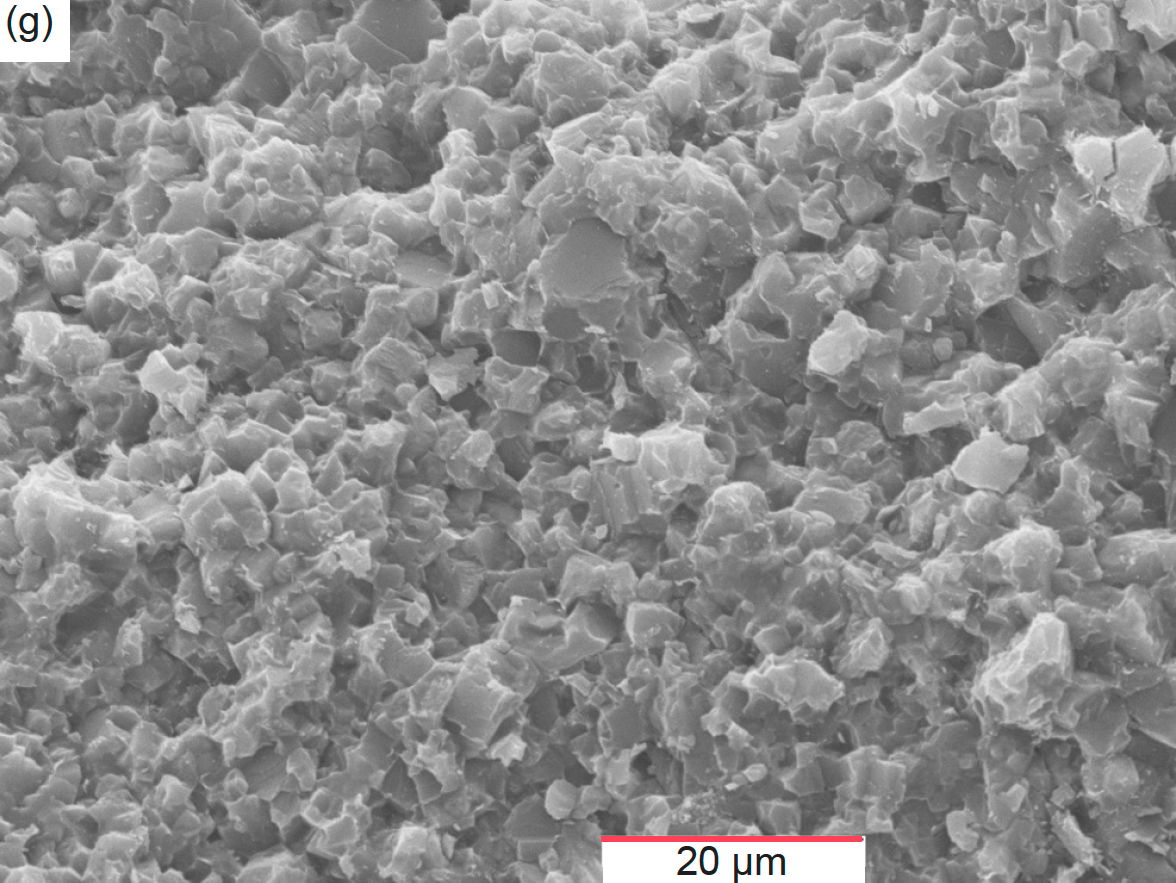
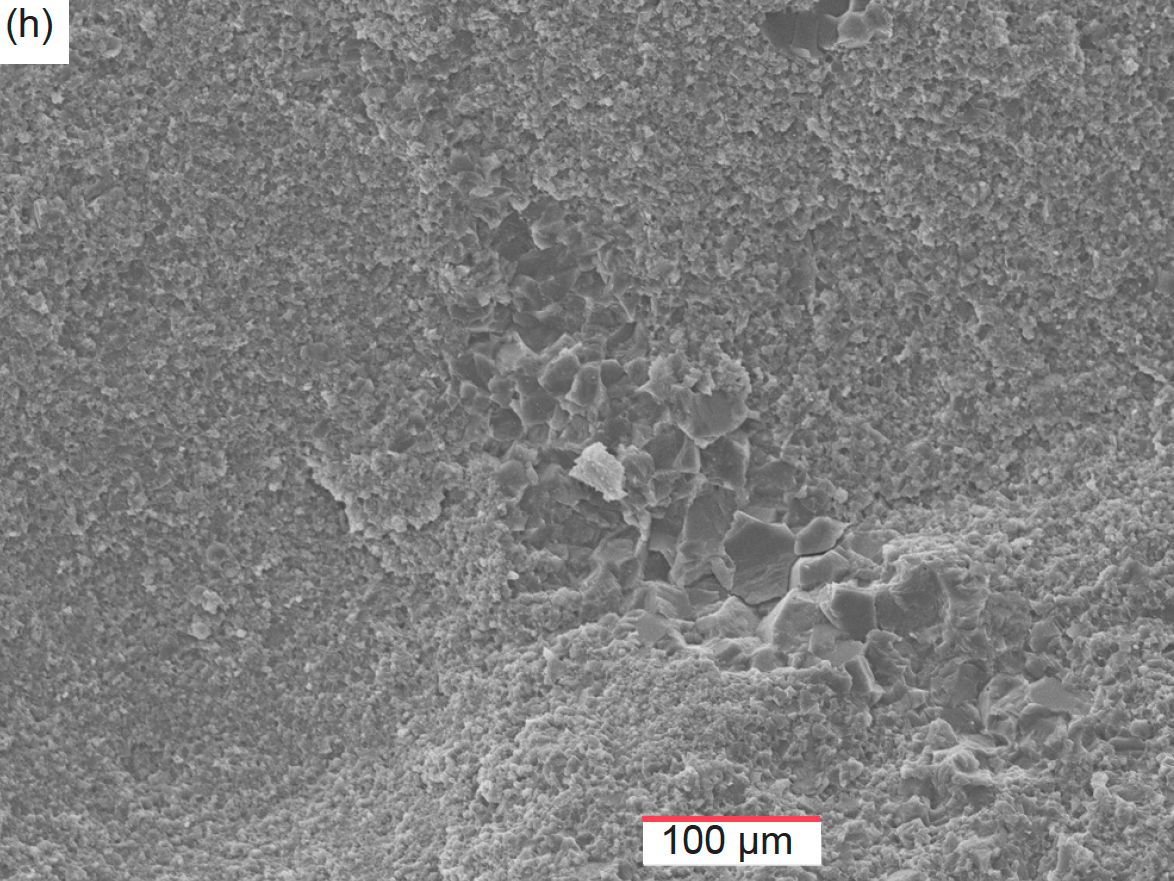
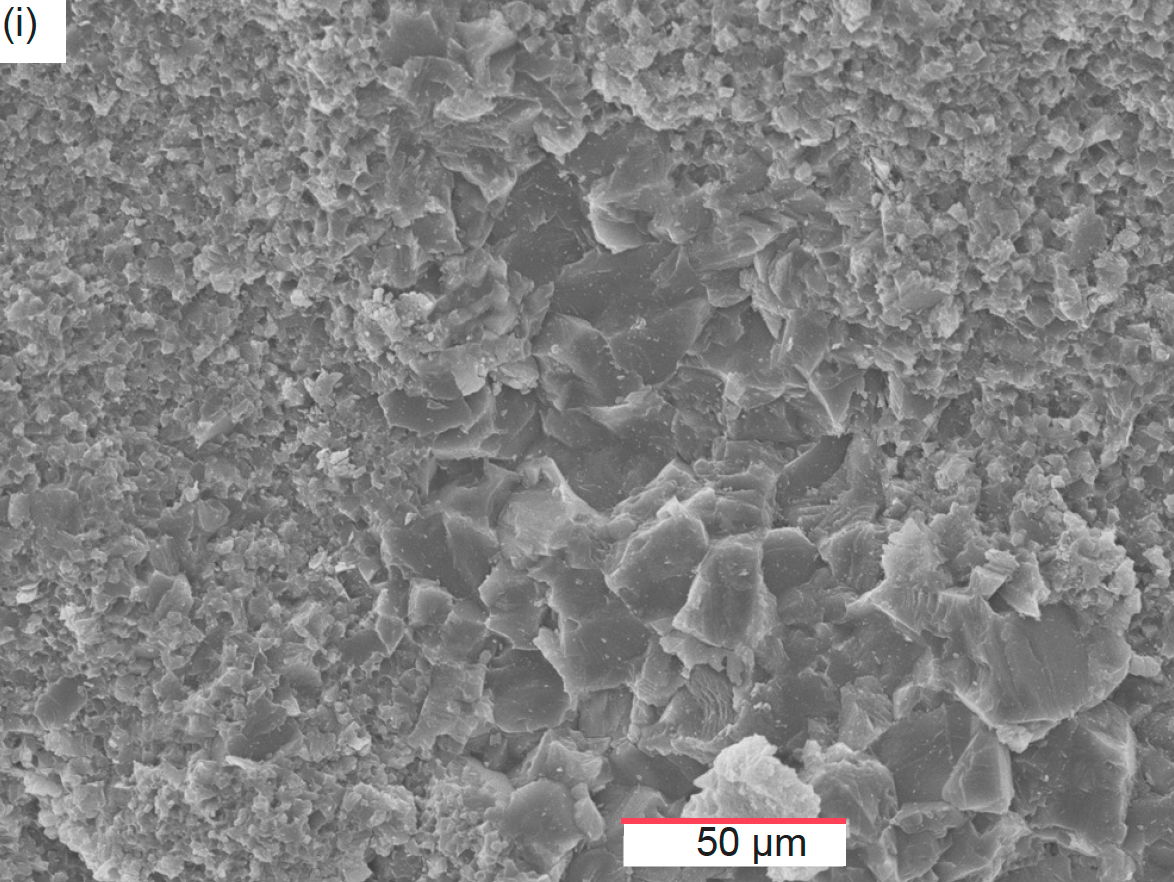
Fig. 37. Scanning electron microscope (SEM) images of distal sample MLS-01 (see fig. 1 for its location). (a) 50X, (b) 100X, (c) 200X, (d) 500X, (e) 200X, (f) 500X, (g) 1500X, (h) 200X, and (i) 500X.
Fig. 37e represents the magnification of the area just left of top center in fig. 37a, then in fig. 37f–g are magnifications of areas within fig. 37e. These images show that the micrite occurs as tiny (fig. 37g) and very small (fig. 37f) calcite crystals, although in fig. 37g at the highest magnification it is hard to distinguish whether some of the crystals are in fact the scattered quartz and K-feldspar grains which can be seen in the corresponding thin section (figs. 25a and 28a–b). The oval structure seen as a composite of small crystals may be replacement of a precursor fossil. This is not an untypical morphology for fossil replacement by diagenetic calcite. Fig. 37h is a magnification of the area in the bottom left-hand corner of fig. 37a, while fig. 37i is then a magnification of the central area of fig. 37h. These images also show the tiny and very small calcite crystals making up the micrite, though again there may be some scattered quartz and K-feldspar grains among them. Again, this may be a replacement feature of a fossil fragment. It could be interpreted that the micrite has recrystallized because the calcite crystals are well-formed, but on the other hand, the lime mud particles that were originally deposited would likely have been in the form of mud-sized calcite crystals, as seen in these images. And besides, where recrystallization has occurred in this sample, the calcite crystals so formed are very much larger, as seen in fig. 37a–d.
Distal sample MLS-03 is from the massive, bedded limestone at the top of the Peach Springs Member below the Lower Lava Rapid (see fig. 1 for its location). The area slightly left of center in fig. 38a is progressively magnified in fig. 38b–e. Here again can be seen some recrystallization of originally deposited micrite (mud-sized calcite crystals), but in this sample the recrystallized calcite crystals are relatively small. They are also not as distinctly rhombohedrally cleaved as in sample MLS-01 (fig. 37a–d), the shapes of the exposed faces more likely being due to the breaking apart of the sample during preparation. The recrystallization is confined to parallel small, elongated areas (fig. 38a) that may represent the pathways by which the fluids responsible for recrystallizing the micrite permeated into the rock fabric. More likely, these well-defined linear areas may represent the fossil shell fragments which can be seen in the corresponding thin section (figs. 25e and 31b). It can be noted here that sometimes UV (ultraviolet) petrographic imaging is used to detect organic structures like this in highly recrystallized carbonates. Furthermore, in fig. 38e at the highest magnification it is hard to distinguish whether some of the crystals are in fact the scattered quartz and K-feldspar grains which can also be seen in the corresponding thin section (fig. 25d–e and 28e). Otherwise, the white, long and thin grains evident in fig. 38b–c have a distinctive basal cleavage indicating they are muscovite flakes.
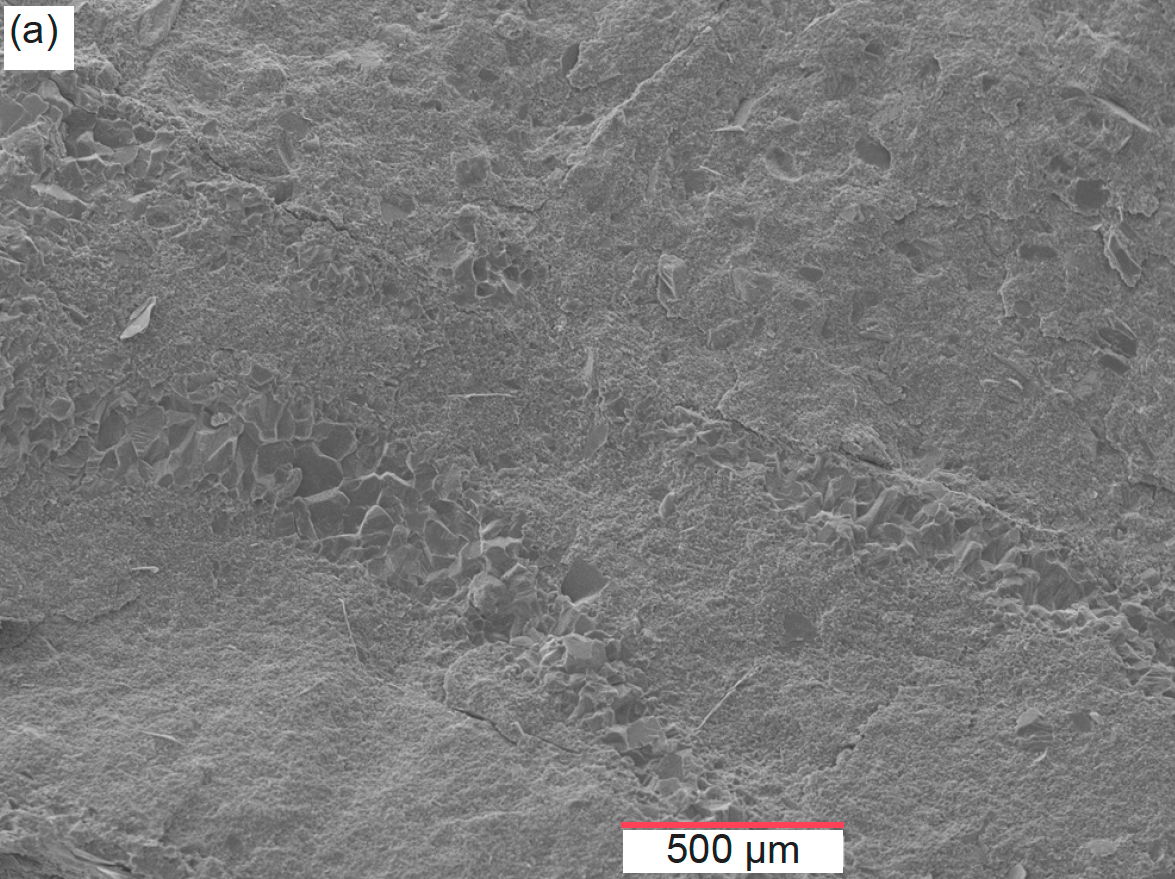
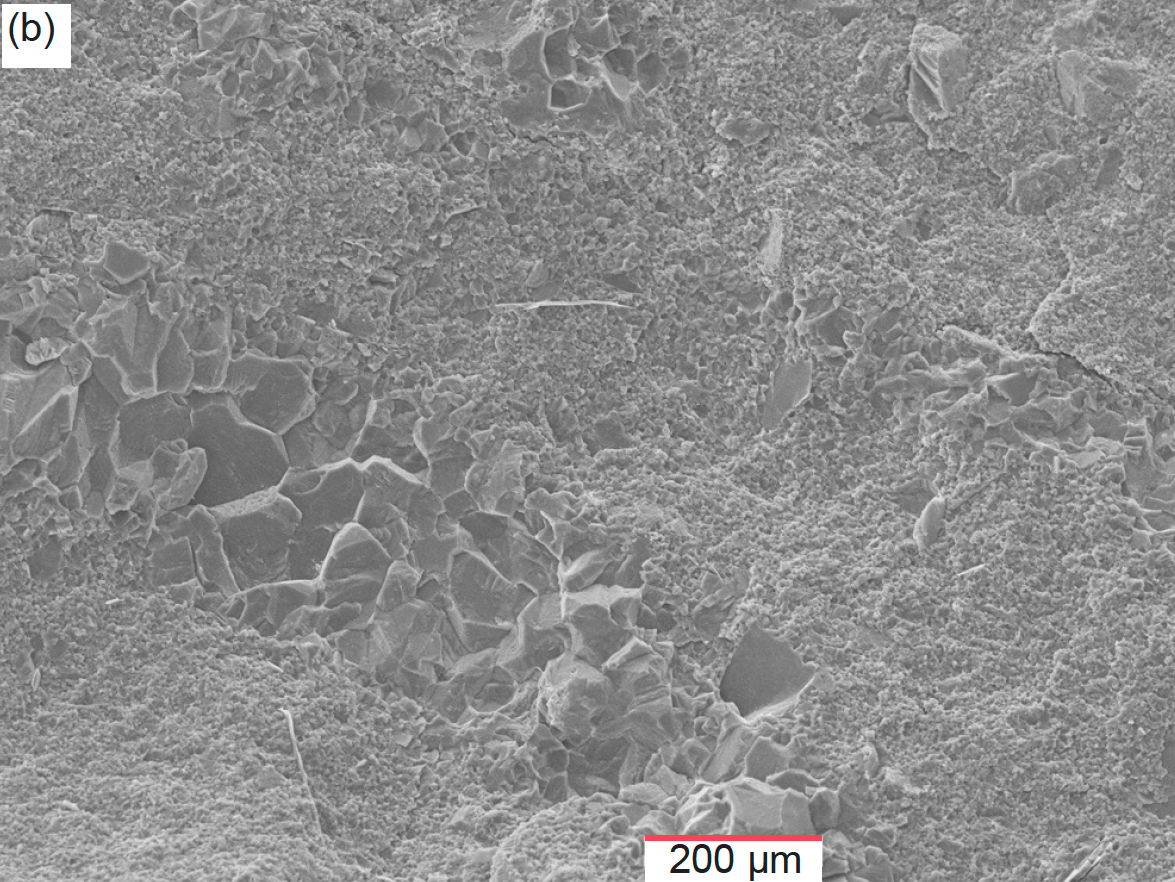
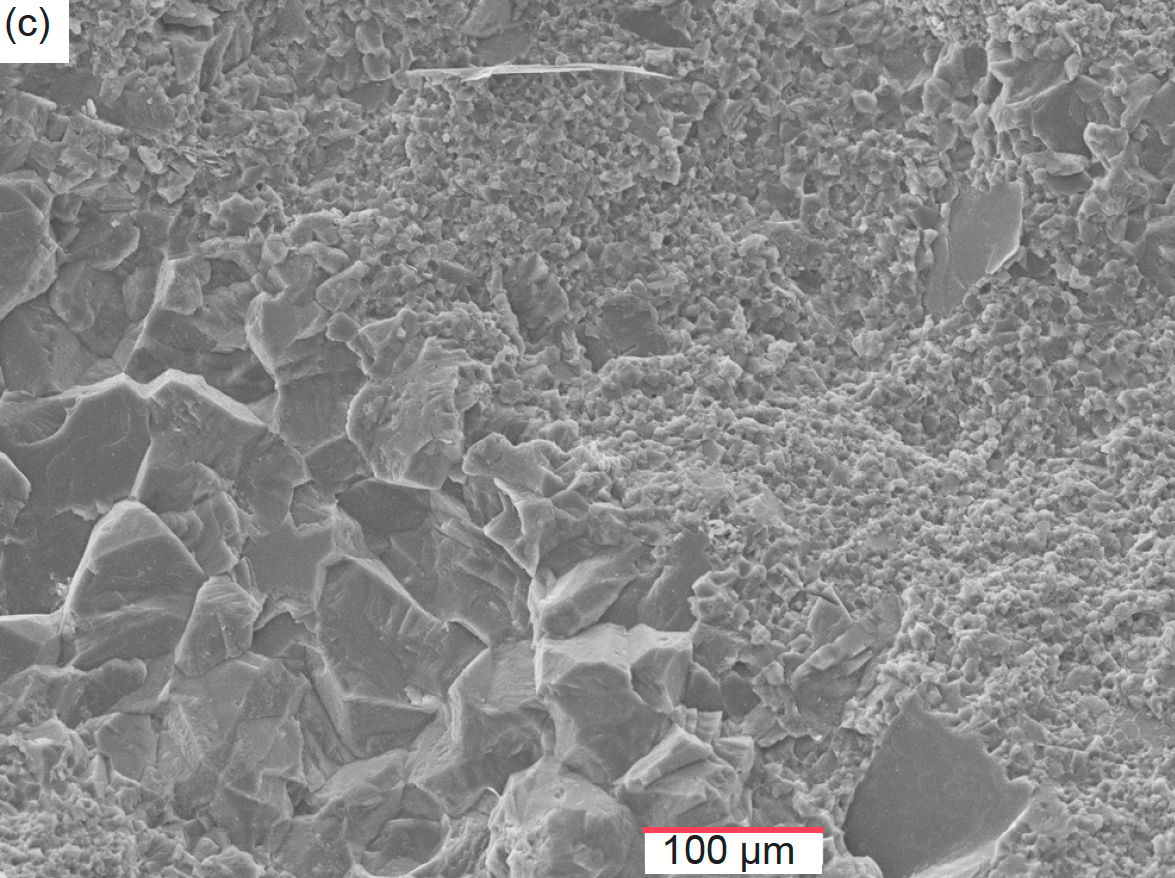
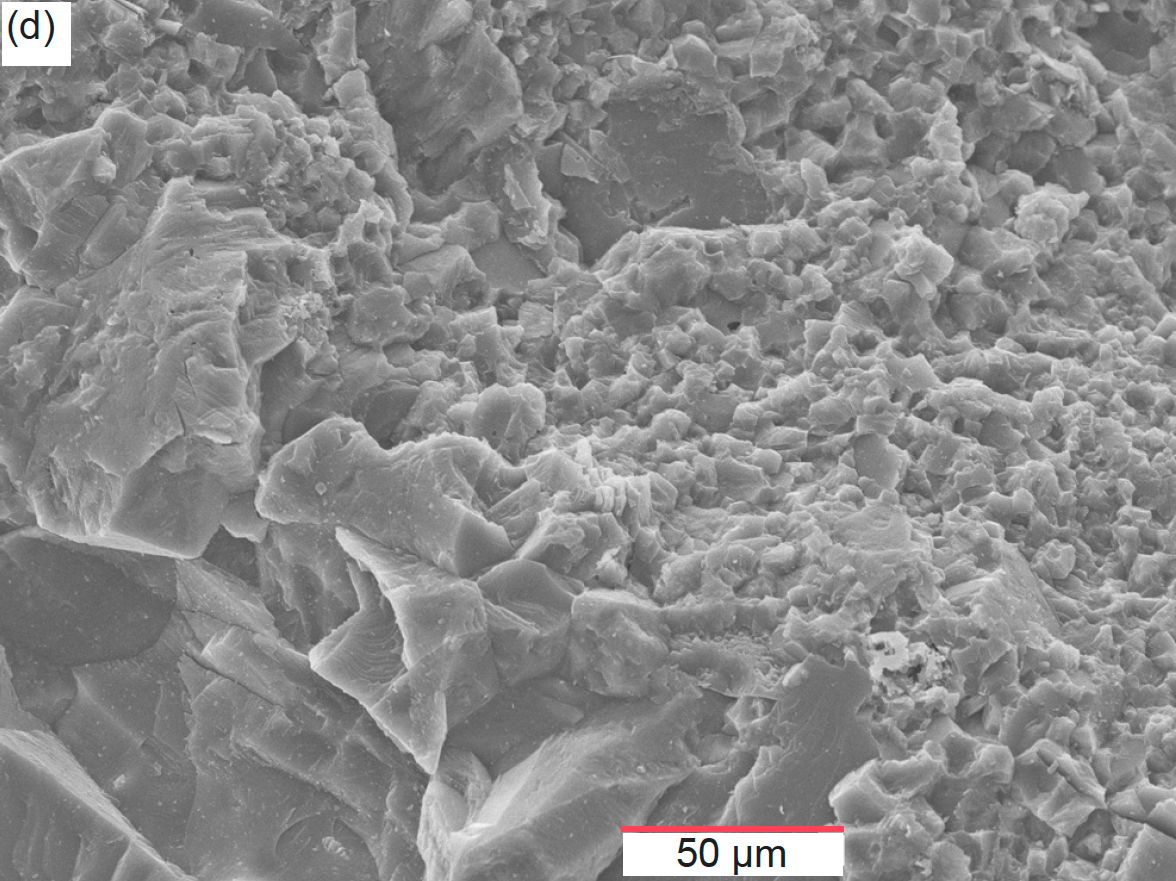
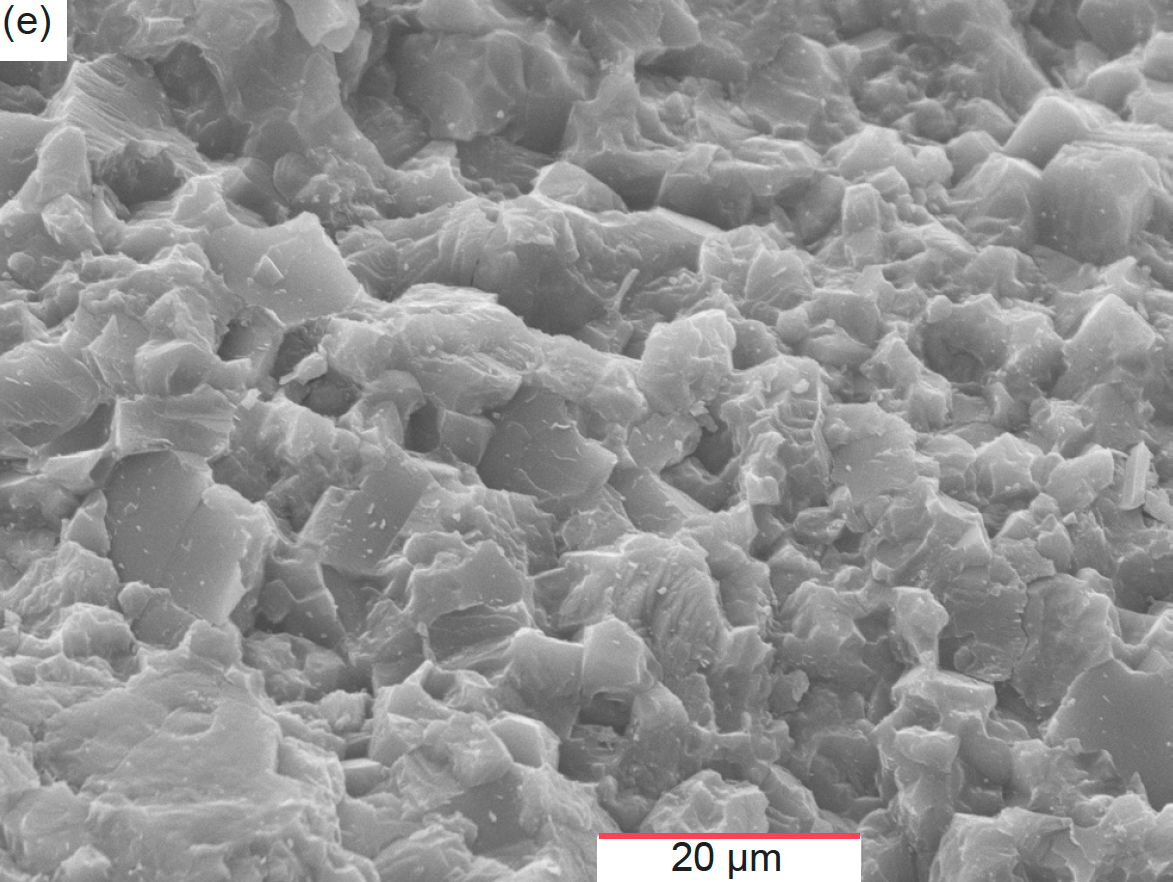
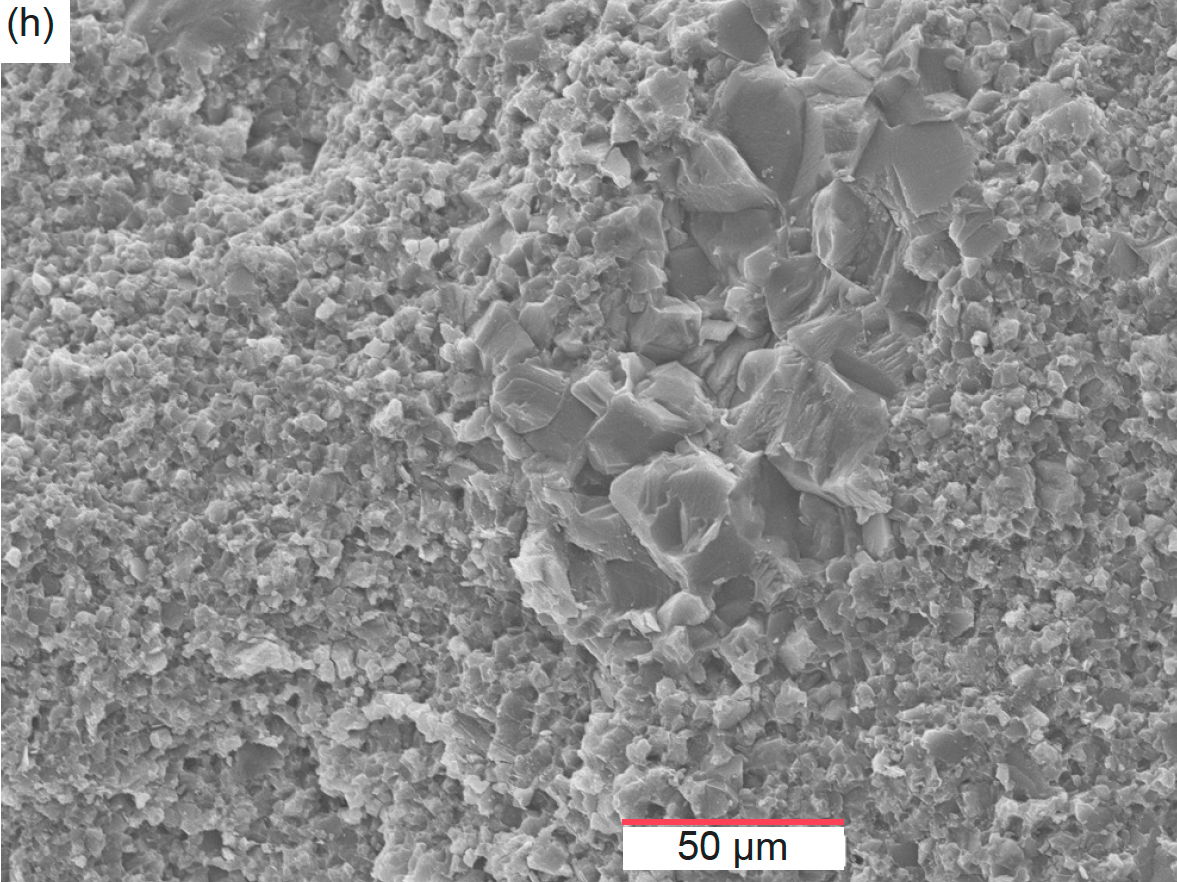
Fig. 38. Scanning electron microscope (SEM) images of distal sample MLS-03 (see fig. 1 for its location). (a) 50X, (b) 100X, (c) 200X, (d) 500X, (e) 1500X, (f) 200X, (g) 500X, and (h) 1500X.
Fig. 38f represents the magnification of the area to the right of center in fig. 38a, while fig. 38g is the magnification of the central area of fig. 38f. Both images show the internal structure of one of the well-defined linear areas referred to above that may be fossil shell fragments. Some of the recrystallized calcite has a distinctive columnar structure, as can be seen in the centers of fig. 38f–g, which may represent a remnant of the growth structure in the original shell. Marking the well-defined upper edge of this presumed fossil shell fragment is a distinct break or discontinuity in the rock fabric (fig. 38f). Finally, the location of the image in fig. 38h is not readily evident in the other images, but it again shows the small micrite calcite crystals that constitute the originally deposited lime mud, though with indistinguishable scattered quartz and K-feldspar grains. As in the other distal sample (MLS-01, fig. 37), there is no evidence of any disruption to, or fracturing of, the overall rock fabric.
The uppermost Gateway Canyon Member sample MFML-01 is from a bed in the limb of the Matkatamiba fold, just below the contact with the overlying Havasu Member (fig. 22). Fig. 39a is a lower magnification view of the split-apart surface of this limestone. It shows two fractures through the sample that likely occurred during sample preparation as the three pieces have been realigned for the electron scanning of the sample surface. The images in fig. 39b–d show the progressive magnification of the central area of fig. 39a. Those images provide more details of the micrite (mud-sized calcite particles) that make up the surface of this sample, which are best seen at the highest magnifications in fig. 39c–d. The micrite grains appear as various shapes and there is some variation in their sizes. Most smaller micrite grains are irregularly shaped, some with jagged edges and corners, whereas most relatively larger micrite grains have exposed crystal faces. It cannot be ruled out that some of the larger grains could be detrital quartz and/or K-feldspar grains. There are still tiny pore spaces between the micrite grains, as is evident in fig. 39d. And in fig. 39d there are also some very tiny crystallites scattered across the sample surface clinging to micrite grains, often in pore spaces, which are likely representing the calcite cement or illite, the latter being significantly present in this sample as indicated in table 2.
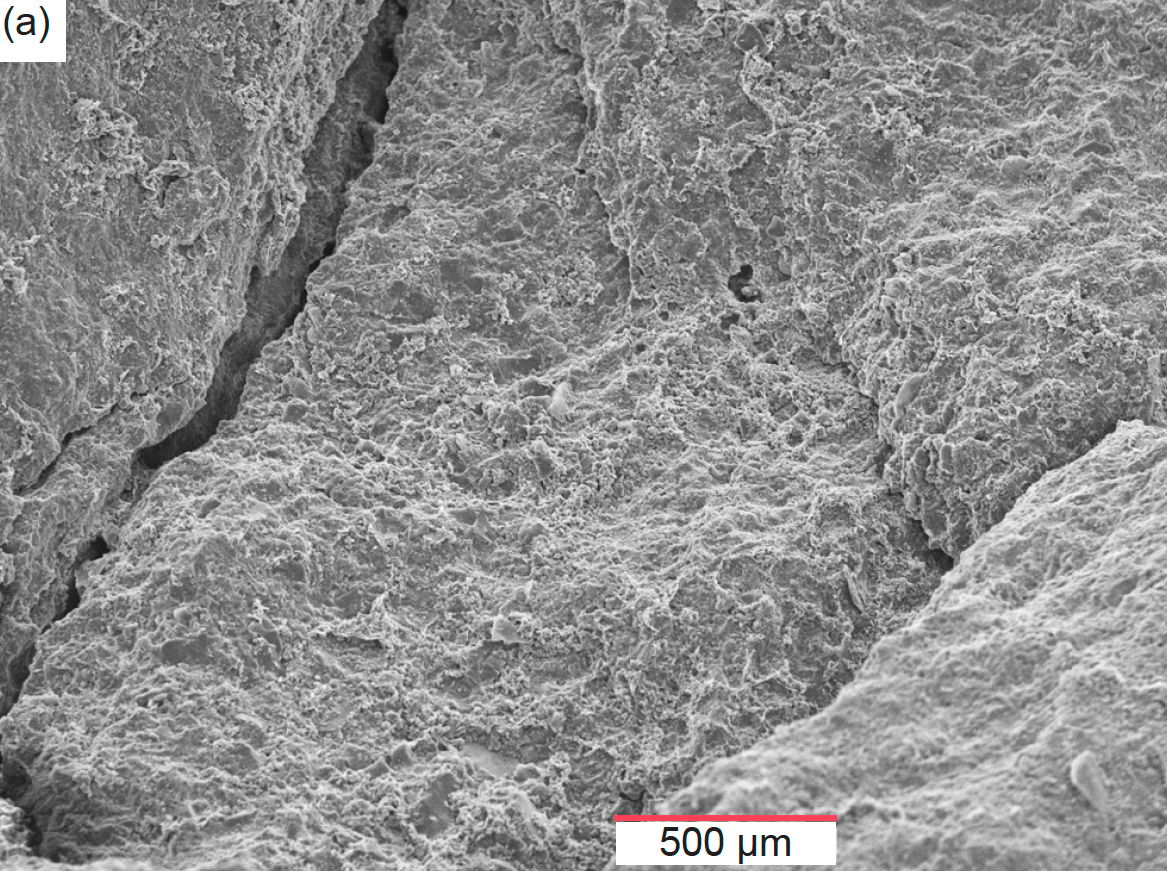
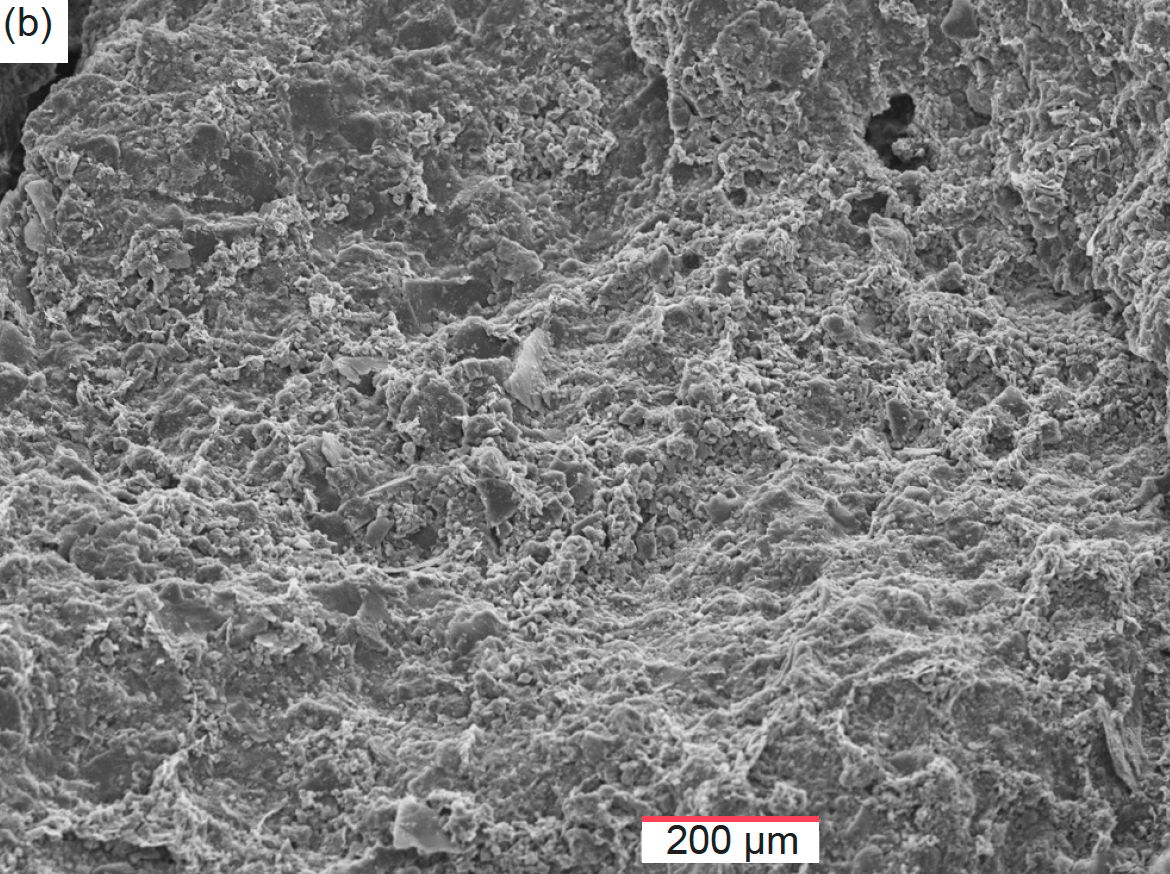
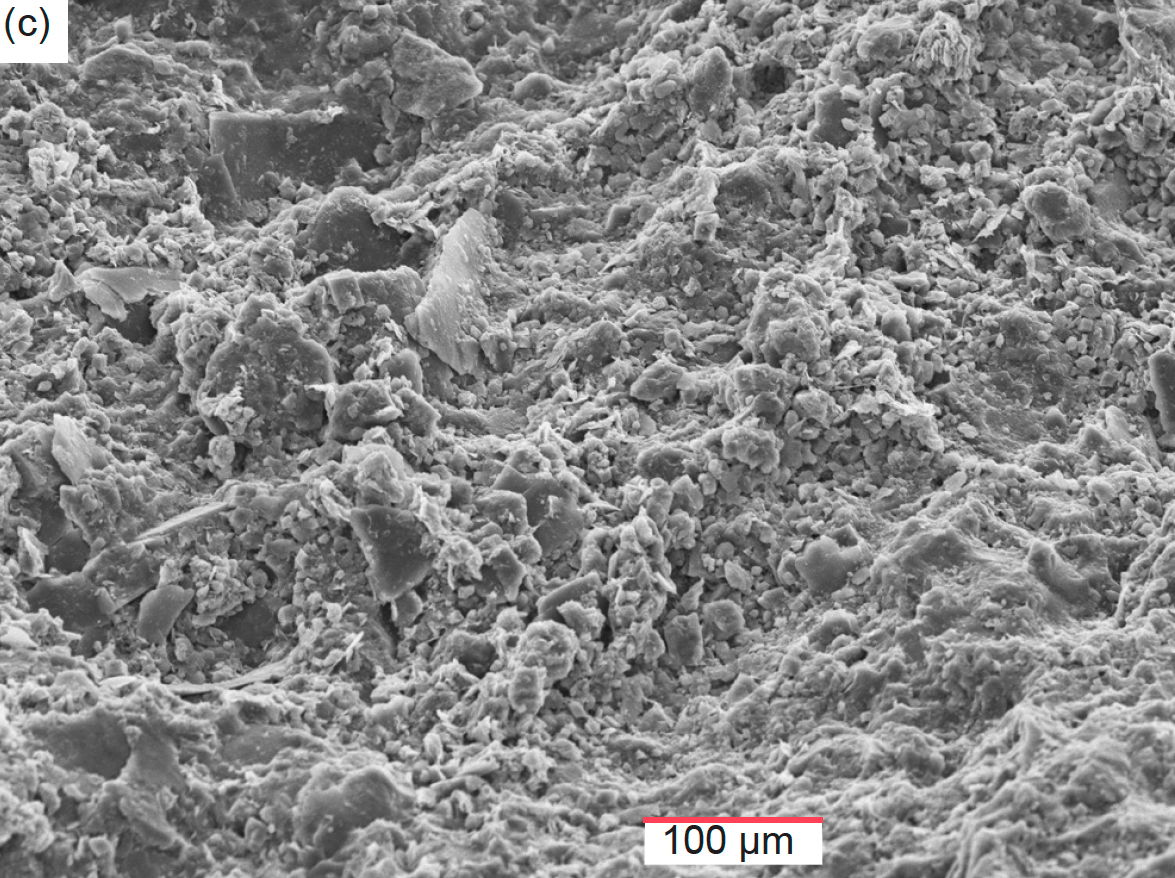
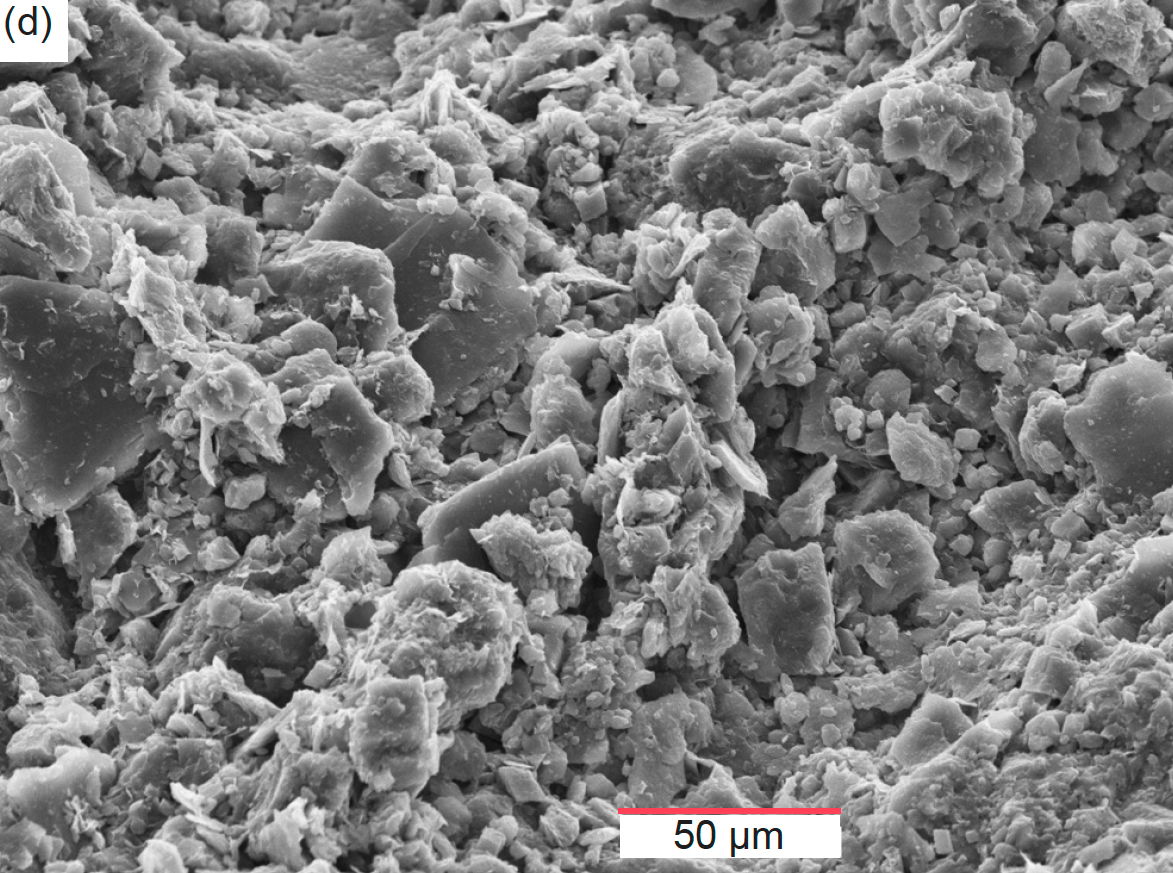
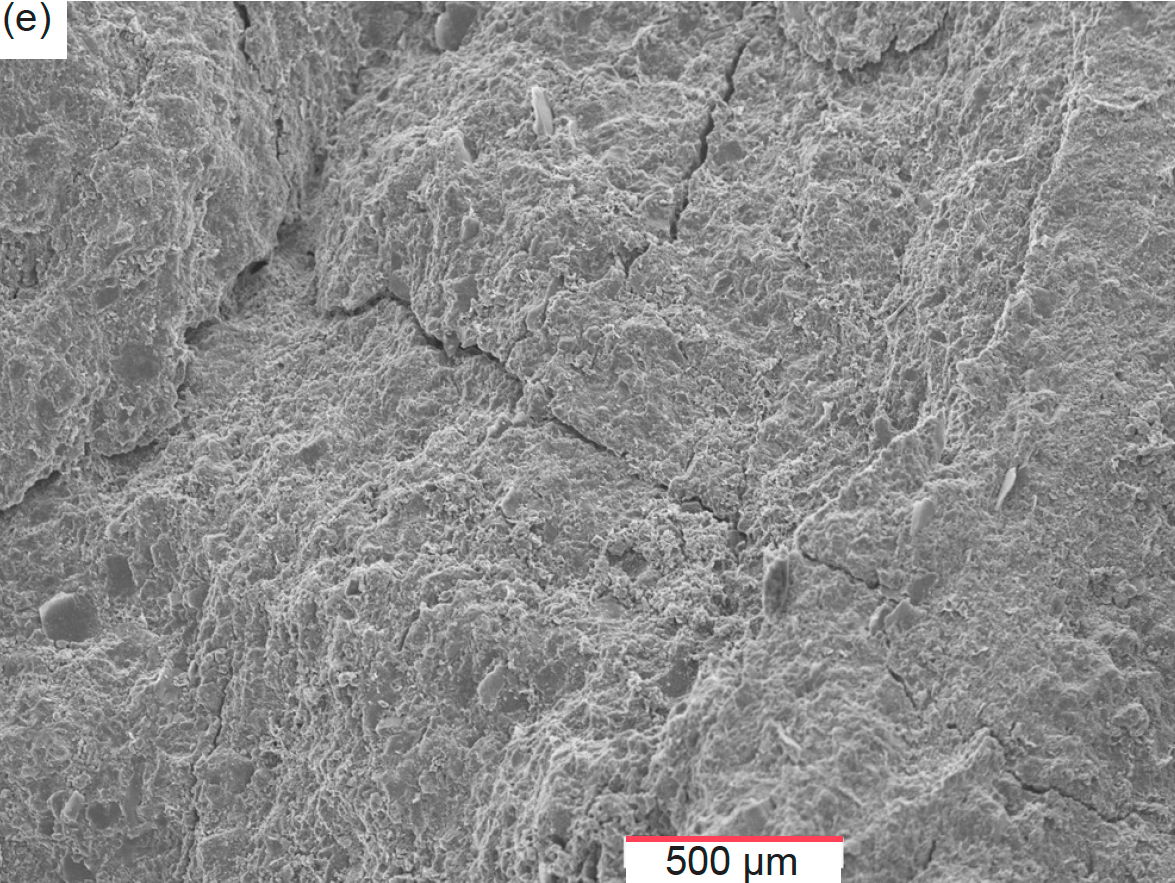
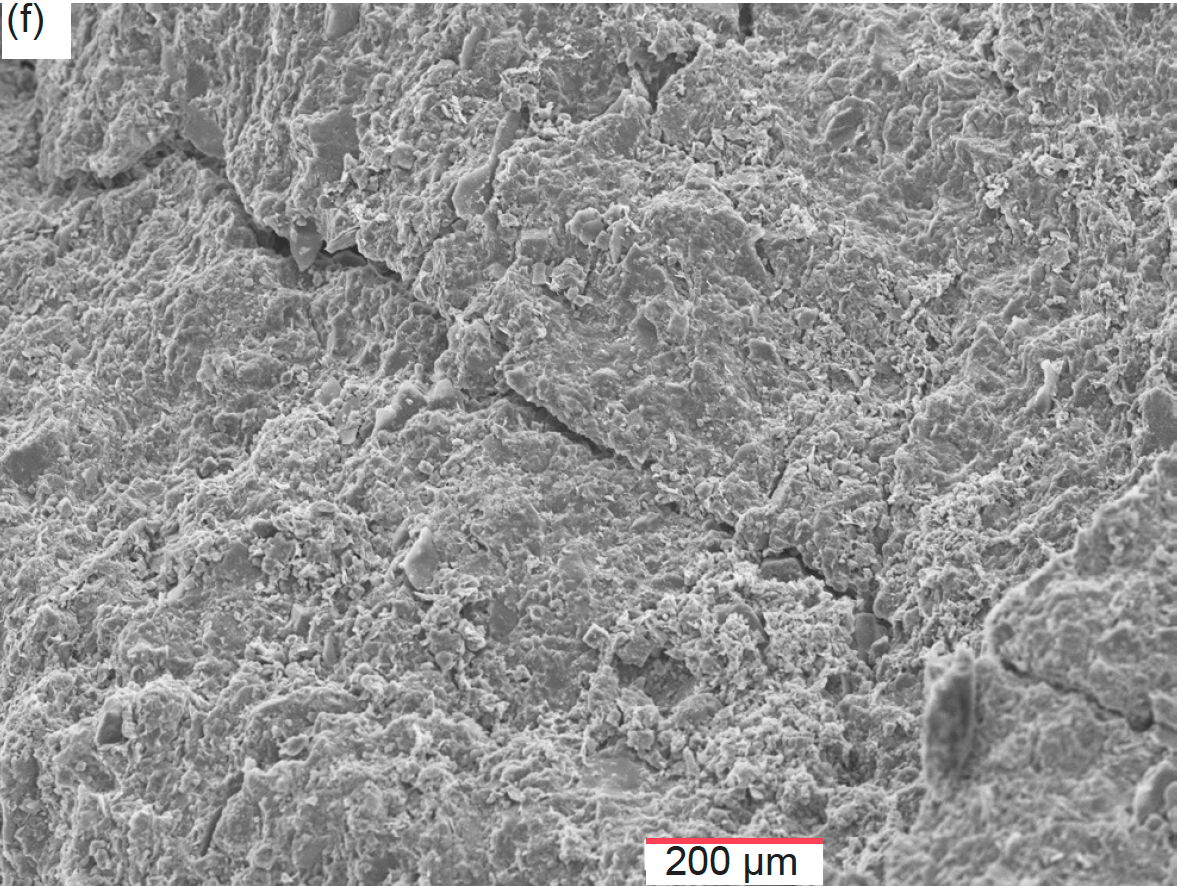
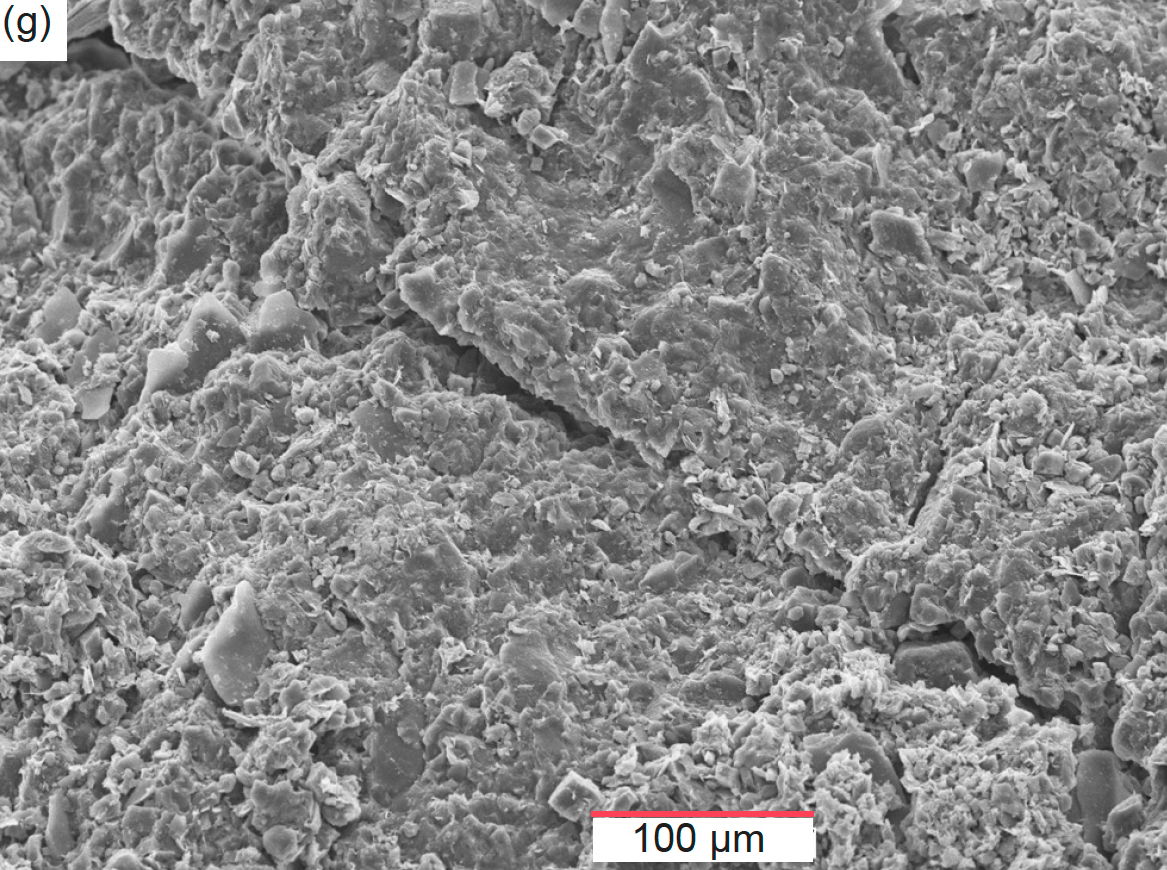
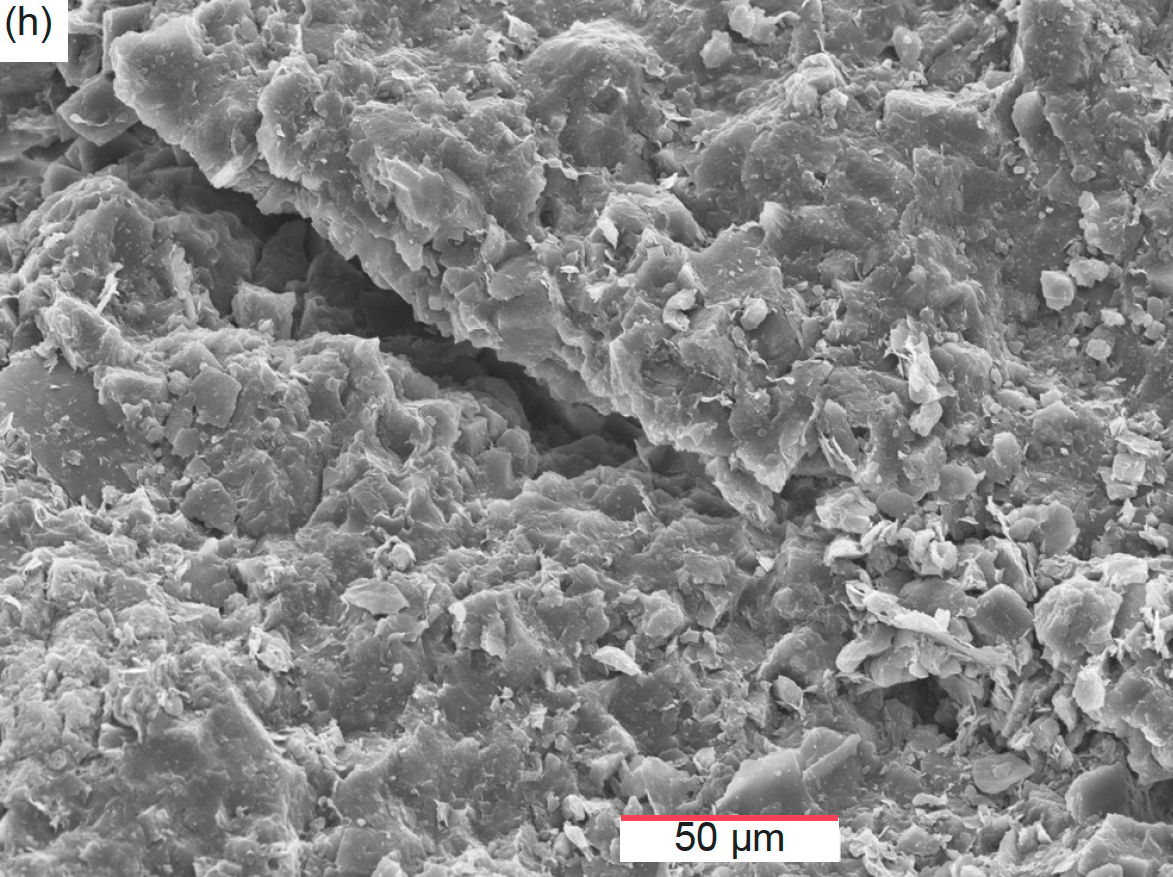
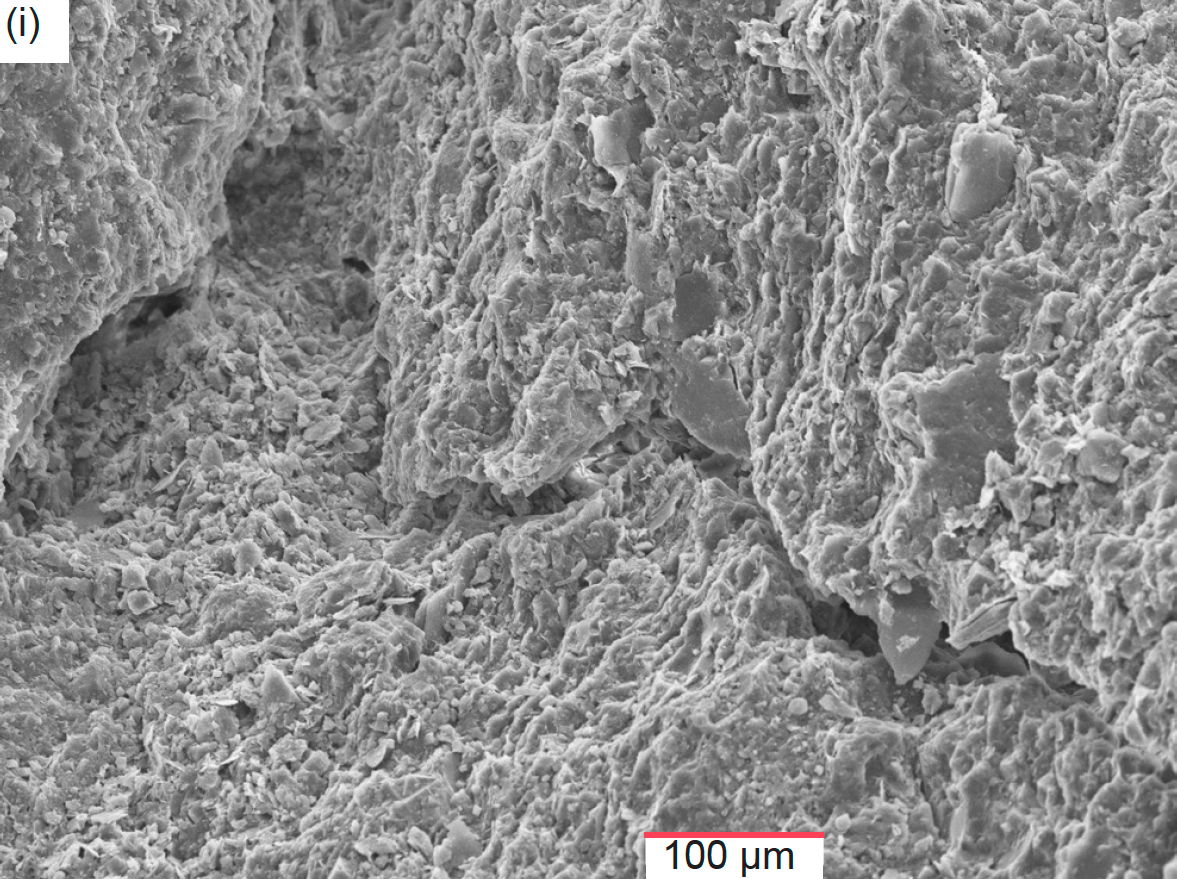
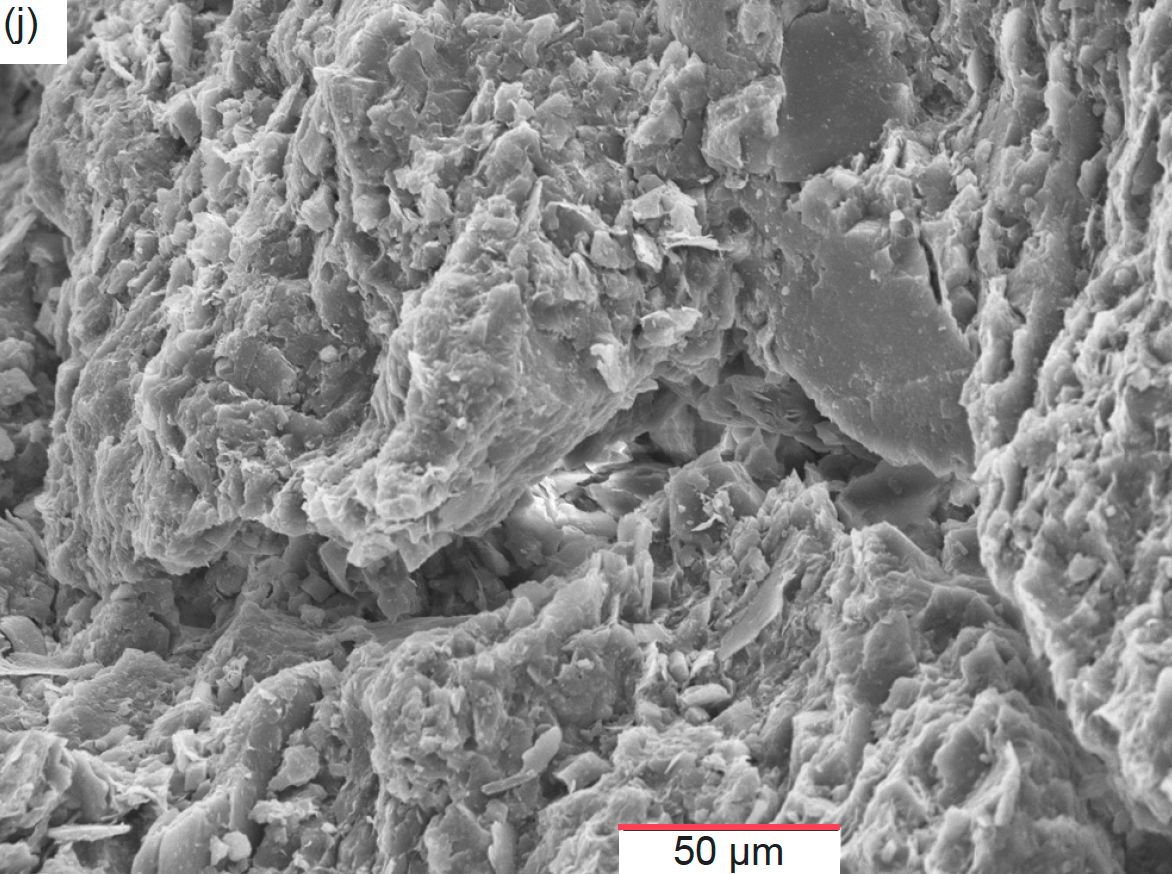
Fig. 39. Scanning electron microscope (SEM) images of sample MFML-01 from the Matkatamiba fold’s limb zone, furthest from the hinge zone (see fig. 22 for its location). (a) 50X, (b) 100X, (c) 200X, (d) 500X, (e) 50X, (f) 100X, (g) 200X, (h) 500X, (i) 200X, and (j) 500X.
Fig. 39e is another lower magnification image of this limestone sample surface. Again, there are some fractures that are short in length and their extent is limited. The images in fig. 39f–h are progressive magnifications of the central area in fig. 39e, centered on the oblique fracture. They show the fracture is gaped open with no evidence of any lateral movement along it, Indeed, the undulating surfaces along the fracture are locked together synchronously, which precludes any movement. These fractures have numerous bridging features that must not be ignored. The undulating walls of the fractures indicate that these are likely dominated by dissolution. These are definitely not part of the sample processing leading up to observation. If it were evident in this section that these fractures in thin have a stylolitic character, then such sylolites may have acted as fluid conduits rather than just being compactional features. Also, there is no evidence of any secondary calcite crystals having grown within the fracture, so all these observations are consistent with the fractures being due to the sample preparation process, rather than being a legacy of the rock’s history. Otherwise, the sample’s surface is the same as in the other images, with micrite, and possible quartz and K-feldspar, grains tightly locked together with calcite cement and showing no evidence of any disruption of the rock fabric subsequent to setting of the cement during lithification, or any movement of the grains relative to one another. The images in fig. 39i–j are progressive magnifications of the area to the left of center in fig. 39e, centered on the end section of the oblique fracture near where it ends at a perpendicular fracture. They show, particularly in fig. 39j, that there are calcite cement crystals exposed having grown across the recessed zone that represents the fracture. Otherwise, the sample’s surface is the same again as in the other images, with micrite, and possible quartz and K-feldspar grains (such as the grain with the larger crystal face bordering the fracture to the right of center in fig. 39j), tightly locked together with calcite cement and showing no evidence of any disruption of the rock fabric subsequent to setting of the cement during lithification, or any movement of the grains relative to one another.
Sample MFML-04 is also from the uppermost Gateway Canyon Member, along the same bed laterally some 68.5 m (224 ft) from sample MFML-01 but in the linear section between the two flexures within the hinge zone of the Matkatamiba fold (fig. 22). Fig. 40a is a low magnification image of the sample’s surface, and its central area is progressively magnified in the images in fig. 40b–e. The area magnified shows a recessed curvilinear cavity within the sample surface that could be a fracture, although there appears to be no clear break. Rather the interlocking micrite grains and the calcite cement can be seen within the cavity to be continuous. What is evident in fig. 40d–e is a much larger clean grain surface bordering the cavity that is fractured or cracked but there has been no movement of what appears to also be a very thin sheet structure, characteristic of a muscovite flake. Otherwise, the sample’s surface is the same again as in earlier images, with micrite, and possible quartz and K-feldspar grains (such as the grain with the larger crystal face bordering the cavity just beyond its right-hand end and just to the right of the muscovite flake in fig. 39b–d), tightly locked together with calcite cement and showing no evidence of any disruption of the rock fabric subsequent to setting of the cement during lithification, or any movement of the grains relative to one another. This cavity appears to be a dissolution feature and may be described as dissolution fracture. If fig. 40d is inspected again, some of the edge particles have distinctive dissolution features, especially just left of center.
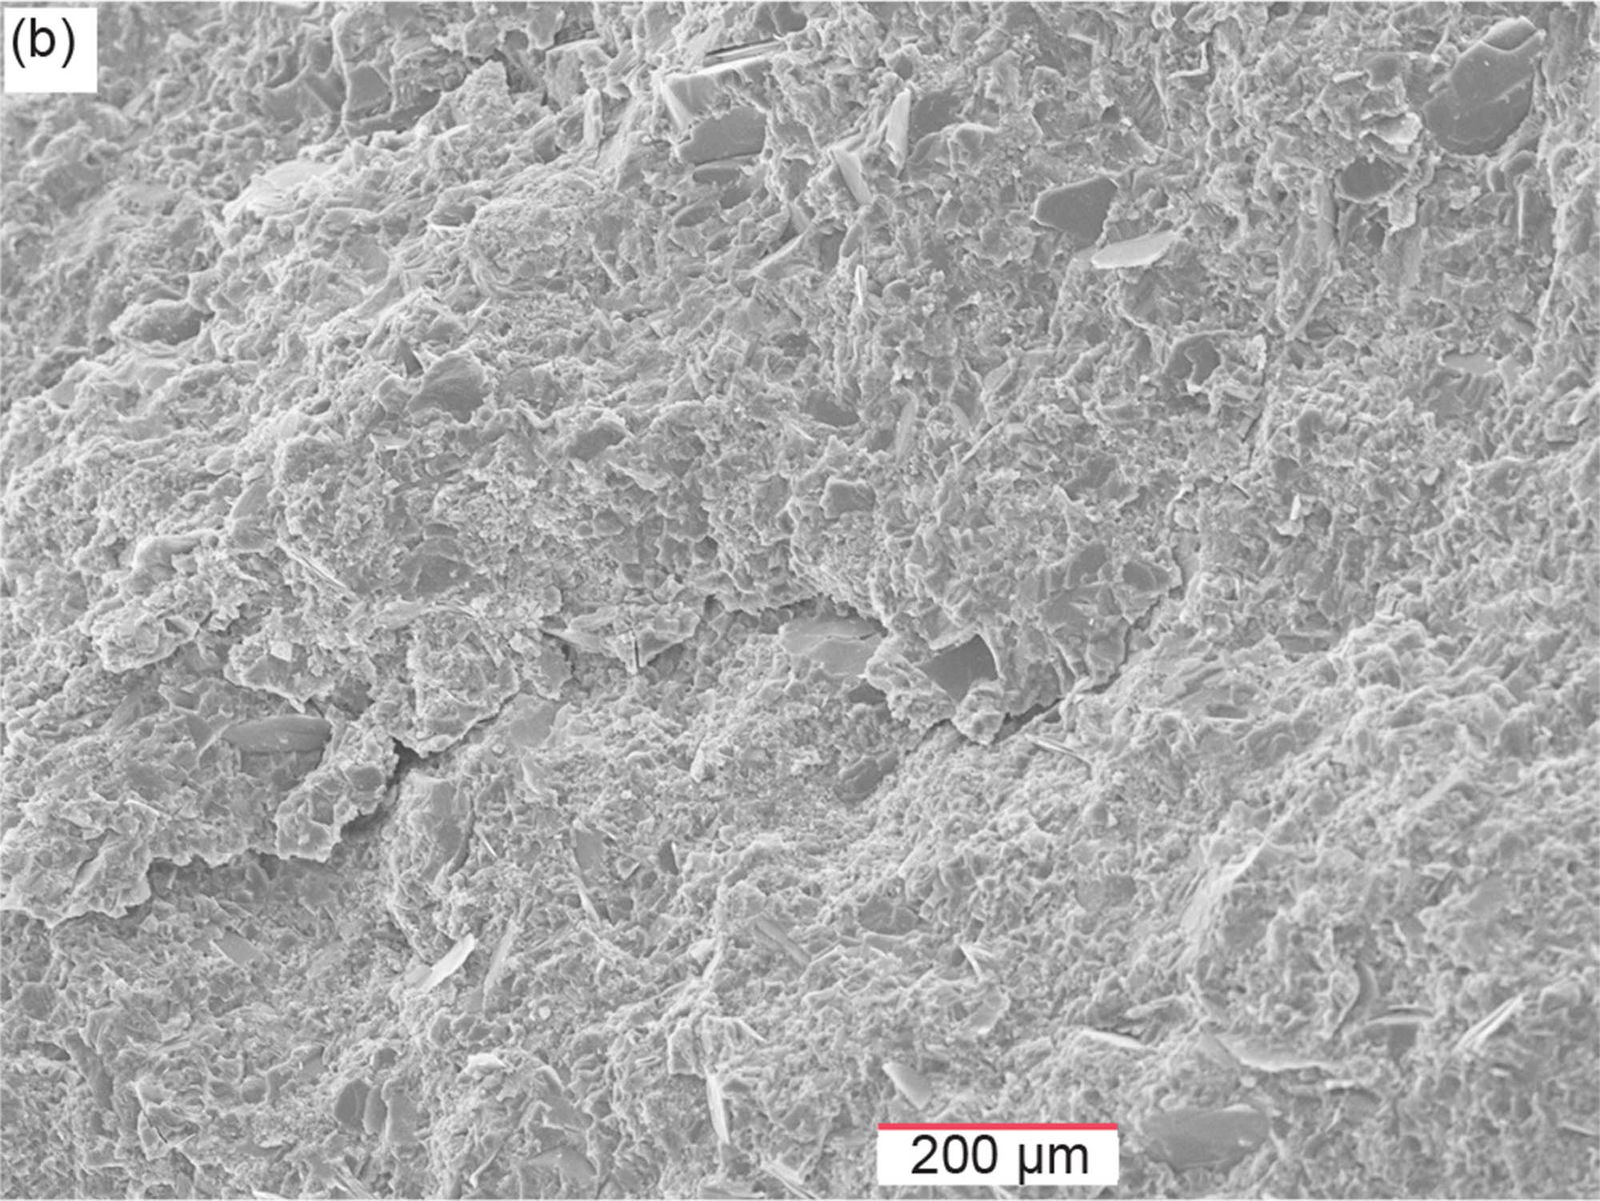
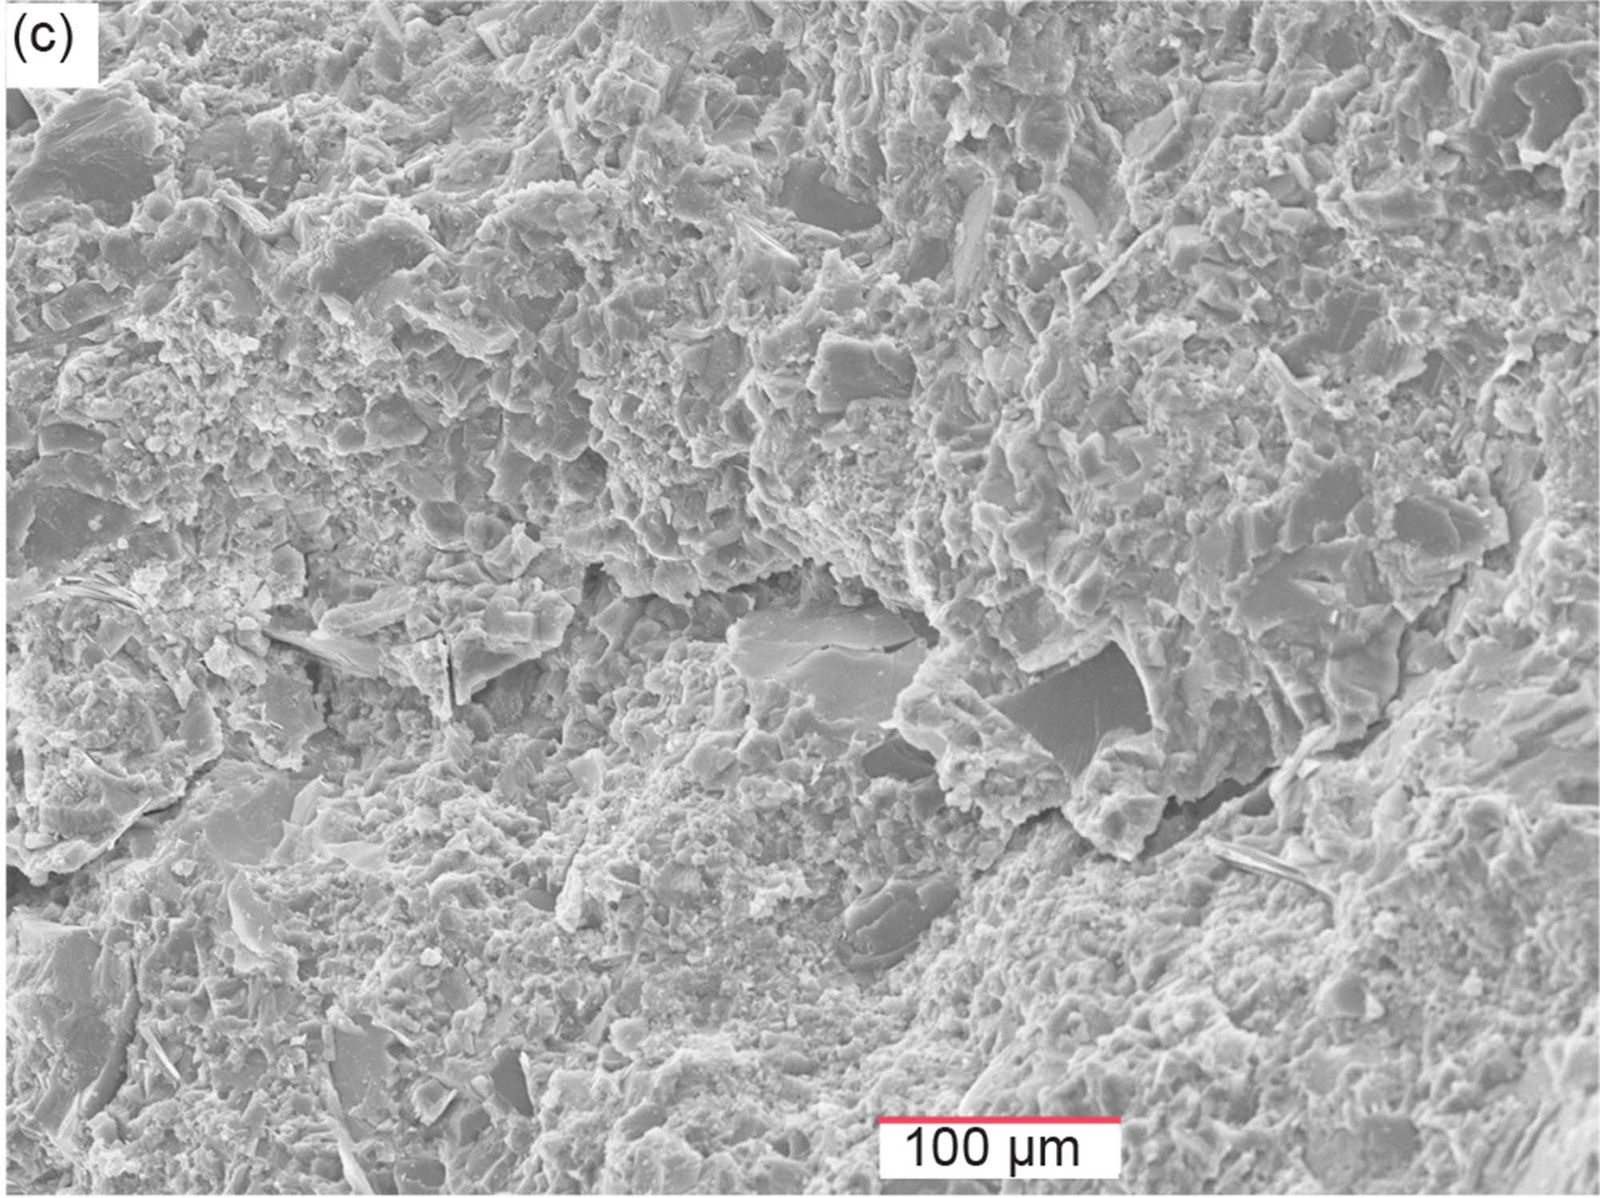
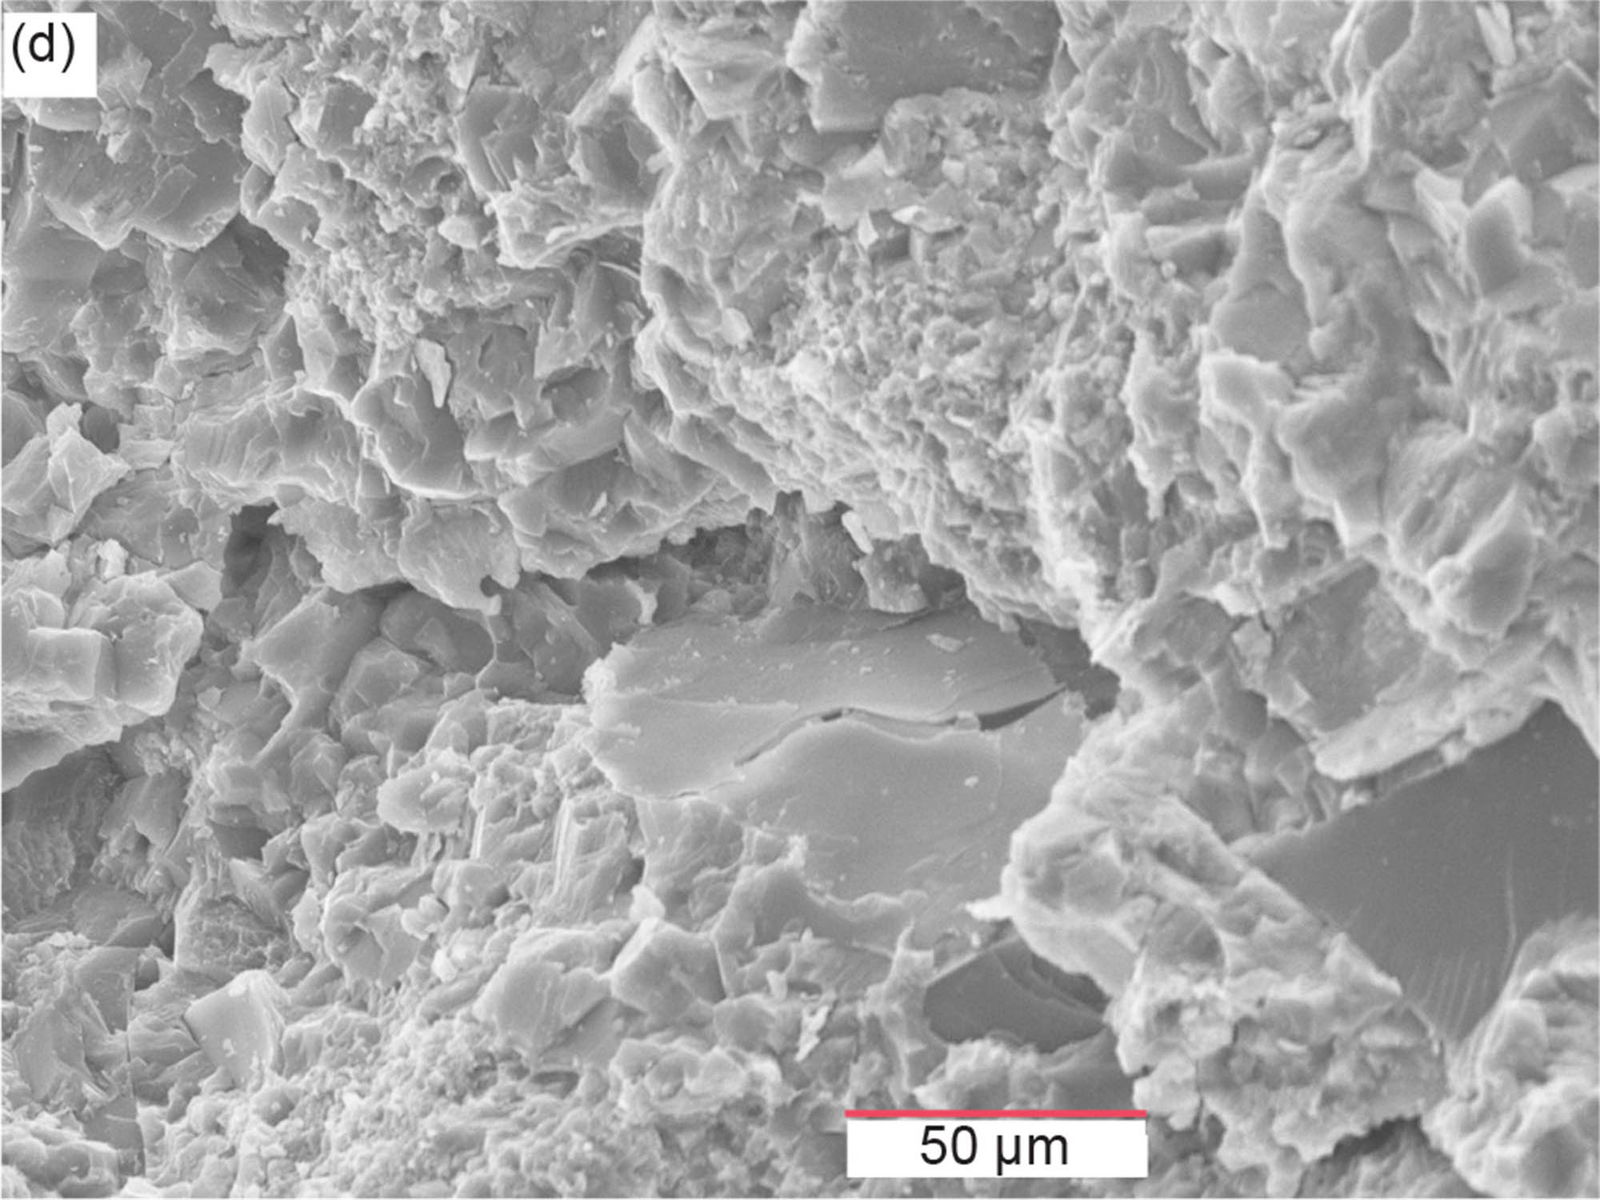
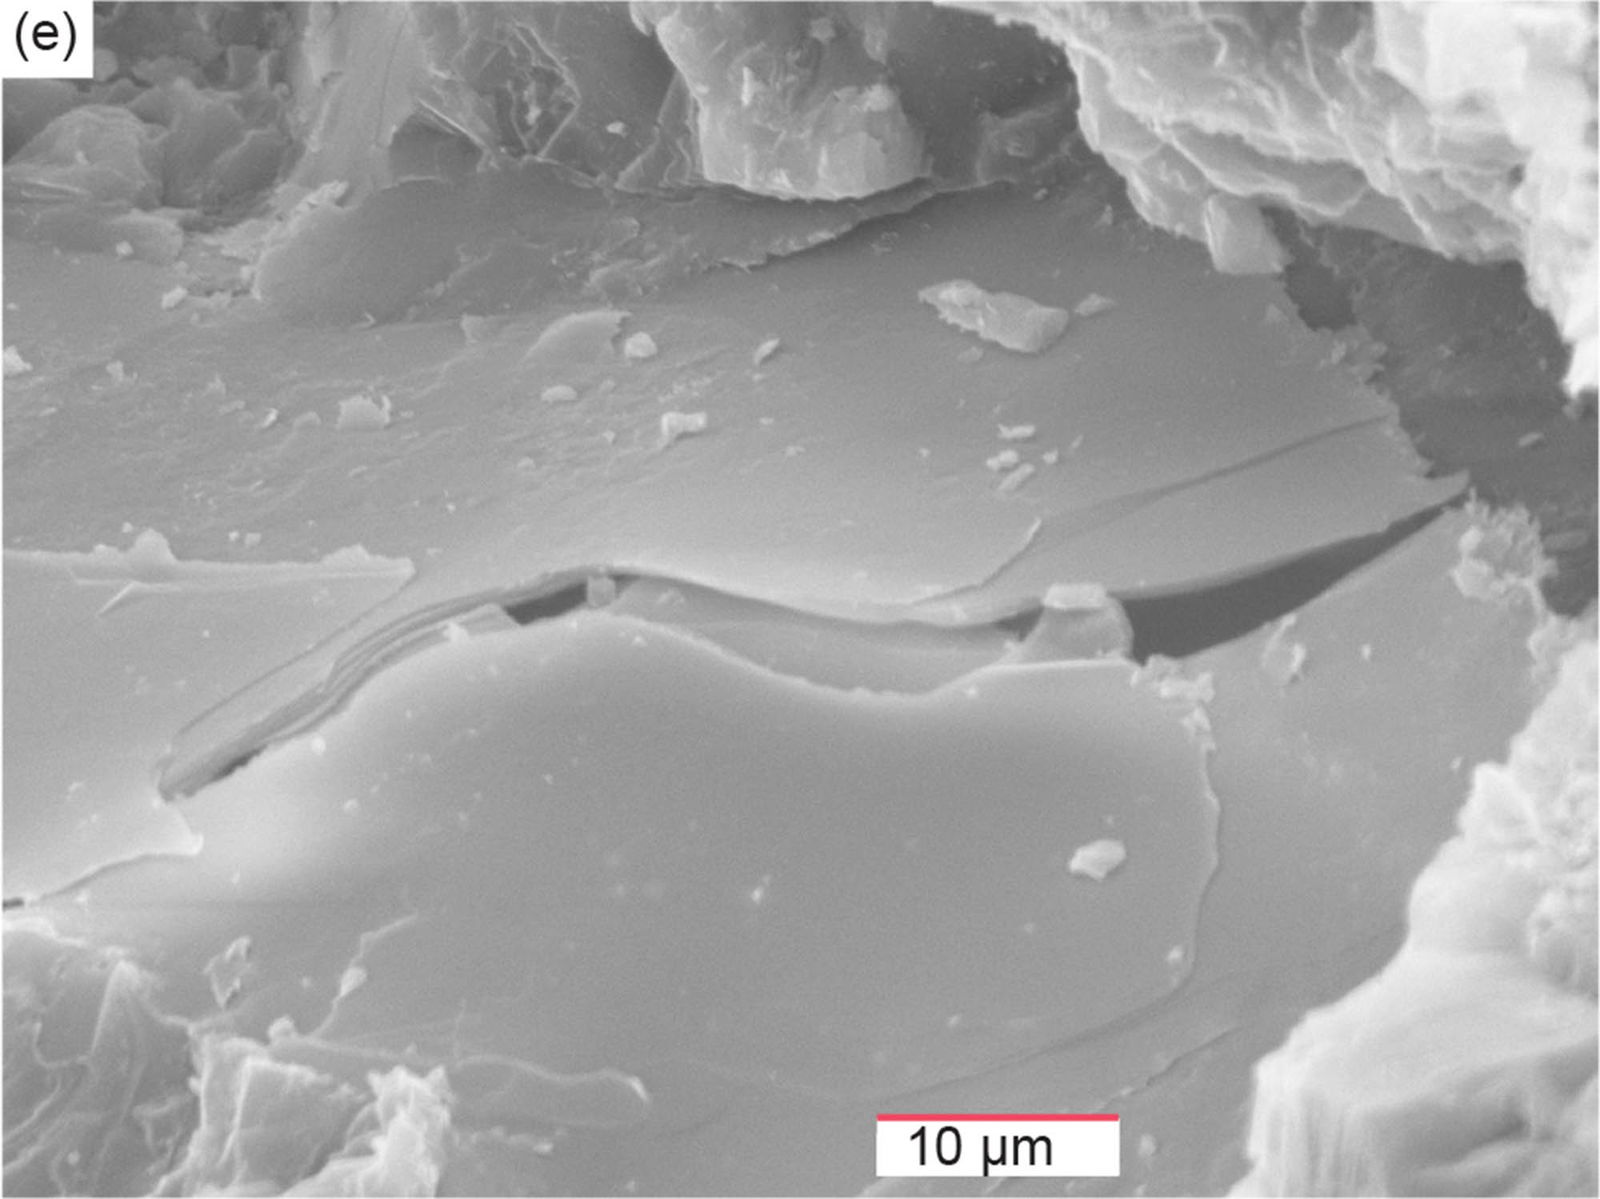
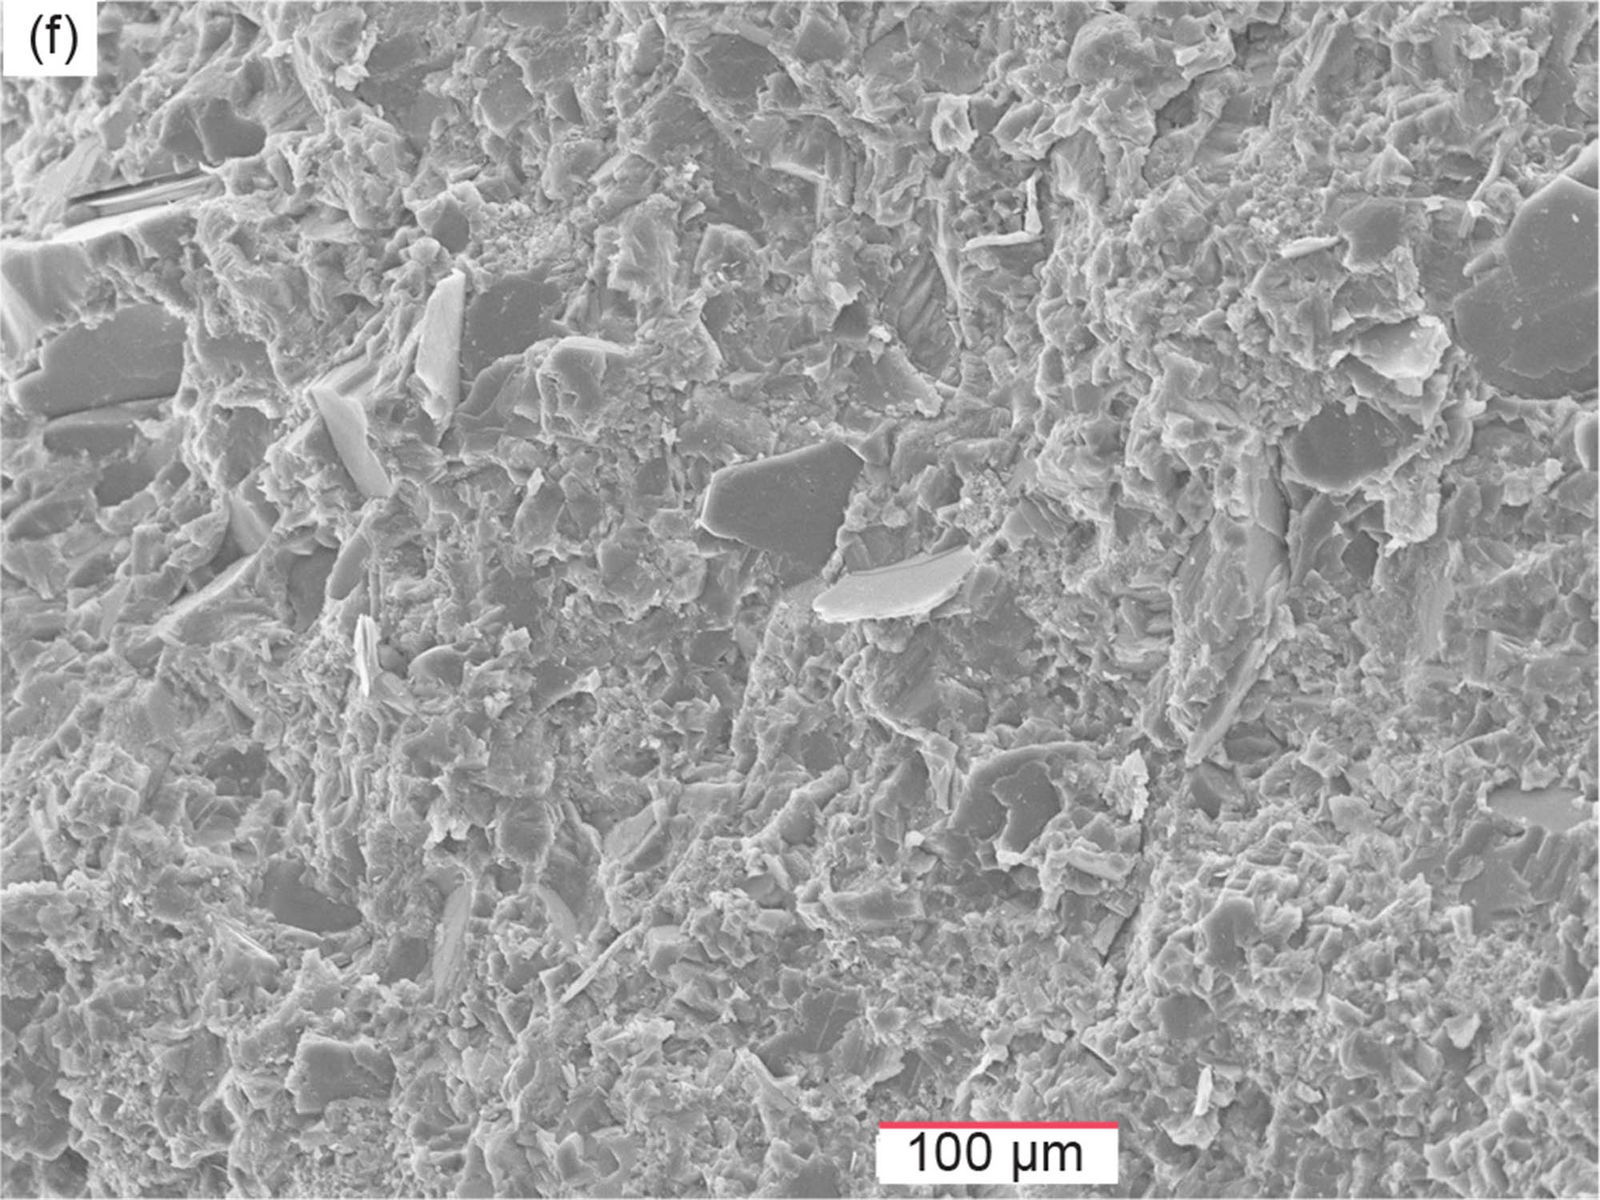
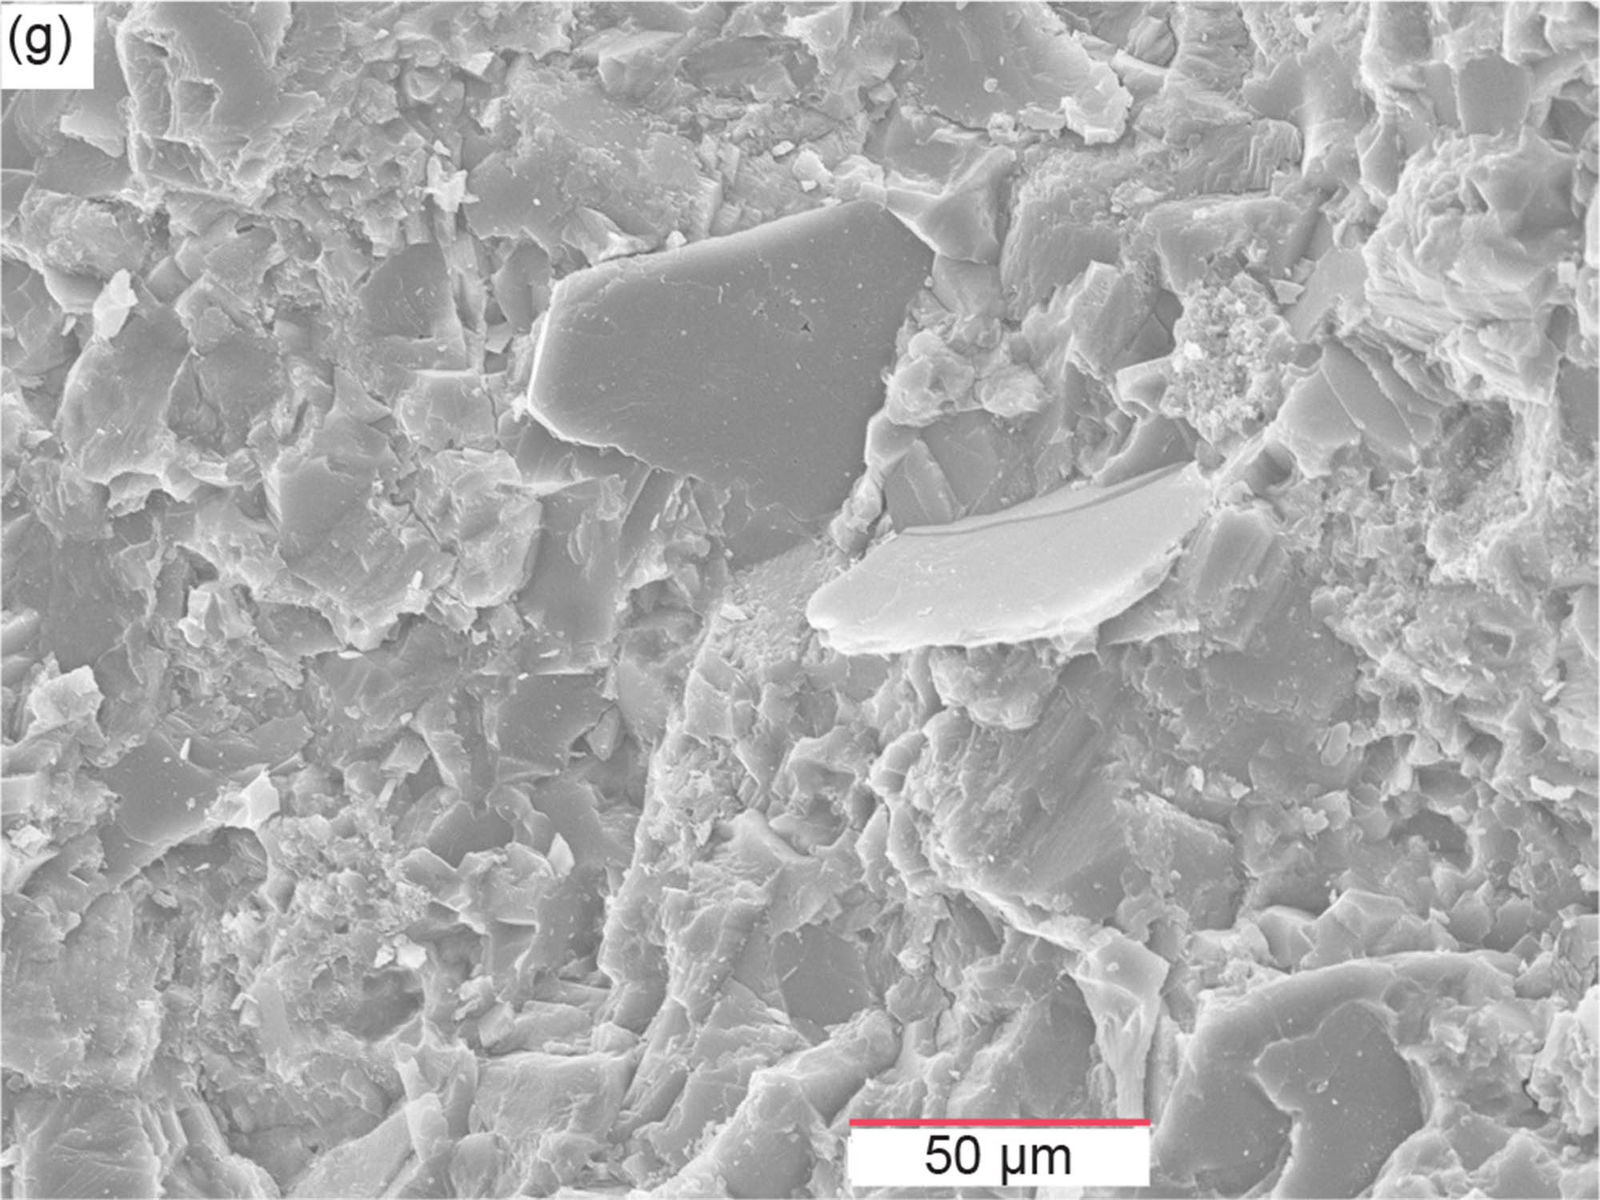
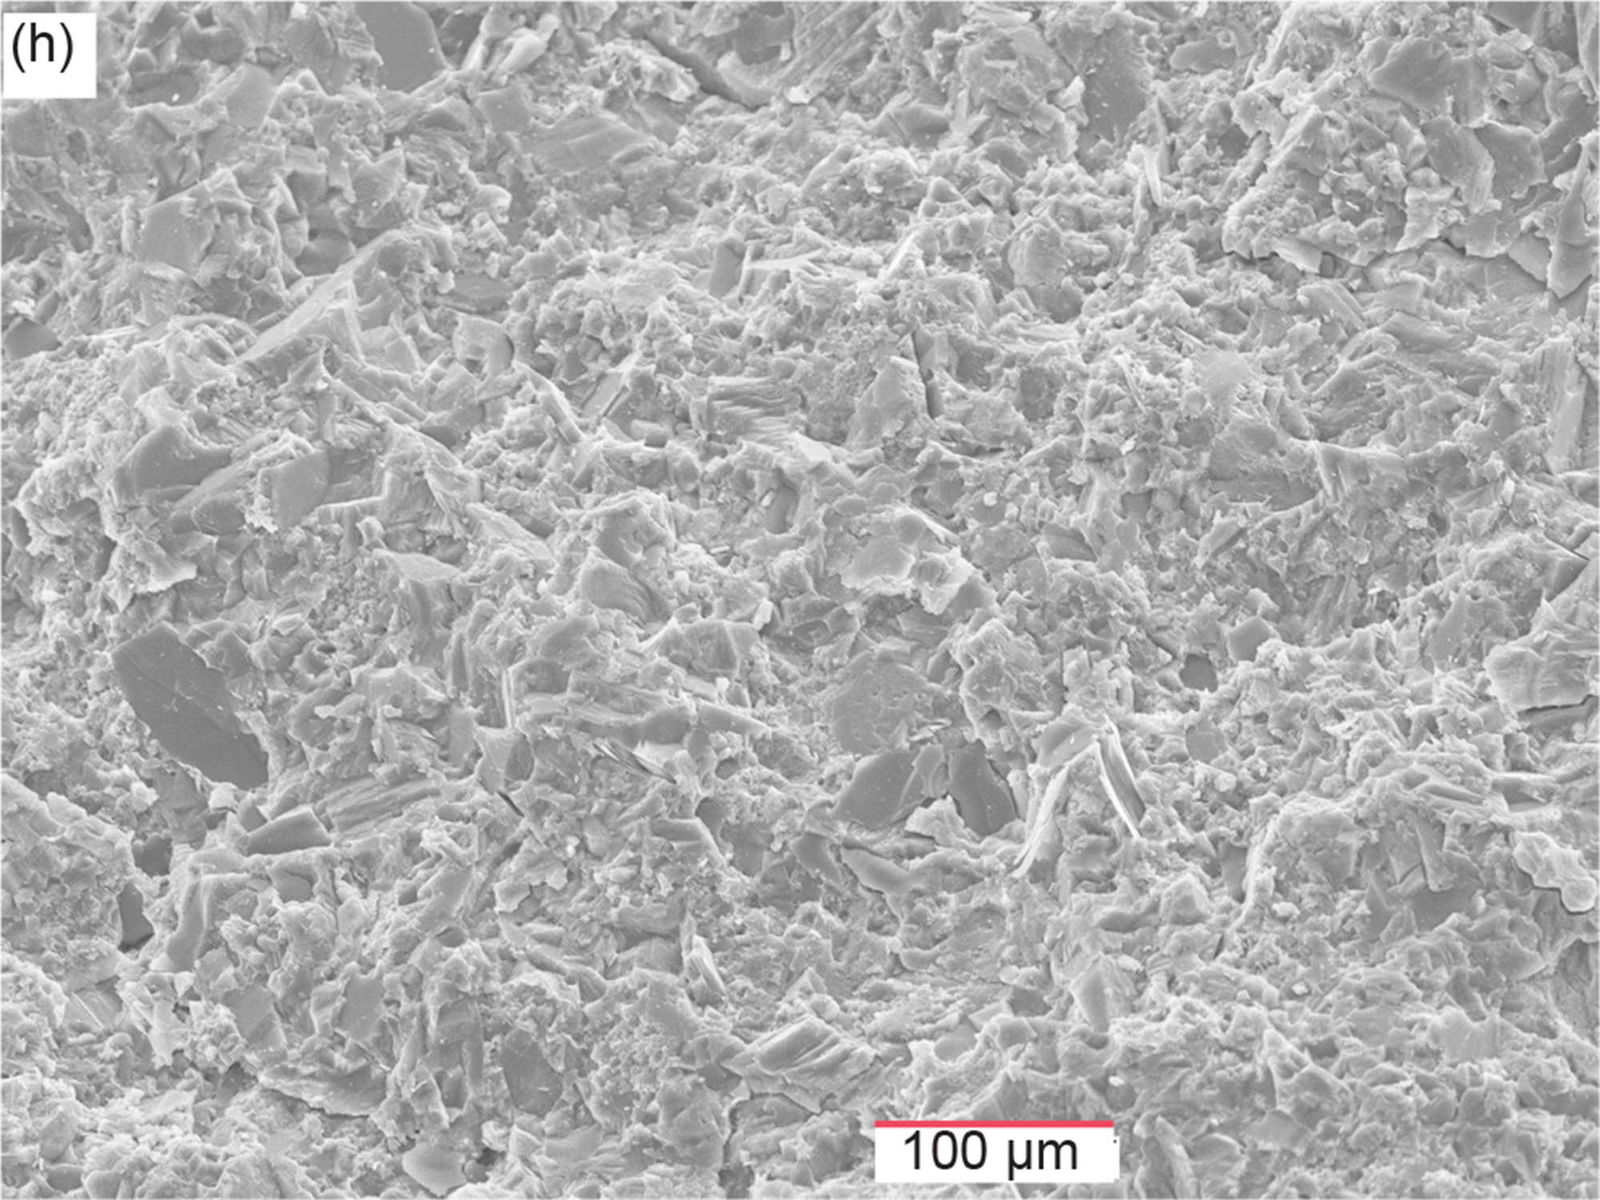
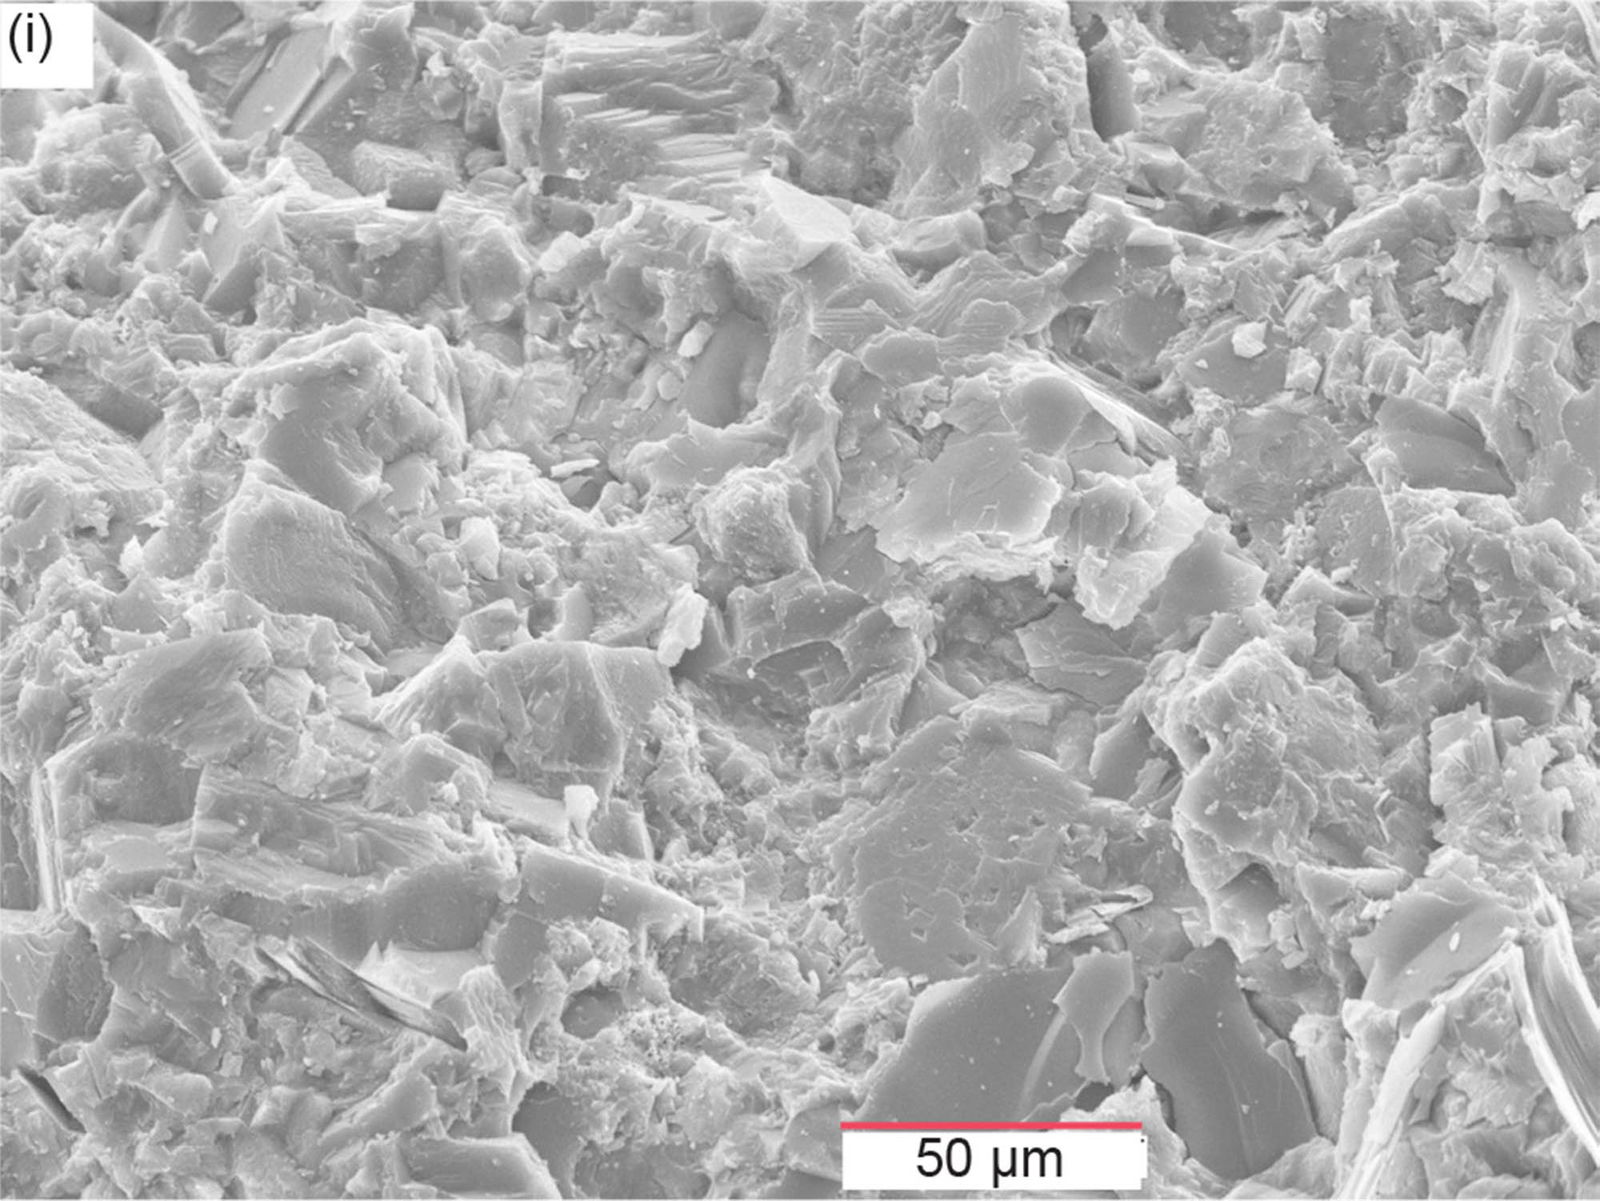
Fig. 40. Scanning electron microscope (SEM) images of sample MFML-04 from the Matkatamiba fold’s hinge zone (see fig. 22 for its location). (a) 50X, (b) 100X, (c) 200X, (d) 500X, (e) 2000X, (f) 200X, (g) 500X, (h) 200X, and (i) 500X.
Fig. 40f is a magnified image of the area above and to the right of the central area in fig. 40b, and itself is further magnified in fig. 40g. The crystal faces of numerous grains can be seen in fig. 40f, many of which would be calcite (for example, the larger crystal displaying characteristic calcite cleavage in the top left corner), as well as some possibly being quartz and K-feldspar grains. Of the two prominent grains magnified in fig. 40g, the one on the right of center is thin with a sheet structure so it is a muscovite flake. The survival of these muscovite flakes in their detrital condition wedged between micrite grains without any distortion or destruction of them conclusively indicates that the folding could not have occurred after cementation as the cement also has not been disrupted, or disrupted and healed, during the folding. Thus, the folding had to occur while this sediment was still soft and damp or wet soon after deposition. And finally, fig. 40h is another magnified image of this sample’s broken-apart surface from a different location than earlier images, with its central area further magnified in fig. 40i. However, these two images display all the same features, namely, the interlocking calcite-cemented detrital micrite, quartz and K-feldspar grains with broken cleaved faces of larger calcite cement crystals that likely represent some recrystallization of micrite, such as in the top left-hand corner area, as well as the smaller undisturbed crystallites of calcite cement or illite in fig. 40i (the latter being significantly present in this sample as indicated in table 2) that are often found in the residual tiny pore spaces attached to the detrital grains with no evidence of grain boundary sliding.
Sample MFML-05 is also from the uppermost Gateway Canyon Member, along the same bed laterally some 4 m (13 ft) from sample MFML-04 but in the linear section between the two flexures within the hinge zone of the Matkatamiba fold (fig. 22). Fig. 41a is a low magnification image of the sample’s broken-apart surface, which is similar to that in previous samples already discussed above, and its central area is progressively magnified in the images in fig. 41b–e. It is only at the higher magnification in the images in fig. 41c–e, which are of the area left of center in fig. 41b, that the features in this rock’s fabric can be clearly seen. Once again, as in all the previous samples, the characteristic cleavage of calcite can be seen where the crystallized micrite and cement has been broken apart during sample preparation, though it is also difficult to distinguish any detrital quartz and K-feldspar grains embedded in the recrystallized micrite and calcite cement. Overall, again there is no evidence of any disruption to the rock fabric, such that the recrystallized micrite and calcite cement have not been disrupted by the folding process. It is not clear here whether the recrystallization occurred after folding and thus would represent healing of any previous disruption, but the observations made from previous samples do not substantiate that scenario. Of further interest is the hairy white crystals in fig. 41d–e, which are likely illite. They are wedged within the recrystallized micrite and calcite cement, and given they likely are the result of late-stage alteration during diagenesis and even later weathering, they have grown in between larger calcite crystals produced by the recrystallization. In fig.41e fresh cracks can also be seen within the recrystallized micrite and calcite cement which may be due to the sample preparation process.
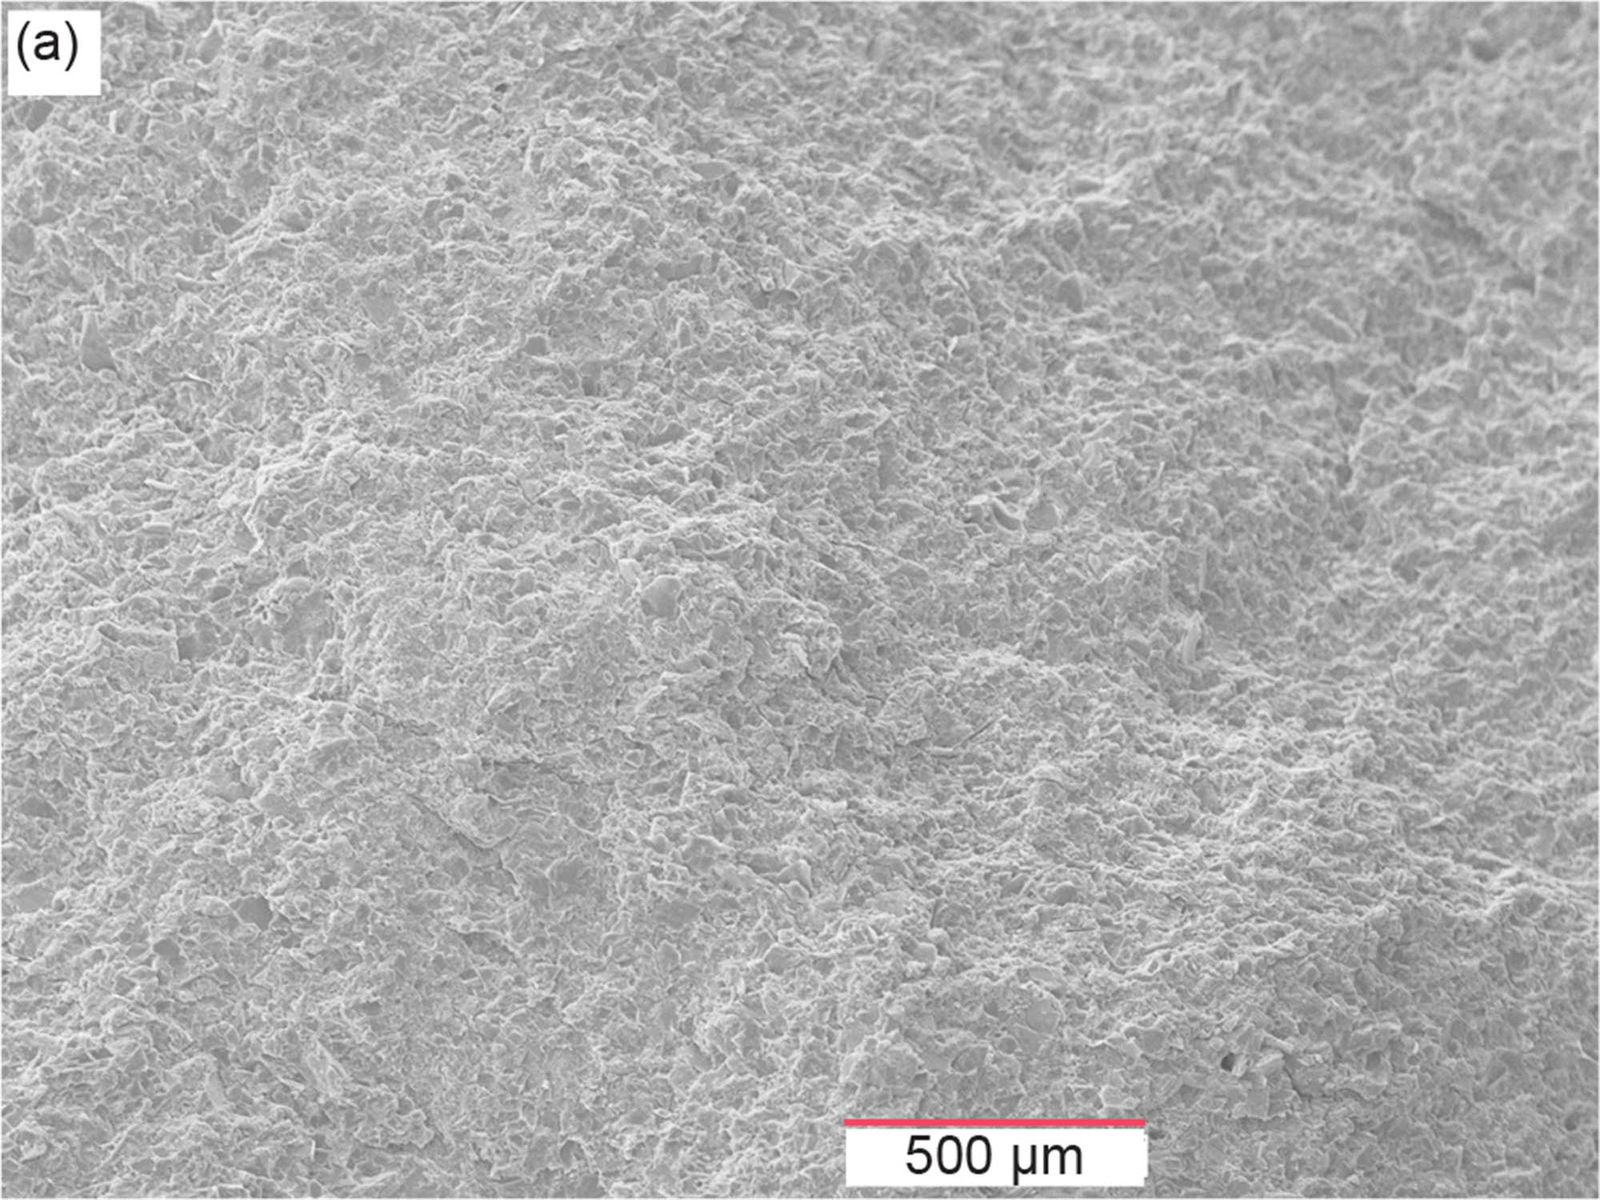
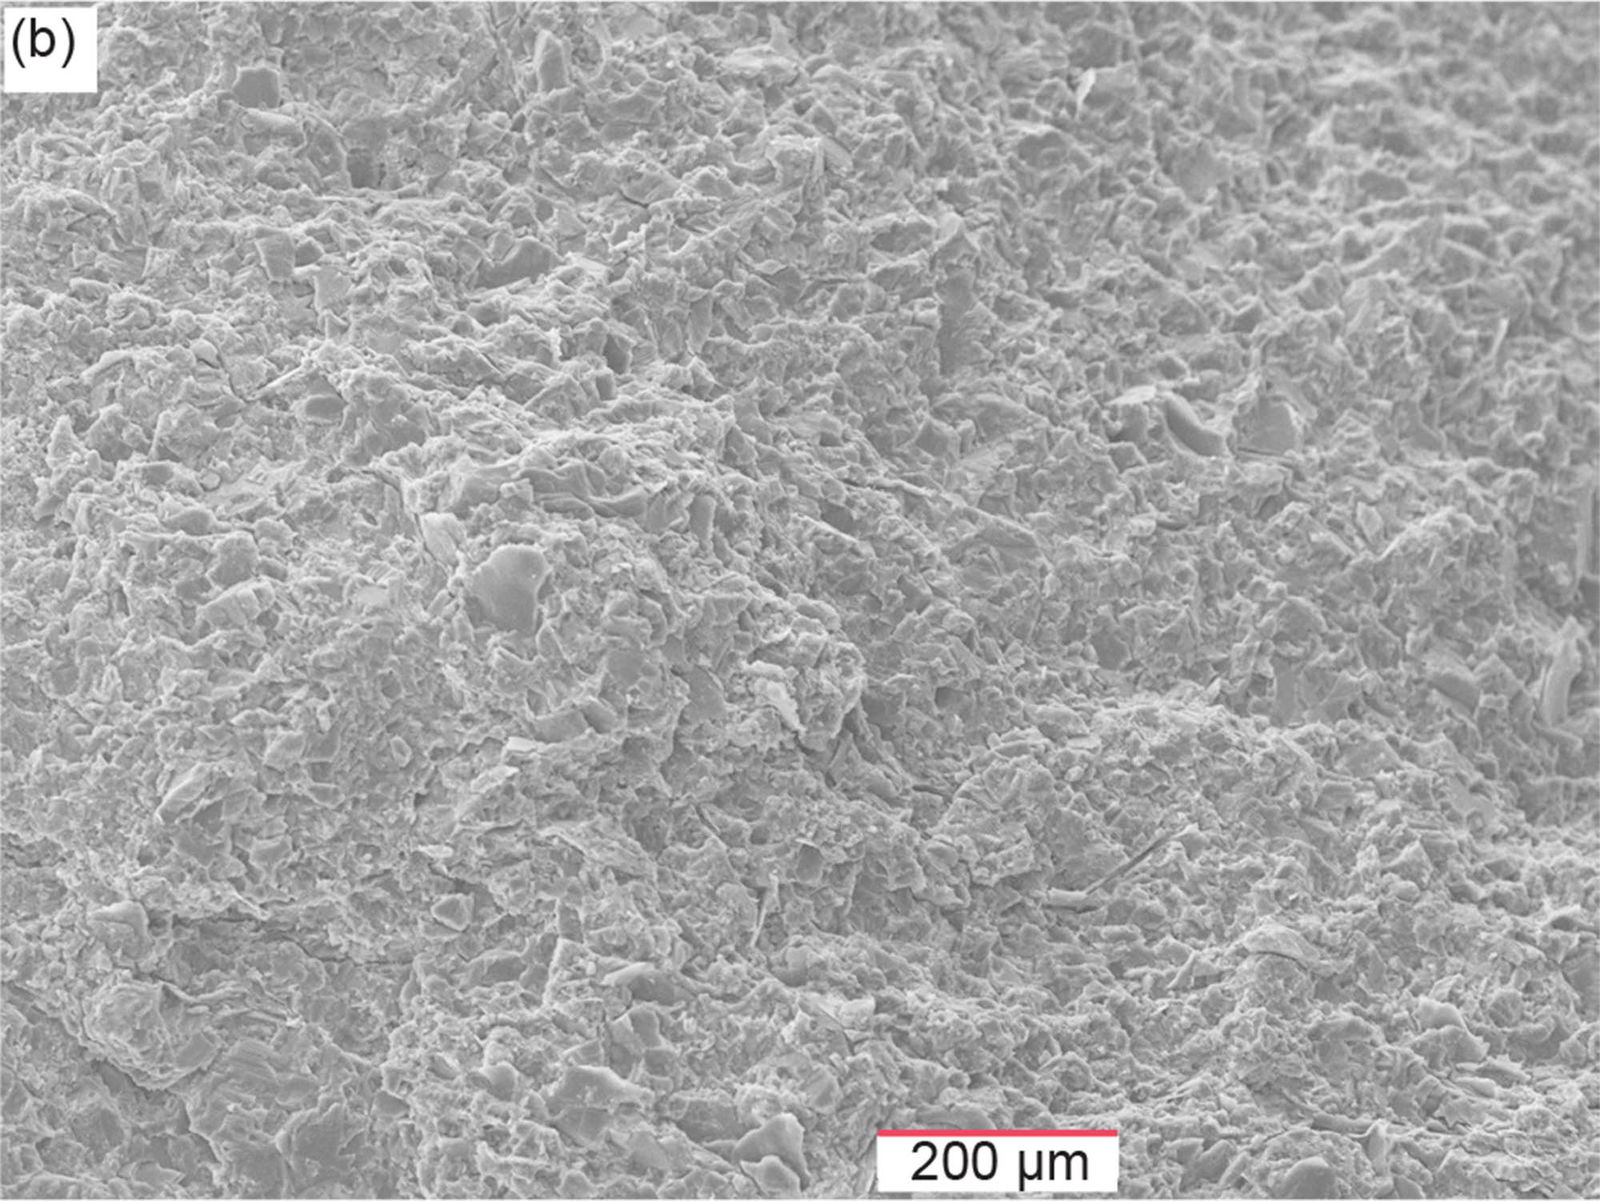
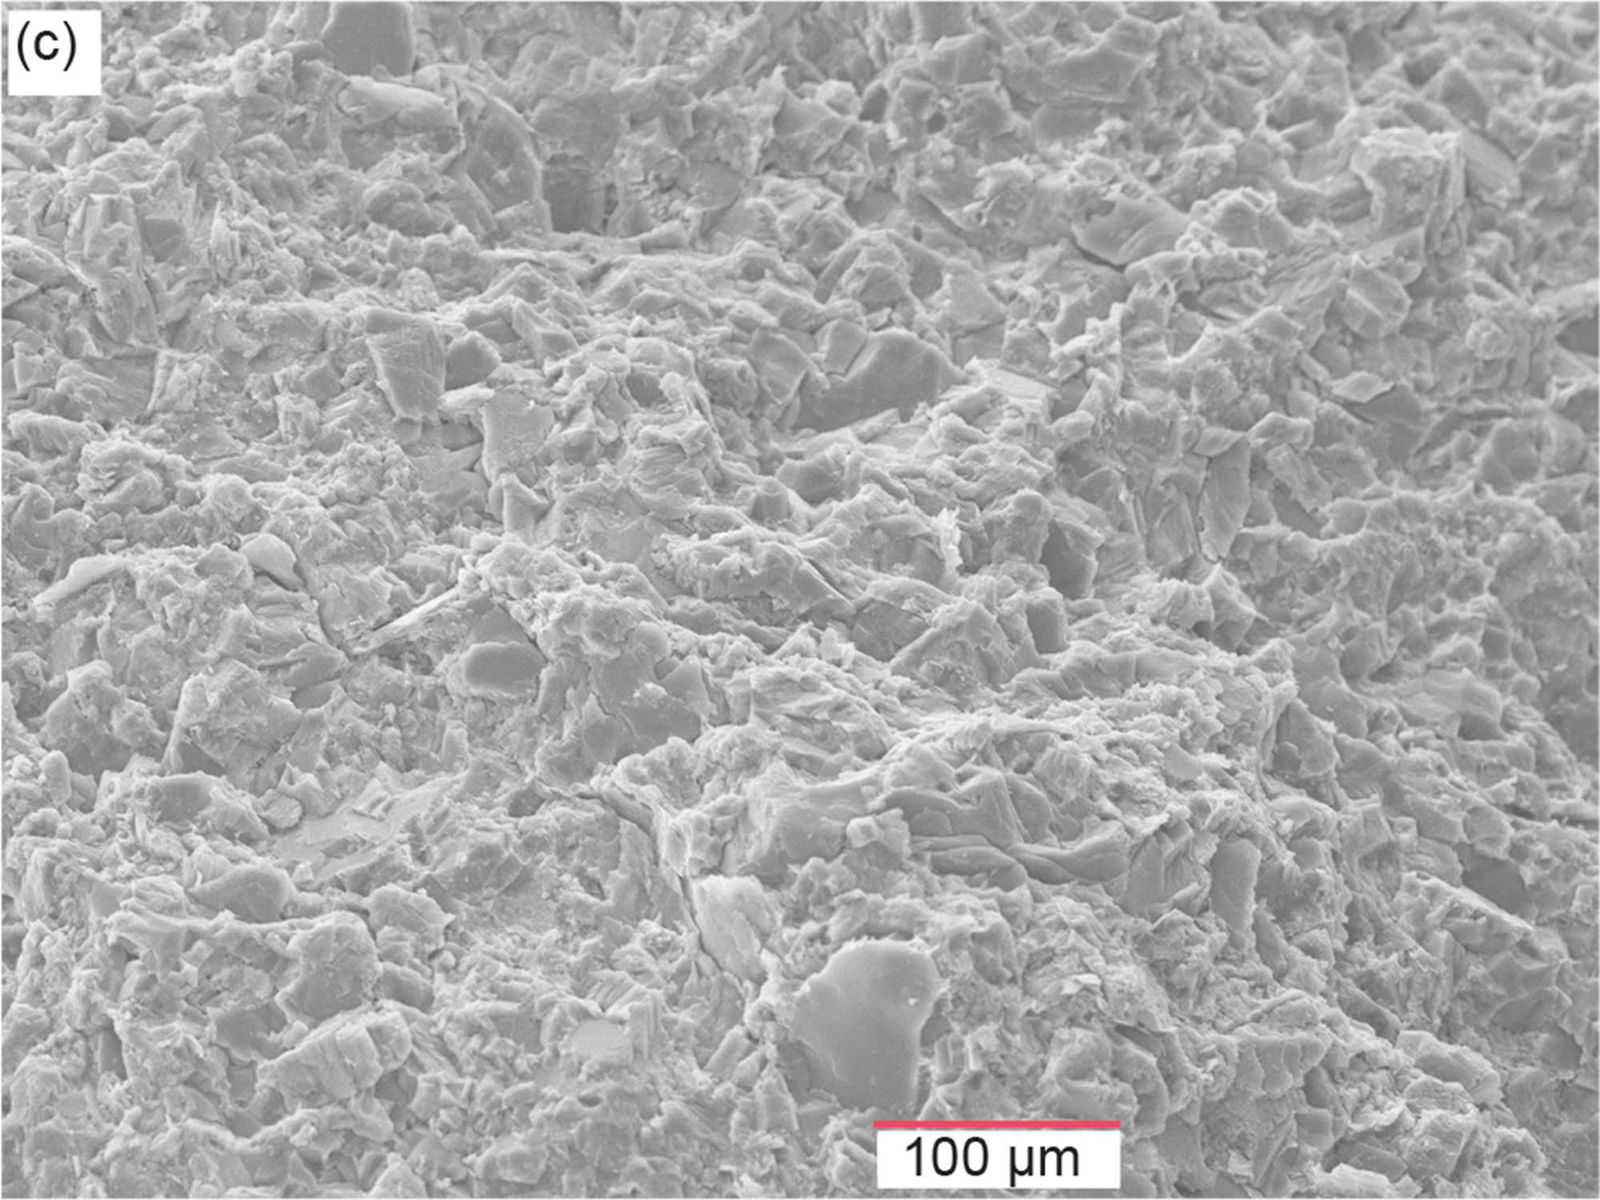
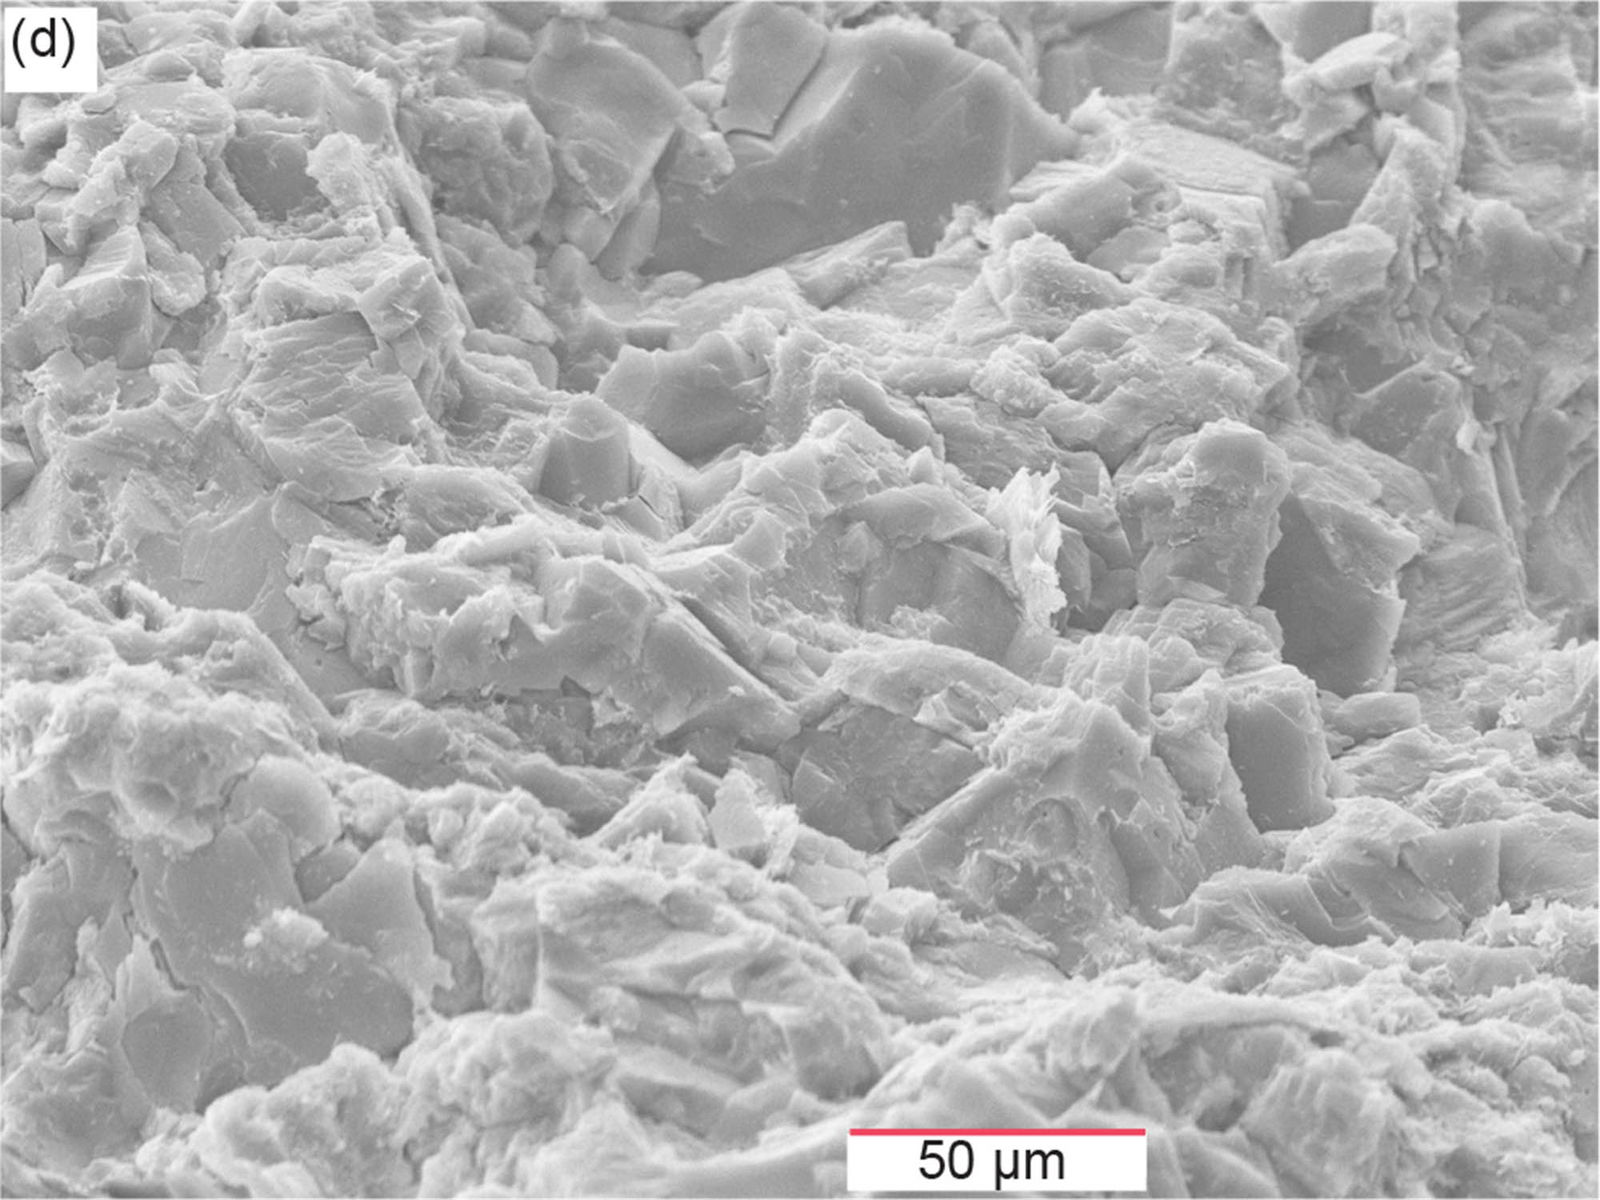
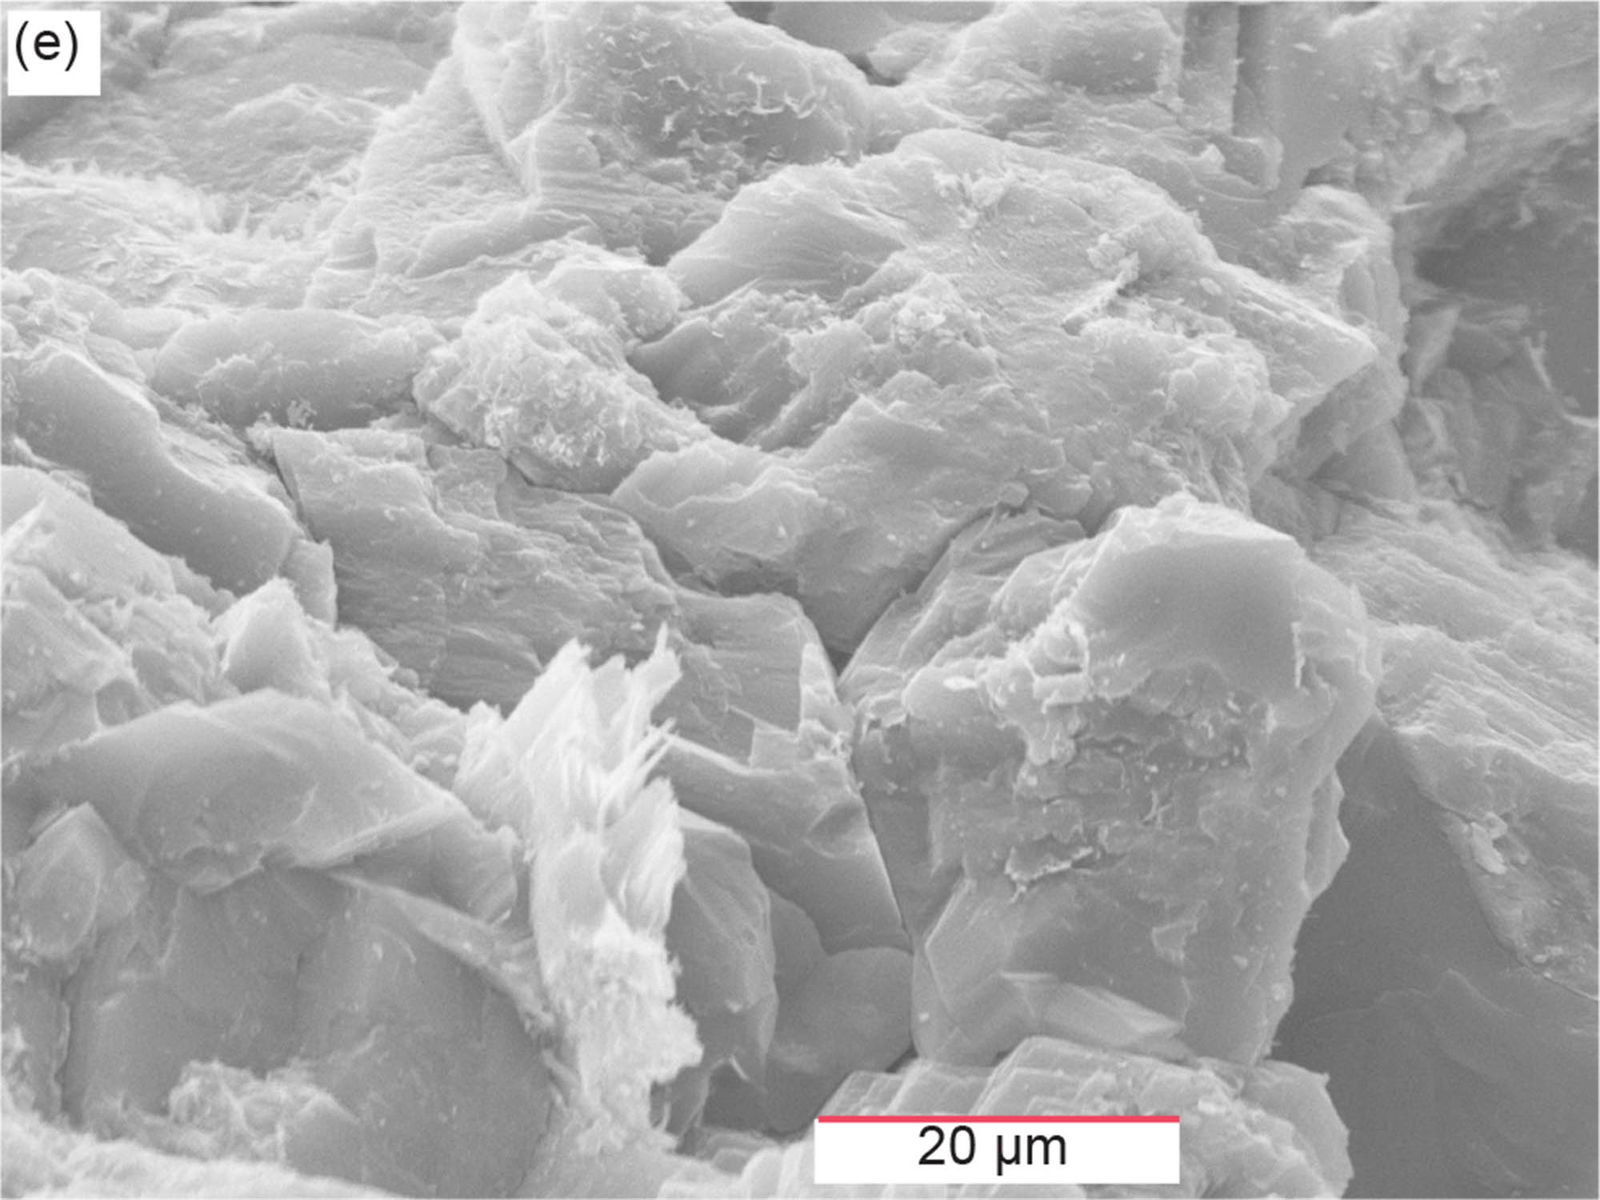
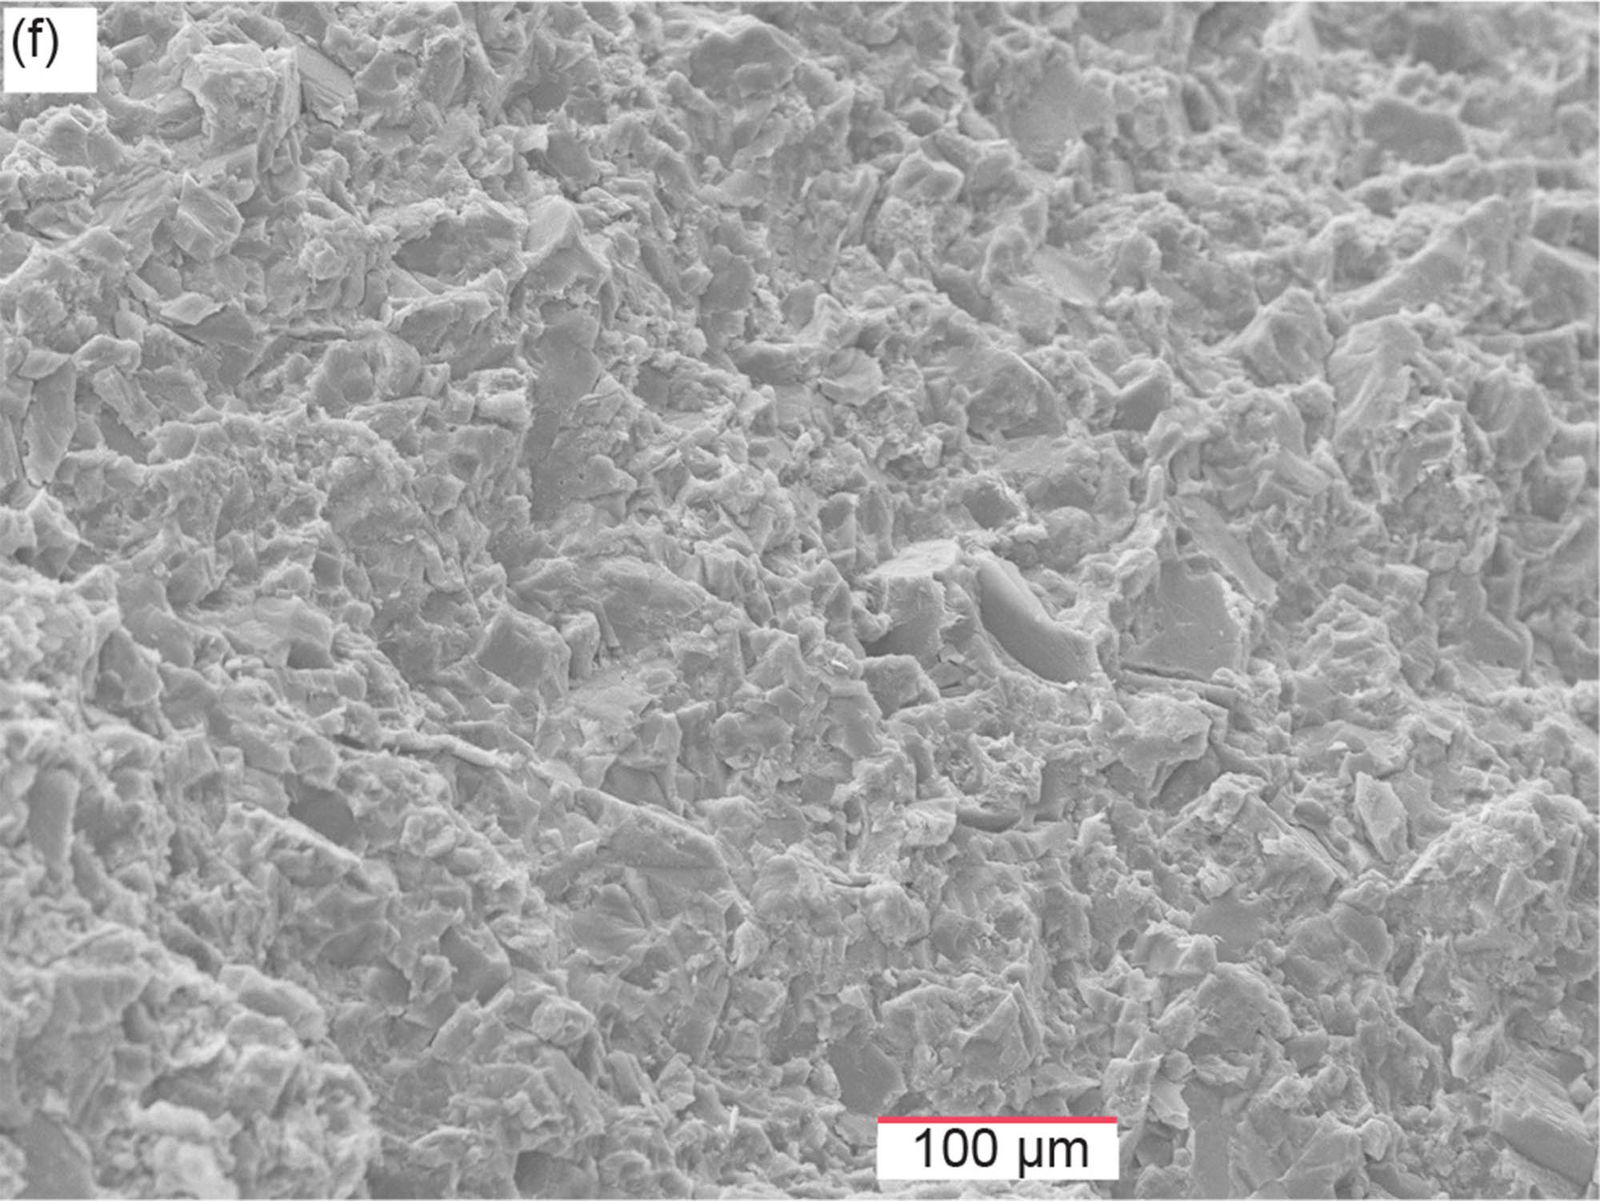
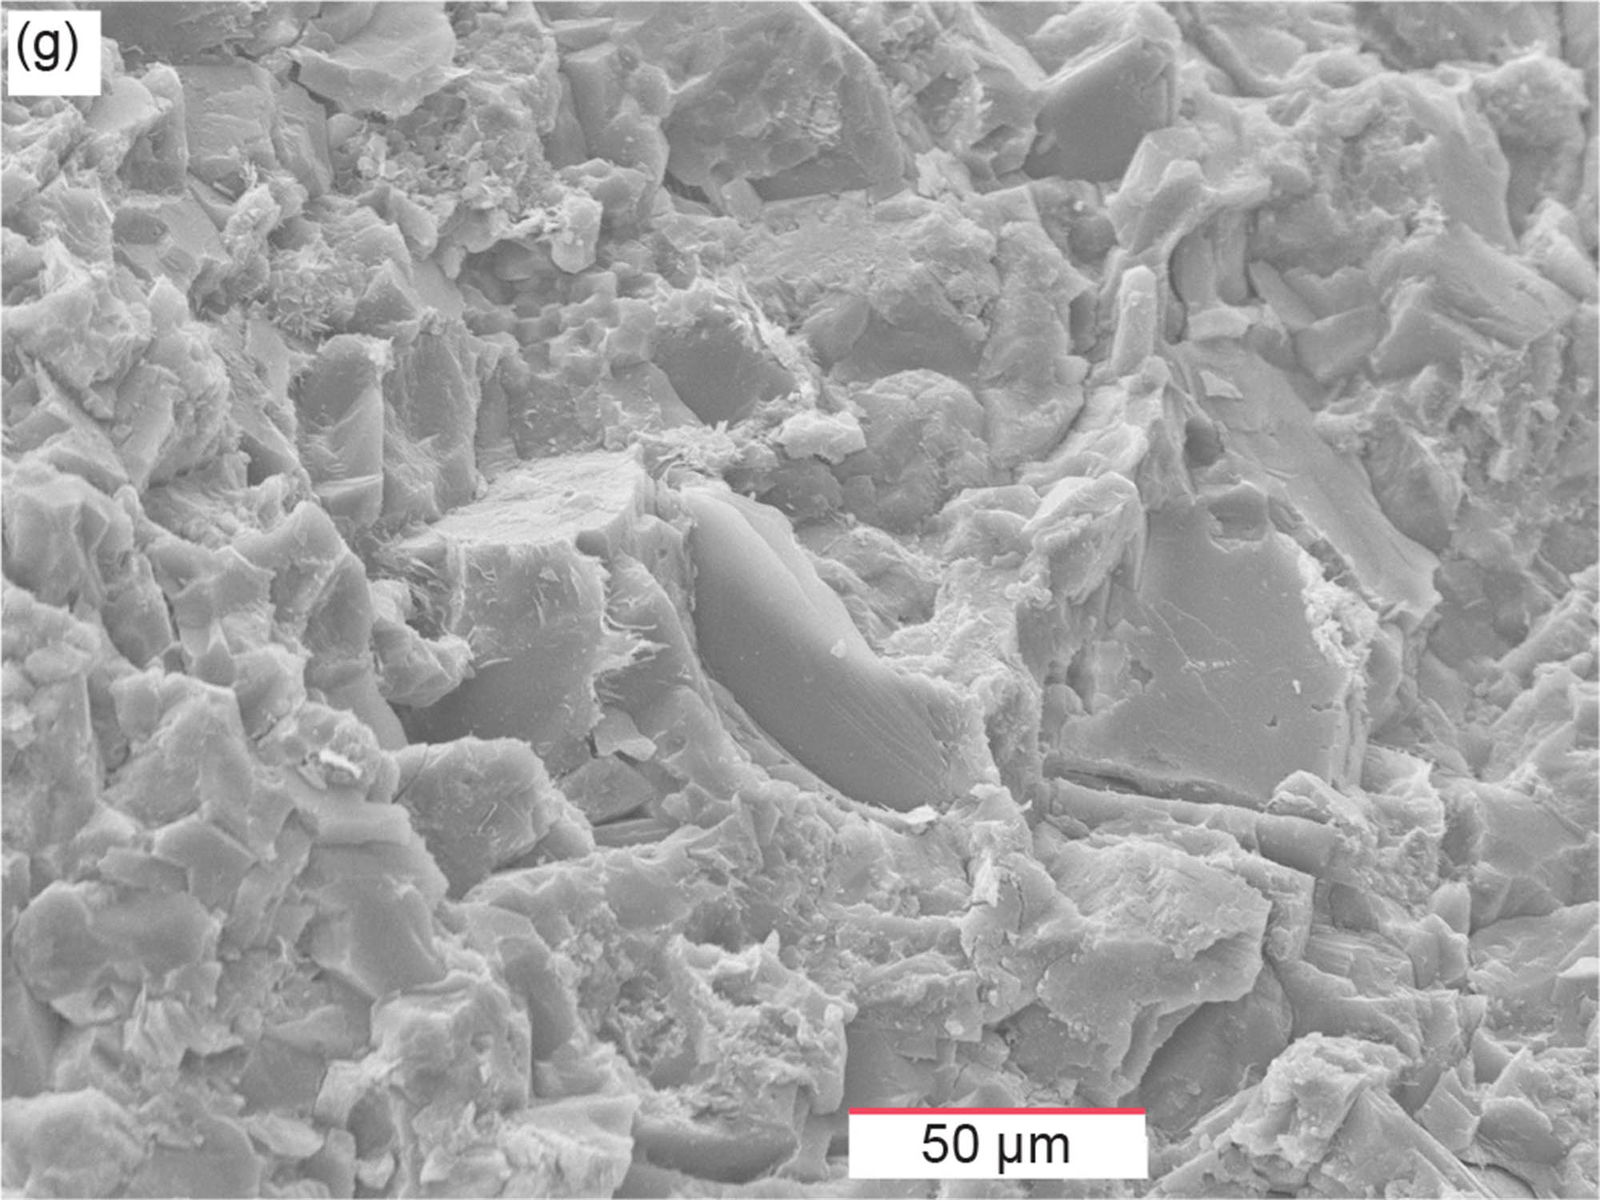
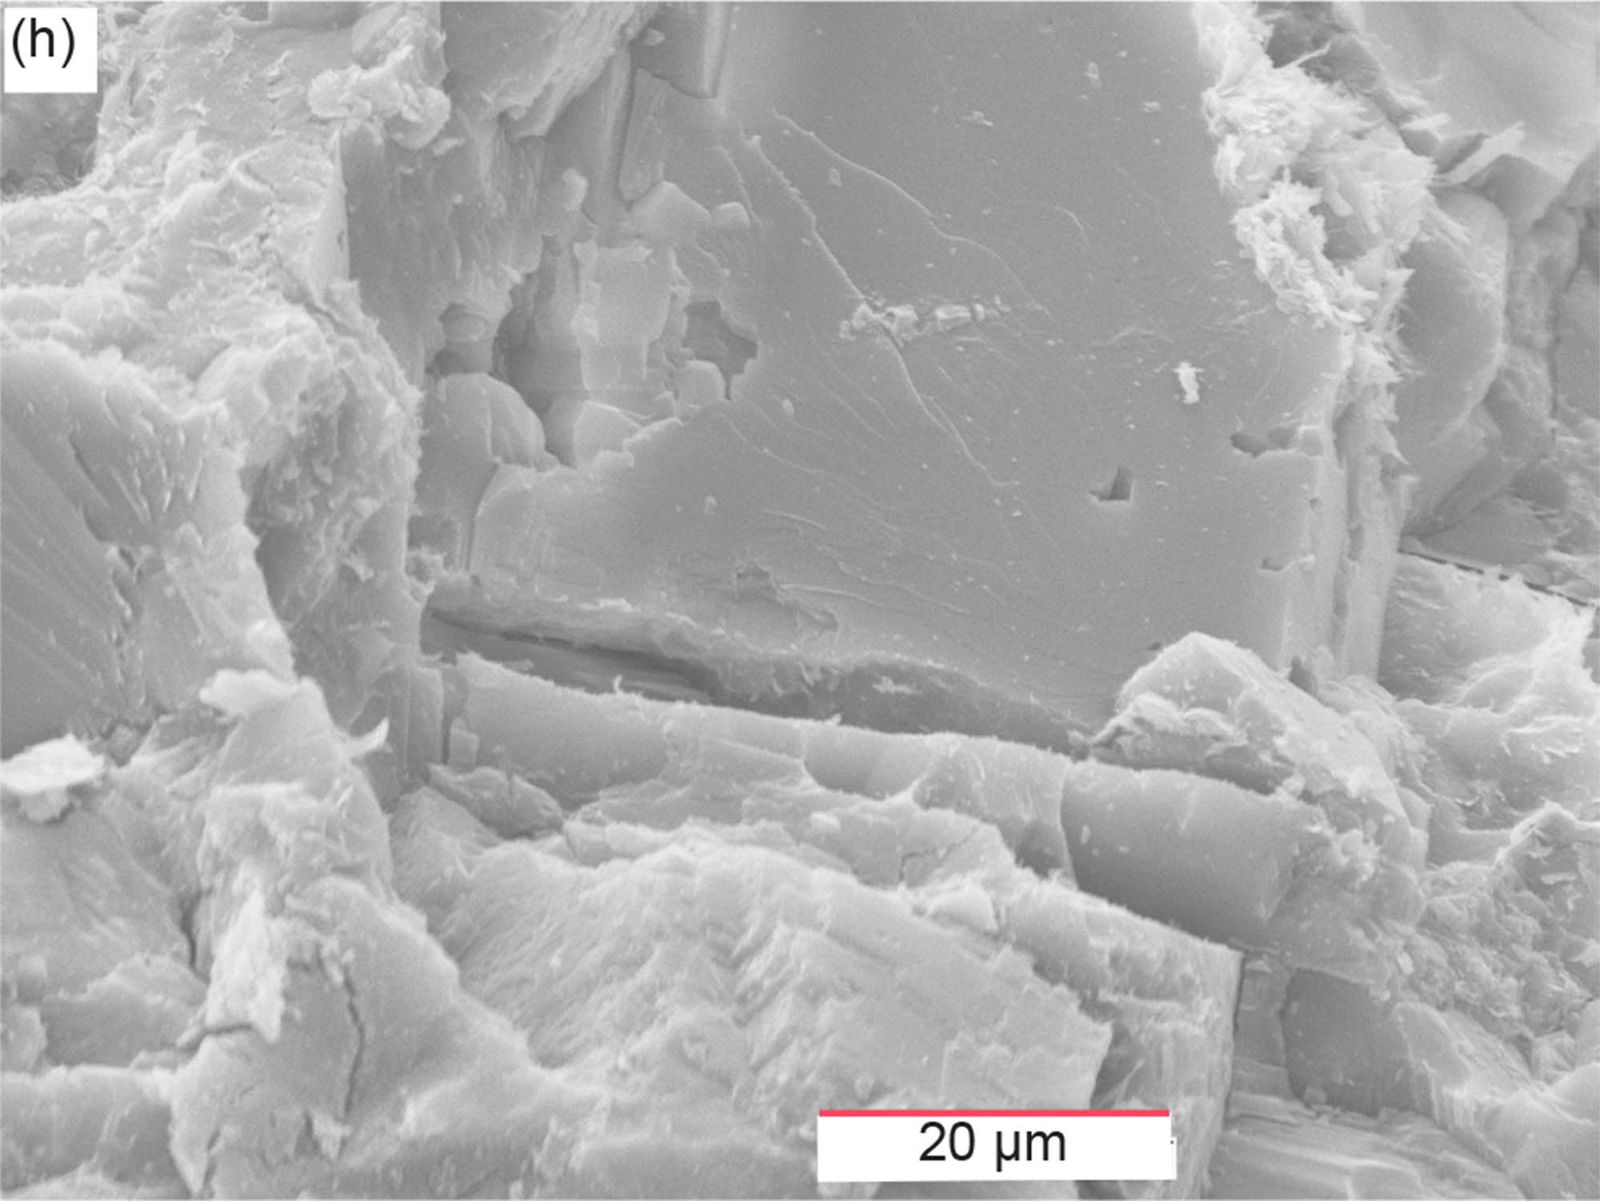
Fig. 41. Scanning electron microscope (SEM) images of sample MFML-05 from the Matkatamiba fold’s hinge zone (see fig. 22 for its location). (a) 50X, (b) 100X, (c) 200X, (d) 500X, (e) 1500X, (f) 200X, (g) 500X, and (h) 1500X.
Fig. 41f is a magnified image of the area to the right of center in fig. 41b, and itself further progressively magnified in fig. 41g–h. Most of the same observations made above could be repeated here, but the primary features to be seen in these images are seen at the higher magnifications in fig. 41g–h. There is a prominent clean crack within the exposed smooth crystal face of the recrystallized micrite and calcite cement along which there has been a small separation of each side of the crack perpendicular to them. There is a hint of some possible tiny specks of illite adhering to the walls of the crack. If so, that would indicate the crack occurred when the sample was in situ. The sample’s broken-apart surface in these images is the same, with calcite cement coated micrite, and likely a few quartz and K-feldspar, grains and larger crystals of recrystallized micrite and calcite cement all tightly interlocked, without any suggestion of disruption and healing, so that it is evident the cementation and recrystallization occurred after the micrite sediment with minor quartz and K-feldspar grains and sparse detrital muscovite flakes was folded while still soft and damp soon after deposition.
Sample MFML-06 is also from the uppermost Gateway Canyon Member, along the same bed laterally some 6 m (19.5 ft) from sample MFML-05, but in the upper hinge zone of the Matkatamiba fold (fig. 22). Fig. 42a is again a low magnification general view of this sample’s broken-apart surface, which again is identical in its features to all other samples described above, whether distal or from this fold. The central area in fig.42a is then progressively magnified in fig. 42b–e. The flat clean crystal faces (that appear darker than the rest of the surface and are generally larger) are probably quartz, and perhaps some K-feldspar, grains wedged between the finer-grained micrite (mud-sized calcite particles). Some cleavage faces of recrystallized micrite and calcite cement are evident, scattered across the sample surface, most easily seen in fig. 42c–d. In fig. 42b several edge-on muscovite flakes are apparent, and two of these are more clearly seen in the magnified images in fig.42d–e, h. Indeed, in fig, 42d–e the magnified edge-on muscovite flake is bent around other grains, which are likely micrite grains cemented by calcite. This indicates the muscovite is still in its detrital condition. The bending of the flake most likely occurred due to compactional loading by the thousands of feet of overlying strata, but there have been no metamorphic effects on this muscovite due to the heat and pressure from its deep burial. This sample comes from the hinge zone where the effects of the folding should be most obvious, but this sample appears to be no different to the distal and the fold’s limb samples. Thus, while some recrystallization of the detrital micrite and calcite cement has occurred, there is no evidence of any effects of claimed ductile deformation during folding.
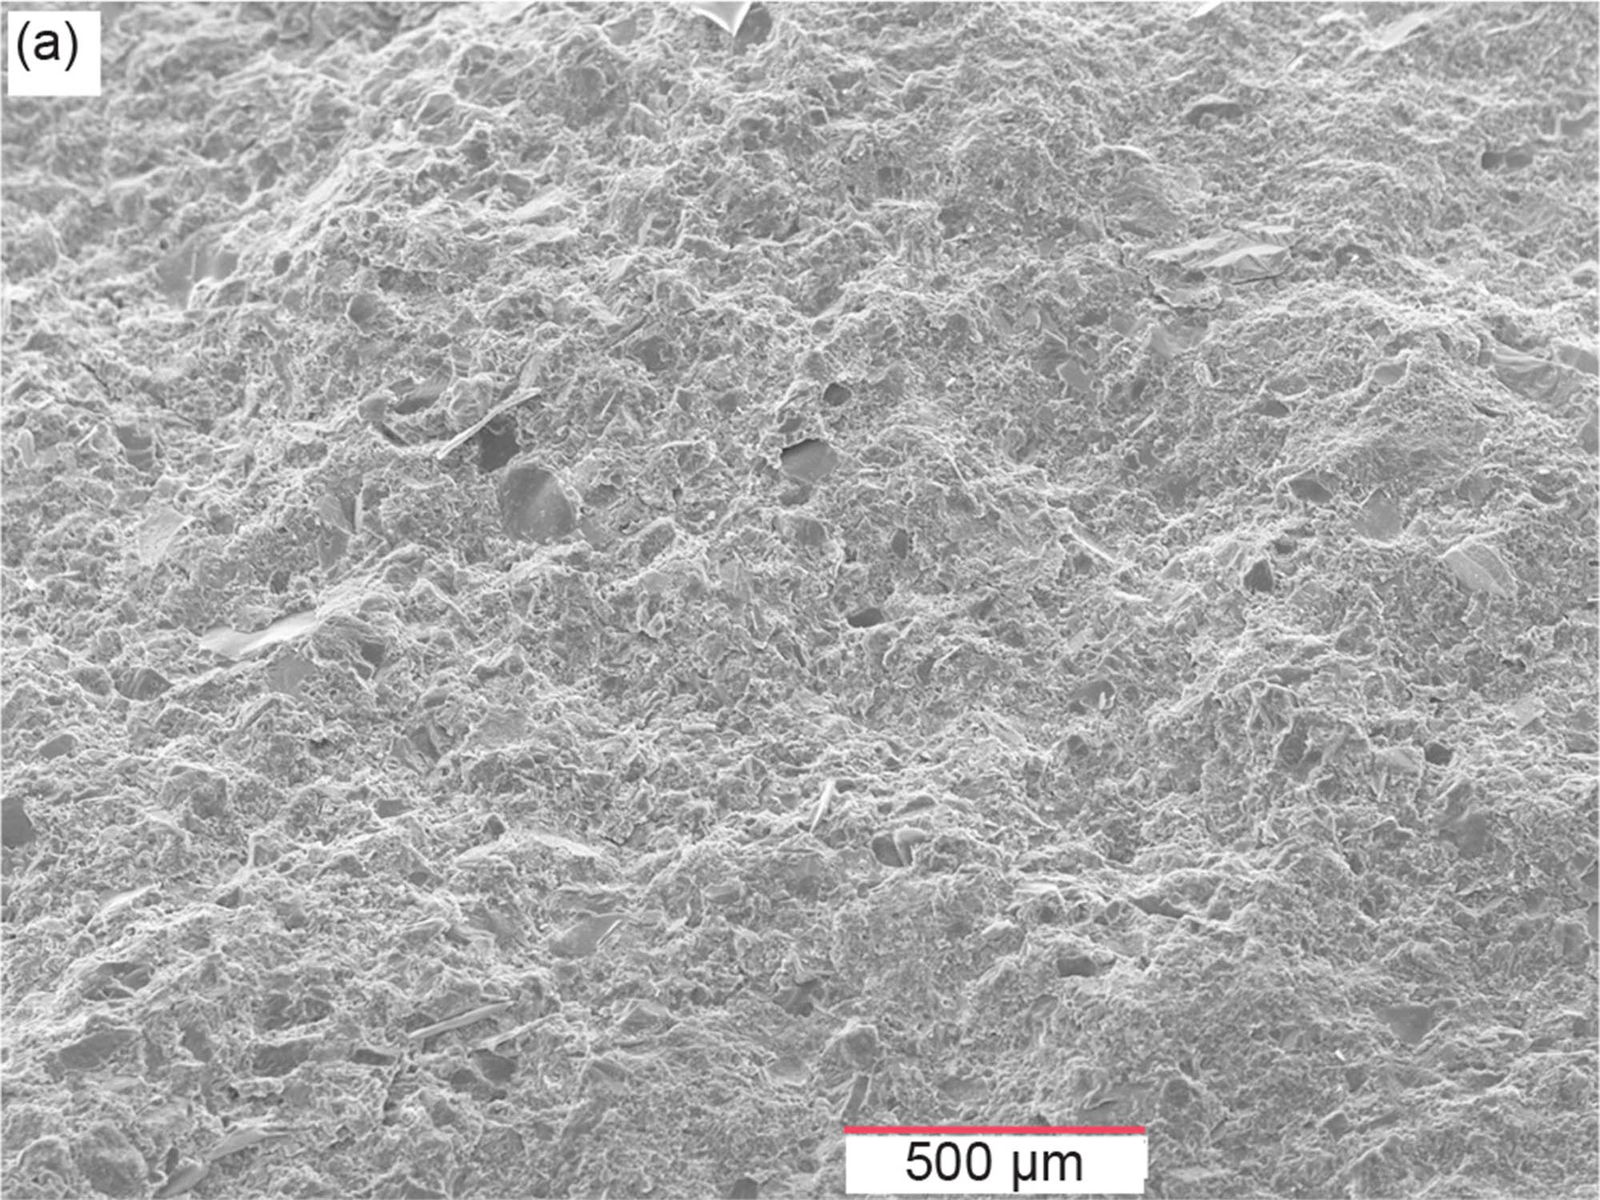
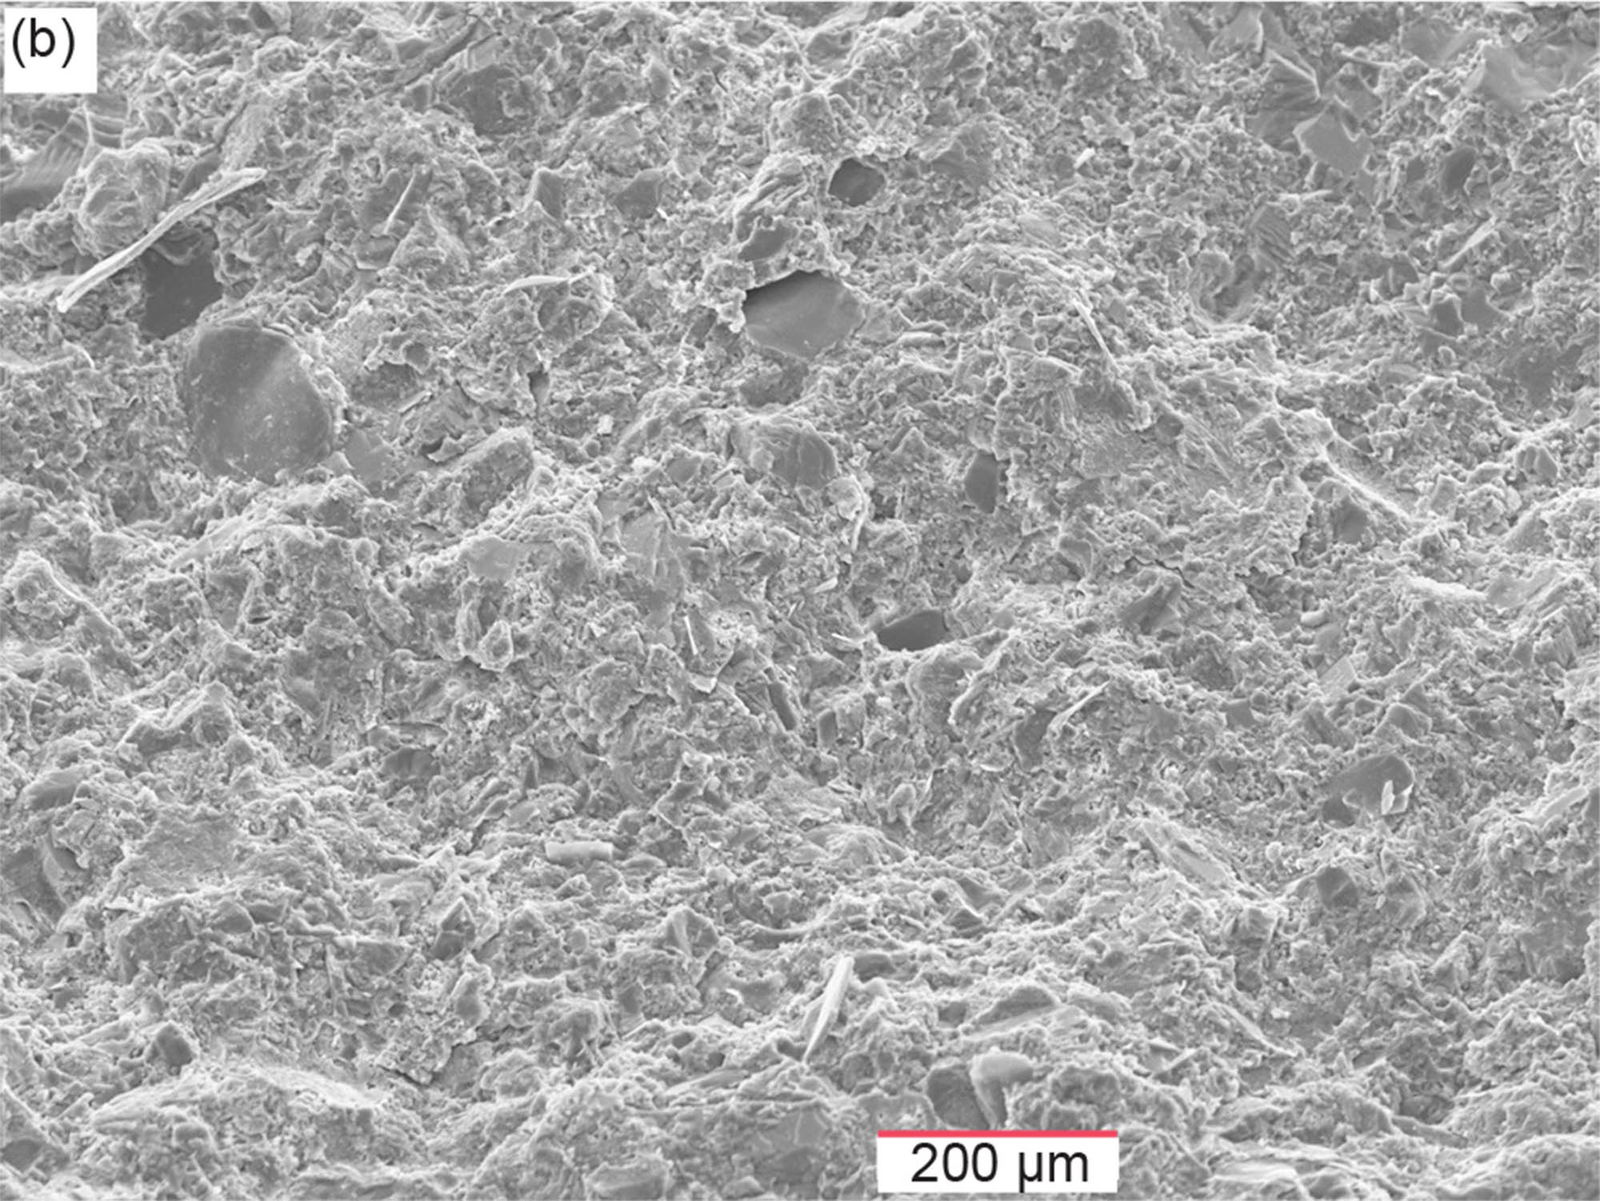
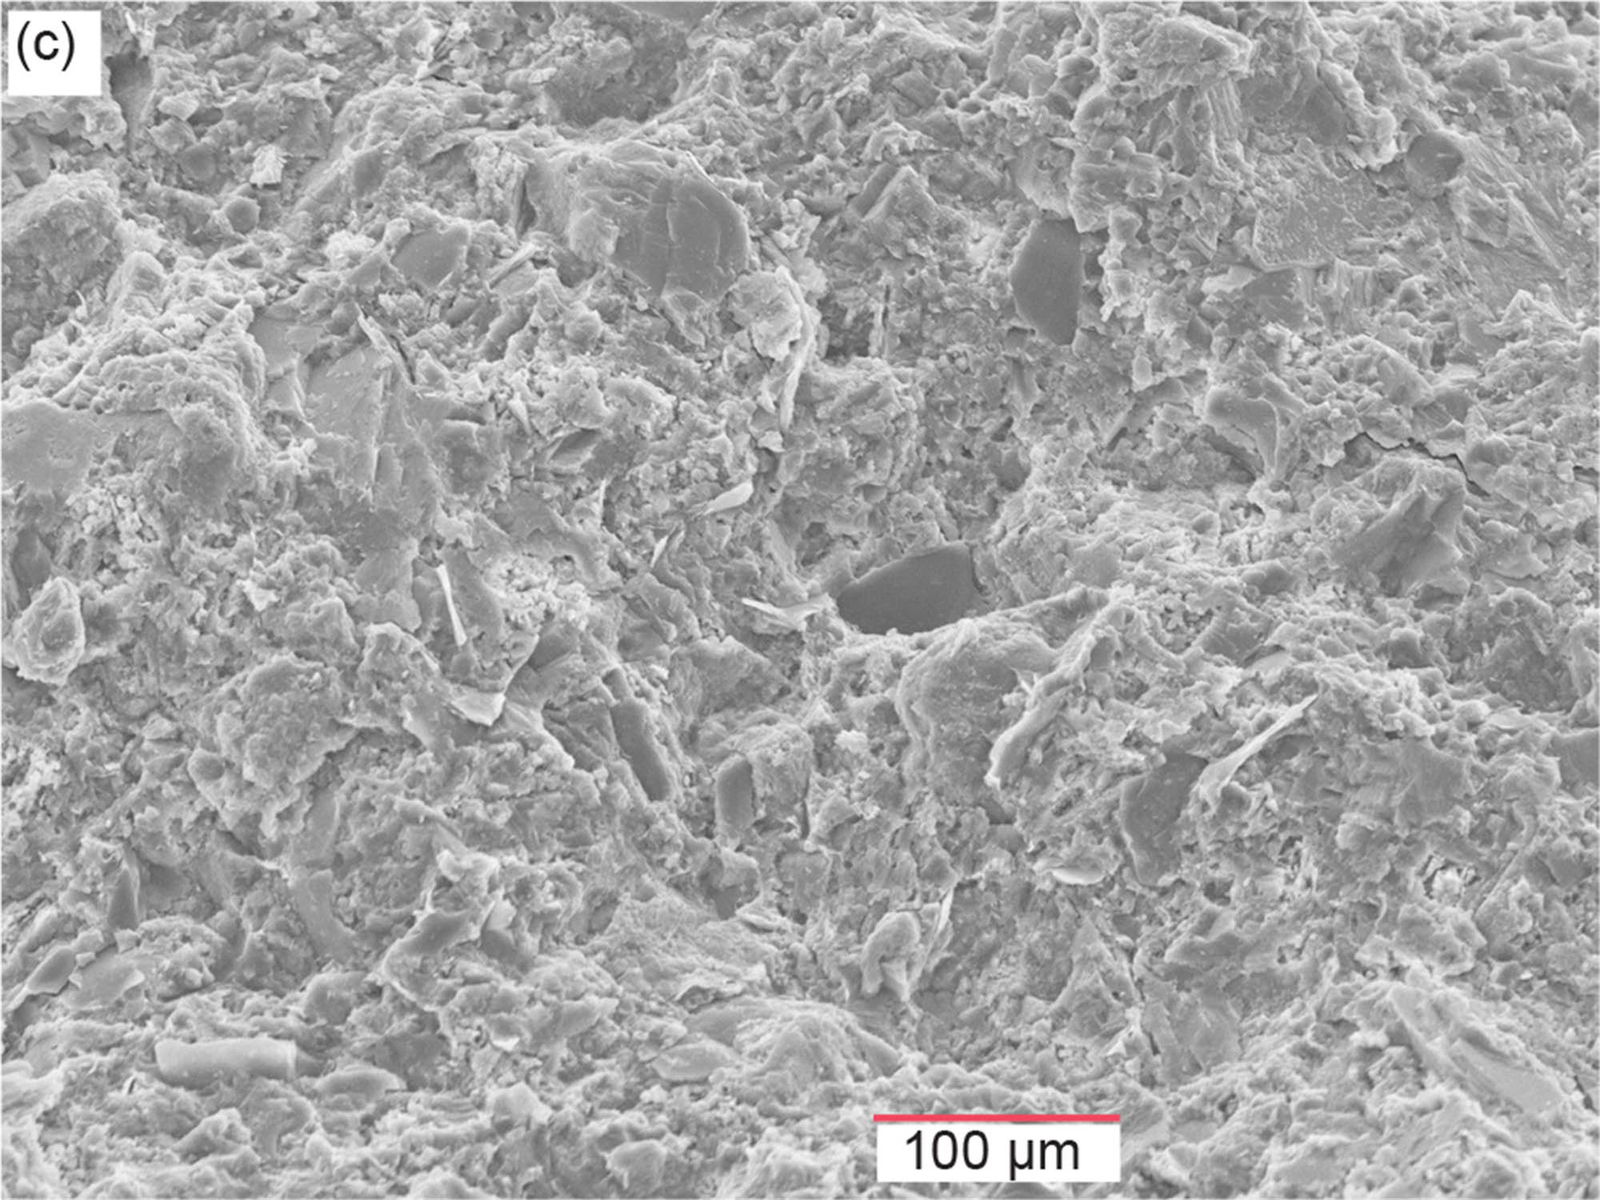
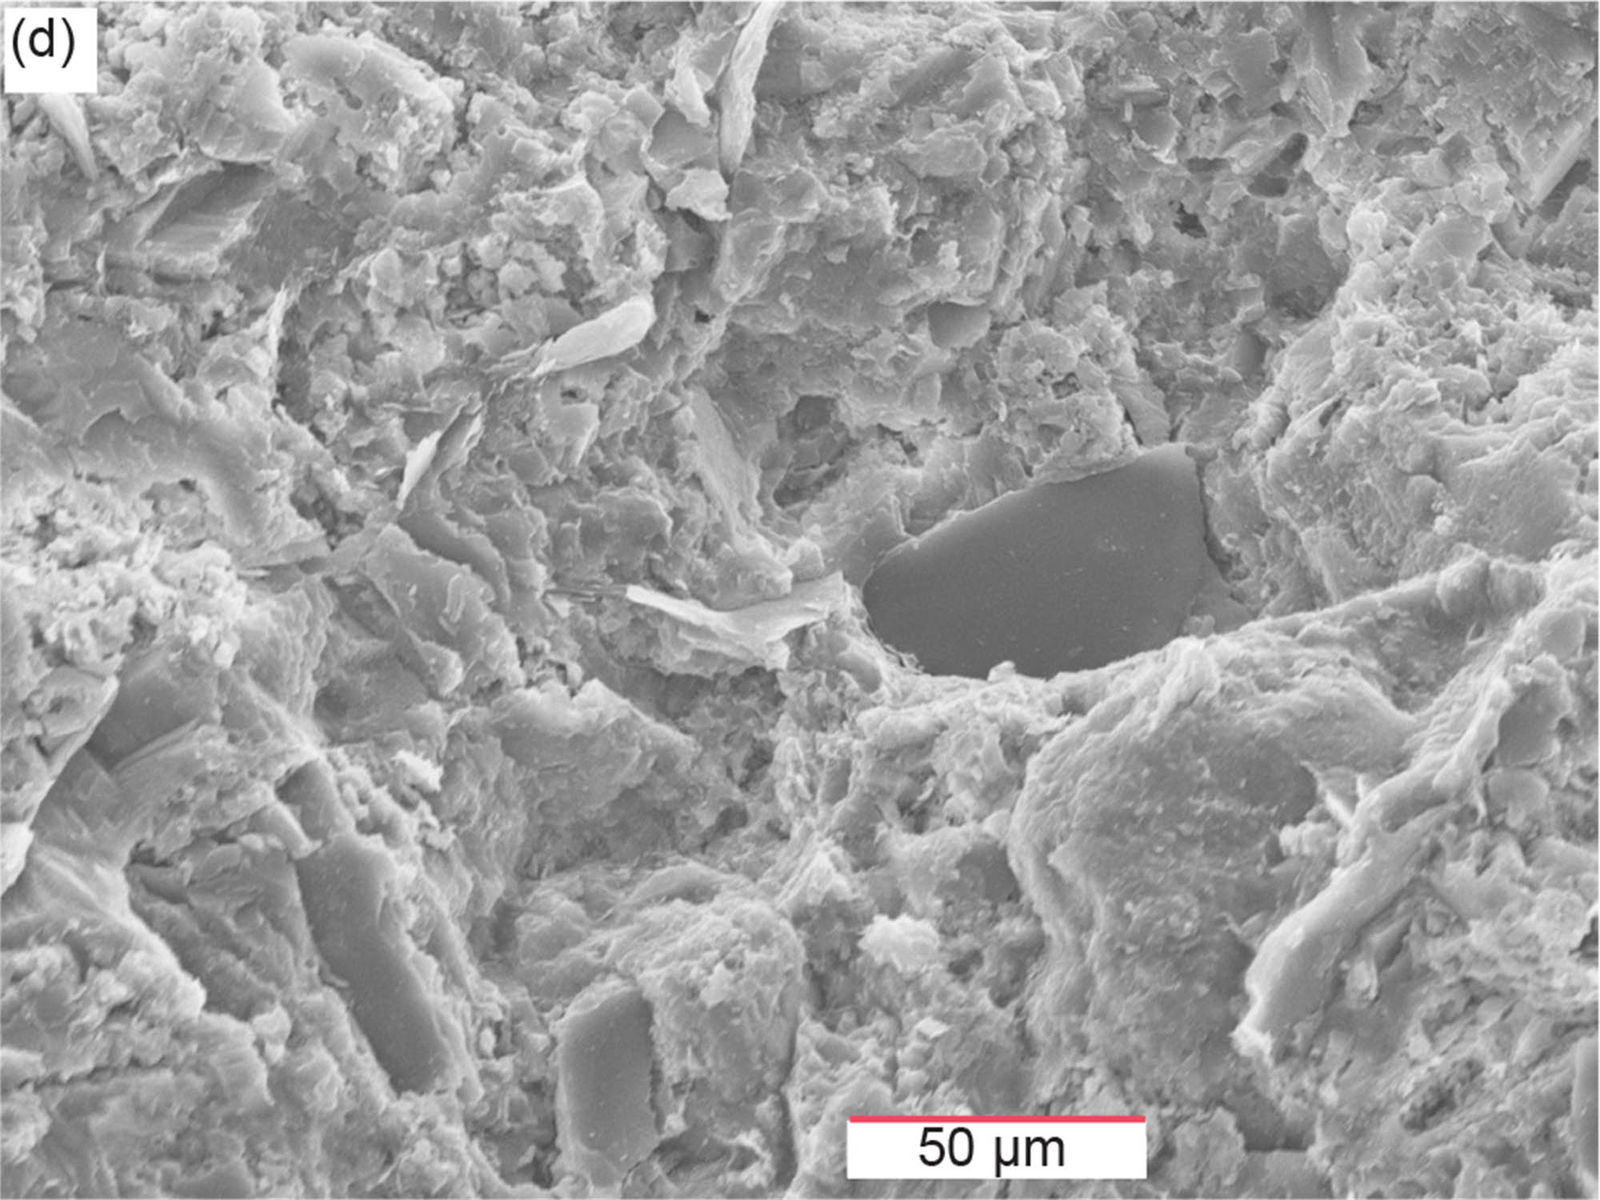
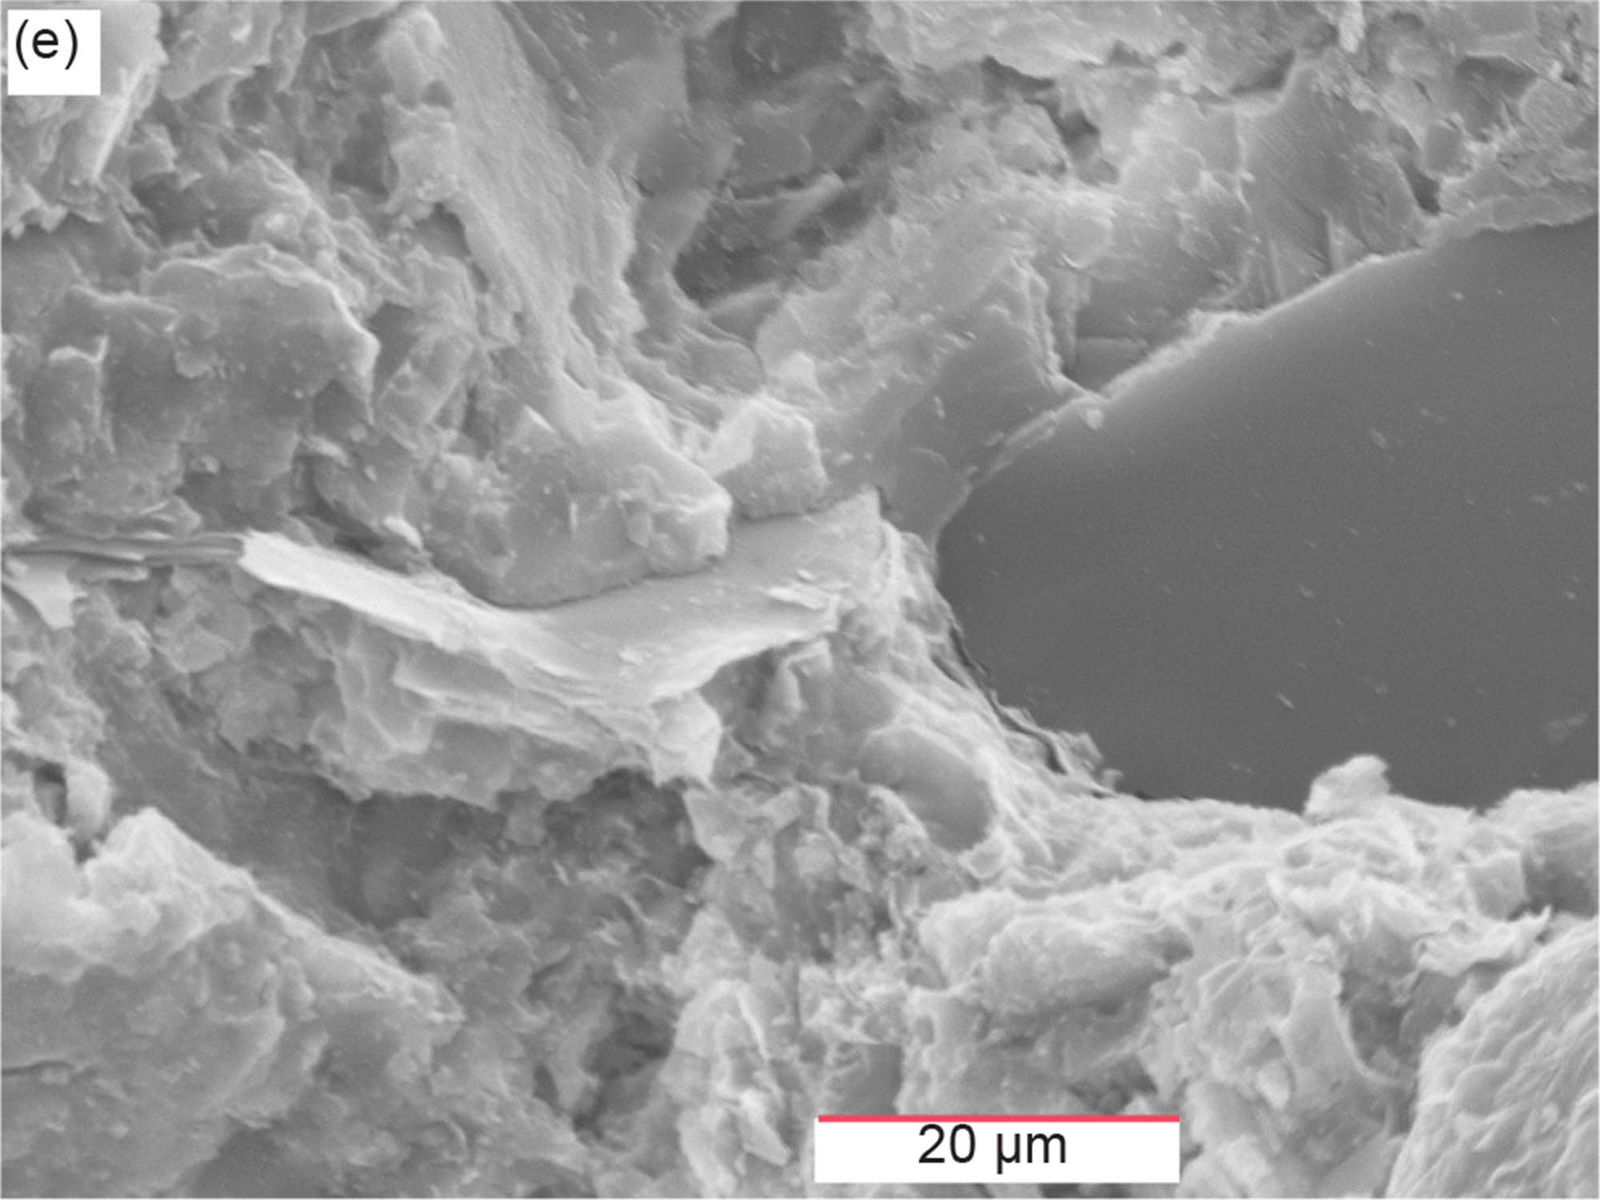
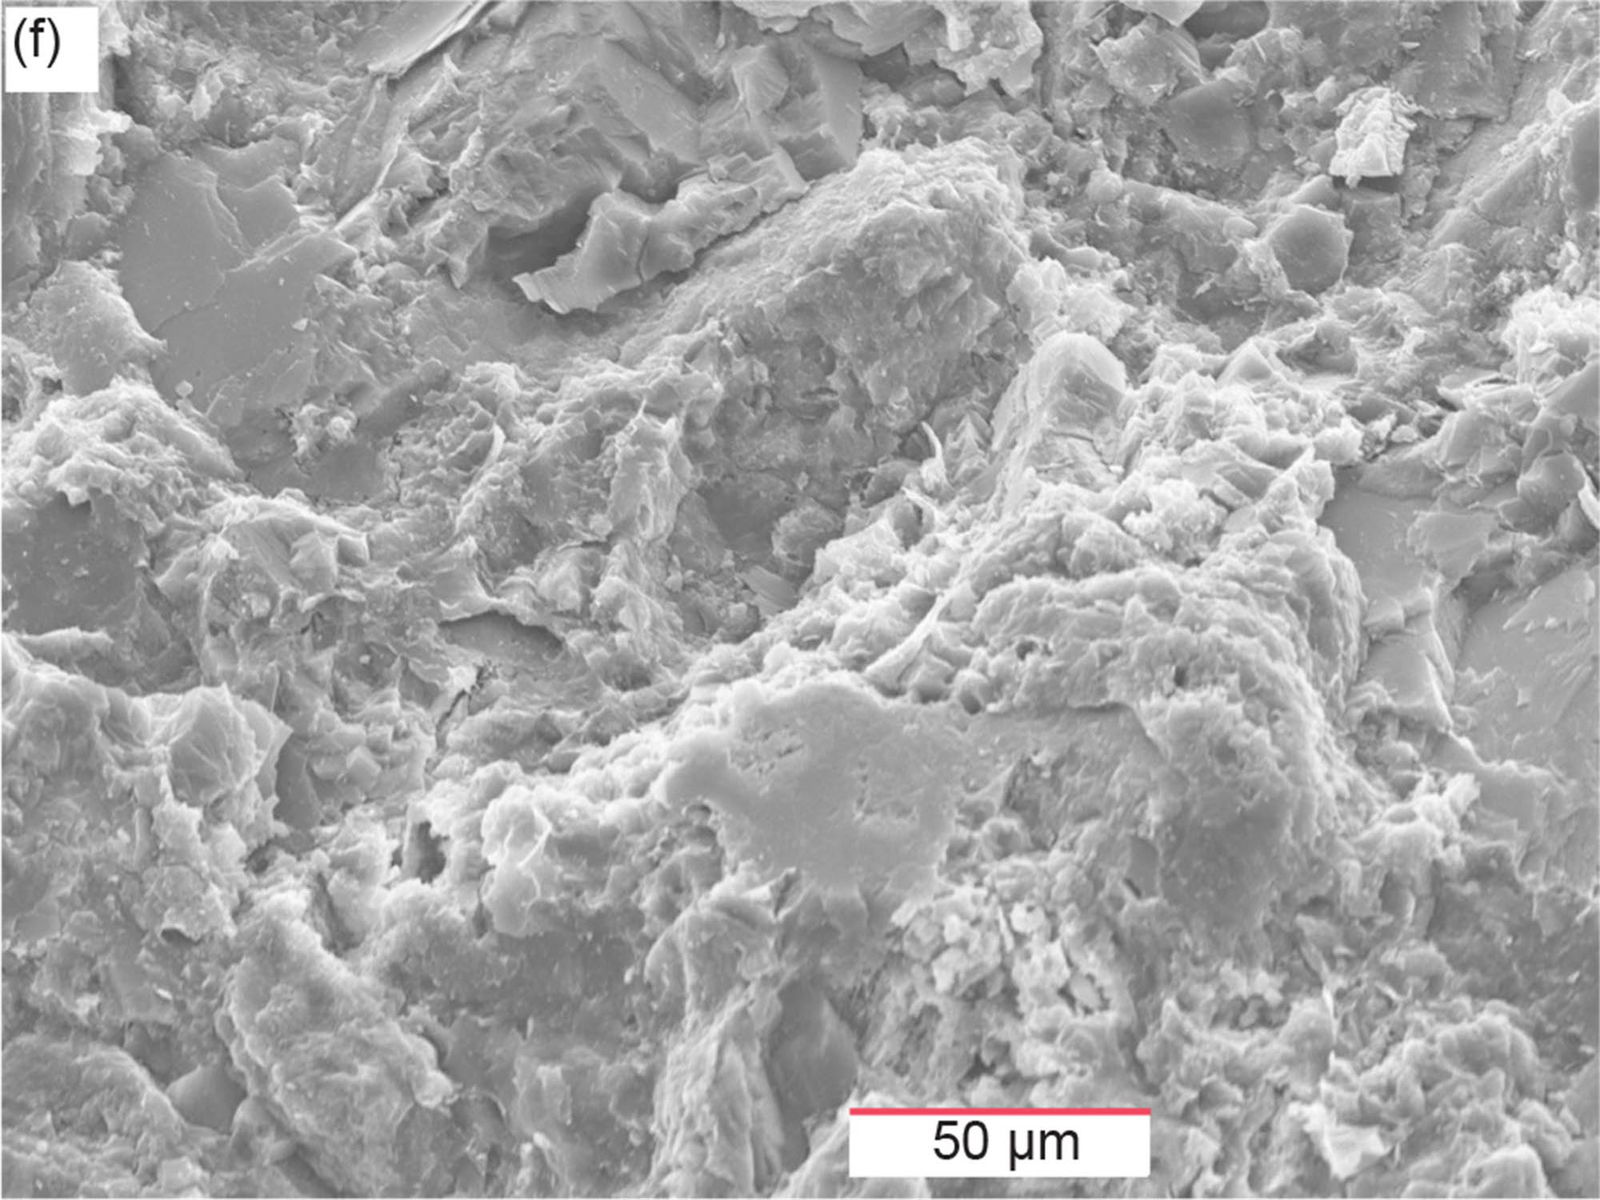
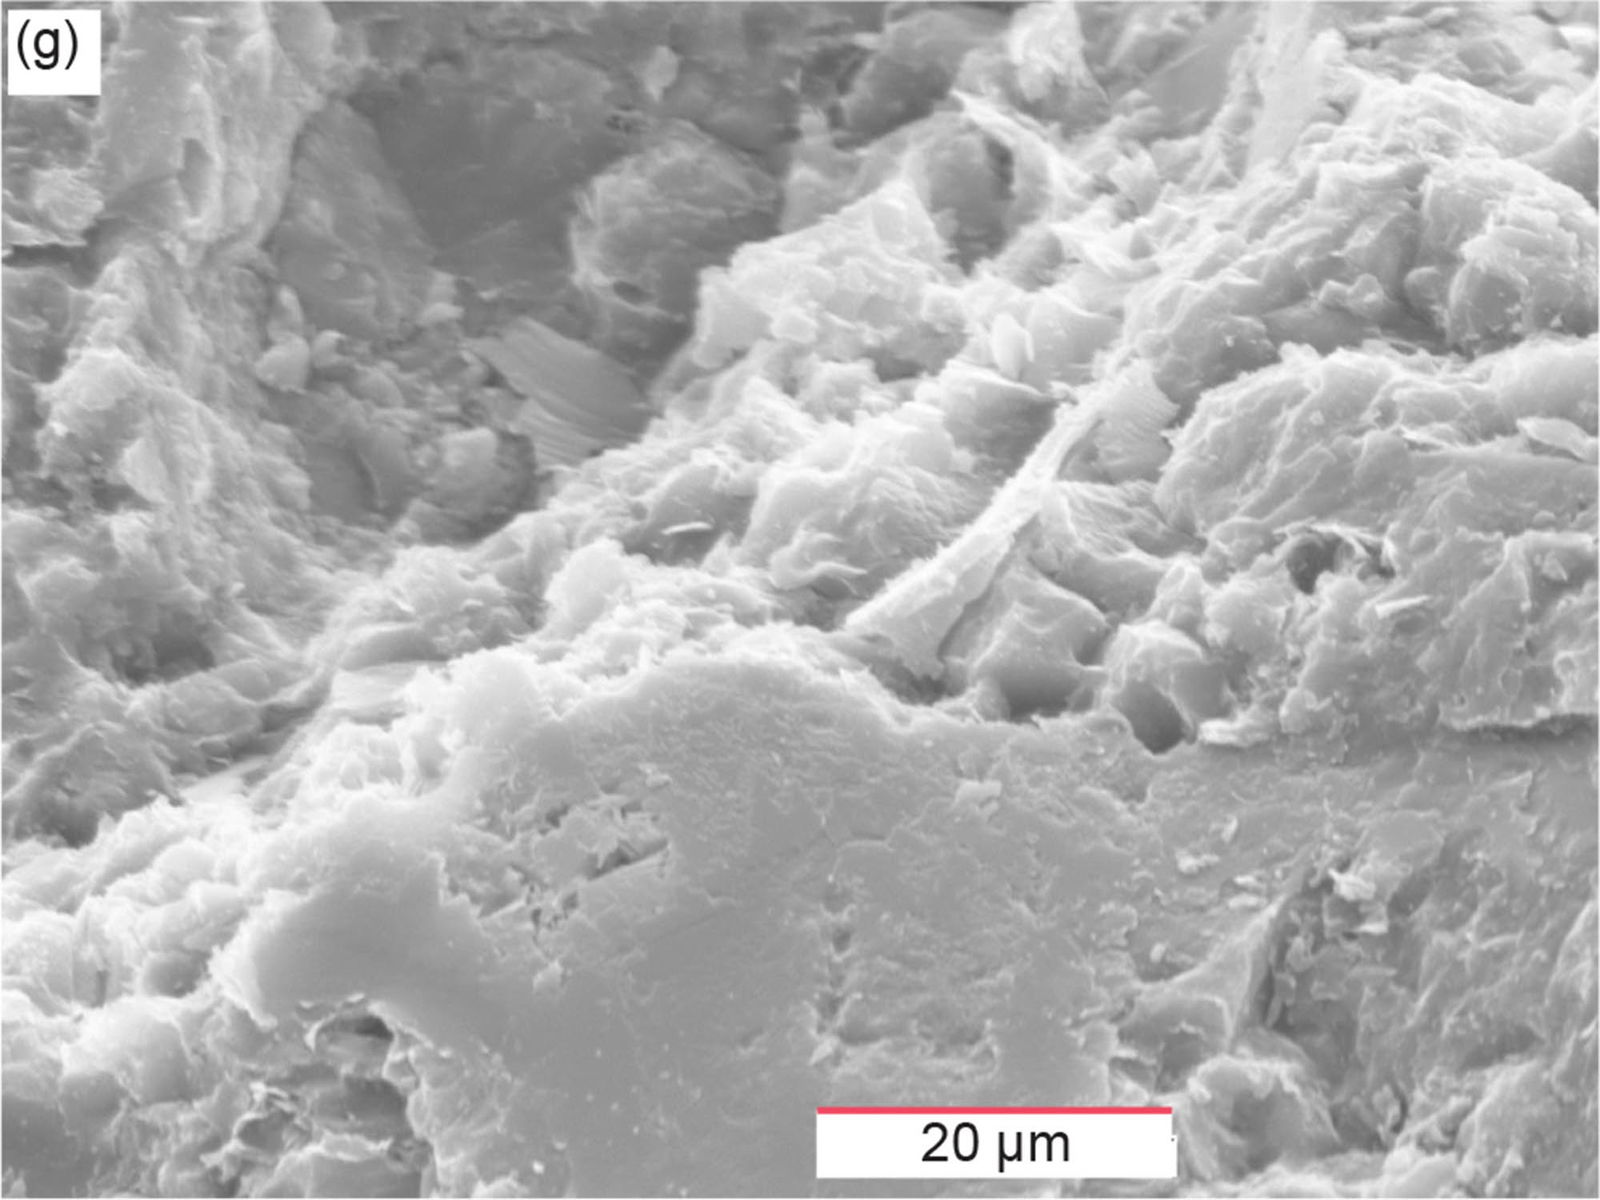
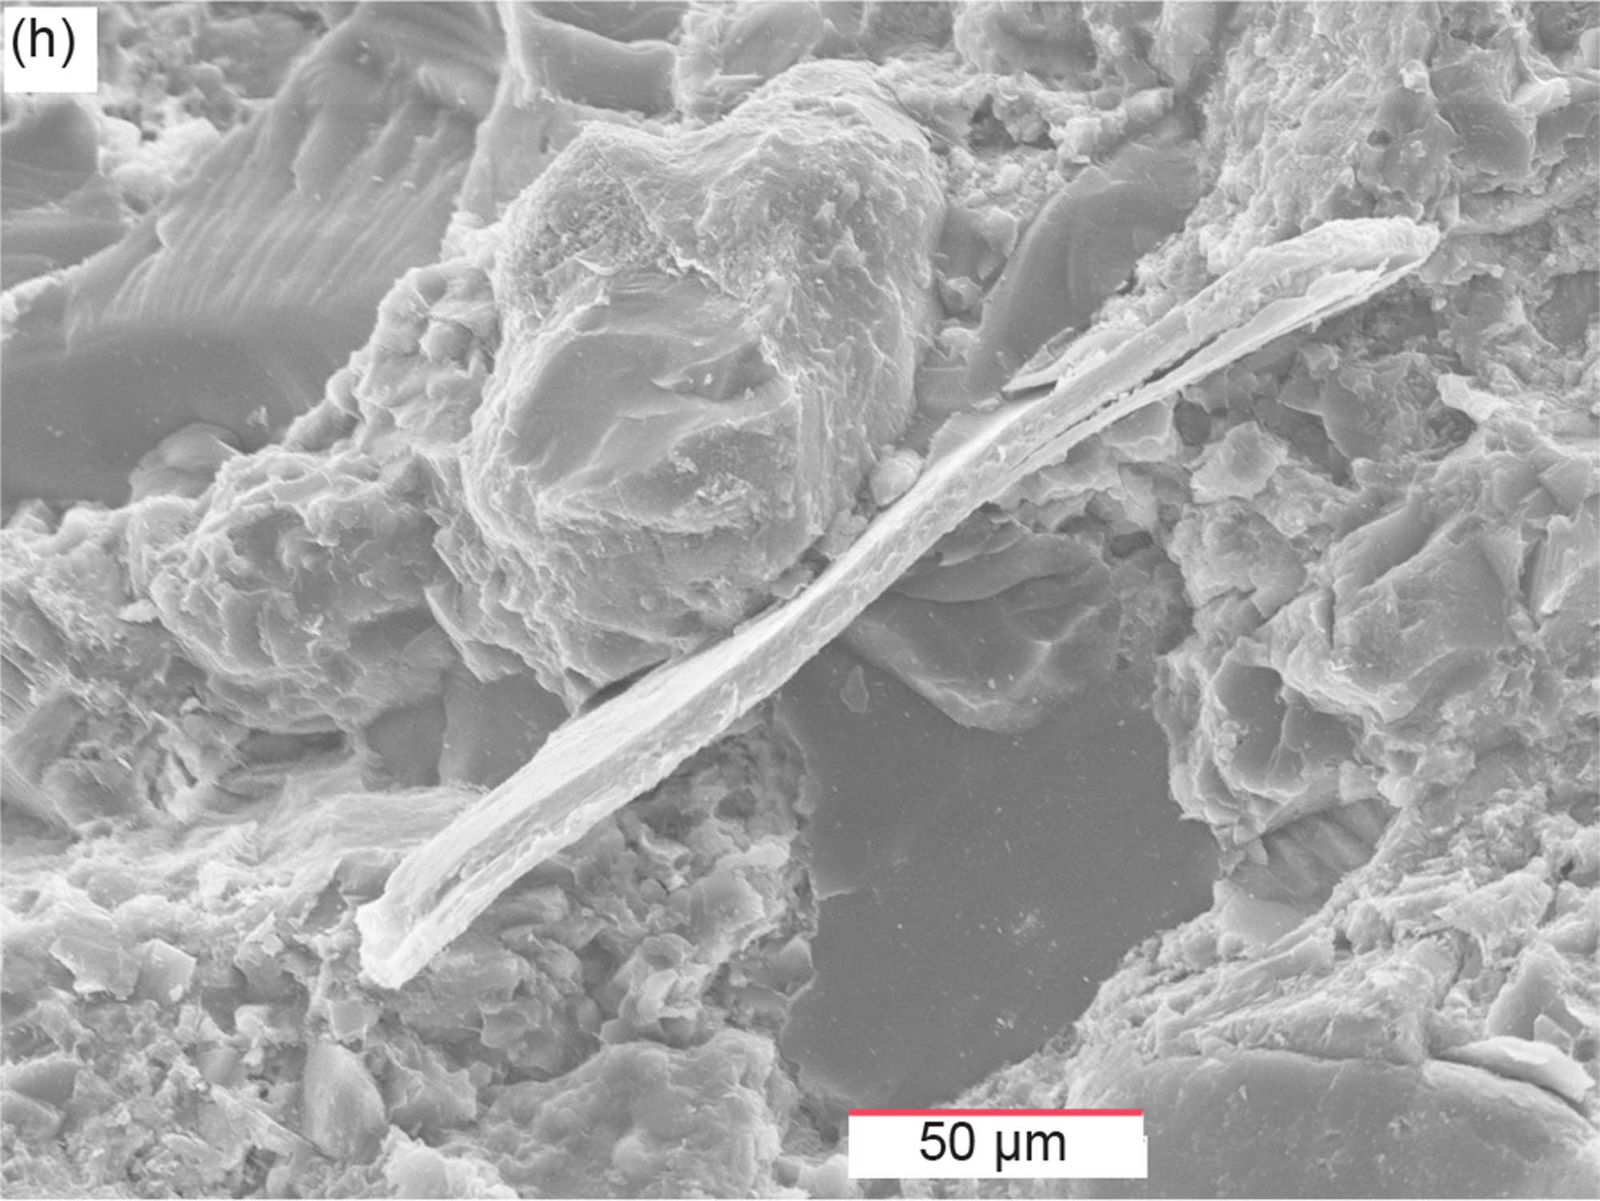
Fig. 42. Scanning electron microscope (SEM) images of sample MFML-06 from the Matkatamiba fold’s hinge zone (see fig. 22 for its location). (a) 50X, (b) 100X, (c) 200X, (d) 500X, (e) 1500X, (f) 500X, (g) 1500X, and (h) 500X.
Fig. 42f is a magnified image of the area in fig. 42c at and beyond its left edge towards the top left-hand corner, and in turn, fig. 42g is a magnified image of the central area in fig. 42f. Both these images provide evidence of possible minor dissolution of some of the recrystallized micrite and/or calcite cement, although the breaking apart of the sample may also be responsible for the pitted crystal surfaces. Fig. 42h is a magnified image of the edge-on muscovite flake seen in the upper left-hand corner in fig. 42b. This muscovite flake is also firmly wedged between two other detrital grains, in particular, which are possibly quartz and/or K-feldspar grains. The cross-section through the edge-on muscovite flake shows that some of the sheet structure is degraded, that is, the “pages” of the muscovite “book” have started to peel apart, which again indicates this muscovite flake is also still in its detrital condition. While some damage to it may have been induced during sample preparation, it’s also likely that this splitting of the sheet structure began during the flake’s transport and deposition. Subsequent compactional loading and the heat and pressure due to deep burial have not changed this muscovite flake’s condition. Thus there is no evidence here of any metamorphic effects due to deep burial, nor any disruption due to the folding process. So, it must be concluded that the folding was not due to ductile deformation but had to occur while the sediment was still soft and damp before cementation.
Sample MFTB-05 is from a bed in the lowermost Havasu Member within the Matkatamiba fold, just above the boundary with the underlying Gateway Canyon Member directly opposite sample MFML-05 in the area of the most intense folding near the upper hinge zone (fig. 22). Fig. 43a is again a low magnification image of the sample’s broken-apart surface, and its central area is progressively magnified in fig. 43b–e. Once again, the fabric revealed in this sample’s surface is much the same as in the other already-described samples, except that this sample appears to consist of much more recrystallized micrite and calcite cement as there are more and larger cleaved recrystallized calcite surfaces, the flat, cleaner and often darker exposed surfaces in fig. 43a–d. Some of these cleaved recrystallized calcite surfaces appear to align with hairline fractures of limited extent, suggesting they are either due to the breaking apart the sample during preparation, or perhaps more likely, they are an artifact of the recrystallization process in the way the calcite recrystallized within the rock fabric. The texture and constituents of the other portions of the sample’s surface are more readily observed at the higher magnifications in fig. 43c–e where the broken-apart surface of the sample has cut through the recrystallized calcite mass between the cleaved surfaces of the calcite-cemented micrite. In those portions can be seen the recrystallized micrite and calcite cement, the micrite likely being finer grained here in the Havasu Member compared to the previous samples from the underlying Gateway Canyon Member in the fold. And even in those portions the cleaved faces of the recrystallized calcite can be seen, especially in fig. 43d–e.
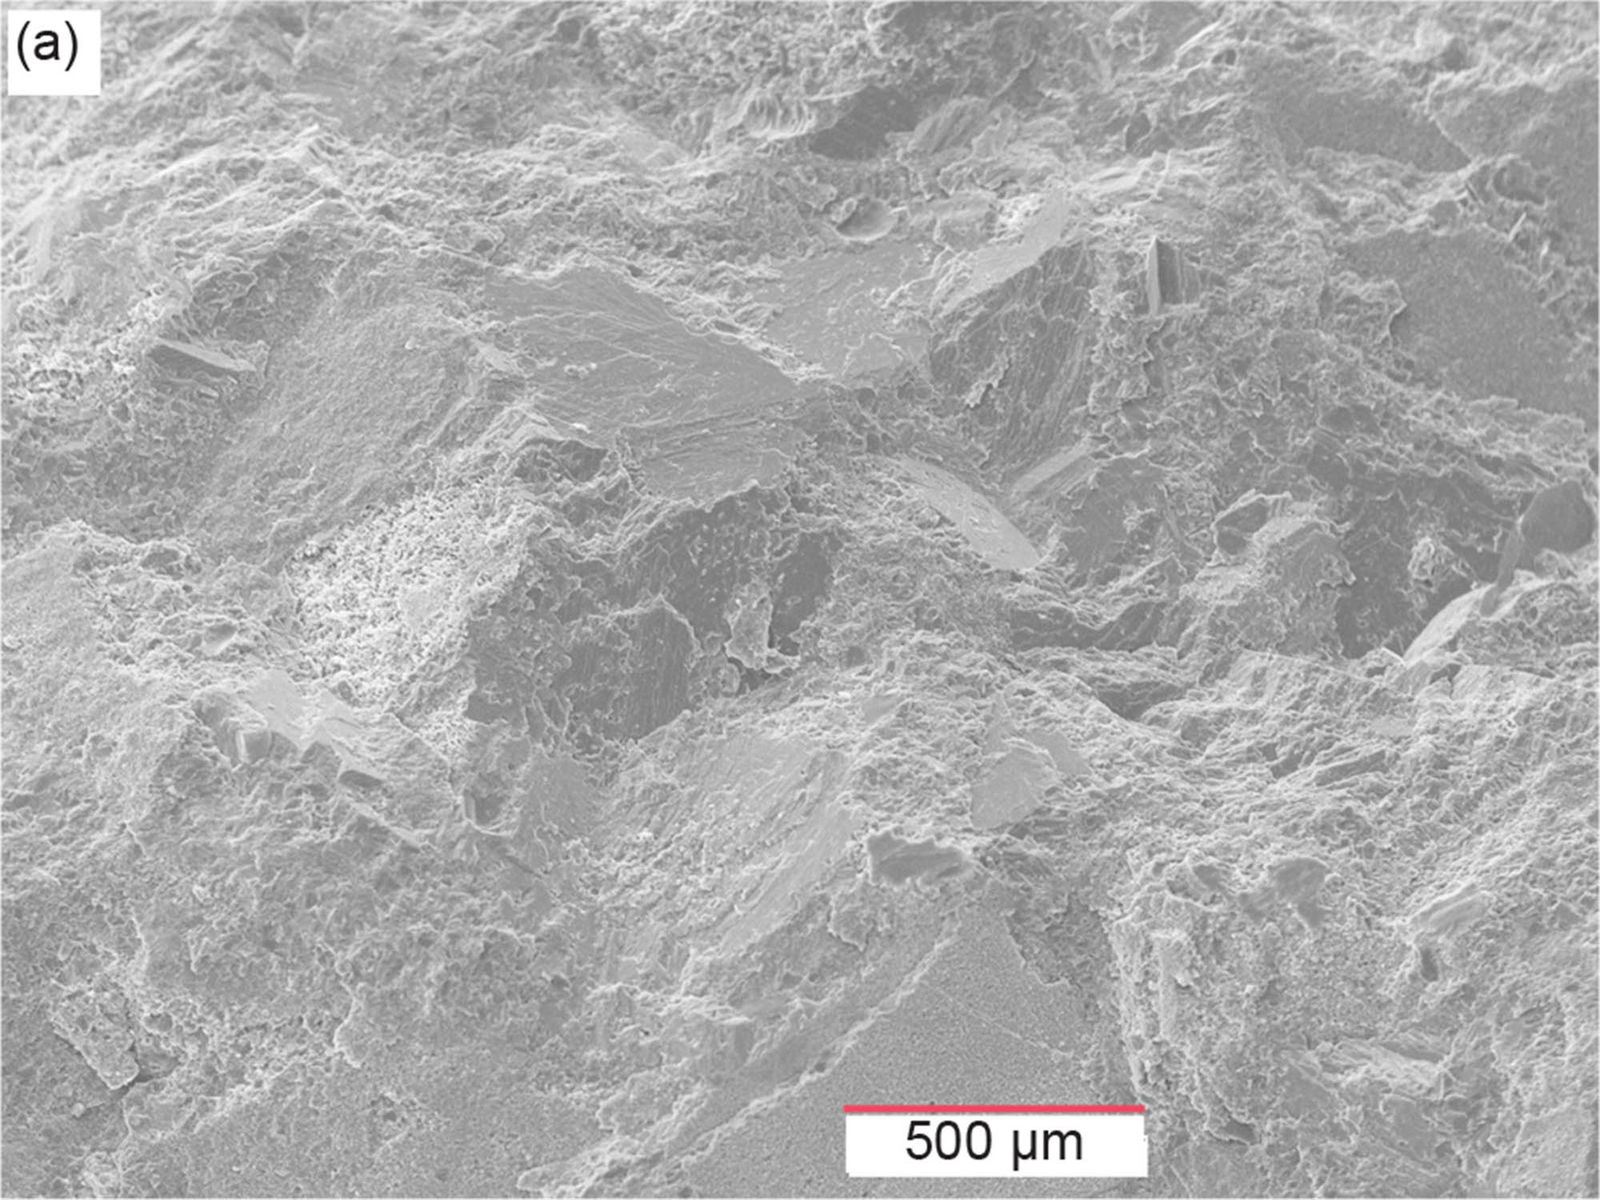
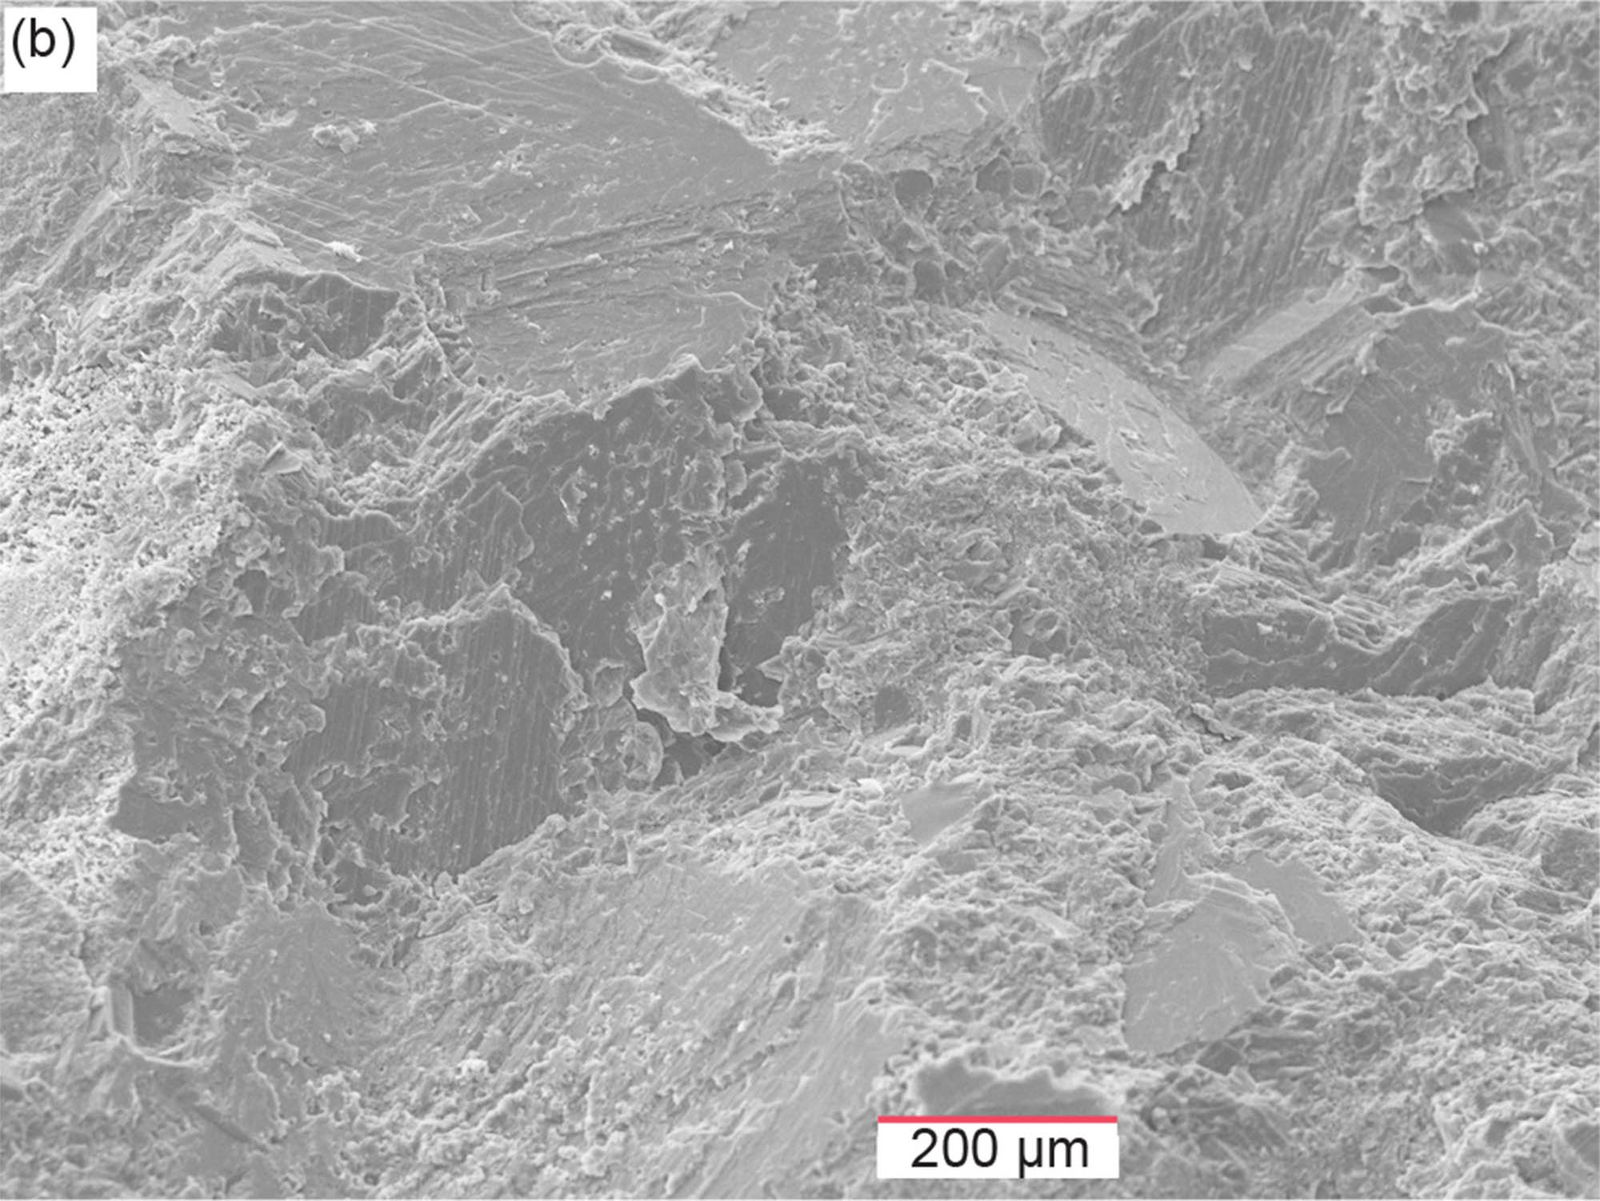
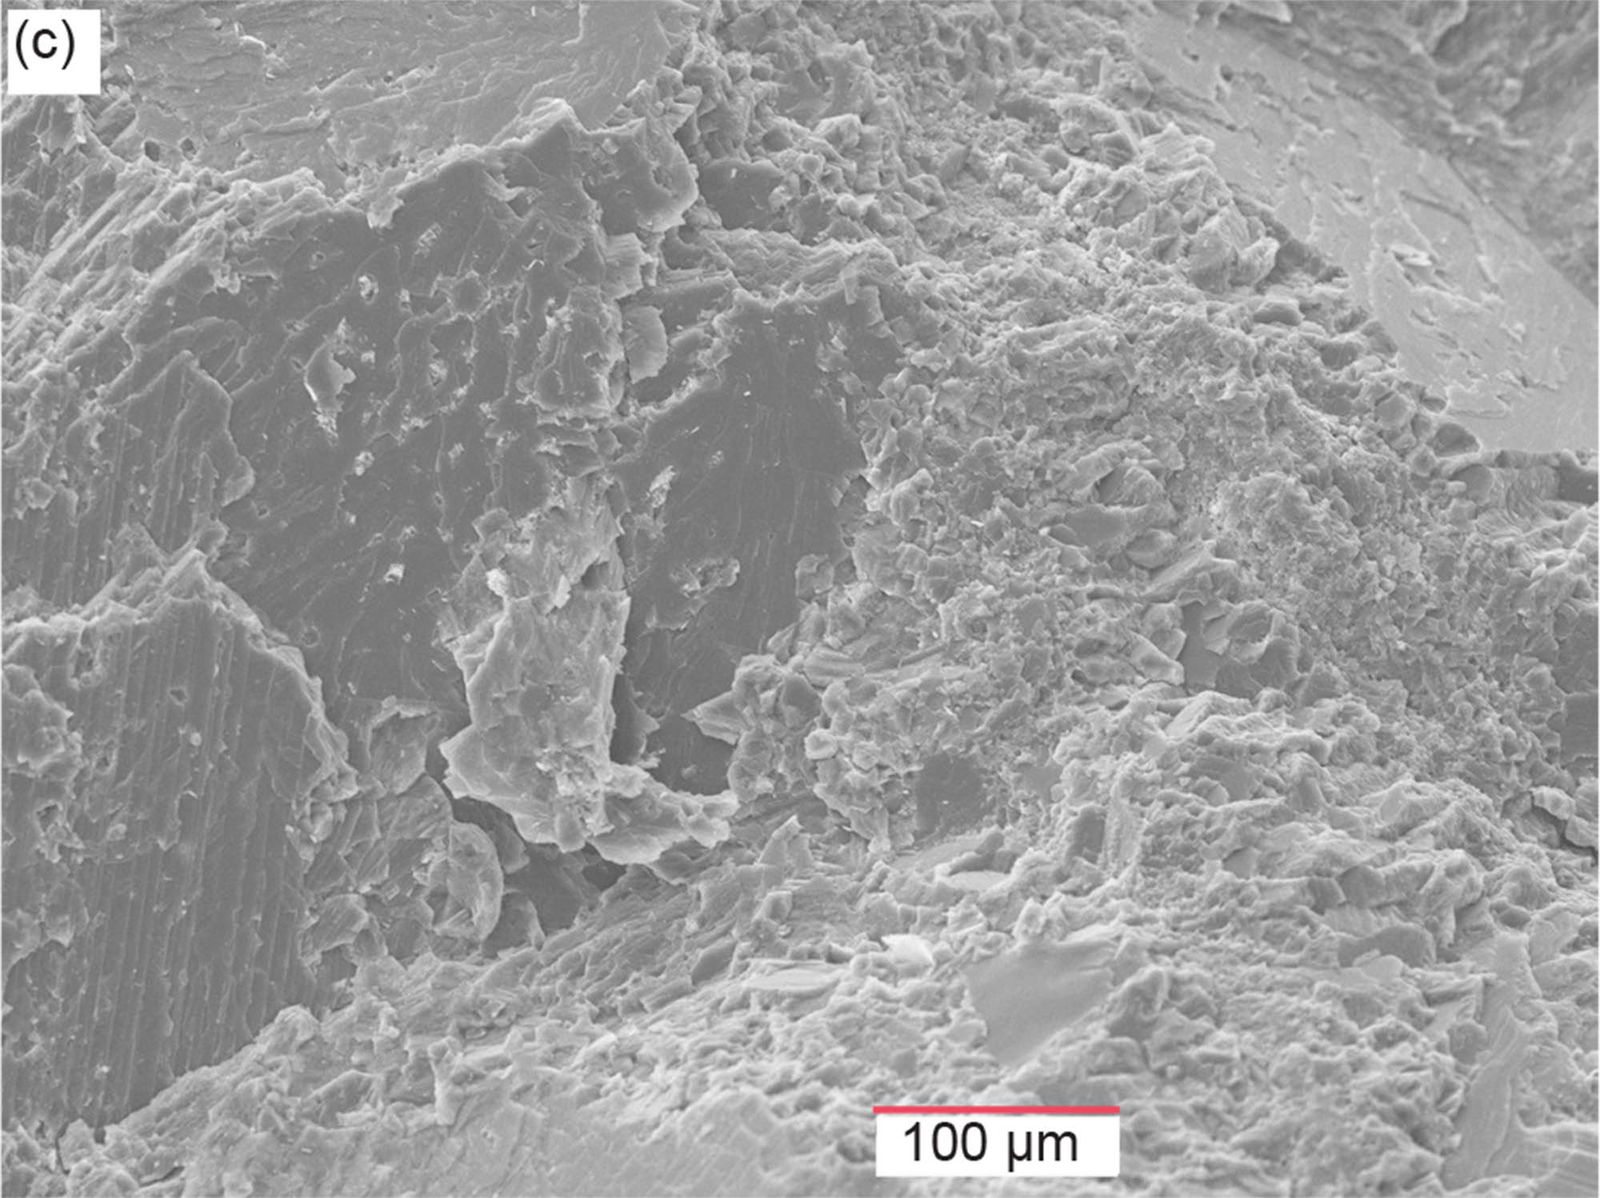
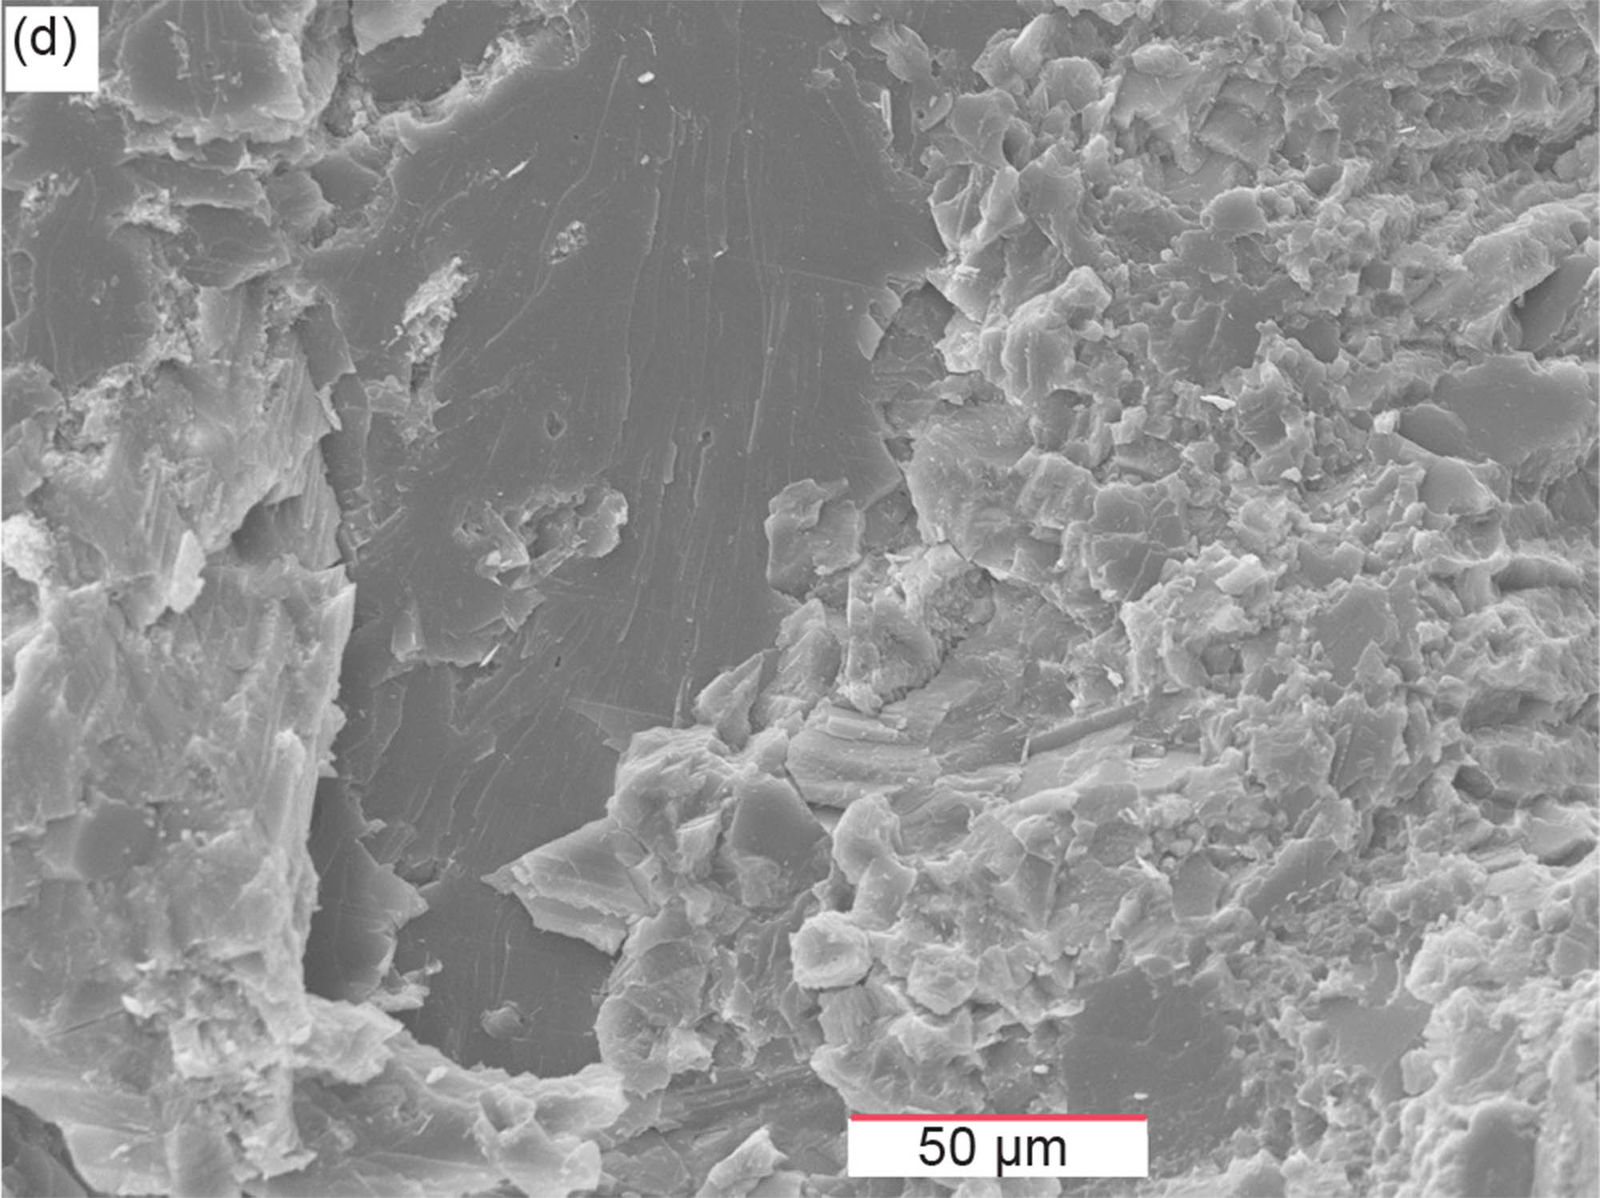
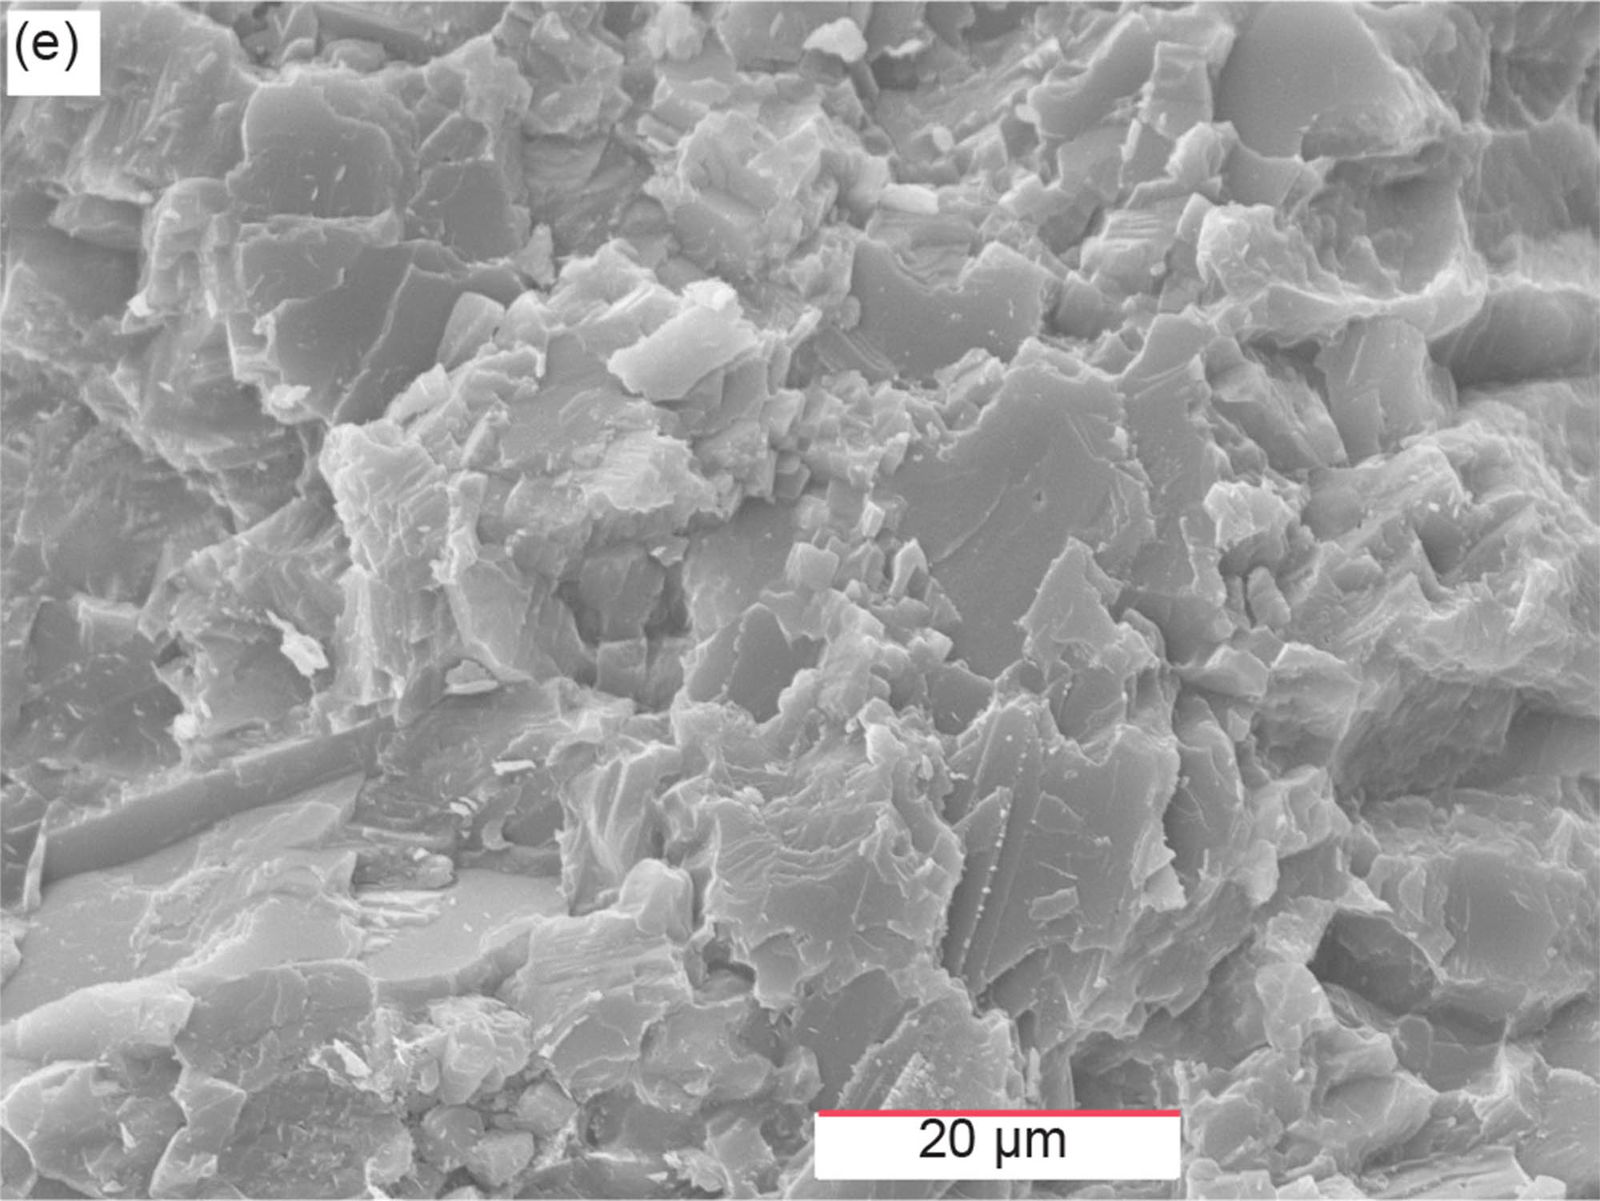
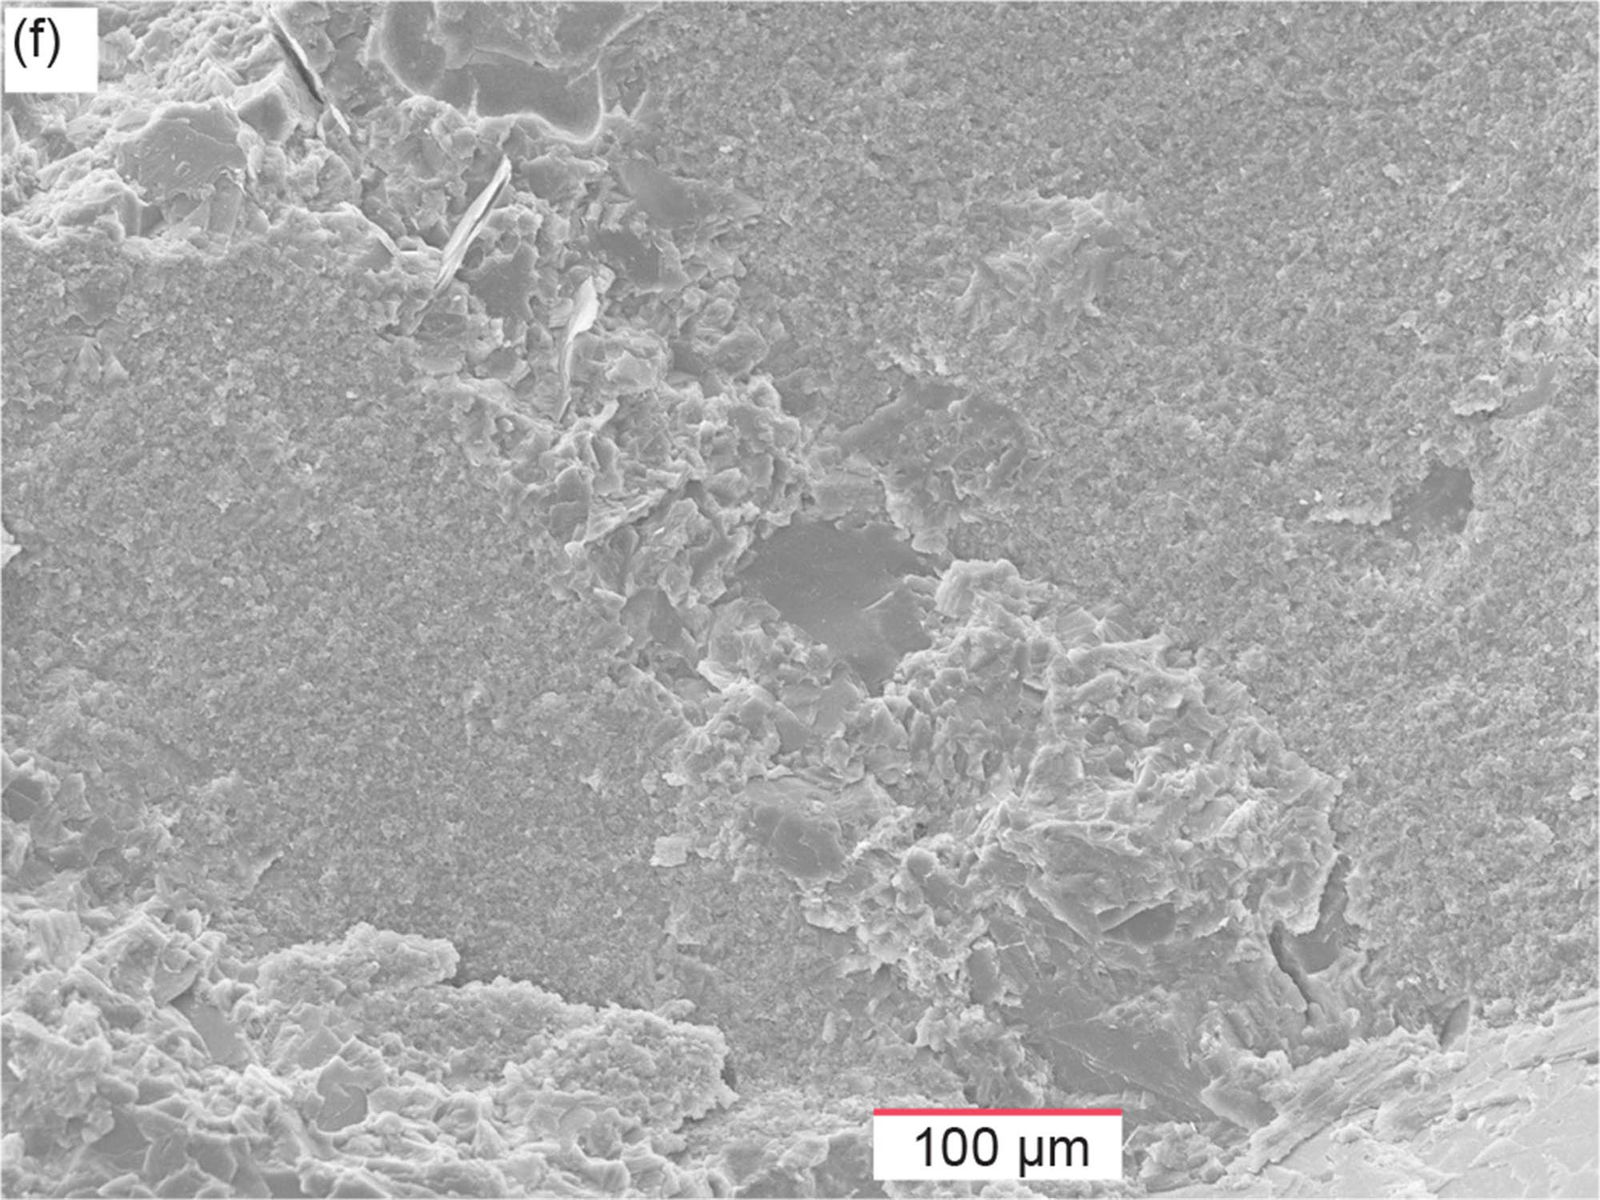
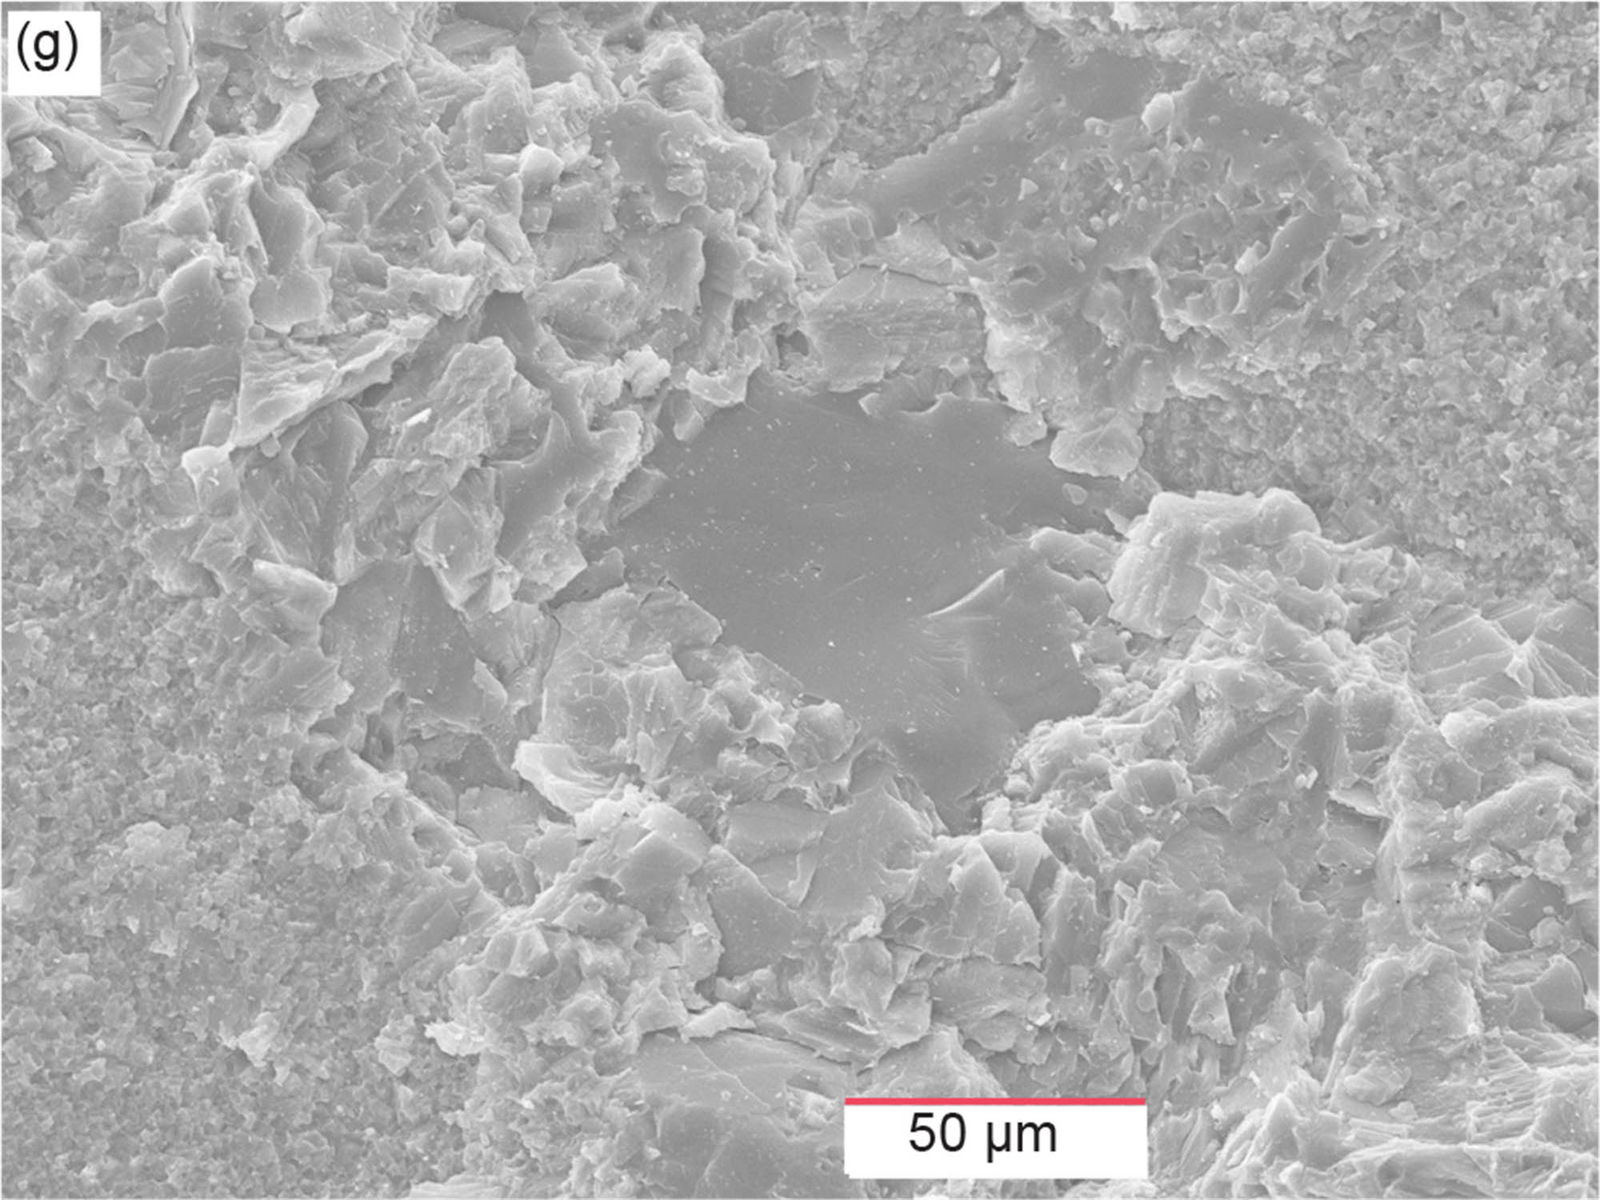
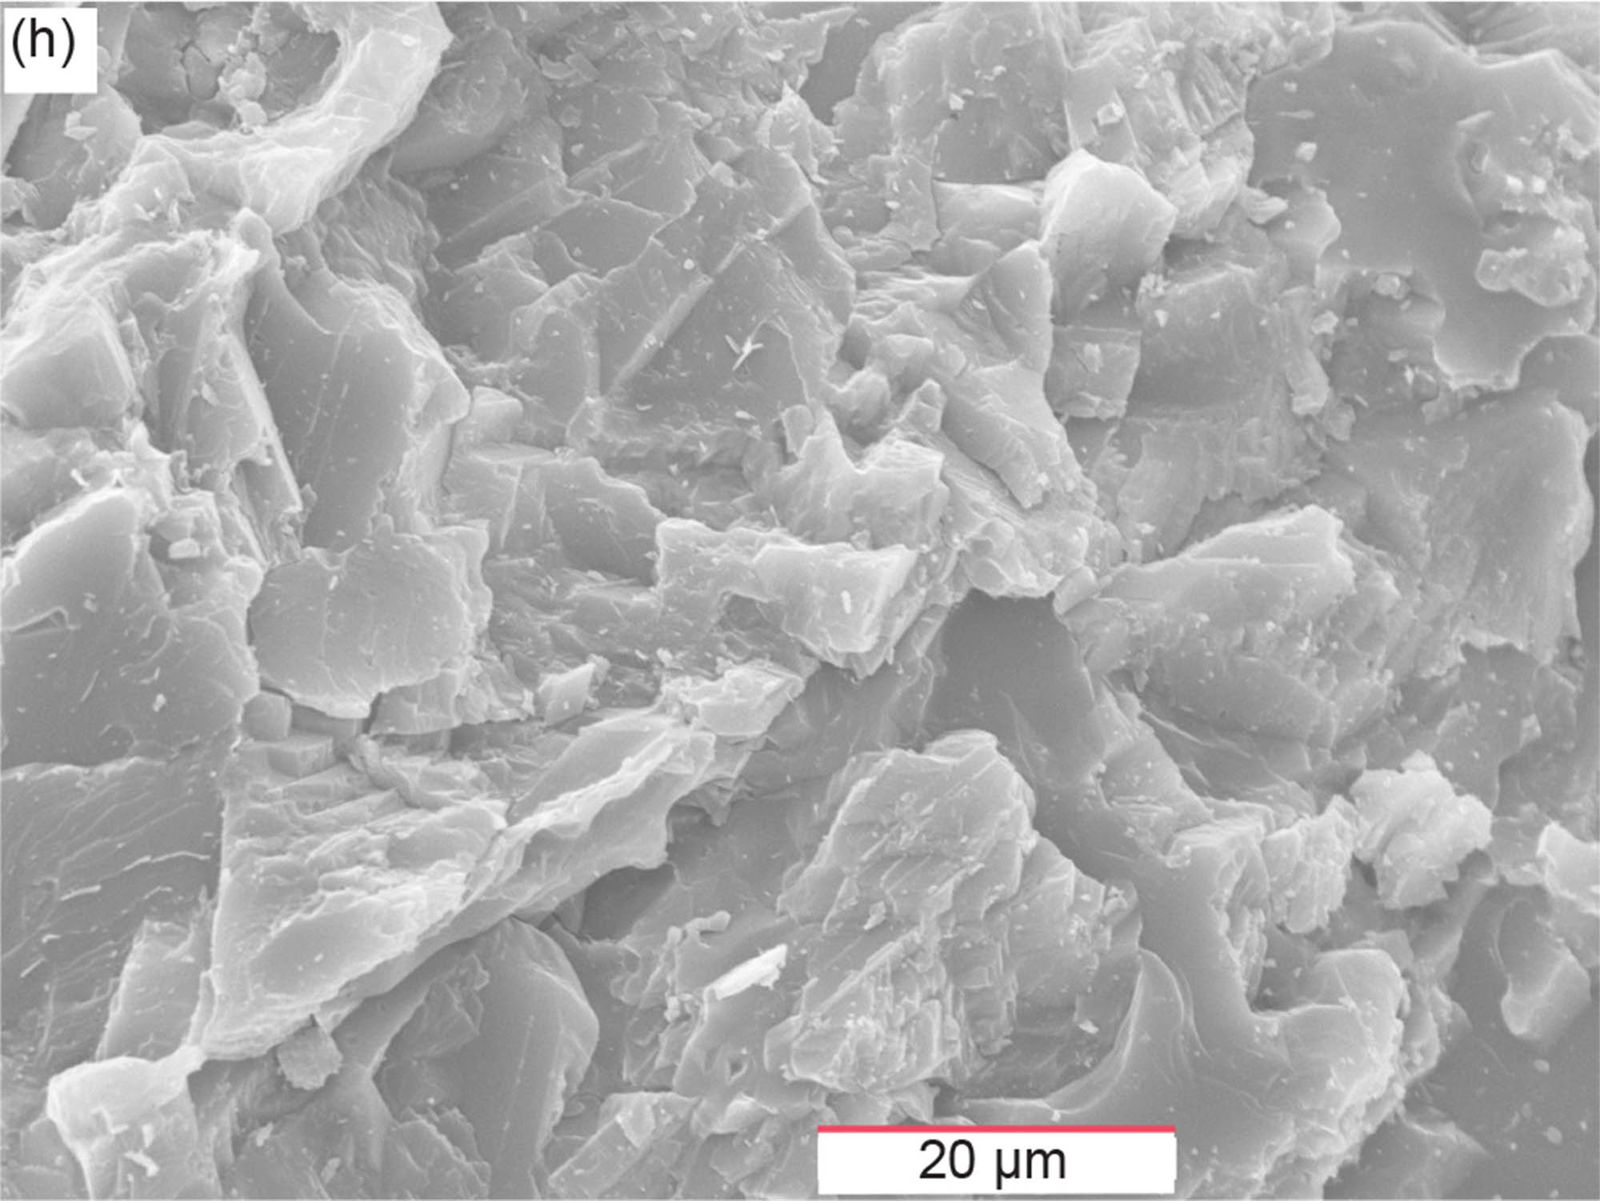
Fig. 43. Scanning electron microscope (SEM) images of sample MFTB-05 from the Matkatamiba fold’s hinge zone and directly above sample MFML-05 (see fig. 22 for its location). (a) 50X, (b) 100X, (c) 200X, (d) 500X, (e) 1500X, (f) 200X, (g) 500X, and (h) 1500X.
Fig. 43f is a magnification image of an area is the sample’s surface that is not apparent in the images in fig. 43a–b. It represents a different area of the same sample. Then fig. 43g is a higher magnification of the central area in fig. 43f, while fig. 43h is a higher magnification of the area towards the top left-hand corner of fig. 43g. In these images most of the same features are observed as are in the previously described images above in fig. 43a–e. However, in fig. 43f can be seen a small edge-on muscovite flake, the whitish obliquely aligned streak to the left above the central area. It lies within an area where the recrystallized calcite has broken apart along a cleavage plane and exposed the muscovite flake wedged within the calcite-cemented micrite. Otherwise, in the higher magnifications of fig. 43g–h can be seen more of the structure of broken-apart recrystallized micrite and calcite cement, which in fig. 43h at the highest magnification displays a somewhat crisscrossing narrow wall-like structure of calcite that stands out from the areas between them. This may represent the harder calcite cement that precipitated during diagenesis and lithification around the micrite grains, and the occasional scattered quartz and K-feldspar grains. This pattern also reflects the way the recrystallized micrite and calcite cement has broken apart during sample preparation.
Sample MFTB-06 is also from the same bed in the lowermost Havasu Member within the Matkatamiba fold above the boundary with the underlying Gateway Canyon Member directly opposite sample MFML-06 and about 6 m (19.5 ft) from sample MFTB-05 in the upper hinge zone of this fold (fig. 22). Fig. 44a is again a low magnification image of this sample’s broken-apart surface, while its central area is progressively magnified in fig. 44b–d, and fig. 44e is a higher magnification of the area in fig. 44d below and to the right of its central area. The content of the texture and fabric of the sample’s broken-apart surface is not readily apparent in the lower magnification images in fig. 44a-b which indicates that the micrite is likely finer-grained here in the Havasu Member, as in the adjoining sample MFTB-05, compared to the previous samples from the underlying Gateway Canyon Member in the fold. Then in the progressively higher magnifications in fig. 44c–e can be seen the cleaved surfaces of the recrystallized micrite and calcite cement, except that the cleavage angles appear slightly different (as especially evident in fig. 44d–e), which is consistent with most of the recrystallized micrite and calcite cement being dolomite, due to the overwhelming dominance of dolomite in this sample (table 2) (although both calcite and dolomite have rhombohedral cleavage). Some scattered quartz and K-feldspar grains that are in this sample may also be covered by all this dolomite. Another indication in fig. 44e that this is dolomite is the characteristic zoned crystal which has resulted in the prominent dolomite crystal cleaving apart at the boundaries between the crystal’s internal zones. This dolomitization clearly occurred at a late stage in this rock and was localized, as there is no dolomite in the adjoining sample MFTB-05 in the same bed only 6 m (19.5 ft) away.
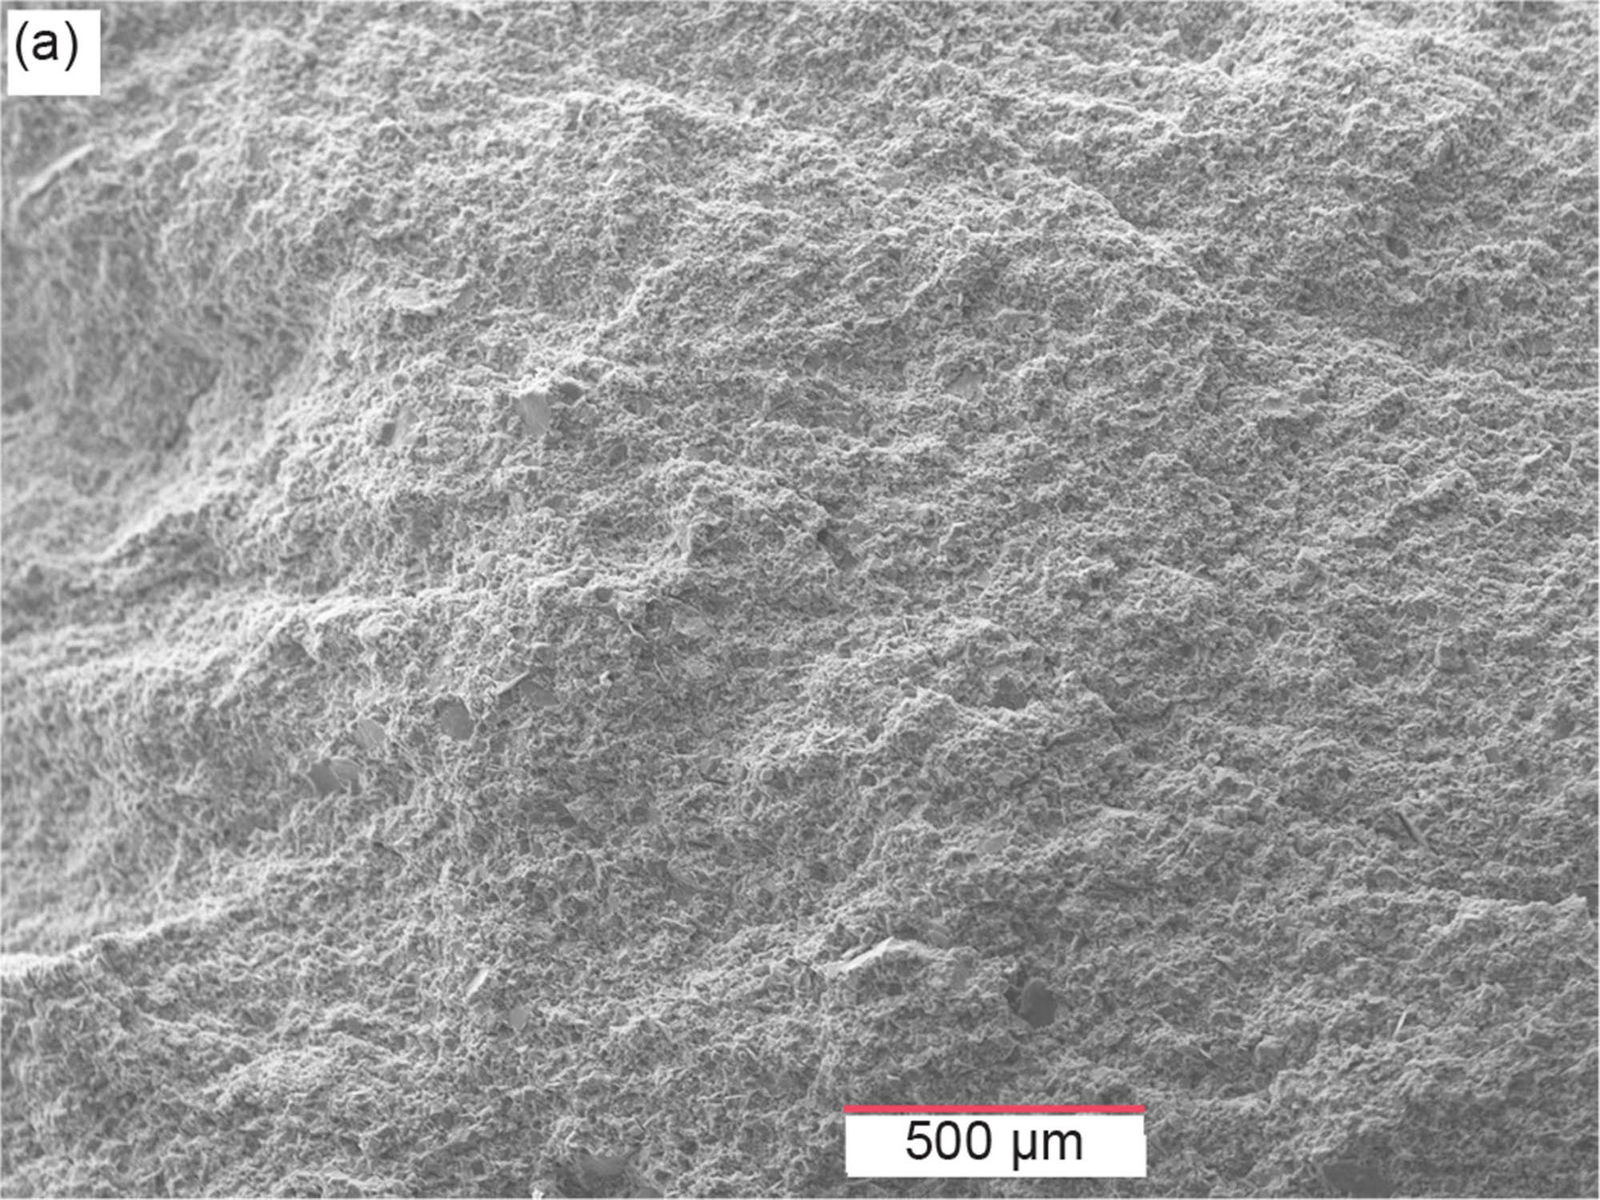
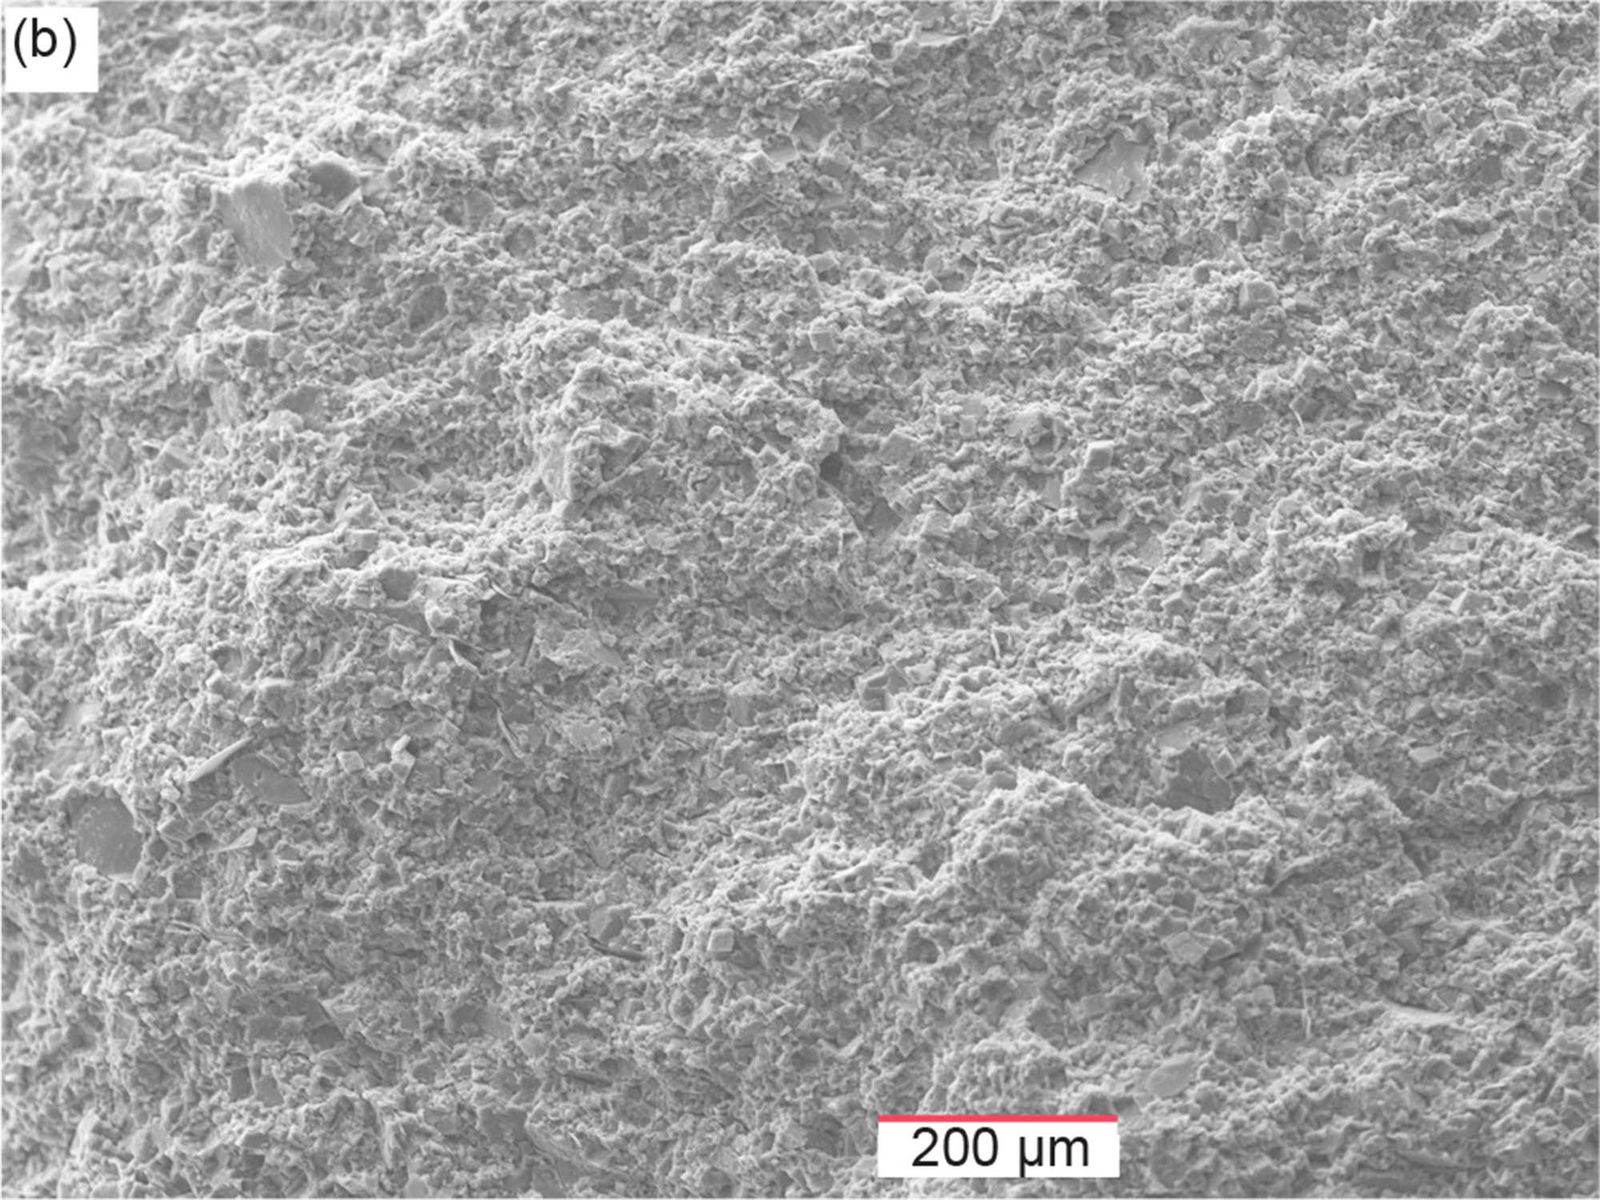
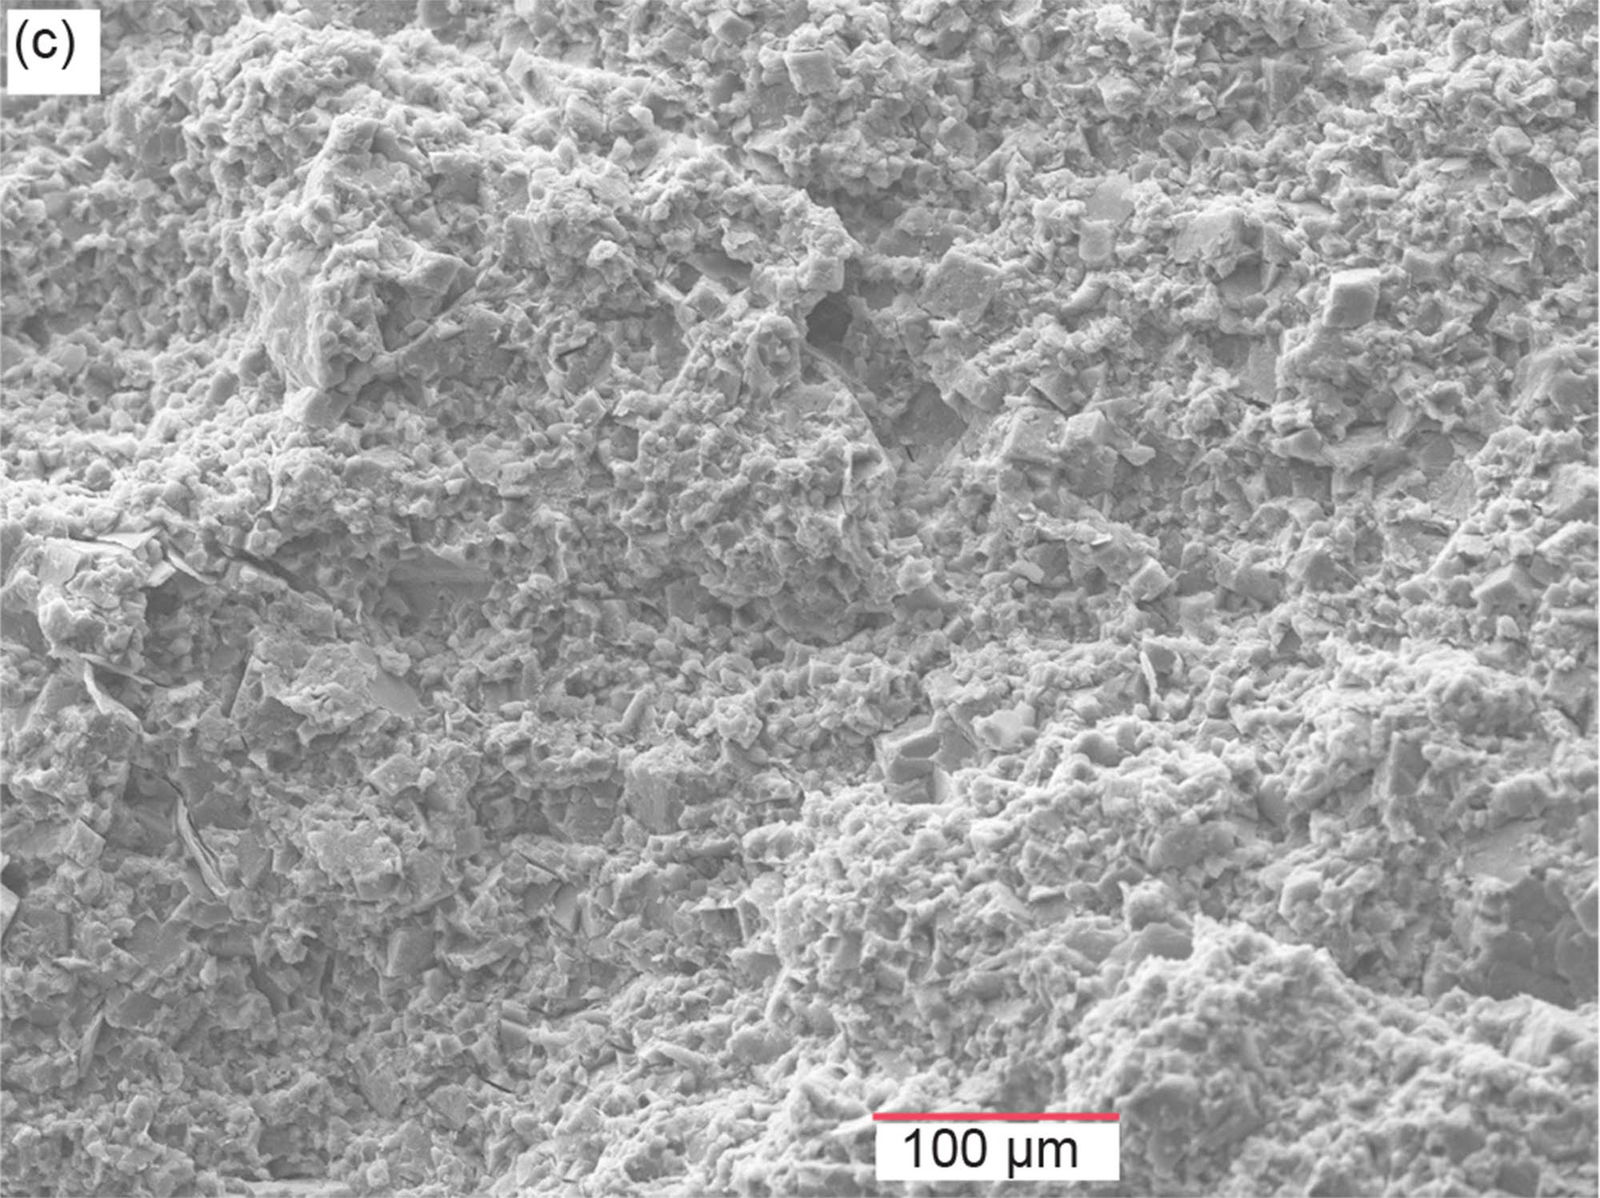
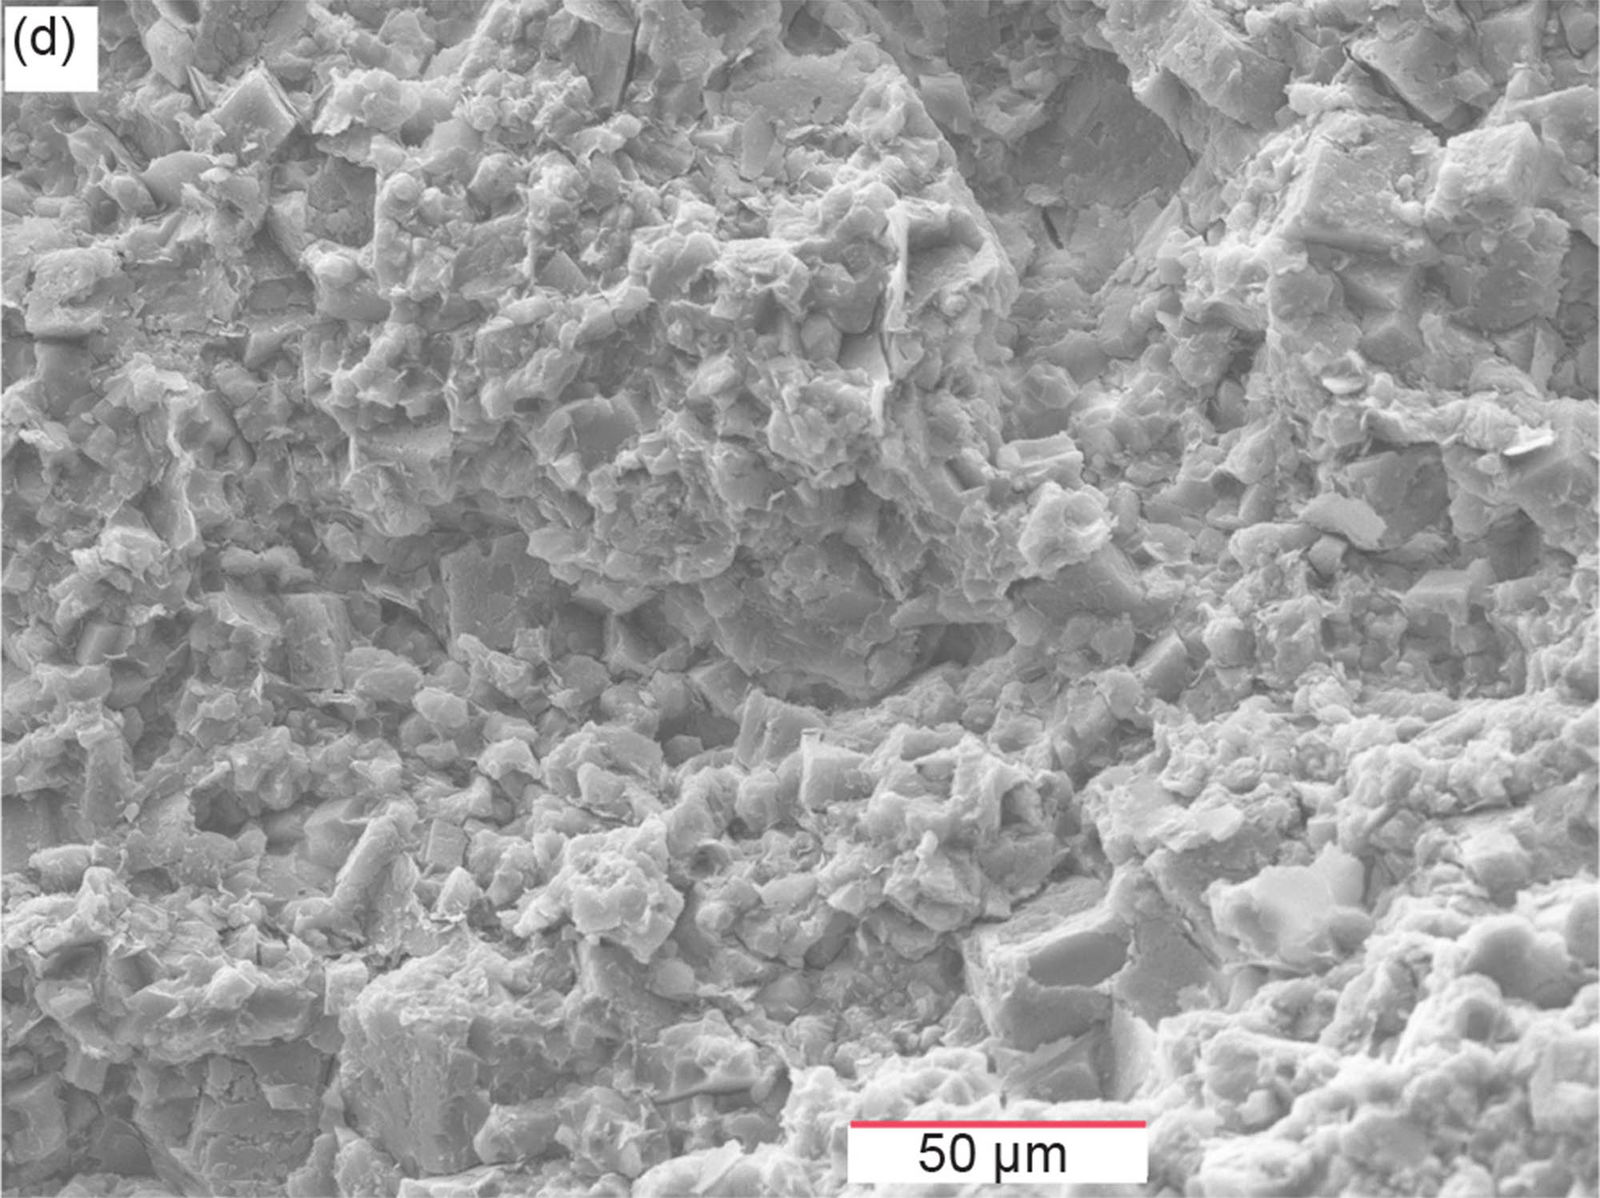
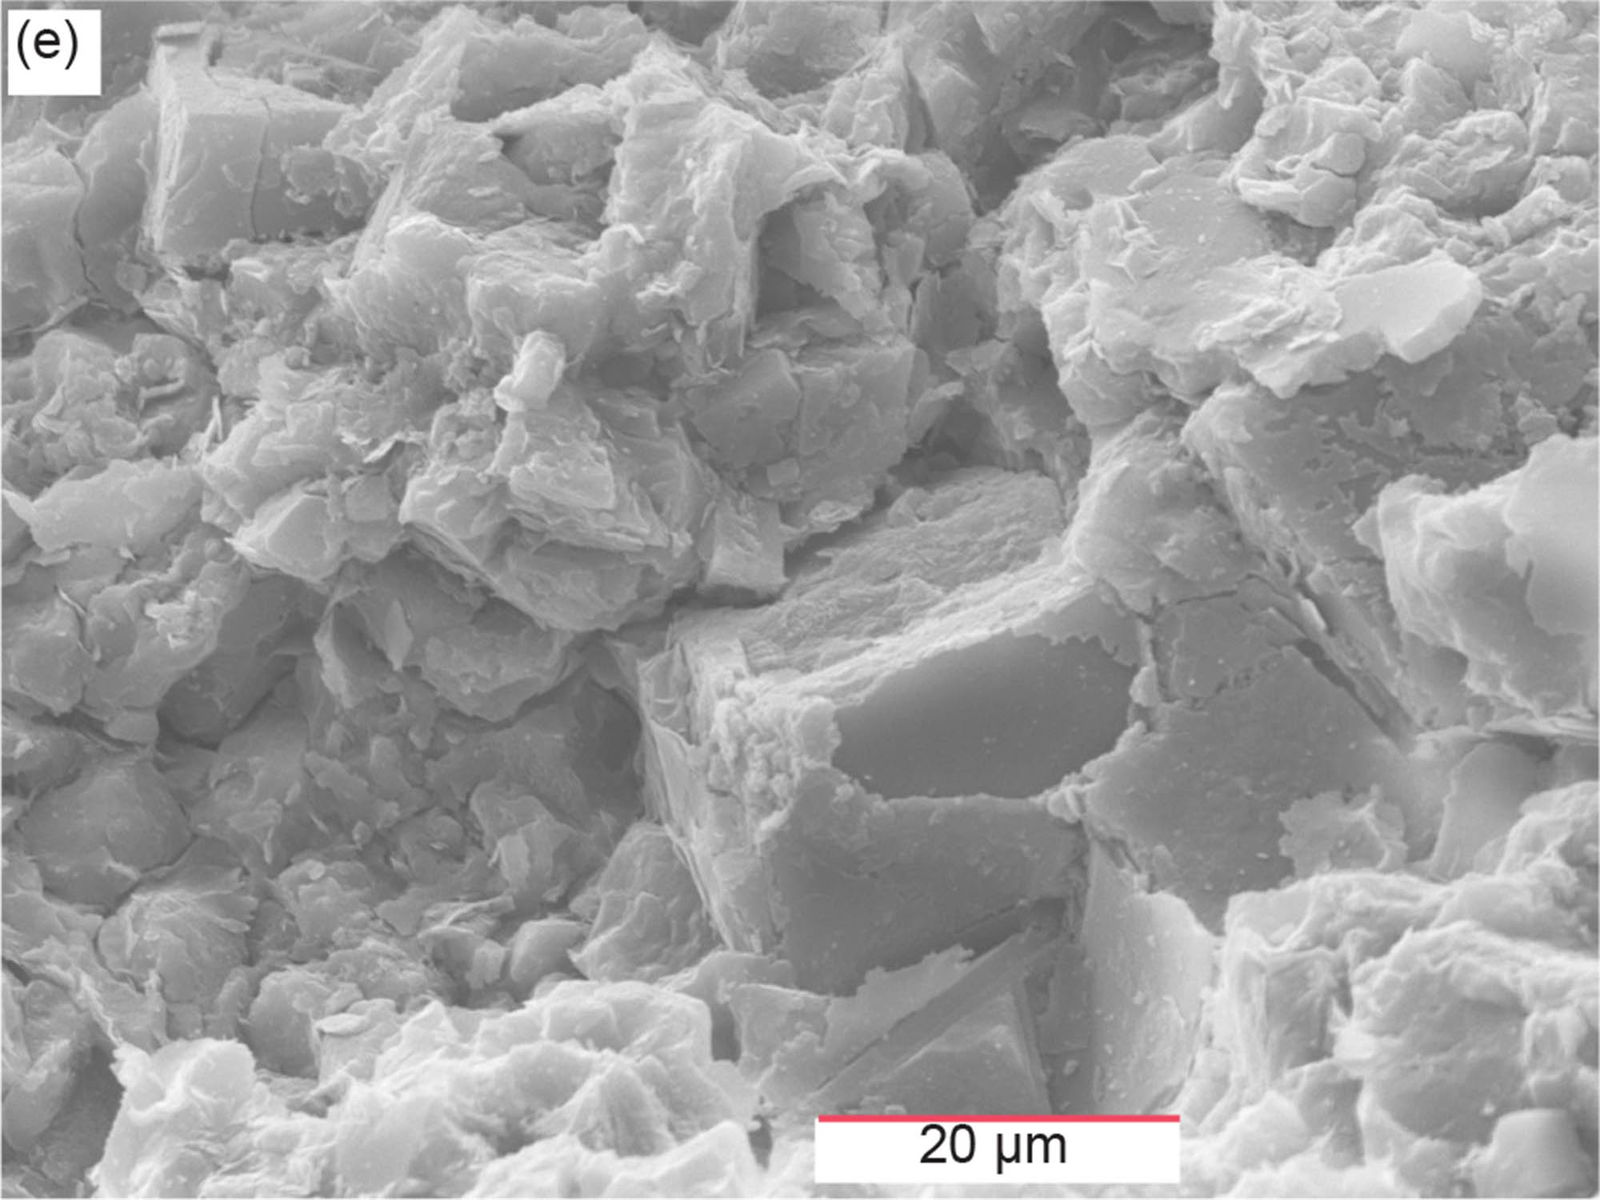
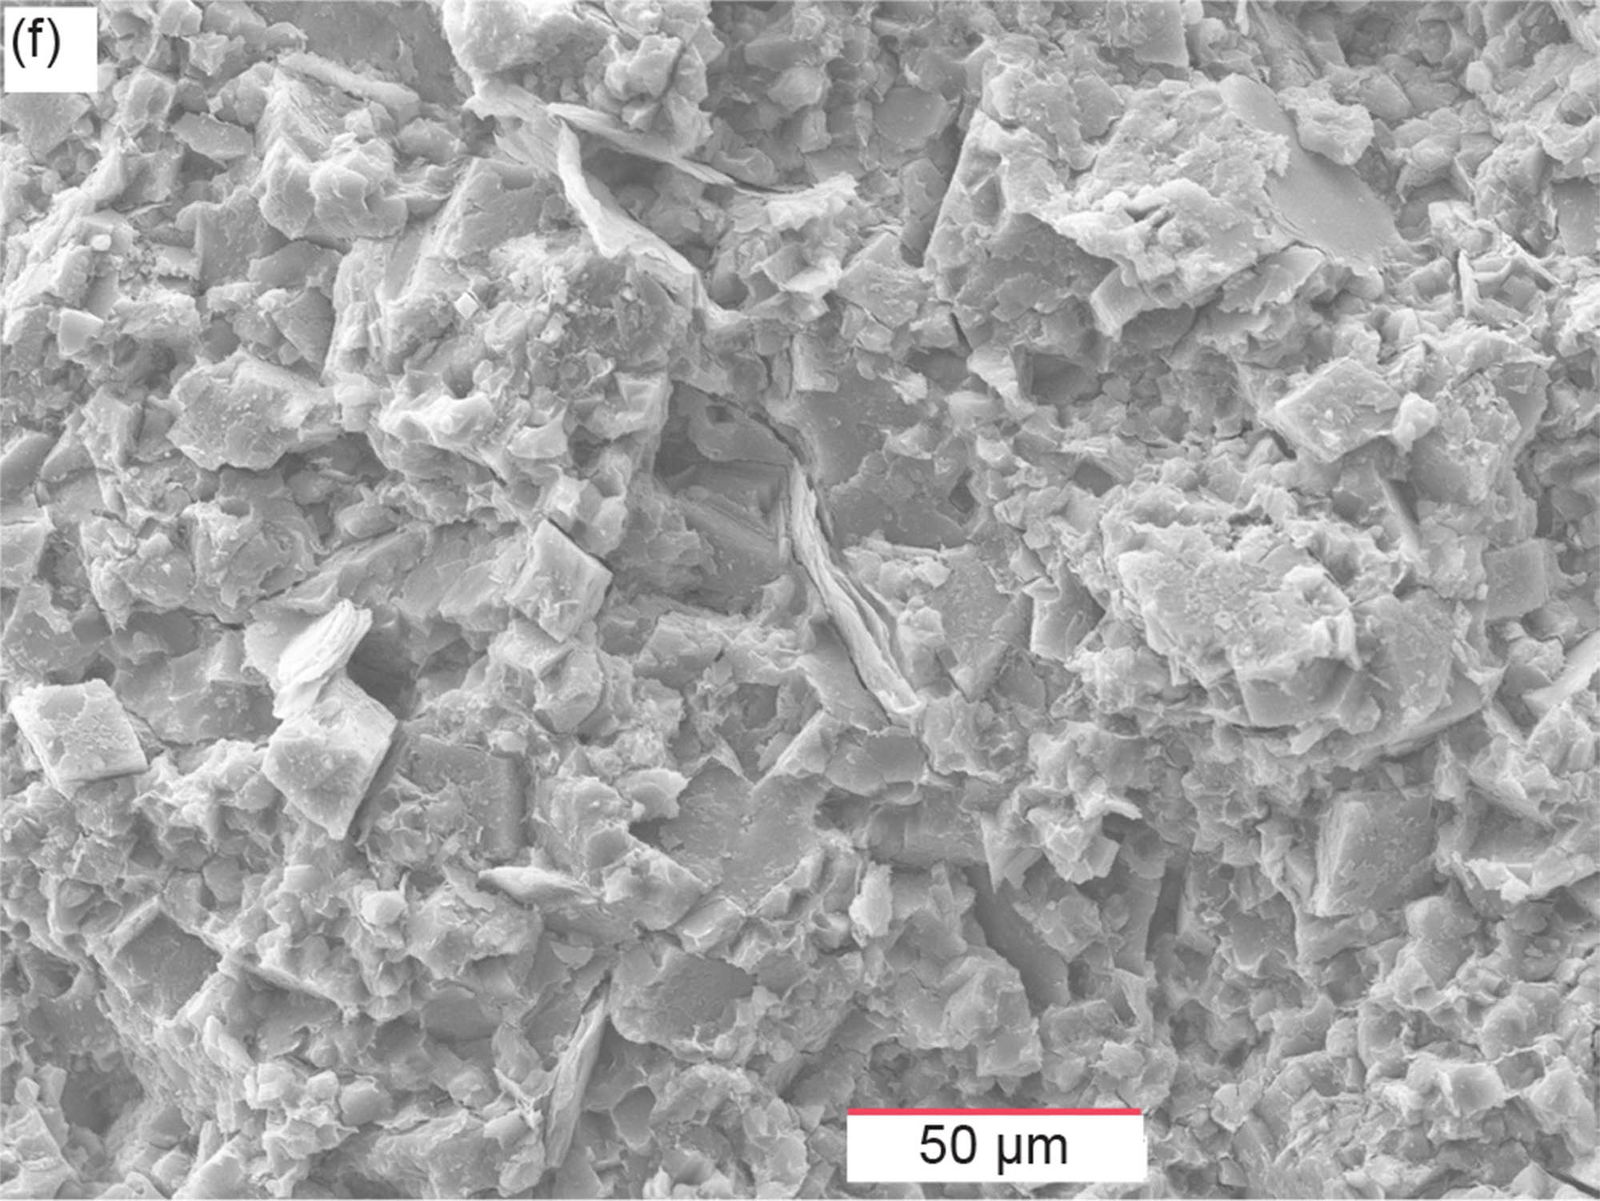
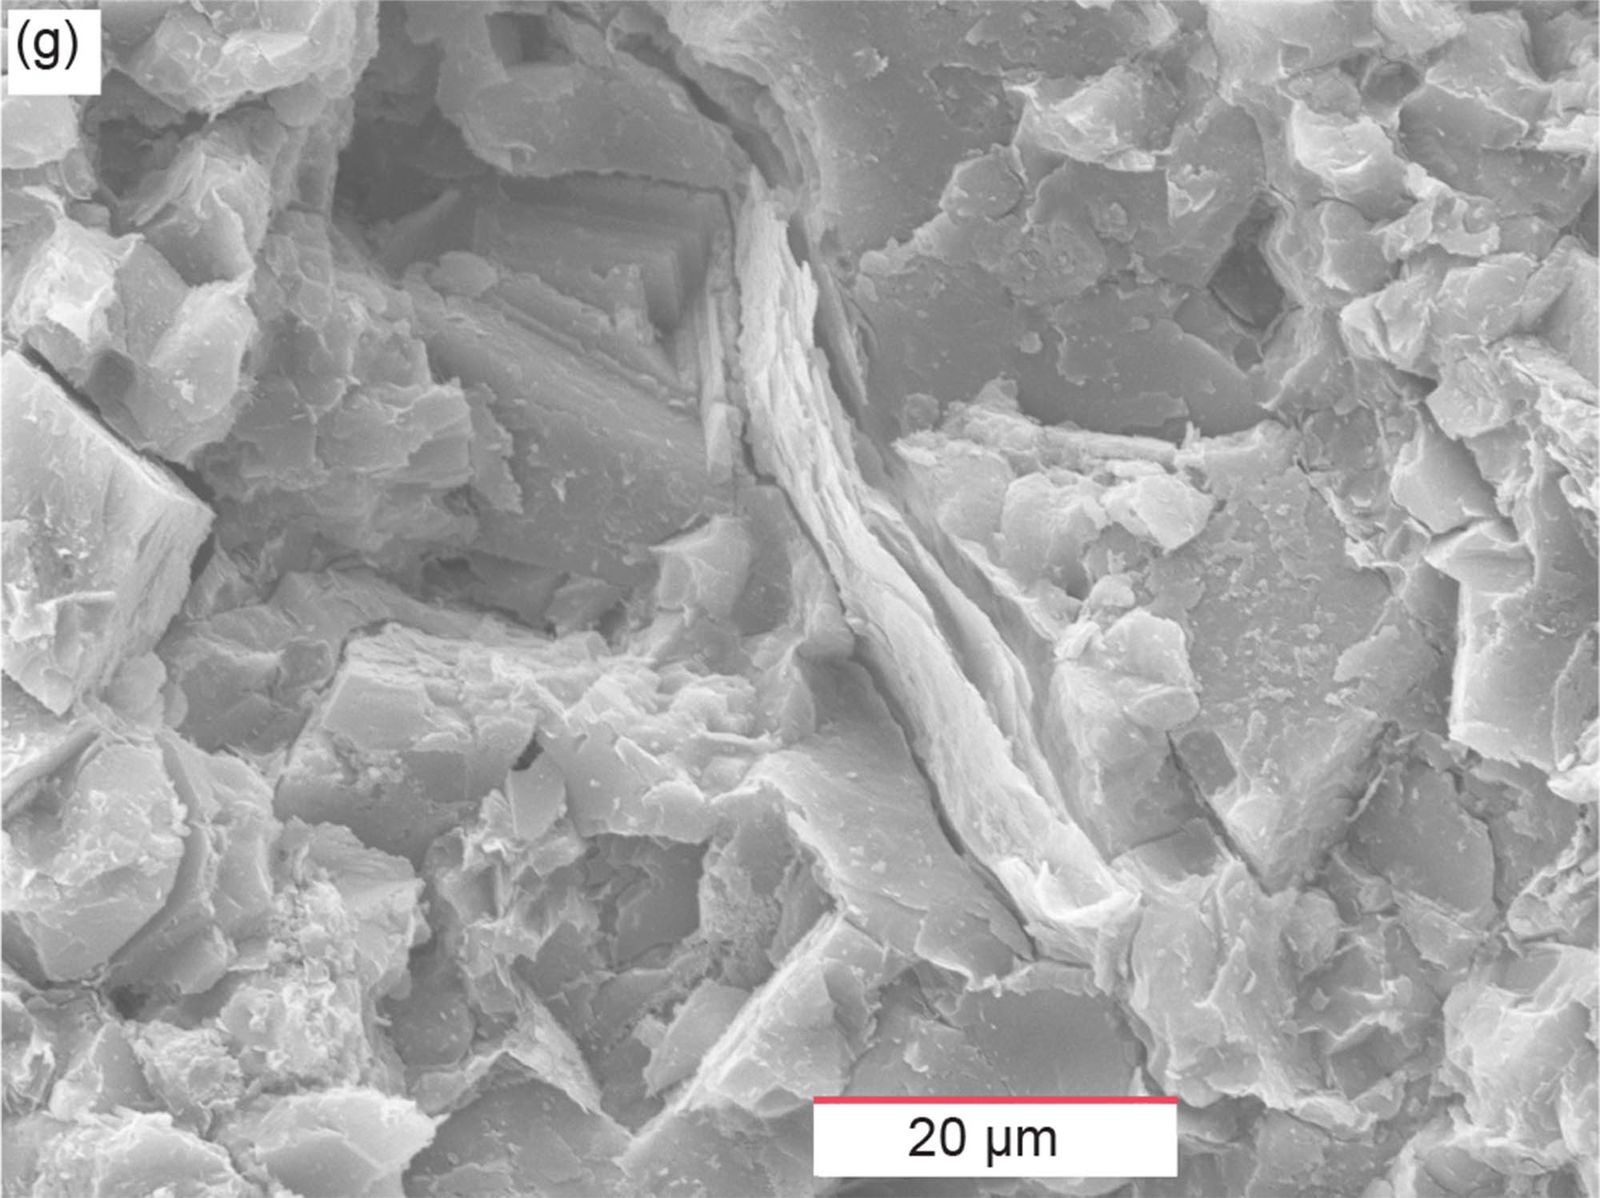
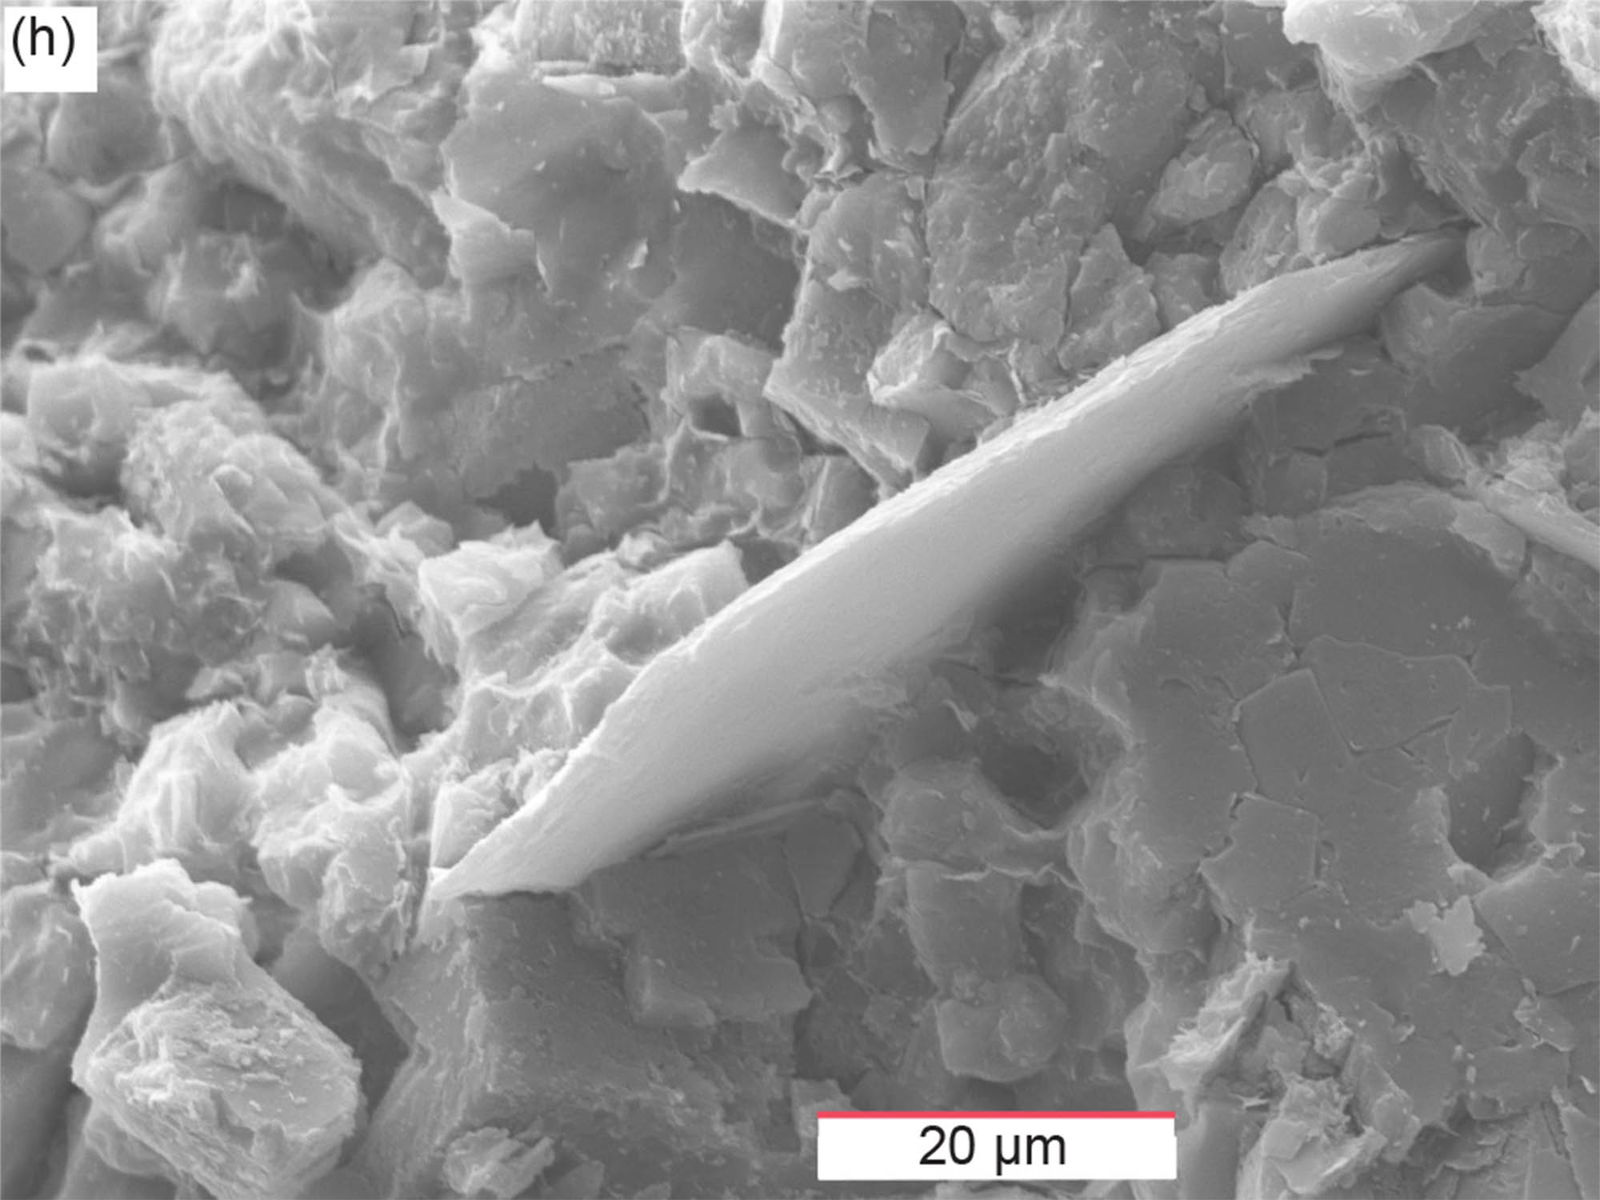
Fig. 44. Scanning electron microscope (SEM) images of sample MFTB-06 from the Matkatamiba fold’s hinge zone and directly above sample MFML-06 (see fig. 22 for its location). (a) 50X, (b) 100X, (c) 200X, (d) 500X, (e) 1500X, (f) 500X, (g) 1500X, and (h) 1500X.
Fig. 44f is a magnified image of the area in fig. 44c near the left-hand edge just below the center of that edge, while fig. 44g is then a higher magnification image of the center area of fig. 44f. These two images display a small, obliquely inclined, edge-on muscovite flake, its sheet structure being readily apparent in fig. 44g. This muscovite flake is firmly wedged between the tightly interlocking dolomite rhombs of recrystallized micrite and calcite cement and has been slightly bent. Thus, this muscovite flake is also in its detrital condition and has not been modified by later processes, including the dolomitization. So, the compactional loading and the heat and pressure due to deep burial have not changed this muscovite flake’s condition, and there is no evidence here of any metamorphic effects due to deep burial, nor any disruption due to the folding process, even though this sample comes from this fold’s hinge zone. Therefore, it must be concluded that the folding was not due to ductile deformation but had to occur while the sediment was still soft and damp before cementation. The location of the high magnification image in fig. 44h is not readily apparent, nor is its identity. However, it is probably a very thin edge-on muscovite flake, due to the evident sheet structure. Like the muscovite flake in fig. 44g, it is still in its detrital condition firmly wedged between the interlocking dolomite rhombs. The same conclusions can thus be drawn from this muscovite flake as previously above, that because this muscovite flake shows no evidence of disruption, bending or even stress, the folding was not due to ductile deformation but occurred while the sediment was still soft and damp.
In conclusion, these SEM images from these samples show no evidence of any effects, such as grain-boundary sliding, that would be expected if ductile deformation was responsible for producing the Matkatamiba fold. Instead, even the scattered muscovite flakes are still in their detrital condition, even though some have been bent or their “pages” are split due to compactional loading, with no hint of any metamorphic changes due to the heat and pressure of deep burial. No shearing has appeared to have taken place in any of the muscovite grains. In many samples the micrite (mud-sized calcite) grains and the calcite cement are seen, though often recrystallization has occurred subsequent to cementation, mostly of calcite but also some localized dolomite. It is clearly apparent that the folding process did not disrupt the fabric of either the calcite cement or the subsequent recrystallization of the micrite and calcite cement mostly to calcite but locally to dolomite. Thus, cementation and recrystallization must have occurred after the folding, so the folding occurred while these sediments were still soft and damp, which would have to be soon after their deposition.
Discussion
It is clearly crucial to first determine the likely temperature and pressure conditions the Muav Formation was subjected to at the depth to which it was buried after its deposition, and before it was then uplifted with the Kaibab Plateau and simultaneously folded during the Laramide orogeny. Those determined temperature and pressure conditions will automatically rule out any expectation of certain macroscopic and microscopic features in the Muav Formation within the Matkatamiba fold due to deformation. Indeed, the observation of the remaining macroscopic and microscopic features will confirm the deduced temperature and pressure conditions and enable a conclusive case to be made for ductile or brittle deformation, or for soft-sediment deformation, to have been involved in the folding mechanism, and it will also determine the timing of lithification with respect to the folding.
Temperature and Pressure Conditions at the Burial Depth
There are several methods for estimating the temperatures and pressures to which the Muav Formation was subjected. First, it is easy to calculate the depth of burial because the thickness of the overlying strata has been measured. According to Blakey and Middleton (2012) the Paleozoic stratigraphic section in Grand Canyon comprises >1,000 m of strata, but their scaled stratigraphic column suggests a more detailed estimate of ~1,350 m (~4,430 ft). Then based on the diagrammatic cross-section in Morales (2003) the Grand Staircase of Mesozoic and Cenozoic strata total a thickness of ~1,220 m (~4,000 ft), although Karlstrom, Timmons, and Crossey (2012) suggest a thickness of ~2,000 m (~6,560 ft). Thus, the total conservatively estimated thickness of Phanerozoic strata in the Grand Canyon-Grand Staircase region would be ~3,350 m (~10,990 ft). However, that is a lower estimate than that of Dumitru, Duddy, and Green (1994), who estimated that the Cambrian strata of the Tonto Group, which includes the Muav Formation, would have been, prior to the erosion of the Mesozoic section from off the top of the Grand Canyon’s Paleozoic sequence, at a depth of burial of between 4.5 km (~14,750 ft) and 6 km (~19,500 ft), although that estimate was based on apatite fission-track data. In any case, it is highly doubtful the entire thickness of the Grand Staircase was covering the Grand Canyon region, as it likely thinned dramatically, like the Grand Canyon Paleozoic sequence does to the north and northeast (Clarey 2020). Therefore, we can conclude that the Muav Formation was possibly buried under ~3,300–4,500 m (~10,825–14,750 ft) of overlying strata which had progressively accumulated during the Phanerozoic.
Since the Muav Formation overlies the Tapeats Sandstone which sits unconformably on the Precambrian basement granites and schists in the Upper Granite Gorge of Grand Canyon, those granites and schists would have been buried under a similar thickness of Phanerozoic strata deposited directly on the granites and schists after erosion of the Great Unconformity. It is significant, therefore, that the biotite flakes within the Vishnu and Rama Schists of the Granite Gorge Metamorphic Suite contain very abundant 238U and 210Po radiohalos, while biotite flakes in several of the granite plutons of the Upper Granite Gorge contain somewhat fewer numbers of 238U and 210Po radiohalos (Snelling 2005a) (fig. 45). These radiohalos would have been readily annealed if the temperature at their burial depth under the overlying Phanerozoic strata had reached 150°C (Laney and Laughlin 1981). Therefore, we can conclude that the burial temperature beneath the Phanerozoic strata did not reach 150°C, as the Muav Formation was not likely buried as deep as some claim and thus would not have reached such a burial temperature (see below).
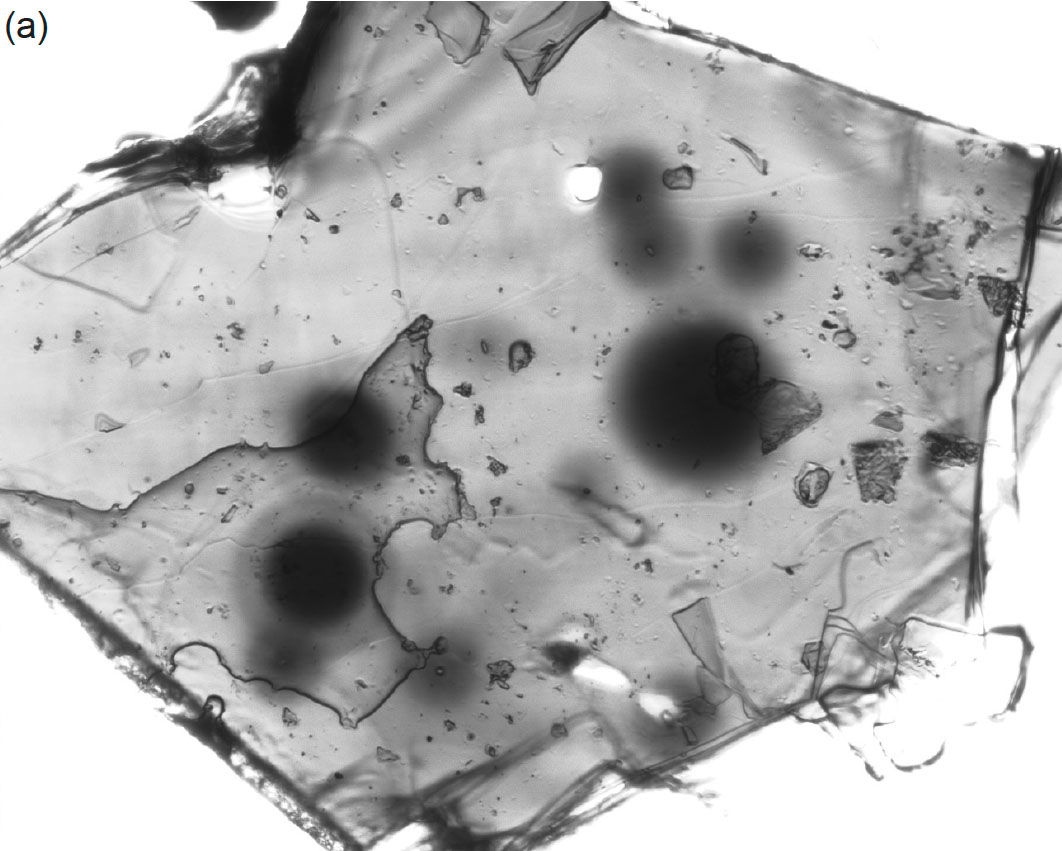
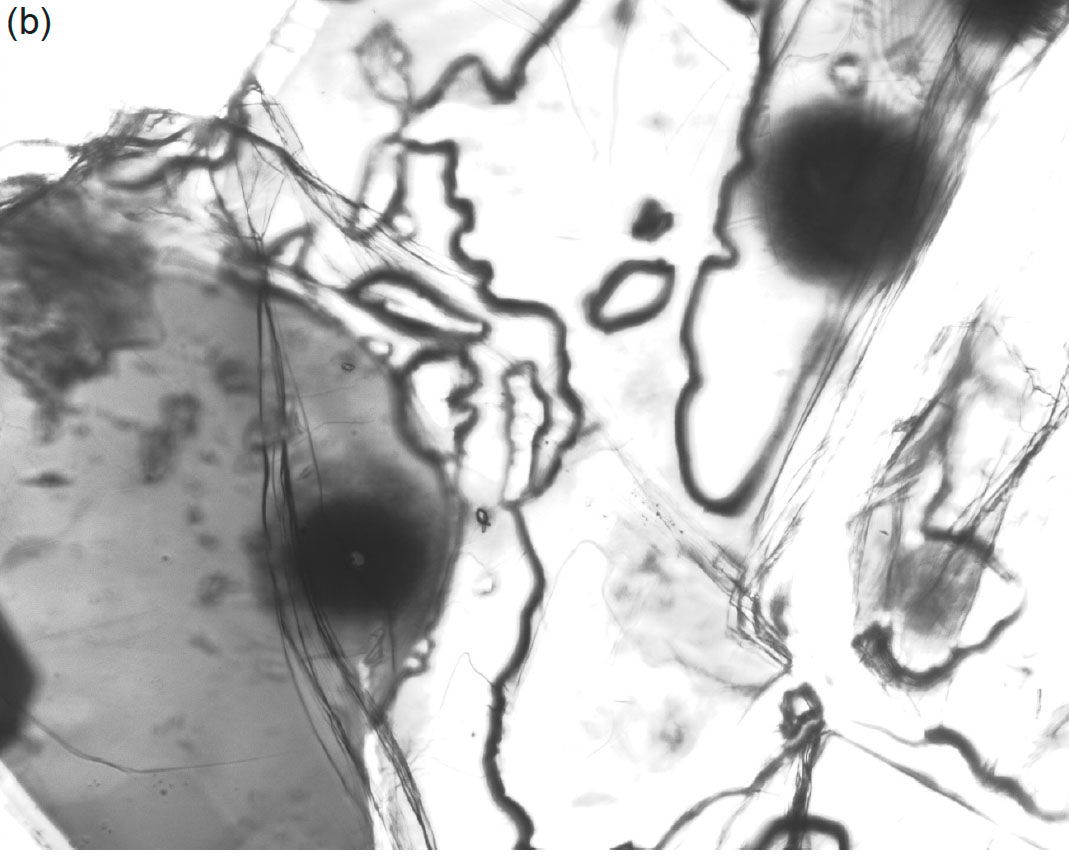
Fig. 45. 238U and 210Po radiohalos in biotite flakes from two samples of the Vishnu Schist of the Granite Gorge Metamorphic Suite in Grand Canyon. The diameter of the 238U radiohalos is ~70 μm, and that of the 210Po radiohalos is ~39 μm. (a) Sample VS-3. (b) Sample VS-6.
A similar paleotemperature indicator is the presence of fission tracks in several minerals in the Muav Formation and Tapeats Sandstone. Snelling (2005b) reported fission tracks in zircon grains from tuff beds within the Muav Formation and Tapeats Sandstone in western Grand Canyon (fig. 46), while Snelling (2023a) reported fission tracks found in quartz grains in a Tapeats Sandstone sample from the Carbon Canyon fold (fig. 47). Fission tracks in both zircon and quartz have been experimentally determined to be annealed at elevated temperatures above 300°C (Sandhu et al. 1990). Naeser et al. (1989, 2001) and Dumitru, Duddy, and Green (1994) found that the apatite fission-tracks in the Proterozoic rocks below the partial annealing zone (below the base of the Redwall Limestone) yielded ages of 61–66 ma and the shortened fission-track lengths suggested that those rocks at the bottom of Grand Canyon cooled to temperatures of 60–65°C during uplift and erosion associated with the Laramide deformation after the Proterozoic basement rocks had been at a burial temperature of ≥110°C during the late Cretaceous prior to the Laramide event. In contrast, Naeser et al. (1989) found that the fission-track ages of ~1,000 ma obtained from zircons from Proterozoic basement rocks now exposed at river level indicated that those rocks had been at temperatures of ≤200°C for the last 1,000 million years.
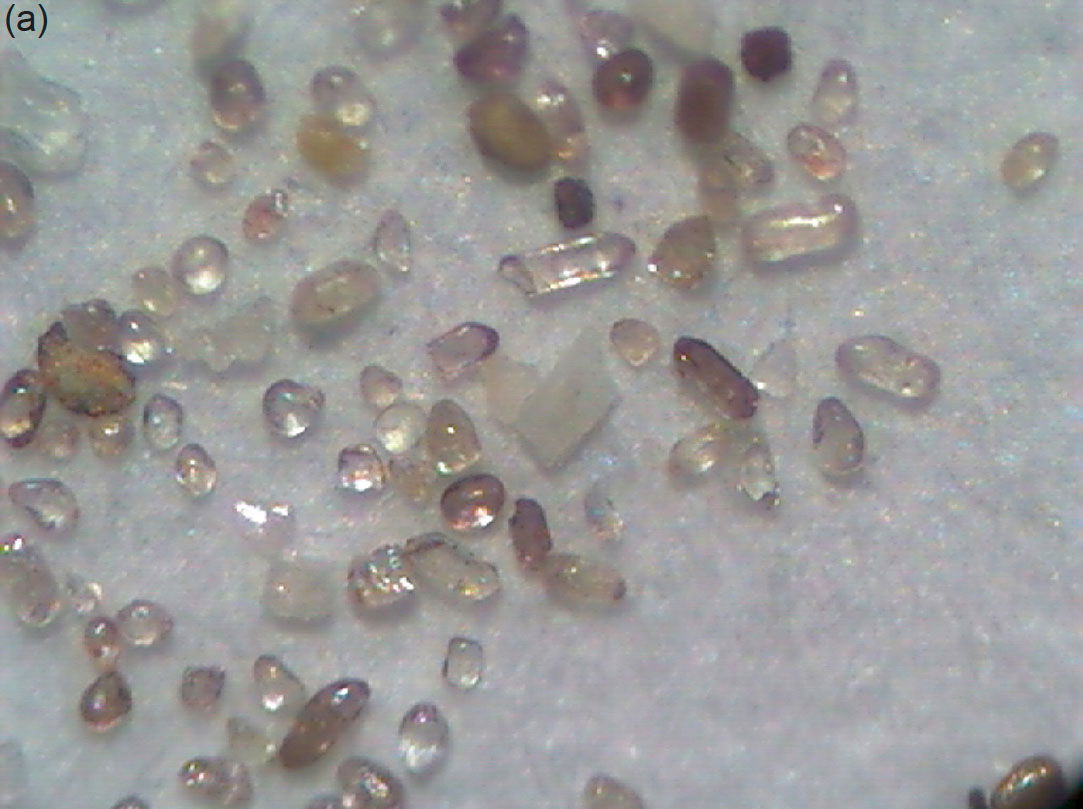
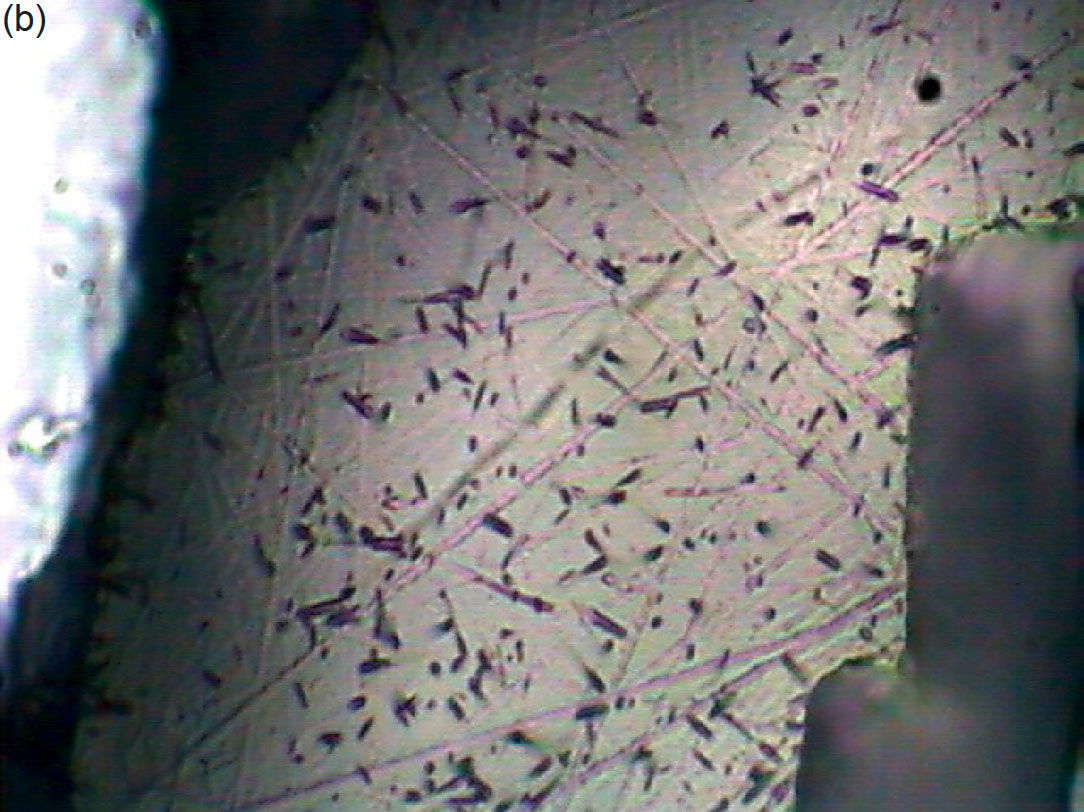
Fig. 46. Zircon grains from the Muav Formation tuff sample MT-3 collected from the thin bed between the Peach Springs and Kanab Canyon Members at river mile 180.2, river left. (a) Raw grains separated from the tuff. (b) The six selected grains after being air abraded to remove overgrowths, metamict zones, or portions of other minerals still clinging to their outer surfaces. Photomicrographs courtesy of Dr. Yakov Kapusta at Activation Laboratories, Ancaster, Ontario, Canada (Snelling 2005b).
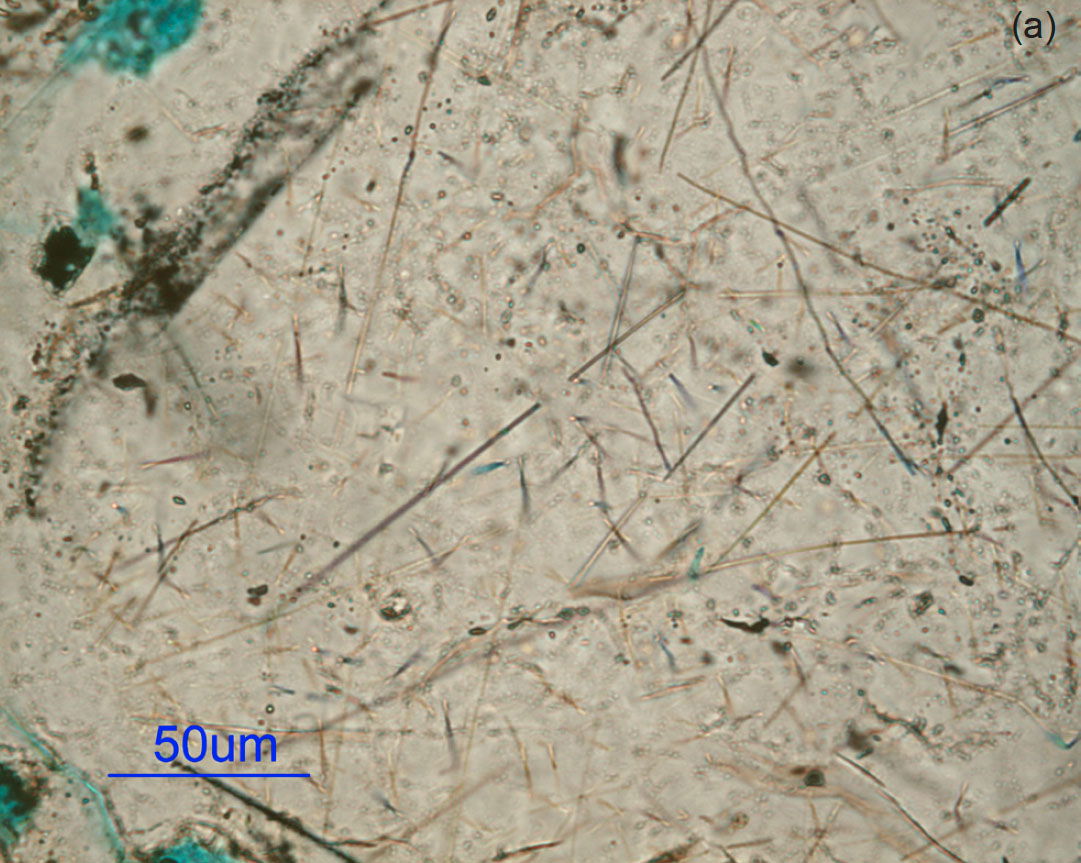
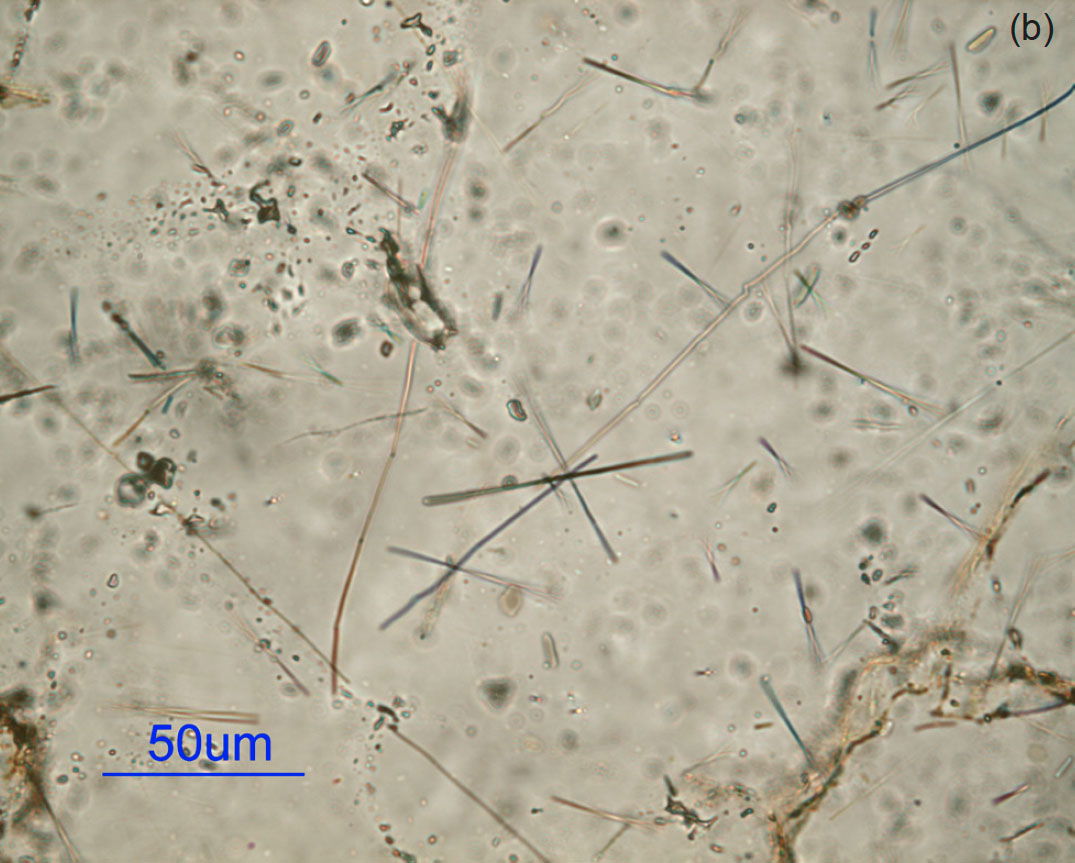
Fig. 47. Fission tracks in quartz grains within sample CCF-11 from one bed within the Carbon Canyon fold, from the limb close to the hinge zone.
Subsequently, Kelley, Chapin, and Karlstrom (2001) used apatite fission-track ages and track length data collected at river level in eastern Grand Canyon to calculate that the Proterozoic basement rocks had cooled during the Laramide deformation to 55–65°C. They also found, as did Naeser et al. (1989), that the apatite fission-track ages obtained from the Proterozoic rocks along the Colorado River generally increased toward the west, perhaps reflecting the differences in the uplift elevations and depositional thicknesses. Kelley and Karlstrom (2012) reported additional new apatite fission-track ages in eastern Grand Canyon and Marble Canyon. They also found that the apatite fission-track ages are progressively younger toward the east and northeast. For example, in the Supai Group the apatite fission-track ages decreased from 127 ± 13 ma near Grand Canyon village to 33 ± 6 ma at river mile 12. Additionally, the apparent apatite fission-track cooling ages on the upthrown blocks on the major monoclines in the eastern Grand Canyon were higher at 80–90 ma than the 55–65 ma on the downwarped side of the East Kaibab Monocline. This suggested to them that the Supai Group in the downwarped side of the East Kaibab Monocline to the northeast in Marble Canyon had cooled through 110°C much later than in the East Kaibab uplift and was indicative of the erosional retreat of the Grand Staircase escarpment that exposes a maximum of ~2 km (~6,560 ft) of Mesozoic strata which may have been stripped away from the Grand Canyon region.
Flowers et al. (2007) and Flowers, Wernicke, and Farley (2008) used apatite (U-Th)/He thermochronology data to constrain the cooling history of eastern Grand Canyon to <70°C. Eight samples from the Upper Granite Gorge yielded apatite (U-Th)/He dates of 23 ± 3 ma to 55 ± 7 ma, but their modeling suggested complete resetting had occurred during peak temperatures near the end of Cretaceous sedimentation, followed by cooling during the Laramide deformation event. In contrast, samples from Permian and Triassic sedimentary units in Marble Canyon to the northeast of Grand Canyon yielded a broad span of apatite (U-Th)/He dates of 5–104 ma, but they similarly explained the thermal history of those ages based on a large range of accumulated radiation damage due to the wide range of uranium contents of the detrital apatite grains.
Flowers and Farley (2012) added apatite 4He/3He thermochronology data to the discussion of the cooling history of Grand Canyon’s basement rocks. They found that the 4He/3He spectra of single apatite grains from basement rocks in eastern Grand Canyon with differing (U-Th)/He dates, radiation damage and U-Th zonation yield a self-consistent cooling history that substantially validated the He diffusion kinetic model they applied. In their modeling, their assumed 20–25°C/km geothermal gradient thermal histories were fitted through 110° to 120°C peak temperatures at 80 to 85 ma, as suggested by complete annealing of apatite fission-tracks at this time (Dumitru, Duddy, and Green 1994), and cooling to the 20° to 25°C surface temperature by present-day. Statistically acceptable paths imposed tight constraints on the ~90° to 30°C thermal history experienced by eastern Grand Canyon, which are consistent with, but more restrictive than, the history inferred from the apatite (U-Th)/He dates alone (Flowers et al. 2009) and apatite fission-track data from the same area.
Finally, Peak et al. (2021) and Thurston et al. (2022) used zircon (U-Th)/He thermochronology data obtained from the Precambrian crystalline basement rocks in eastern Grand Canyon to constrain the thermal history of the unroofing of the Great Unconformity. They found that their data and models were also highly sensitive to late-stage reheating due to burial beneath ~3–4 km (~9,840–13,120 ft) of Phanerozoic strata prior to ca. 60 ma. Their models that best matched observed date-equivalent uranium trends showed maximum burial temperatures of 140–160°C, which agree with the available apatite (U-Th)/He and apatite fission-track data.
In contrast, as the basis for a totally different method to determine burial temperatures, experimental studies of the conversion of smectite to illite have demonstrated its potential use as a geothermometer (Essene and Peacor 1995; Huang, Longo, and Pevear 1993), which has been confirmed by field studies (Hillier et al. 1995; Pollastro 1993; Pytte and Reynolds 1989; Renac and Meunier 1995; Smart and Clayton 1985; Velde and Espitalié 1989; Velde and Lanson 1993). Similarly, many studies have demonstrated the value of using illite crystallinity as an indicator to distinguish between diagenesis, very low-grade metamorphism, and low-grade metamorphism (Barrenechea, Rodas, and Mas 1995; Blenkinsop 1988; Frey and Robinson 1999; Kisch 1983, 1987; Kubler 1964, 1967, 1968; Kubler and Goy-Eggenberger 2001).
However, the smectite/illite ratio relationship to temperature appears to be neither simple nor unequivocal, because of various factors such as the ion content and concentrations in interstitial waters and the geothermal gradient, not just at the present time, but also during the history of the sediment pile. Nevertheless, Hower (1981) found clear relationships between depth, temperature, and the percent illite in illite interstratified with smectite in the sediments intersected by oil wells in the coastal region of the Gulf of Mexico (fig. 48) (Pollastro 1993), one of which is directly comparable to the sedimentary sequence in the Grand Canyon-Colorado Plateau region. Dumitru, Duddy, and Green (1994) estimated that the Cambrian strata of the Tonto Group, which includes the Muav Formation, would have been, prior to the erosion of the Mesozoic section from the top of the Grand Canyon sequence, at a depth of burial of between 4.5 km (~14,500 ft) and 6 km (~19,500 ft), with their apatite fission-track data suggesting temperatures of between 110° and 130°C, as determined by subsequent studies discussed above. In fig. 48 the percent illite in the illite interstratified with smectite in two samples from thin tuff beds within the Muav Formation and Tapeats Sandstone (Tonto Group) in Grand Canyon, as reported by Snelling (2005b, 265, table 3), were plotted on the geothermal curve obtained for oil well (B) in the Gulf of Mexico and projected onto the depth and temperature axes. This suggests that with that same geothermal gradient, where these tuff beds would have been, prior to the erosion of the Mesozoic strata above, at depths of 4,800–5,600 m (~15,700–18,400 ft) and subjected to temperatures of between 110° and 130°C. These values are consistent with the estimates by Dumitru, Duddy, and Green (1994) and the subsequent studies discussed above.
Fig. 48. Proportion of illite (I) layers in mixed-layer illite/smectite (I/S) versus depth (left) and temperature (right) for samples from (a) an oil well in Oligocene strata, and (b) an oil well in Miocene strata, in the Gulf of Mexico region (modified from Hower 1981). The %I in I/S data for the Muav tuff MT-3 and Tapeats tuff TTS-1 samples are plotted on curve B and the interpreted depths and temperatures are projected from that curve (from Snelling 2005b).
Dumitru, Duddy, and Green (1994) based their estimation on a pre-Cretaceous geothermal gradient of 20–30°C/km, and the geothermal gradient in oil well (B) that penetrates Miocene strata (fig. 48) is of the order of 20°C/km. Such a geothermal gradient is not unreasonable in the timeframe of the Genesis Flood event, given the catastrophic deposition of the thick Paleozoic and Mesozoic strata sequence (Austin 1994) and the elevated temperatures of the waters depositing those sediments (Austin et al. 1994). Thus, the estimates of depth and temperature based on the percent illite in the illite interstratified with smectite for these two tuff samples, though very approximate due to the likely large errors in the XRD determinations, are not unreasonable. Therefore, because of the consistency of these estimates with the apatite fission-track data of Naeser et al. (1989), Dumitru, Duddy, and Green (1994) and the subsequent studies discussed above, it seems reasonable to conclude that these two tuff units have, since their burial, only been subjected to maximum temperatures of 110–130°C, well below the 200 ± 40°C temperature for total annealing of fission tracks in zircon (Harrison et al. 1979; Hurford 1985; Zeitler 1985) and the 150°C temperature for the total annealing of radiohalos (Laney and Laughlin 1981).
The significance of the Kubler Index values calculated from the XRD clay mineral analyses of the two samples from the two tuff units (Snelling 2005b, 265, table 3) are harder to interpret from the available literature, which primarily focuses on low-grade metamorphism of sedimentary strata sequences. Estimating the temperatures to which these two tuff units were subjected based on these approximate Kubler Index values depends on the value of the Kubler Index used to define the boundary between diagenesis and the lowest grade metamorphism, which is otherwise defined by mineralogical changes in the clay minerals (Kisch 1987; Kubler 1967). As indicated by Blenkinsop (1988), early studies using the Kubler Index for illite crystallinity all adopted different values of the index to define this crucial boundary, so standardization was warranted. Using the standardized definition of Kisch (1991) and Brime (1999) with a Kubler Index of 0.42 for the boundary between diagenesis and the lowest grade metamorphism, as successfully applied by Brime, Talent, and Mawson (2003), the estimated Kubler Index values for the Muav and Tapeats tuffs (Snelling 2005b, 265, table 3) indicate that they are on the lower temperature side of this boundary, so they only suffered diagenesis and not metamorphism. Temperature estimates for that boundary place it at 150 ± 50°C (Bucher and Frey 2002; Frey and Kisch 1987; Robinson and Merriman 1999). Thus, the Kubler Index values for these two tuff units are consistent with the estimate of 110–130°C for the temperatures to which these tuff units have been subjected from both the apatite fission-track data of Naeser et al. (1989), Dumitru, Duddy, and Green (1994) and the subsequent studies discussed above, and their smectite/illite ratios.
In conclusion, the consensus from all estimation methods is that the Muav Formation, prior to the Laramide deformation responsible for the Matkatamiba fold, would have been subjected to a burial temperature of 110–130°C. Later, during the Kaibab uplift, erosion caused the temperatures within the Muav Formation to decrease to <70°C. However, estimates of the burial depth vary, but based on measured strata thickness it was concluded above that the Muav Formation was possibly buried under ~3,300–4,500 m (~10,825–14,750 ft) of overlying strata which had progressively accumulated during the Phanerozoic. However, this is probably an overestimate of the thickness as the Mesozoic part of the Phanerozoic strata which likely thinned to the south as previously discussed, and these strata (such as the Muav Formation and the Redwall Limestone) even vary in thickness within the walls of Grand Canyon. Thus, using a general overburden pressure gradient (Khan and Islam 2008), at those depths the overburden (confining) pressure on the Muav Formation would have been ~0.3–0.4 kbar (~4,300–5,900 psi). According to Bucher and Frey (2002, 5, fig. 1.1) these pressure-temperature conditions are well within the pressure-temperature field of sedimentary diagenesis. Thus, it is consistent that the mineralogy and textures (macroscopic or microscopic) of the Muav Formation do not indicate any signs of any metamorphic changes to the detrital grains (Snelling 2022a), as confirmed by the petrographic and SEM observations reported in this study.
The Macroscopic Features
The next issue to address is whether the macroscopic features in the outcropping Muav Formation within the Matkatamiba fold are consistent with ductile or brittle deformation of the limestone beds several hundred million years after their lithification, or with soft-sediment deformation of the limestone beds soon after their deposition and before lithification. As already noted, though, the Muav Formation was most likely not buried deeply enough to experience ductile deformation as it is well above the brittle-ductile transition zone, which occurs at a depth of 15–20 km (~49,000–65,600 ft) at temperatures of 250–400°C (Condie 2005; Zhamaletdinov 2019). Indeed, Heard (1960) has confirmed experimentally that the transition from brittle fracture to ductile flow in limestone is at such temperatures and pressures. On the other hand, under some near surface conditions, rock layers may remain coherent because the grains and/or beds within them can facilitate folding due to brittle deformation. Most near surface rock layers undergo brittle fracturing and faulting, leaving the rock’s grains fractured. Some coherent beds may slide past one another as the rock layers are folded via bedding plane slip or flexural slip, which should leave tell-tale features in outcrop, such as slickensides on the lithified bedding plane surfaces.
So, what do we observe in the Muav Formation limestone beds bent in the Matkatamiba fold? From field observations of the outcrop of the Muav Formation beds in the Matkatamiba fold it is not readily evident whether any bedding plane or flexural slip might have occurred to accommodate their folding. The hinge zones are open without shattering of the rock fabric, and it does not appear that there has been any thickening or thinning of the beds in the hinge zones (figs. 8 and 51a, b). The fold would be best classified according to Ramsay (1967) as a Class 1B parallel-concentric fold (fig. 15) and corresponds to a Donath and Parker (1964) flexural-slip fold (fig. 14). The hinge distances are also very open and there is no mechanical crowding or thinning of the limestone beds in either the hinge zones or the limbs, contrary to what might be expected according to the claims of Huntoon (2003) and Hill and Moshier (2009) regarding the very similar Carbon Canyon fold (Snelling 2023a). Indeed, the thicknesses of the individual limestone beds are very consistent along their lengths when traced from one limb through the hinge zone and out onto the opposite limb (figs. 8 and 49a, b), contrary to the claims by Hill and Moshier (2009) and Tapp and Wolgemuth (2016) that the bedding thicknesses change along the similar Carbon Canyon fold adjacent to the Butte Fault (figs. 6 and 12). Indeed, where the Muav Formation limestone beds are folded along the same Butte Fault, the beds have not been thickened or thinned and the hinge zone also is very open with no mechanical crowding of the beds (fig. 11). Certainly, the limestone beds in the Matkatamiba fold were pushed up by the upthrown block on the left side of the fold as they were bent through the ~50° monoclinal fold (figs. 8, 10, and 49a, b). Furthermore, there is no change in the direction of the fold hinges between the two Muav Formation members of limestone beds on either side of the monoclinal flexure (figs. 8 and 49a, b). This is not the same as the claim of Tapp and Wolgemuth (2016) for the Carbon Canyon fold (fig. 12) in which their annotated red arrows exaggerate the trivial change of direction. And contrary to the claim about the Carbon Canyon fold by Tapp and Wolgemuth (2016) that hinge zones have been filled with weathered material or weaker deformed rock (figs. 12 and 13), there is no evidence whatsoever of that in the monoclinal hinge zones of either the Matkatamiba fold, or the Carbon Canyon fold (Snelling 2023a). This further indicates that any bedding plane or flexural slippage was minimal between the limestone beds in the Matkatamiba fold.
There are no clusters of obvious major fractures in the two monoclinal hinge zones of the Matkatamiba fold, as would be expected if lithified rock had suffered from brittle deformation (figs. 8 and 49a, b). Fossen (2016, 157) has an illustration of fractures or joints that would have opened in a cluster around the stretched edge of the hinge zone of a folded bed as a result of strain during folding, yet such clusters are absent from the limestone beds in the hinge zones of the Matkatamiba fold. This is unlike the many fractures in the Carbon Canyon fold as shown on the annotated overlay by Tapp and Wolgemuth (2016) (fig. 12). This is not what would be expected if ductile deformation had occurred in the Matkatamiba fold. Instead, there should be fractures in the hinge zones that should be open where the limestone beds were stretched on the outer curves of the folded beds and compressed tightly shut on the inside curves, but such fractures are not observed in outcrop (figs. 8 and 49a, b). So, rather than fractures due to ductile deformation as Tapp and Wolgemuth (2016) imply, there are hairline-thick joints likely produced by contraction of the rock fabric during dewatering and lithification, and then especially during unloading of the confining overburden pressure as the overlying strata were eroded away during carving of Grand Canyon and its side canyons. Joints are fractures or cracks with minute openings, with little to no displacement along their sharp walls (Fossen 2016; Schultz 2019). Indeed, one of the principal causes of the development of joints is the release of the vertical stress and thus the horizontal stress as well (to a lesser extent) during exhumation of the overburden (Fossen 2016), and in this case, the erosion of Grand Canyon through the fold. And for the most part, joints come in populations defined by local stress fields, and are often regularly spaced according to the strength of the rock fabric (Fossen 2016; Groshong 1988; Schultz 2019), as can be seen in the annotated overlay of the Carbon Canyon fold by Tapp and Wolgemuth (2016) (fig. 12). Furthermore, joint spacing also depends on layer thickness, such that field observations and experimental work has demonstrated the very simple relationship that the joint spacing is more or less equal to the layer thickness, independent of scale (Fossen 2016; Narr and Suppe 1991; Silliphant, Engelder, and Gross 2002). This relationship is also somewhat evident in the Tapeats Sandstone beds bent in the Carbon Canyon fold (figs. 6 and 12), but difficult to see in the Matkatamiba fold (figs. 8 and 49a, b).
However, closer inspection along the boundary between the two Muav Formation members in the Matkatamiba fold does provide evidence of minimal bedding plane or flexural slippage (fig. 49c–e). In the hinge zone there is minor “crumpling” and very small monoclinal folding of limestone laminae in the Havasu Member just above its boundary with the underlying Gateway Canyon Member. The amplitude of these folds are about 15–20 cm (c. 6–8 in). However, even though this small folding of the laminae is evidence of some minor bedding plane slippage, this folding is also smooth without any fracturing or shattering of the laminae in their hinge zones, again indicating that the limestone was plastic when the bedding plane slippage and folding occurred, consistent with soft sediment deformation. Furthermore, no slickensides were observed on any of the exposed bedding plane surfaces between laminae. Slickensides would likely have been present if the bedding plane slippage during folding had occurred when the limestone laminae were already cemented and lithified before brittle or ductile deformation over an extended time period. So, their absence is also consistent with the folding being due to soft sediment deformation before hardening of the cement in, and lithification of, the limestone laminae.
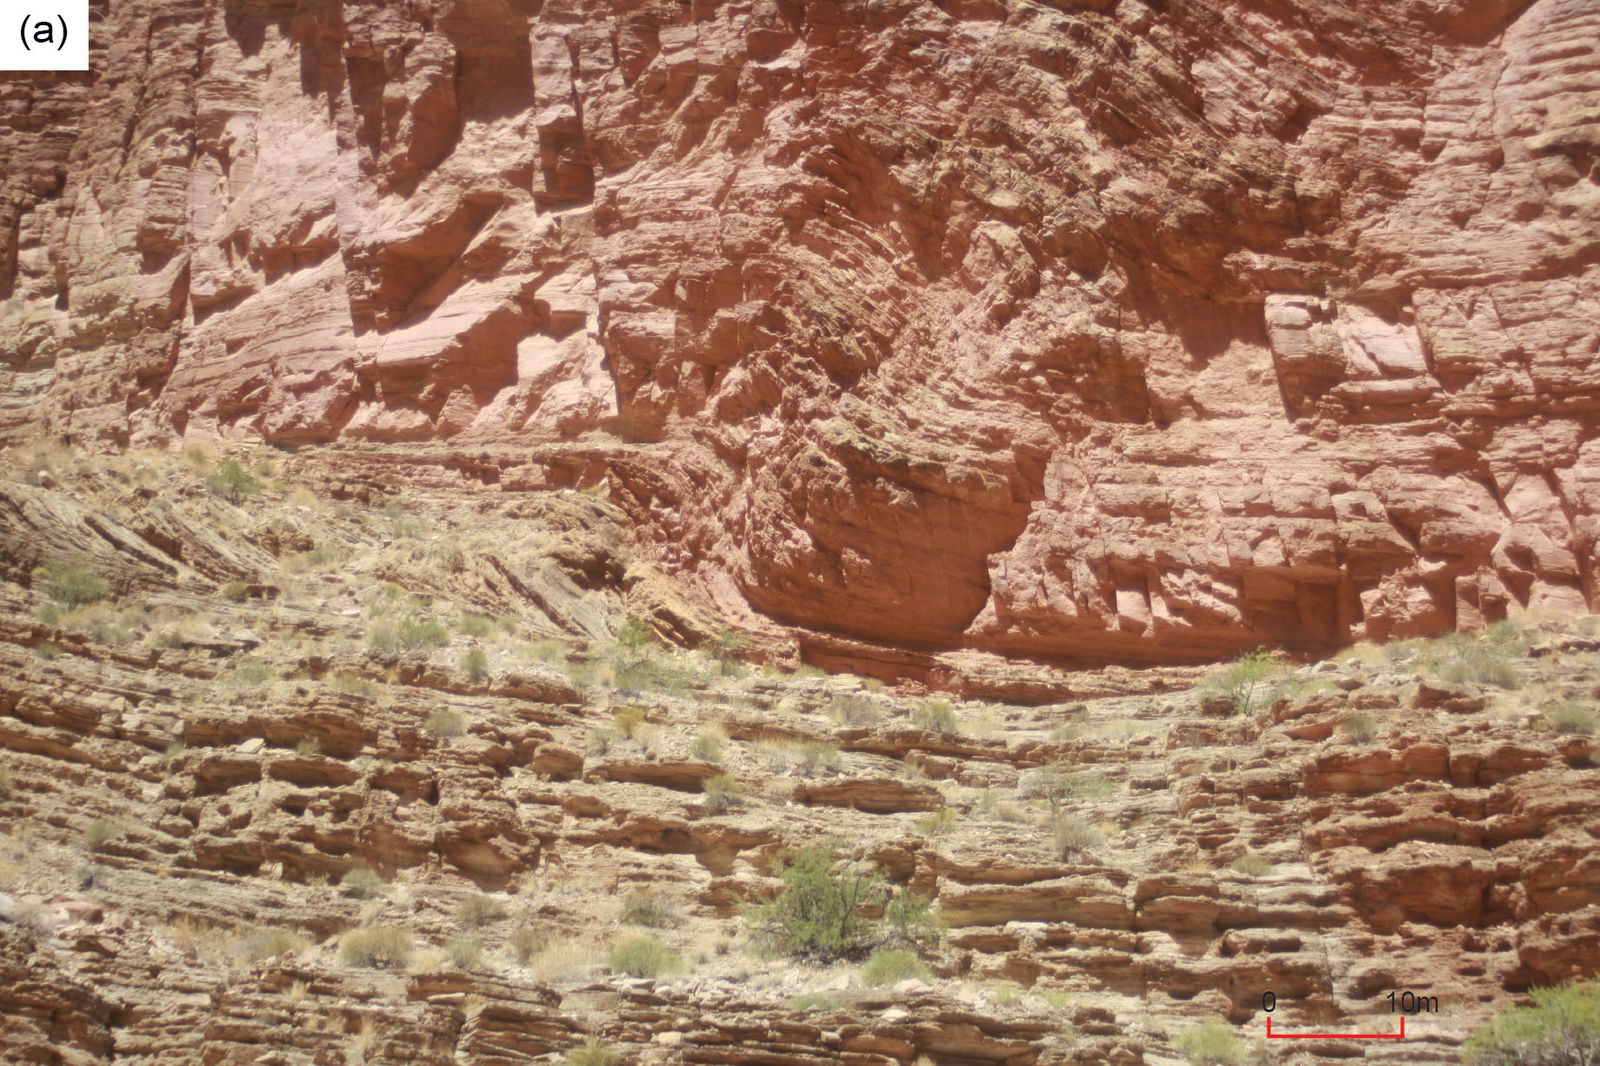
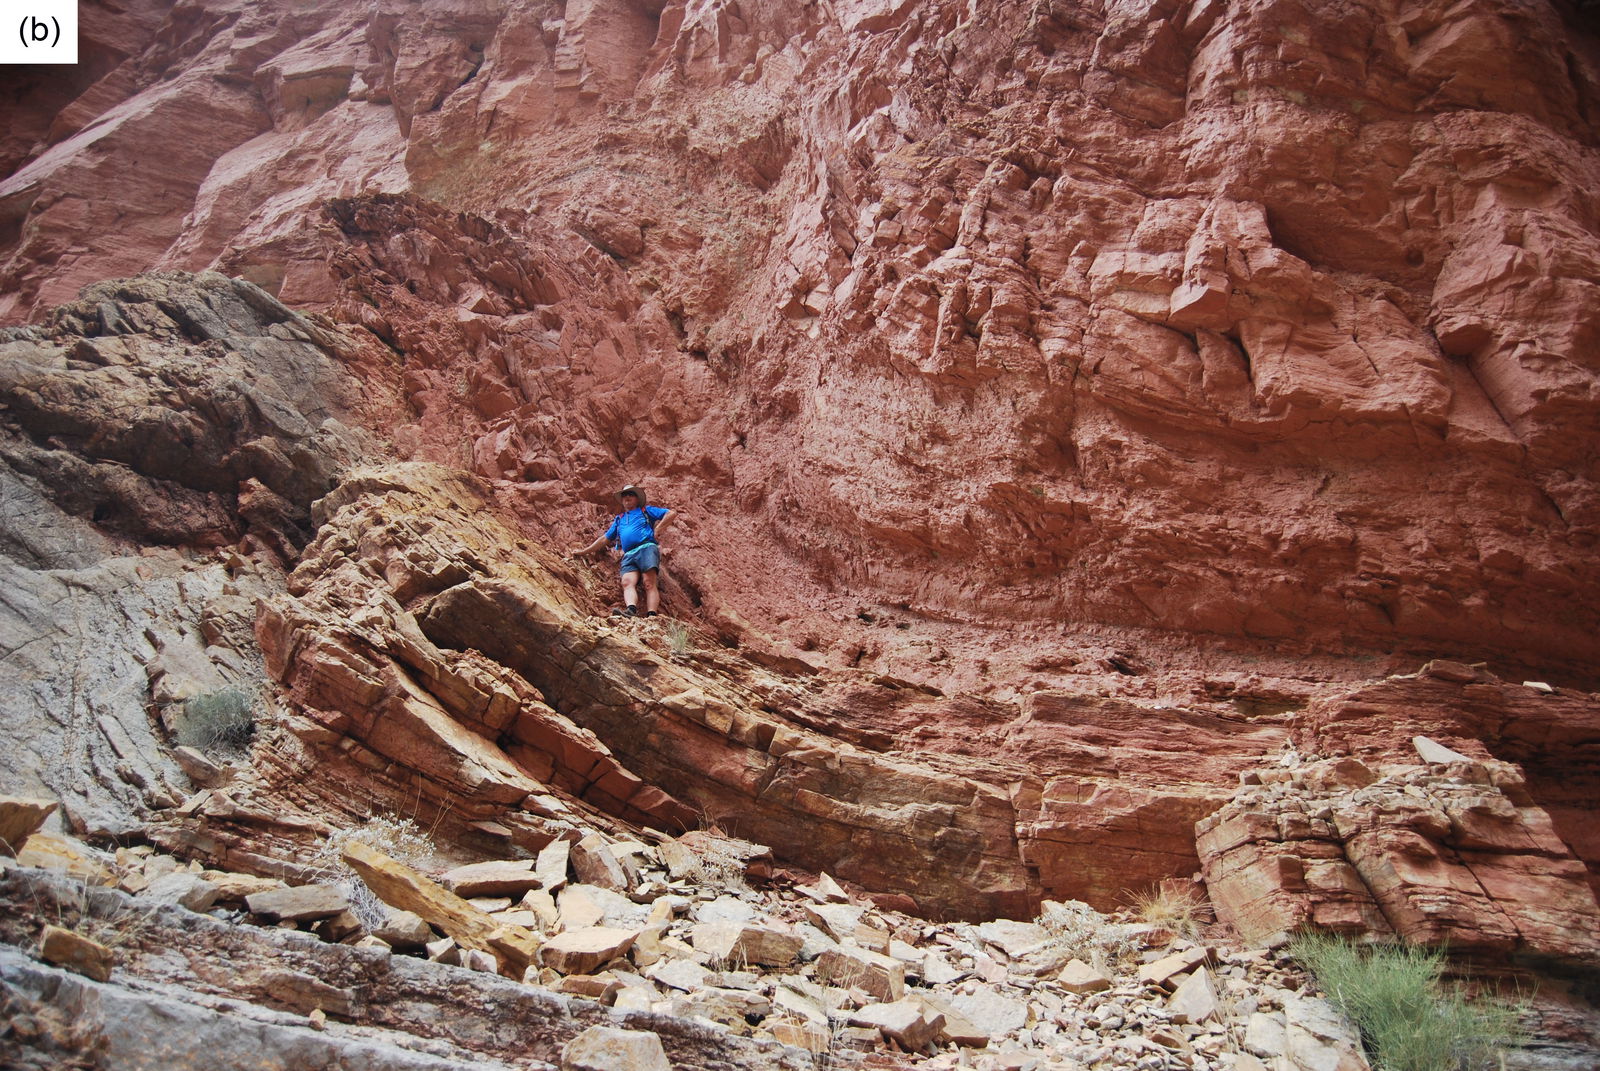
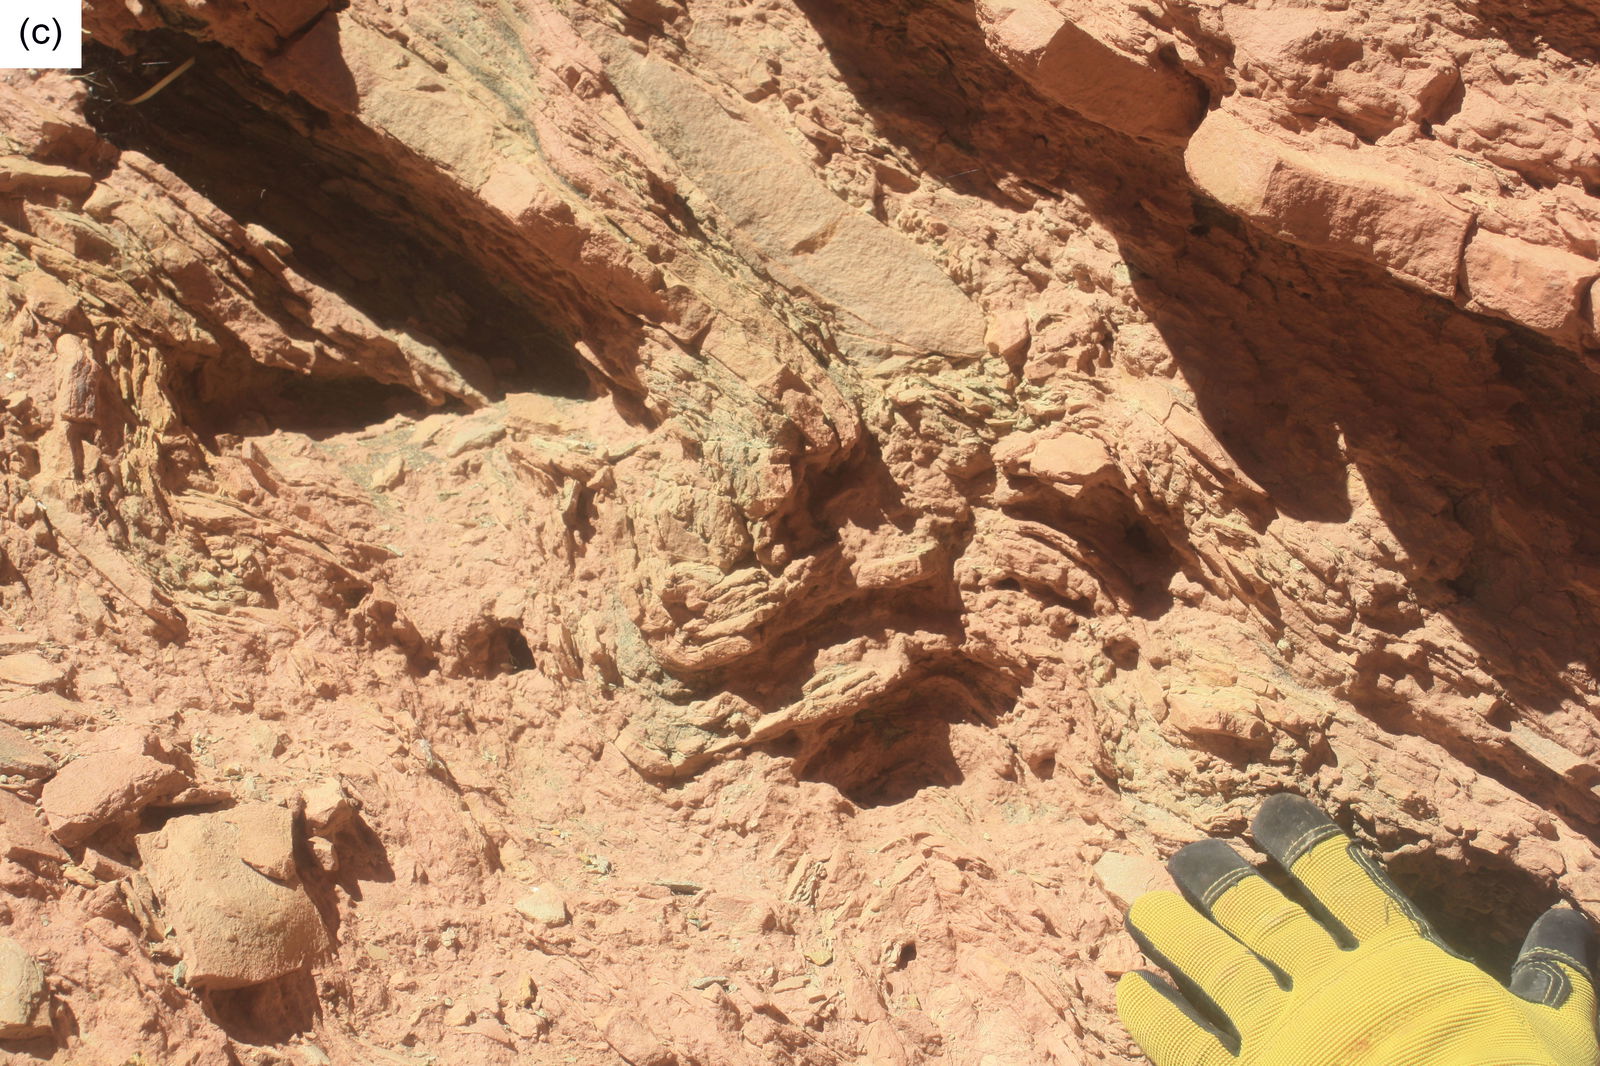
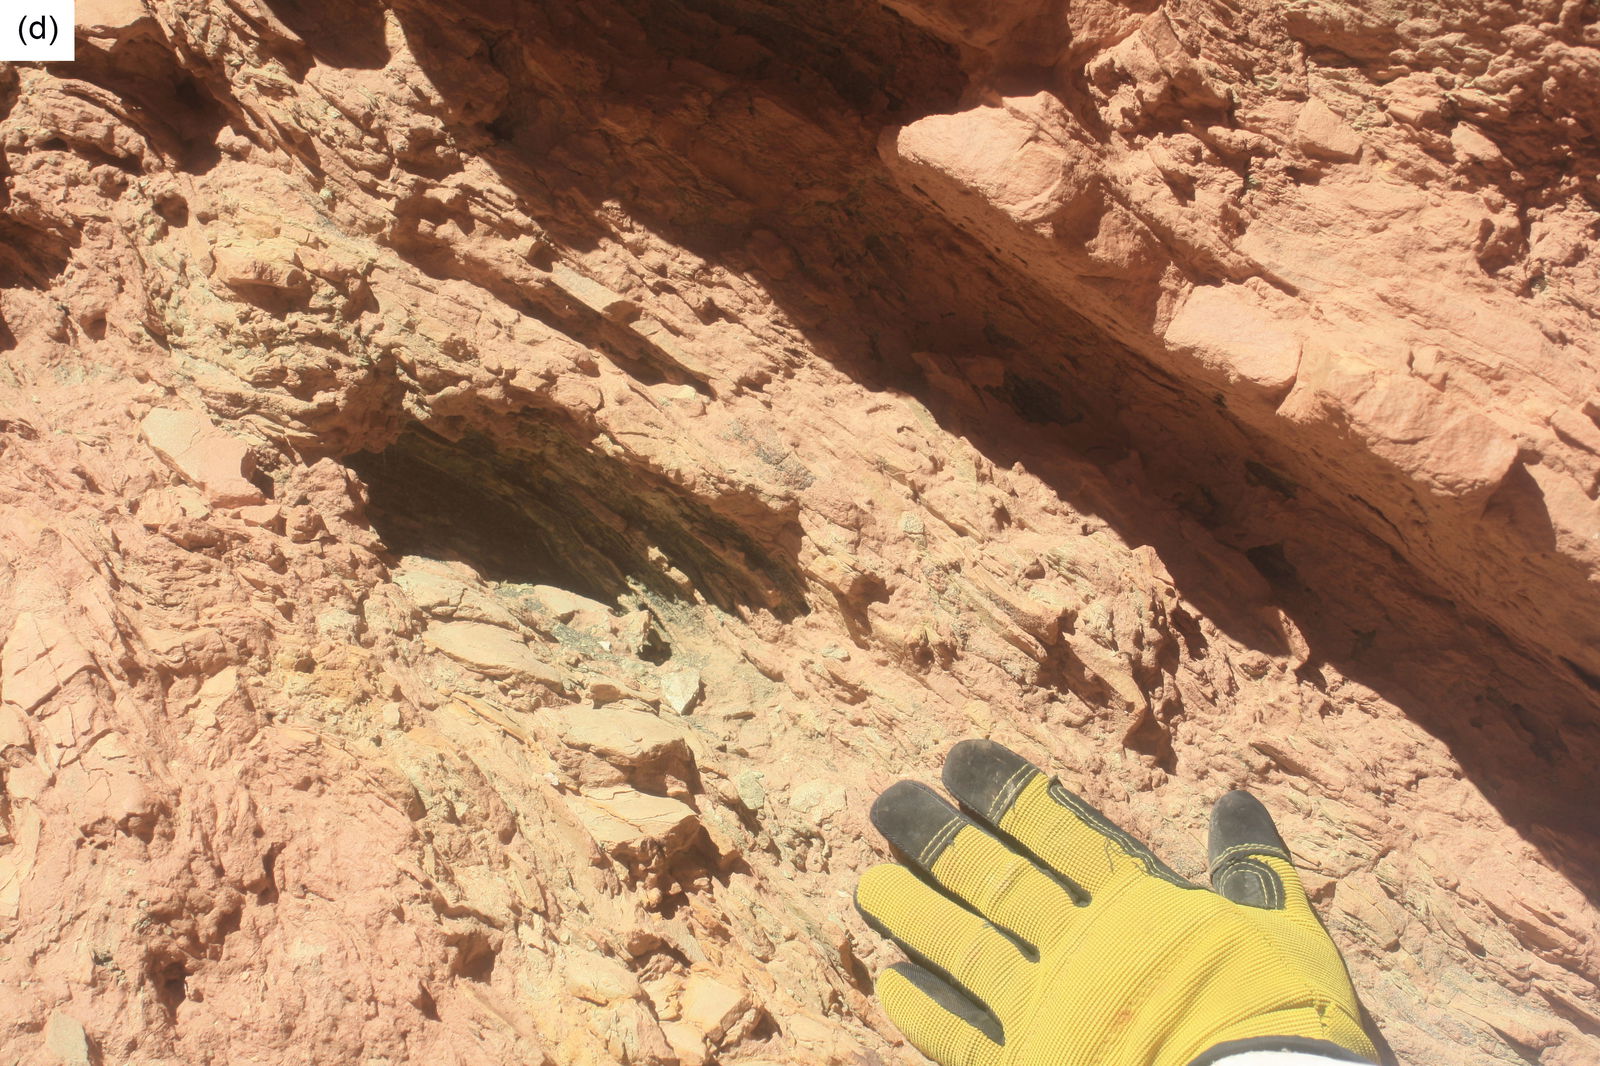
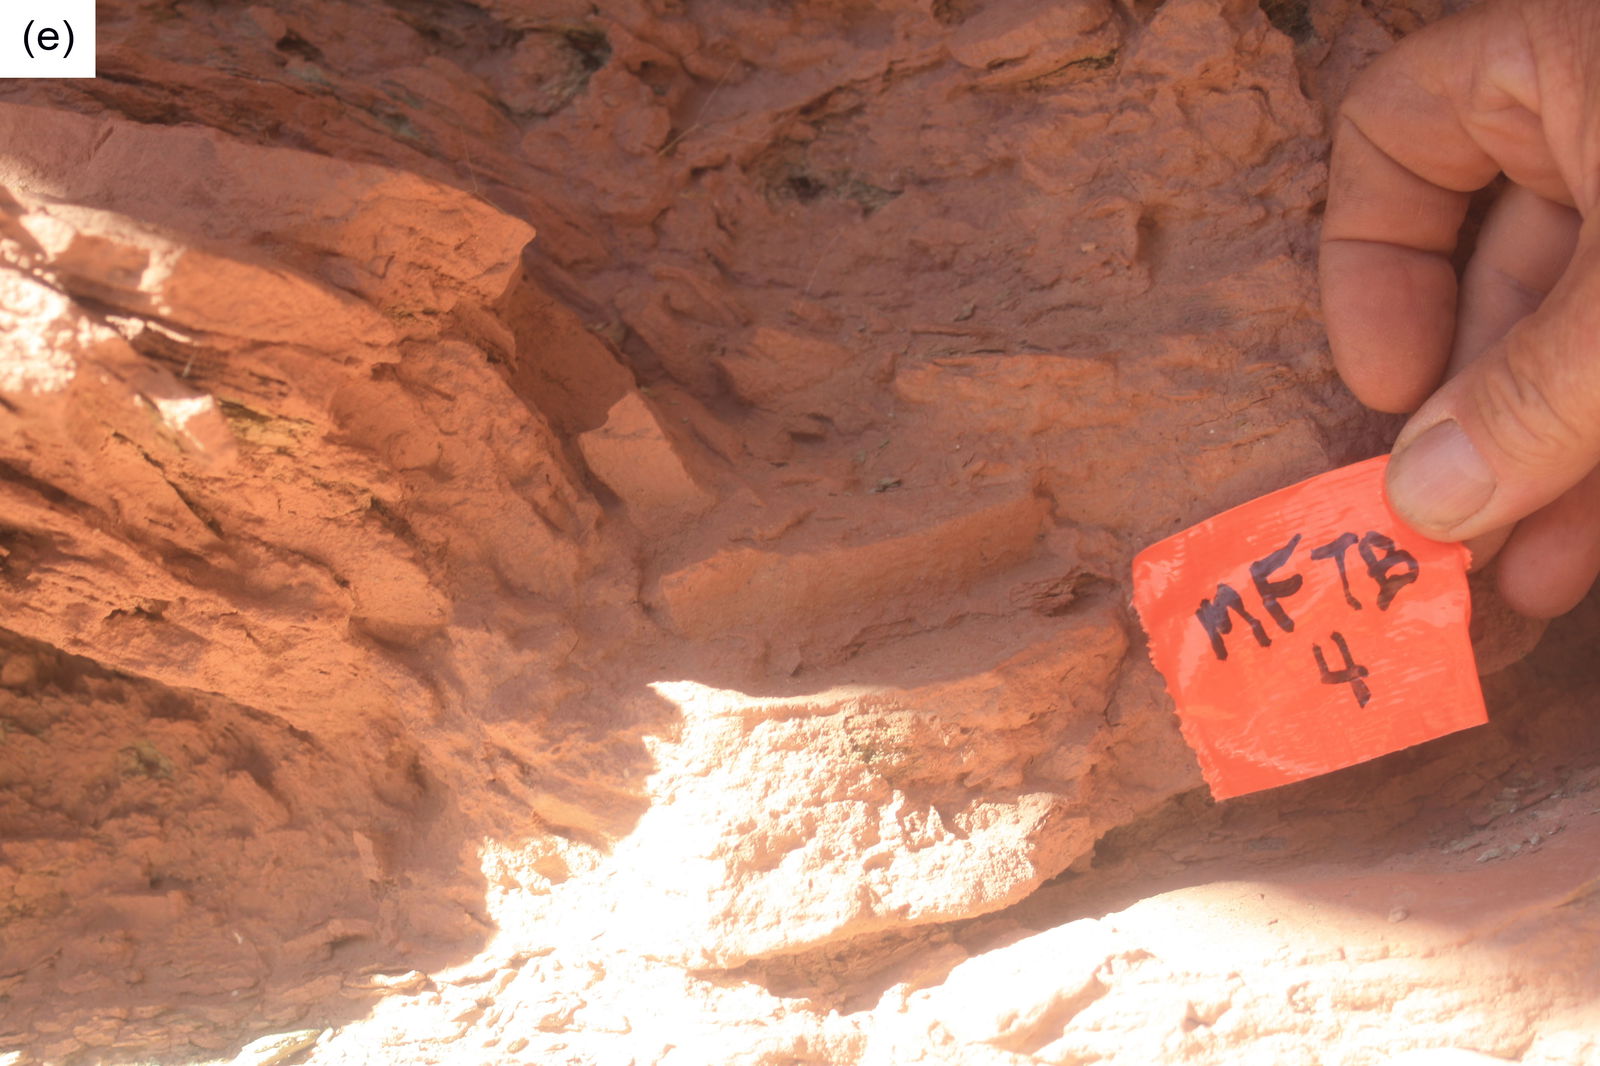
Fig. 49. The Matkatamiba fold (a) A general view of the fold within the Muav Formation looking up from the river. (b) An enlarged general view of the fold looking up from the river. The boundary between the Gateway Canyon Member and overlying Havasu Member is sharp due to the marked color change. The man standing on the hinge zone providing the scale is 1.8 m tall. (c) A close-up view of limestone laminae within the Havasu Member just above the boundary near the hinge zone of the fold near the location of sample MFTB-05 (see fig. 22). The hand provides the scale. (d) An adjoining close-up view of “crumpling” of limestone laminae within the Havasu Member just above the boundary near the hinge zone of the fold near the location of sample MFTB-05 (see fig. 22), showing the jointing. The hand provides the scale. (e) A close-up view of a very small monoclinal fold within limestone laminae of the Havasu Member just above the boundary within the hinge zone of the fold at the location of sample MFTB-04 (see fig. 22). The hand provides the scale.
Notice also in fig. 49c–e that the limestone laminae at the base of the Havasu Member vary in competency and thus hardness, likely due to variations in the mineralogy of their clasts and cement. Indeed, such variations have already been noted in closely adjoining samples, such as the calcite contents in samples MFTB-04 and -05 (table 2 and fig. 22). However, it can also be observed that such variations have affected the spacing of the joints. That they are joints is unambiguous because their character and spacing is the same in these small folds as in the same laminae distant from these small folds, as well as in the adjacent unfolded laminae. Once again, if these were instead fractures due to the deformation that produced these small folds, then their character and spacing would be different within the folds to the adjacent distant areas.
So, do any of these field observations preclude the Matkatamiba fold being due to soft-sediment deformation before lithification of the Muav Formation, rather than due to ductile and/or brittle deformation after its lithification? The short answer is definitely not, as demonstrated by experiments replicating soft-sediment deformation. Nabavi and Fossen (2021) have reviewed the history of such experiments, primarily undertaken in squeeze boxes with layers of dampened sand and/or clay, glass sides to the box and a crank handle for moving one end inwards towards the other fixed end so that the compressional folding of the dampened sediment layers can be simulated. Some excellent relevant examples are the simulation experiments of Rettger (1935), Handin et al. (1976), Friedman et al. (1976), Weinberg (1979), and Friedman, Hugman, and Handin (1980). These and other experiments involved confining pressures, and yet the dampened sand and/or clay layers when compressionally folded would appear to have faithfully simulated soft-sediment deformation to produce folds similar and identical to those observed and classified as folding due to soft-sediment deformation in exposed outcrops of now lithified sedimentary layers elsewhere (for example, Waldron and Gagnon 2011, and Alsop et al. 2019). Even the folding of these layered limestone beds and laminae of the Muav Formation have been simulated in these soft-sediment deformation experiments (fig. 10), along with accompanying minor fractures and joints, and even the minor bedding plane slippage between laminae and the small folding of laminae observed in the Matkatamiba fold.
Waldron and Gagnon (2011) defined soft-sediment deformation, following Maltman (1984), as any deformation, other than vertical compaction, of a sediment or sedimentary rock that is achieved by rearrangement of the original sedimentary particles, without internal deformation of those particles or of any interstitial cement. They added that such soft-sediment deformation occurs primarily by the mechanism of grain-boundary sliding in the unlithified sediment. In contrast, Borg et al. (1960) conducted a quantitative study of experimental deformation of sand grains washed from the St. Peter Sandstone of Illinois by applying a uniform confining pressure to simulate overburden pressure and differential load to simulate tectonic pressures. They found that purely cataclastic brittle deformation occurred resulting in fracturing of the sand grains. The fracture pattern was random under uniform deformation pressure, whereas the fracture-orientation patterns reflected the symmetry of the deformation under differential loading conditions. And most importantly, the apparent elongation and optic-axis orientations in the deformed samples were much the same as those in the undeformed sands. There was also no evidence that the experimental deformation had produced any deformation lamellae or that the overall occurrence of grains with undulose extinction had been changed. They found uniform loading did not reorient the fabric of the sands, whereas the differential loading (simulating tectonic deformation) resulted in preferred orientation of fractures, the optic axis, and apparent grain elongations, all of which reflected the orientations of the principal applied stresses. Furthermore, all these same experimental observations and principles also apply similarly to limestones, since they are simply composed of finer grains, which in the case of the Muav Formation are mud, silt, and fine sand sized.
In conclusion, all the features observed in the outcropping Muav Formation limestone beds deformed in the Matkatamiba fold, and described above (fig 49), are identical to those recognized and classified as due to soft-sediment deformation, both in the simulation experiments and in outcrops in other geological settings. The minor fracturing and jointing within the interlayered limestone beds and laminae, and the “plastic” folding of the thin laminae due to minor bedding plane slippage in the hinge zone, of the Matkatamiba fold have all been replicated in soft-sediment deformation experiments and observed in other outcrops elsewhere. Thus, these observed features do not necessarily support the claims of Huntoon (2003), Hill and Moshier (2009) and Tapp and Wolgemuth (2016) that the related Carbon Canyon fold, and the other folds produced during the Laramide orogeny, including this Matkatamiba fold, were produced by ductile deformation ~450 million years after deposition, lithification, and deep burial of the Muav Formation beds. Rather, field evidence is still compatible with the Matkatamiba fold having been produced by soft-sediment deformation of these Muav Formation beds very soon after deposition and deep burial, and all before final lithification. However, since grain-boundary sliding is regarded as the essential process in soft-sediment deformation and the results of that process, and features such as undulose extinction and deformation lamellae in quartz grains regarded as due to ductile deformation can only observed under the microscope, the microscopic evidence is thus crucial to definitively determining the timing of, and the conditions under which, the Muav Formation beds were deformed to produce the Matkatamiba fold.
The Microscopic Evidence
As reported above, the critical petrographic microscope observations are that the calcite cement and the original detrital calcite, quartz and K-feldspar grains and muscovite flakes are in the same condition in all the samples, whether from the hinge or limb zone of the fold, or from those distant to the fold (figs. 24–36). The original rock fabrics are still evident, with the detrital quartz and K-feldspar grains still sub-angular to sub-rounded, varying in size from mud and tiny silt to very fine sand in generally poorly-sorted textures with tiny detrital silt-sized calcite grains and occasional small glauconite grains and pellets, fossil shell fragments, and even detrital plagioclase grains. And both the distal and fold samples have almost no porosity, and thus no porosity differences between distal and fold samples, and fold hinge and limb zone samples. Additionally, the original detrital muscovite flakes are still wedged between calcite cement grains/crystals and are occasionally bent around the detrital quartz and K-feldspar grains sometimes with frayed or split ends, often parallel to the bedding and laminations and showing no evidence of any metamorphic changes or any shearing between or disruption of their internal sheets. Also, the occasional original glauconite pellets are still present in their detrital condition, as are all the fossilized shell fragments. Even the occurrences of fractures and veins are the same, irrespective of samples being from the limb and hinge zones of the Matkatamiba fold or distal to the fold.
Furthermore, even though the quantities of silicate and carbonate clasts and calcite cement vary between samples, as well as the occurrences of subsequent dolomite and calcite recrystallization and /or alteration, there is no consistent pattern that would indicate any noticeable differences between distal samples and samples from the hinge and limb zones of the Matkatamiba fold. Indeed, if ductile deformation had occurred in the fold, it would be expected that the recrystallization would have occurred more consistently through the fold samples, especially in the hinge zone, to repair the expected disruption of the calcite cement. So, the lack of a consistent pattern of recrystallization is instead consistent with it occurring after the folding by soft-sediment deformation, and after the cementation and lithification.
Where the detrital quartz grains are clumped together, some or many of them meet at triple points, some of the grains also having internal “ghost” outlines of faint iron oxides that suggest the original detrital grains were overgrown by silica in optical continuity to cement adjoining quartz and sometimes K-feldspar grains together. Whereas these observations indicate post-depositional silica cementing because the overall cement in these limestones is predominantly calcite, it is more likely that the silica cementing-together of adjoining quartz grains occurred in the source rocks prior to their erosion. Again, there are no differences in these features in the samples, whether distal or from the hinge and limb zones of the Matkatamiba fold.
Additionally, there are no deformation lamellae or deformation kink bands in the quartz grains as examined under the petrological microscope and generally no signs of significant undulose extinction under crossed polars (figs. 25–27). Also, there is no obvious evidence of any rotation of grains or grain-boundary sliding (figs. 24–30). All such features would have been evidence for ductile deformation as demonstrated in experiments (Borg et al. 1960, Carter, Christie, and Griggs 1964, Christie, Griggs, and Carter 1964, Groshong 1988, Vernon 2018), so their complete absence is significant in ruling out ductile deformation. However, even though the quartz grains display uniform extinction and generally show no signs of undulose extinction under crossed polars, there are a few quartz grains where there is the trivial appearance of slightly undulose extinction (fig. 27). These observations are also contrary to the outcomes of experiments on ductile deformation of quartz grains and microscope observations of quartz grains in ductile deformed rocks (Carter, Christie, and Griggs 1964, Groshong 1988, Vernon 2018, Wojtal, Blenkinsop, and Tikoff 2022).
Those few quartz grains in the Muav Formation samples in this study, equally from the limb and hinge zones of the Matkatamiba fold, with observed slightly undulose extinction (fig. 27g–j, s, u) can be easily explained. Either they could be an artifact of the original detrital quartz grains retaining unchanged the slight undulose extinction they had in their source rocks, or more likely, they acquired the slight undulose extinction during compaction. Borg and Maxwell (1956) and Borg et al. (1960) found that quartz grains in deformed sands and the undeformed St. Peter Sandstone, respectively, which had only experienced previous compaction exhibited a preponderance of grains with no undulatory extinction and only a few displaying various intensities of undulose extinction. On the other hand, Maxwell (1960) who did compaction experiments on sand and sandstone samples did not report any resulting undulose extinction. However, grain-to-grain compaction is known to cause undulose extinction due to grain rotation and contact point pressures during compaction (Adams, McKenzie, and Guildford 1984; Scholle 1979; Ulmer-Scholle et al. 2015), these processes being reported in experiments by Chester et al. (2004, 2007), Chuhan et al. (2002), de Boer, Nactegaal, and Duyvis (1977), Elias and Hajash (1992), Maxwell (1960), Miyakawa and Kawabe (2014) and Wolf and Chilingarian (1975), and are noted by Ulmer-Scholle et al. (2015).
Of major significance is the evidence of soft-sediment deformation in sample MFML-4. In fig. 23n can be seen “injectites” where the sedimentary layering has been disturbed and the sediment in some thin layers injected or squeezed through the overlying thin layers. This could only have occurred while these sediment layers were still soft, before their cementation and lithification. Sample MFML-4 is from the hinge zone of the Matkatamiba fold (fig. 22), where this disturbance of the sedimentary layering could have occurred during their deformation in the fold. Thus, these “injectites” are evidence consistent with the folding being due to soft-sediment deformation of the Muav Formation in the Matkatamiba fold before its cementation and lithification.
These petrographic microscope observations are also emphatically substantiated by the SEM observations. The SEM images from eight samples show no evidence of any effects, such as grain-boundary sliding after cementation, lithification and the patchy recrystallization, that would be expected if ductile deformation was responsible for producing the Matkatamiba fold. The samples in the hinges of the fold are no different from the samples both from its limb zones and also from distal sources. Instead, even the scattered muscovite flakes are still in their detrital condition in all samples, with some having been bent or their “pages” split due to compactional loading, and no hint of any metamorphic changes due to the heat and pressure of deep burial. In many samples, the micrite (mud-sized calcite) grains and the calcite cement are visible, though often some patchy recrystallization has occurred subsequent to cementation, mostly of calcite but also some very localized dolomite. It is clearly apparent that the folding process did not disrupt the fabric of the detrital grains and flakes, or either the calcite cement or the subsequent recrystallization of the micrite and calcite cement. Thus, cementation and recrystallization must have occurred after the folding, so the folding occurred before cementation while these sediments were still soft and damp, which would have been soon after their deposition.
Thus, the effects and outcome of the lithification of the deposited silicate and carbonate clasts in these layers under the overlying overburden pressure and slightly elevated burial temperature are uniform throughout the resultant Muav Formation. In other words, the folding must have occurred before cementation, lithification and subsequent only patchy recrystallization of the limestone beds, and therefore the Matkatamiba fold must have been produced by soft-sediment deformation.
The Dating of Muav Formation Deposition and the Laramide Orogeny
So how can these macroscopic and microscopic observations be reconciled with the conventional published accounts of the Laramide orogeny and monocline folding (DeCelles and Coogan 2006; DeCelles, Lawton, and Mitra 1995; Huntoon 1993, 2003; Ismat and Mitra 2005; Karlstrom and Timmons 2012; Matthews 1978; Reches 1978a; Sanz et al. 2008; Tindall and Davis 1999)? Put simply, it is not a question of the tectonic processes involving subduction and possible underplating of the Farallon plate being responsible for the uplift of the Colorado Plateau, which are not in dispute (Austin et al. 1994; Dickinson and Snyder 1978; Huntoon 2003; Karlstrom and Timmons 2012), but rather a huge disagreement with respect to timing. Since the macroscopic and microscopic evidence indicates that the monoclinal folding during plateau uplift was accompanied by soft-sediment deformation of the Muav Formation limestone beds in the Matkatamiba fold within the Matkatamiba Syncline and not by the ductile deformation claimed by Huntoon (2003), Hill and Moshier (2009), and Tapp and Wolgemuth (2016), this implies that the uplift and folding must have occurred very soon after deposition of the whole regional strata sequence before cementation and lithification of those strata. Yet the conventional view is that there were ~450 million years between deposition of the Muav Formation at 499–502 ma (Karlstrom et al. 2018, 2020; Snelling 2022a) and the Laramide orogeny at ~40–70 ma (Huntoon 2003; Karlstrom and Timmons 2012).
Thus, this huge discrepancy between the claimed vast ages for the deposition of the Muav Formation and the subsequent Laramide folding, and the macroscopic and microscopic evidence of rapid deposition of the whole strata sequence, followed by soft-sediment deformation during the folding event, all prior to cementation and lithification of the limestone beds needs to be reconciled. Snelling (2022a) has already resolved this issue with respect to the dating of the Muav Formation at 499–502 ma. The same resolution applies to the dating of the Laramide orogeny. Vardiman, Snelling, and Chaffin (2005) reported the technical details of six lines of evidence, including experimental confirmation, that during a past global catastrophe nuclear decay rates were likely grossly accelerated by potentially six orders of magnitude, such that ~600 or more million years’ worth of nuclear decay as measured today occurred within about a year, which they identified as the year-long biblical Flood cataclysm recorded in Genesis 6–9. On that basis, the deposition of the Muav Formation dates to only the first few weeks of the Flood year, only ~4,350 years ago. Critics have pointed to the enormous quantities of heat that apparently would be released by such accelerated nuclear decay (Wiens 2016), yet Vardiman, Snelling, and Chaffin (2005) had already anticipated this criticism and provided plausible possible explanations, including the experimental fact that the radiohalos (which only form below 150˚C) would have been annealed if such an enormous heat release had occurred (Laney and Laughlin 1981; Snelling 2005a).
However, Snelling (2021a, 2022a) went further to demonstrate the problems with the U-Pb radioisotope dating of the Tapeats Sandstone and with that dating method itself. Specifically, Karlstrom et al. (2018) obtained U-Pb ages for detrital zircons within the Tapeats Sandstone as “young” as only 407.2 million years old, and then did not explain how the supposedly 507–508 million years old Tapeats Sandstone can have included within it so many detrital zircons with U-Pb ages less than its supposed depositional age. Nor did they explain from where those “younger” detrital zircons within the Tapeats Sandstone originated. Indeed, how could even the 507–508 ma detrital zircons be incorporated in the Tapeats Sandstone if the underlying rocks that were eroded to provide the sand grains, including the zircon grains, are older than 507–508 ma? That question alone raises serious doubts as to the applicability and reliability of this technique for supposedly quantifying the apparent depositional ages of these sedimentary rock units. Yet not only is their methodology questionable, so must be the U-Pb dating method they used if it produced such illogical results. Snelling (2000, 2009, 2022b) has already provided details of numerous problems with the U-Pb dating method that are well-documented in the scientific literature. Furthermore, Snelling (2017a) reviewed all the determinations of the U-Pb decay rates (half-lives) and demonstrated that these crucial parameters are not yet precisely known, while Snelling (2017b, 2018, 2019) highlighted in detail the problems of common Pb, U and Pb mobility, and mass fractionation respectively that plague all efforts to obtain accurate U-Pb age determinations.
Thus, once the subjectively interpreted U-Pb dates for the deposition of the Tapeats Sandstone are demonstrated to be invalid, there is no valid scientific objection to assigning the rapid deposition of the overlying Muav Formation also to the first few weeks of the Flood year, only ~4,350 years ago. Similarly, the dating of the Laramide orogeny and the accompanying monocline folding at ~40–70 ma relies on the same and various other related radioisotope dating methods that are plagued by identical problems (Snelling 2000, 2009, 2022b). However, debate continues as to when the Laramide orogeny and monocline folding is envisaged to have occurred relative to the Flood year. Whitmore and Garner (2008) maintain it would have been at the end of the Flood year and continued into the early post-Flood years as the catastrophic plate tectonics of the Flood year reached isostatic equilibrium, causing mountains to rise rapidly all over the globe. Thus, the sinking of the new ocean floors (Austin et al. 1994; Baumgardner 2003; Snelling 2009, 2022b) and the uplift and exposure of these mountains (potentially described in Psalm 104:8; Barrick 2018) would have resulted in the draining of the last marine waters off the North American continent, as happened at the end of the Cretaceous. Others, like Clarey (2020) disagree, and place the Laramide orogeny within the year of the Flood, with the Cretaceous representing the Flood’s last high-water stage and the draining of the waters off the North American continent occurring in the latter half of the Flood year. But regardless, the Laramide orogeny occurred relatively recently, about 4,350 years ago.
The Timing of the Folding—Flood Deposition and Tectonics
Austin (1994) provided a detailed comprehensive description and account of the geological development of Grand Canyon strata in the context of the global Genesis Flood cataclysm and the canyon’s erosion in the Flood’s aftermath. In particular, he described the Muav Formation as being deposited rapidly by the Flood waters advancing eastwards onto the western edge of the North American portion of the pre-Flood supercontinent after the initiation of the Flood event with the breaking up of the fountains of the great deep (Genesis 7:11) and the triggering of catastrophic plate tectonics (Austin et al. 1994; Baumgardner 2003; Snelling 2009, 2022b). However, before the Muav Formation was deposited there may have been a period (possibly days or more) in which there was a significant amount of continental-scale erosion to bevel the Precambrian (pre-Flood) land surface to produce the Great Unconformity. In the Grand Canyon region this involved intensive catastrophic erosion to remove several thousand meters of Grand Canyon Supergroup strata (which appear to only have survived in several down-faulted blocks) and then to bevel the underlying metamorphic schists and granite plutons. Then after this period of destructive erosion, and subsequent to the localized deposition of the Sixtymile Formation, the Tapeats Sandstone represents the first widespread (continental-scale) deposit of the Tonto Group, which also included the concurrent deposition of the Muav Formation. Snelling (2022a) provides more details of, and evidence for, the rapid deposition of the Muav Formation in the first few weeks of the global Flood cataclysm.
Austin (1994) also diagrammatically envisaged a fining upwards model for the time transgressive rapid deposition of the Tonto Group strata as the powerful westward back underflow of the advancing Flood waters at a water flow speed of >2 m/sec intensely scoured and catastrophically eroded and beveled all pre-Flood rocks to produce the Great Unconformity before sequentially depositing their load of sediments as horizontally segregated facies in the vertically stacked Tonto Group strata during the first weeks of the Flood year. Then followed the progressive rapid deposition of the overlying sedimentary strata sequence in the subsequent months as the Flood waters rose violently to sweep and deposit sediments rapidly in these layers, many of which can also be traced across the North American continent (Clarey 2020; Sloss 1963).
Baumgardner (2013, 2018a, b) and Baumgardner and Navarro (2023) have made considerable progress with numerical simulations of the catastrophic erosion of bedrock via cavitation to produce these sediments that were rapidly deposited on the continental plates as shallow waters moved rapidly around the surface of the rotating globe. Their modeling posits that the dominant means for sediment transport during the Flood was by rapidly flowing turbulent water, and that water motion was driven by large-amplitude tsunamis that were generated along subduction zone segments as the subducting plate and overriding plate, in a cyclic manner, locked and then suddenly released and slipped rapidly past one another. Baumgardner’s (2018a, b) calculations show that with plausible parameter choices average erosion and sedimentation rates on the order of 9 m/day (0.38 m/hr) occurred with tsunami-driven pulses of turbulent water that transported the generated sediments vast distances across the continental plate surfaces, sufficient to deposit the Muav Formation within 3–10 days and most of the Paleozoic-Mesozoic strata during the initial 150-day rising and prevailing waters phase of the Flood (Genesis 7:18–24), thereby accounting for nearly 70% of the Phanerozoic sediment layers that blanket the earth’s continental surfaces today (Clarey and Werner 2023).
In the catastrophic plate tectonics model for the cataclysmic Flood event (Austin et al. 1994; Baumgardner 2003; Snelling 2009, 2022b), the plates moved the same as in conventional plate tectonics, but at rapid rates. In the case of the Farallon plate, as its subduction under the western edge of the North American flattened, possibly because it included subduction of a divergent boundary (Clarey 2020), it thickened the continental crust of western North America. Consequently, rapid isostatic equilibration began, resulting in the Laramide orogeny and the rise of the Colorado Plateau and the monocline folding in the Grand Canyon region and elsewhere in the Colorado Plateau.
The Muav Formation limestone beds were deposited rapidly in the first few weeks of the year of the biblical global Flood cataclysm only ~4,350 years ago (Snelling 2022a). In the subsequent months the overlying sedimentary strata were progressively deposited rapidly, their accumulating overburden pressures of ~0.3–0.4 kbar (~4,300–5,900 psi) compacting and dewatering the Muav Formation beds at a possible maximum burial depth of ~3,300–4,500 m (~10,825–14,750 ft) where the temperatures rose to ~110–130°C. Then later in the Flood year, or as the Flood year ended, the Laramide uplift of the Colorado Plateau occurred, helping to drain off the Flood waters from the North American continent, eroding away almost all the Mesozoic strata off the plateau in the Grand Canyon region. Thus, in the Grand Canyon region the Laramide uplift caused bending of the whole Paleozoic strata sequence in the East Kaibab and Supai Monoclines and the Matkatamiba Syncline as the reactivated Precambrian Butte Fault and other faults moved the underlying Precambrian basement, producing the Carbon Canyon and Monument folds in the Tapeats Sandstone (Snelling 2023a, b), the Whitmore Helipad fold in the Bright Angel Formation (Snelling 2024), and the Matkatamiba fold in the Muav Formation. The Muav Formation limestone beds had for much of the Flood year remained relatively damp and soft, even as they were increasingly compacted by the rapidly accumulating overlying strata. But because the compaction was so rapid very few microscopic effects of it are observed in the limestone. Then when the Laramide folding occurred, the Muav Formation beds were bent in the Matkatamiba fold by soft-sediment deformation, consistent with both the observed macroscopic and microscopic features in the limestone (in samples from hinge and limb zones of the fold, and from distant to it). Only subsequently did the silicate sand and silt and the lime silt and mud in the Muav Formation beds become cemented and lithified (without drying and exposure being necessary), again consistent with both the observed macroscopic and microscopic features in the limestone.
Summary and Conclusions
The limestone beds of the Cambrian Muav Formation are bent in the Matkatamiba fold where they have been monoclinally folded in the Matkatamiba Syncline exposed in the Colorado River corridor of central Grand Canyon. This occurred during the Laramide orogeny at ~40–70 ma when the Colorado Plateau including in the Grand Canyon region was uplifted. However, the Muav Formation had been deposited at 499–502 ma, so after ~450 million years it should have been fully cemented and lithified. Thus, when its limestone beds were bent in the Matkatamiba fold, they should have suffered ductile deformation via bedding plane or flexural slip and grain-boundary sliding. And in the hinge zones particularly the lithified limestone should have fractured. However, during field inspection of this fold it is evident that there is no significant or more intense fracturing of the limestone in the hinge zones, compared to along the limbs of the fold. Thus, the limestone beds look as though they were bent smoothly, perhaps while they were still unlithified and soft. Yet such a conclusion is preposterous if there were ~450 million years between deposition and lithification of the Muav Formation, and then its subsequent deformation to form the Matkatamiba fold.
To date there had not been a detailed investigation of the Matkatamiba fold to examine the bent limestone beds, especially their microscopic features, to determine if their folding was due to ductile deformation (as conventionally claimed) or due to soft-sediment deformation. Thus 12 samples of the Muav Formation were collected from the Matkatamiba fold, from hinge zones and from along the limb zones, as well as three samples from several stratigraphic positions in the Muav Formation at a considerable distance of miles from the fold. This strategy was adopted so that the samples from the fold could be compared with the distal samples acting as a “control” to ascertain any differences between the folded and unfolded (“background”) limestone beds.
An initial study detailed all previous investigations of the Muav Formation. From petrographic examination of the 15 Muav Formation samples it was concluded that the fine-grained limestone layers consist of poorly-sorted, angular to sub-rounded quartz and K-feldspar grains, muscovite flakes, and even plagioclase and glauconite grains, and occasional brachiopod shell fragments, that are all still in their detrital condition, “floating” in a matrix of micrite (mud-silt sized calcite particles) all lithified by calcite cement. There are no indications of the detrital micrite and the calcite cement having been disturbed since lithification of the limestones. Nor are there any indications of any metamorphic changes to all these constituents or the rock fabric. Occasional scattered patches of the calcite matrix in some samples have been recrystallized, as well as there being minor dolomite and calcite alteration, all having clearly occurred subsequent to lithification of the limestone, and not due to any disruption by deformation or low-grade metamorphism. These observations, especially so many quartz and feldspar grains and muscovite flakes not usually documented in limestones, as well as the sedimentary structures and the body fossils and fossil traces preserved in the Muav Formation were all deemed consistent with its rapid deposition.
For this study, the macroscopic and microscopic features that should or could be present if the Muav Formation beds in the Matkatamiba fold had been bent via ductile deformation were described in detail. For example, at the macroscopic scale bedding plane slip or flexural slip should have produced slickensides on bedding plane surfaces, and there should be thickening of hinge zones in the fold and thinning of limb zones, as well as more fracturing in the hinge zones compared to the limbs. Field observations were made to test these expectations. At the microscopic scale there should minimally be evidence of grain-boundary sliding, rotation of grains, and fracturing of grains and the calcite cement, and within quartz grains there should be undulose extinction, deformation lamellae and even deformation kink bands. Both petrographic observations were made and scanning electron microscope (SEM) images obtained to ascertain whether these microscopic features are present in the limestone beds, especially also comparing the samples from the hinge and limb zones in the fold with the distal samples.
The field observations of the limestone beds in the Matkatamiba fold are inconsistent with ductile deformation. While trivial bedding plane or flexural slip likely occurred locally, as evidenced in a hinge zone by very small crumpling/folding in the Havasu Member just above the boundary with the underlying Gateway Canyon Member, no slickensides were found on any exposed bedding plane surfaces. There is no thickening of the limestone beds in the hinge zones or thinning in the limbs. The fractures present are either confined to within the laminae in both the limb and hinge zones or are widely spaced and extend considerable vertical distances differently in the two Muav Formation members. Thus, that fracturing does not display evidence of being due to brittle fracturing. Instead, the fractures are consistent with joint development from lateral shrinkage of the wet sediments during dewatering. All these and other features, such as the small folding of the limestone laminae in the lowermost Havasu Member in the hinge zone of the fold, have been replicated using damp soft sediment layers in experiments simulating compressional folding, which equates to soft-sediment deformation.
Furthermore, none of the microscopic features expected from ductile deformation were present in any of the samples, and the samples from the hinge and limb zones of the fold were essentially identical to one another and to the distal samples. There are no deformation lamellae or deformation kink bands in the quartz grains which rarely displayed even trivial undulose extinction, and there is no obvious evidence of any rotation of grains or grain-boundary sliding. The few quartz grains containing trivial undulose extinction are instead likely derived from the metamorphic source rocks rather than being a product of ductile deformation, and the occasional fractures in most samples are consistent with that trivial fracturing being due to compaction of the clastic silicate and carbonate grains under the confining overburden pressures. On the other hand, “injectites” in a hinge zone sample from the fold are consistent with deformation of the Muav Formation in the Matkatamiba fold when the sediments were still soft before cementation and lithification.
Additionally, the SEM images show no evidence of any effects, such as grain-boundary sliding after cementation, lithification and the patchy recrystallization, that would be expected if ductile deformation was responsible for producing the Matkatamiba fold. They also clearly demonstrate that the calcite cement binding the micrite and clastic silicate grains and flakes has not been disrupted since lithification. The samples in the hinges of the fold are no different from the samples both from its limb zones and also from distal sources. Instead, even the scattered muscovite flakes are still in their detrital condition in all samples, with some having been bent or their “pages” split due to compactional loading, and no hint of any metamorphic changes due to the heat and pressure of deep burial. It is thus clearly apparent that the folding process did not disrupt the fabric of the detrital grains and flakes, or either the calcite cement or the subsequent recrystallization of the micrite and calcite cement. The effects and outcome of the lithification of the deposited silicate and carbonate clasts in these layers under the overlying overburden pressure and slightly elevated burial temperature are uniform throughout the resultant Muav Formation. Thus, cementation and recrystallization must have occurred after the folding, so the folding occurred before cementation while these sediments were still soft and damp, which would have been soon after their deposition.
Therefore, both the macroscopic and microscopic evidence are conclusively consistent only with soft-sediment deformation before cementation and lithification. Thus, since the bending of the Muav Formation beds in the Matkatamiba fold must be due to soft-sediment deformation, the claimed ~450 million years between deposition of the limestone beds and the Laramide uplift responsible for the folding must be in error and are thus eliminated. Instead, the Muav Formation had to be folded while still relatively damp and soft, soon after deposition, and before complete cementation and lithification. The problems with the radioisotope dating methods and the U-Pb dates obtained for the underlying Tapeats Sandstone also rule out the vast claimed ages. This scenario can all be easily reconciled with rapid deposition of the Muav Formation during the first few days to weeks of the biblical global Flood cataclysm only ~4,350 years ago, and rapid deposition of up to ~3,300–4,500 m (~10,825–14,750 ft) of overlying sedimentary layers during the catastrophic plate tectonics of the Flood year. Then, near or at the end of Flood year, the Farallon plate underplated the western North American plate, causing isostatic re-equilibration which resulted in the Laramide uplift of the Colorado Plateau and monocline folding in the Grand Canyon region now exposed in the Matkatamiba fold. Because the Muav Formation beds were still relatively damp and soft after less than a year of rapid burial, they easily responded to soft-sediment deformation to form the smooth bending (without brittle fracturing) in the Matkatamiba fold before the beds were cemented and lithified to limestone (without drying and exposure being necessary). Altogether, nearly 500 million years of claimed geologic history are eliminated.
Portions of this ARJ have been adapted from Andrew A. Snelling, “The Carbon Canyon Fold, Eastern Grand Canyon, Arizona,” Answers Research Journal 16 (February 22, 2023): 1–124, https://answersresearchjournal.org/geology/carbon-canyon-fold-arizona/.
Acknowledgements
All samples were collected under the authority of National Park Service Scientific Research and Sampling Permit # GRCA-2017-SCI-0052 dated June 23, 2017, issued by the Grand Canyon National Park’s Research Office. The Alliance Defending Freedom (ADF) team led by then Senior Counsel Gary McCaleb is especially thanked for their legal work that led to a successful lawsuit against viewpoint discrimination in the permit application and granting process. Tom Vail, founder of Canyon Ministries who encouraged this research from its start, is also thanked for organizing with Terry Vallely, and assisted by their wives Paula and Kathy, respectively, the August 6–12, 2017, research raft trip down the Colorado River through Grand Canyon to collect the samples, facilitated by Grand Canyon National Park Special Use Permit #GRCA-3701 issued June 26, 2017. Special thanks go to Tom Vail and Dr. John H. Whitmore, Senior Professor of Geology at Cedarville University, Ohio for their invaluable field assistance, without which the samples would not have been collected, especially after I was injured early in the trip. Ray Strom of Calgary Rock and Materials Services, Inc. is thanked for the thin sections he prepared, and for the XRD and SEM analyses, as well as for the use of his research microscope for photography. Cedarville University is also thanked for the use of their geologic research microscope and Dr. John H. Whitmore for his advice, support, and encouragement. The helpful comments and edits from three kind reviewers were much appreciated. This research was fully funded by many generous donors to Answers in Genesis and has had the full support of the Answers in Genesis leadership team under Ken Ham. Our production assistant Laurel Hemmings is also thanked for her work in preparing this paper for publication. Nevertheless, I take full responsibility for the content of this paper.
References
Adams, A. E., W. S. MacKenzie, and C. Guildford. 1984. Atlas of Sedimentary Rocks under the Microscope. Essex, United Kingdom: Longman.
Allison, I., R. L. Barnett, and R. Kerrich. 1979. “Superplastic Flow and Changes in Crystal Chemistry in Feldspars.” Tectonophysics 53, nos. 1–2 (1 March): T41–46.
Alsop, G. I., Roberta Weinberger, S. Marco, and T. Levi. 2019. “Identifying Soft-Sediment Deformation in Rocks.” Journal of Structural Geology 125 (August): 248–255.
Altenberger, U., and S. Wilhelm. 2000. “Ductile Deformation of K-Feldspar in Eclogite Facies Shear Zones in the Bergen Arcs, Norway.” Tectonophysics 320, no. 2 (15 May): 107–121.
Anderson, John J., Peter D. Rowley, Robert J. Fleck, and A. E. m. Nairn. 1975. Cenozoic Geology of Southwestern High Plateaus of Utah. Boulder, Colorado: Geological Society of America, Special Paper 160.
Ashby, M. F., and R. A. Verall. 1973. “Diffusion-Accommodated Flow and Superplasticity.” Acta Metallurgica 21, no. 2 (February): 149–163.
Austin, Steven A. ed. 1994. Grand Canyon: Monument to Catastrophe. Santee, California: Institute for Creation Research.
Austin, Steven A., John R. Baumgardner, D. Russell Humphreys, Andrew A. Snelling, Larry Vardiman, and Kurt P. Wise. 1994. “Catastrophic Plate Tectonics: A Global Flood Model of Earth History.” In Proceedings of the Third International Conference on Creationism. Edited by Robert E. Walsh, 609–621. Pittsburgh, Pennsylvania: Creation Science Fellowship.
Aydin, Atilla, and Arvid M. Johnson. 1983. “Analysis of Faulting in Porous Sandstones.” Journal of Structural Geology 5, no. 1: 19–31.
Bailey, S. W., R. A. Bell, and C. J. Peng. 1958. “Plastic Deformation of Quartz in Nature.” Geological Society of America Bulletin 69, no. 11 (November 1): 1443–1466.
Barber, D. J. 1985. “Dislocations and Microstructures.” In Preferred Orientation in Deformed Metals and Rocks: An Introduction to Modern Texture Analysis. Edited by Hans-Rudolf Wenk, 149–182. London, United Kingdom: Academic Press.
Barber, D. J., and P. G. Meredith, eds. 1990. Deformation Processes in Minerals, Ceramics and Rocks. Boston, Massachusetts: Unwin Hyman.
Barrenechea, J. F., M. Rodas, and J. R. Mas. 1995. “Clay Mineral Variations Associated with Diagenesis and Low-Grade Metamorphism of Early Cretaceous Sediments in the Cameros Basin, Spain.” Clay Minerals 30, no. 2 (June): 119–133.
Barrick, William D. 2018. “Exegetical Analysis of Psalm 104:8 and Its Possible Implications for Interpreting the Geological Record.” In Proceedings of the Eighth International Conference on Creationism. Edited by John H. Whitmore, 95–102. Pittsburgh, Pennsylvania: Creation Science Fellowship.
Baumgardner, John R. 2003. “Catastrophic Plate Tectonics: The Physics Behind the Genesis Flood.” In Proceedings of the Fifth International Conference on Creationism. Edited by Robert L. Ivey, Jr., 113–126. Pittsburgh, Pennsylvania: Creation Science Fellowship.
Baumgardner, John. 2013. “Explaining the Continental Fossil-Bearing Sediment Record in Terms of the Genesis Flood: Insights from Numerical Modeling of Erosion, Sediment Transport, and Deposition Processes on a Global Scale.” In Proceedings of the Seventh International Conference on Creationism. Edited by Mark Horstemeyer. Pittsburgh, Pennsylvania: Creation Science Fellowship.
Baumgardner, John. 2018a. “Numerical Modeling of the Large-Scale Erosion, Sediment Transport, and Deposition Processes of the Genesis Flood.” Answers Research Journal 11 (June 27): 149–170. https://answersresearchjournal.org/numerical-modeling-genesis-flood-2/.
Baumgardner, John. 2018b. “Understanding How the Flood Sediment Record was Formed: The Role of Large Tsunamis.” In Proceedings of the Eighth International Conference on Creationism. Edited by John H. Whitmore, 287–305. Pittsburgh, Pennsylvania: Creation Science Fellowship.
Baumgardner, John R., and Evan Navarro. 2023. “The Role of Large Tsunamis in the Formation of the Flood Sediment Record.” In Proceedings of the Ninth International Conference on Creationism. Edited by John H. Whitmore, 363–386. Cedarville, Ohio: Cedarville University International Conference on Creationism.
Becker, Alexander. 1994. “Bedding-Plane Slip Over a Pre-Existing Fault, An Example: The Ramon Fault, Israel.” Tectonophysics 230, nos. 1–2 (15 February): 91–104.
Becker, Alexander. 1995. “Quartz Pressure Solution: Influence of Crystallographic Orientation.” Journal of Structural Geology 17, no. 10 (October): 1395–1405.
Behrmann, Jan H. 1983. “Microstructure and Fabric Transitions in Calcite Tectonics from the Sierra Alhamilla (Spain).” Geologische Rundschau 72, no. 2 (June): 605–618.
Behrmann, Jan H. 1985. “Crystal Plasticity and Superplasticity in Quartzite: A Natural Example.” Tectonophysics 115, nos. 1–2 (10 May): 101–129.
Behrmann, Jan H., and D. Mainprice. 1987. “Deformation Mechanisms in a High-Temperature Quartz-Feldspar Mylonite: Evidence for Superplastic Flow in the Lower Continental Crust.” Tectonophysics 140, nos. 2–4 (1 September): 297–305.
Behzadi, H., and A.K. Dubey. 1980. “Variation of Interlayer Slip in Space and Time During Flexural Folding.” Journal of Structural Geology 2, no. 4: 453–457.
Bell, Tim H. 1978. “Syntectonic Nucleation of New Grains in Deformed Mica.” Tectonophysics 51, nos. 3–4 (20 December): T31–T37.
Bell, Tim H., and Scott E. Johnson. 1989. “The Role of Deformation Partitioning in the Deformation and Recrystallization of Plagioclase and K-Feldspar in the Woodroffe Thrust Mylonite Zone, Central Australia.” Journal of Metamorphic Geology 7, no. 2 (March): 151–168.
Benesh, N. P., A. Plesch, J. H. Shaw, and E. K. Frost. 2007. “Investigation of Growth Fault Bend Folding Using Discrete Element Modeling: Implications for Signatures of Active Folding Above Blind Thrust Faults.” Journal of Geophysical Research 112, no. B3 (24 March): B03S04. doi:10.1029/2006JB004466.
Bestmann, Michael, and David J. Prior. 2003. “Intragranular Dynamic Recrystallization in Naturally Deformed Calcite Marble: Diffusion Accommodated Grain Boundary Sliding as a Result of Subgrain Rotation Recrystallization.” Journal of Structural Geology 25, no. 10 (October): 1597–1613.
Billia, Marco A., Nicholas E. Timms, Virginia G. Toy, Rob D. Hart, and David J. Prior. 2013. “Grain Boundary Dissolution Porosity in Quartzofeldspathic Ultramylonites: Implications for Permeability Enhancement and Weakening of Mid-Crustal Shear Zones.” Journal of Structural Geology 53 (August): 2–14.
Billingsley, George H. 2000. Geologic Map of the Grand Canyon 30′ × 60′ Quadrangle, Coconino and Mohave Counties, Northwestern Arizona. Washington DC: U.S. Geological Survey, Geologic Investigations Series I–2688.
Blakey, Ronald C., and Larry T. Middleton. 2012. “Geologic History and Paleogeography of Paleozoic and Early Mesozoic Sedimentary Rocks, Eastern Grand Canyon, Arizona.” In Grand Canyon Geology: Two Billion Years of Earth’s History. Edited by J. Michael Timmons and Karl E. Karlstrom, 81–92. Boulder, Colorado: Geological Society of America, Special Paper 489.
Blenkinsop, Tom G. 1988. “Definition of Low-Grade Metamorphic Zones Using Illite Crystallinity.” Journal of Metamorphic Geology 6, no.5 (September): 623–636.
Blenkinsop, Tom G., and M. R. Drury. 1988. “Stress Estimates and Fault History from Quartz Microstructures.” Journal of Structural Geology 10, no. 7: 673–684.
Boggs, Samuel, Jr. 1995. Principles of Sedimentology and Stratigraphy, 79–107. 2nd ed. Upper Saddle River, New Jersey: Prentice-Hall.
Bons, Paul D., and Bas den Brok. 2000. “Crystallographic Preferred Orientation Development by Dissolution-Precipitation Creep.” Journal of Structural Geology 22, nos. 11–12 (November): 1713–1722.
Borg, Iris Y., and John Crawford Maxwell. 1956. “Interpretation of Fabrics of Experimentally Deformed Sands. American Journal of Science 254, no. 2 (February): 71–81.
Borg, Iris Y., Melvin Friedman, John Handin, and Donald V. Higgs. 1960. “Experimental Deformation of St. Peter Sand: A Study of Cataclastic Flow.” In Rock Deformation (A Symposium). Edited by David Griggs, and John Handin, 133–191. Boulder, Colorado: Geological Society of America, Memoir 79.
Borg, Iris Y., and Hugh C. Heard. 1970. “Experimental Deformation of Plagioclases.” In Experimental and Natural Rock Deformation. Edited by P. Paulitsch, 375–403. Berlin, Germany: Springer-Verlag.
Borja, Ronaldo I., Kossi M. Sama, and Pablo F. Sanz. 2003. “On the Numerical Integration of Three-Invariant Elastoplastic Constitutive Models.” Computer Methods in Applied Mechanics and Engineering 192, nos. 9–10 (28 February): 1227–1258.
Borja, Ronaldo I. 2006. “Conditions for Instabilities in Collapsible Solids Including Volume Implosion and Compaction Banding.” Acta Geotechnica 1 (22 August): 107–122.
Boullier, Anne-Marie, and Y. Guegen. 1975. “SP Mylonites: Origin of Some Mylonites by Superplastic Flow.” Contributions to Mineralogy and Petrology 50, no. 2 (June): 93–104.
Brime, C. 1999. “Metamorfismo de Bajo Grado: Diferencias en Escala o Diferencias en Grado Metamórfico?” Trabajos de Geologia 21, no. 21: 61–66.
Brime, C., John A. Talent, and Ruth Mawson. 2003. “Low-Grade Metamorphism in the Palaeozoic Sequences of the Townsville Hinterland, Northeastern Australia.” Australian Journal of Earth Sciences 50, no. 5 (December): 751–767.
Bucher, Kurt, and Martin Frey. 2002. Petrogenesis of Metamorphic Rocks. 7th ed. Berlin, Germany: Springer-Verlag.
Burkhard, Martin. 1993. “Calcite Twins, Their Geometry, Appearance and Significance as Stress-Strain Markers and Indicators of Tectonic Regime: A Review.” Journal of Structural Geology 15, nos. 3–5 (March–May): 351–368.
Busch, Jay P., and Ben A. van der Pluijm. 1995. “Calcite Textures, Microstructures and Rheological Properties of Marble Mylonites in the Bancroft Shear Zone, Ontario, Canada.” Journal of Structural Geology 17, no. 5 (May): 677–688.
Carter, Neville L. 1971. “Static Deformation of Silica and Silicates.” Journal of Geophysical Research 76, no. 23 (10 August): 5514–5540.
Carter, Neville L., John M. Christie, and David T. Griggs. 1964. “Experimental Deformation and Recrystallization of Quartz.” The Journal of Geology 72, no. 6 (November): 687–733.
Chapin, Charles E., and Steven M. Cather. 1983. “Eocene Tectonics and Sedimentation in the Colorado Plateau-Rocky Mountain Area.” In Rocky Mountain Foreland Basins and Uplifts. Edited by James D. Lowell, 33–56. Denver, Colorado: Rocky Mountain Association of Geologists.
Chapple, William M., and John H. Spang. 1974. “Significance of Layer-Parallel Slip During Folding of Layered Sedimentary Rocks.” Geological Society of America Bulletin 85, no. 1 (October 1): 1523–1534.
Chester, Frederick M., Judith S. Chester, Andreas K. Kronenberg, and Andrew Hajash. 2007. “Subcritical Creep Compaction of Quartz Sand at Diagenetic Conditions: Effects of Water and Grain Size.” Journal of Geophysical Research 112, no. B6 (8 June): B06203, doi:10.1029/2006JB004317.
Chester, Judith S., S. C. Lenz, Frederick M. Chester, and R. A. Lang. 2004. “Mechanisms of Compaction of Quartz Sand at Diagenetic Conditions.” Earth and Planetary Science Letters 220, nos. 3–4 (April): 435–451.
Christie, John M., David T. Griggs, and Neville L. Carter. 1964. “Experimental Evidence of Basal Slip in Quartz.” The Journal of Geology 72, no. 6 (November): 734–756.
Christie, John M., and A. J. Ardell. 1974. “Substructures of Deformation Lamellae in Quartz.” Geology 2, no. 8 (August 1): 405–408.
Chuhan, Fawad A., Arild Kjeldstad, Knut Bjørlykke, and Kaare Høeg. 2002. “Porosity Loss in Sand by Grain Crushing—Experimental Evidence and Relevance to Reservoir Quality.” Marine and Petroleum Geology 19, no. 1 (January): 39–53.
Clarey, Timothy L. 2019. “European Stratigraphy Supports a Global Flood.” Acts & Facts 48, no. 12 (November 27): 10–12.
Clarey, Timothy L. 2020. Carved in Stone: Geological Evidence of the Worldwide Flood. Dallas, Texas: Institute for Creation Research.
Clarey, Timothy L., and Davis J. Werner. 2023. “A Progressive Global Flood Model Confirmed by Rock Data Across Five Continents.” In Proceedings of the Ninth International Conference on Creationism. Edited by John H. Whitmore, 412–445. Cedarville, Ohio: Cedarville University International Conference on Creationism.
Condie, Kent C. 2005. “The Crust.” In Earth as an Evolving Planetary System. Edited by Kent C. Condie, 13–58. Burlington, New Jersey: Academic Press,
Cooke, Michelle L., and David D. Pollard. 1997. “Bedding-Plane Slip in Initial Stages of Fault-Related Folding.” Journal of Structural Geology 19, no. 3–4 (March–April): 567–581.
Cooke, Michelle L., and Chad A. Underwood. 2001. “Fracture Termination and Step-over at Bedding Interfaces Due to Frictional Slip and Interface Opening.” Journal of Structural Geology 23, nos. 2–3 (3 February): 223–238.
Cooke, Michelle L., P. N. Mollema, David D. Pollard, and Atilla Aydin. 2000. “Interlayer Slip and Joint Localization in East Kaibab Monocline, Utah: Field Evidence and Results from Numerical Modelling.” In Forced Folds and Fractures. Edited by John W. Cosgrove and Mohammed S. Ameen, 23–49. London, United Kingdom: The Geological Society, Special Publication 169.
Couples, G. D., and H. Lewis. 2000. “Effects of Interlayer Slip in Model Forced Folds.” In Forced Folds and Fractures. Edited by John W. Cosgrove, and Mohammed S. Ameen, 129–144. London, United Kingdom: The Geological Society, Special Publication 169.
Cox, Stephen F., and Michael A. Etheridge. 1982. “Fiber Development in Deformed Hydrothermally Altered Acid Volcanic Rock.” In Atlas of Deformational and Metamorphic Rock Fabrics. Edited by Graham J. Borradaile, M. Brian Bayly, and Chris McA. Powell, 304–305. New York, New York: Springer.
Crook, A. J. L., D. R. J. Owen, S. m. Wilson, and J. G. Yu. 2006. “Benchmarks for the Evolution of Shear Localisation with Large Relative Sliding in Frictional Materials.” Computer Methods in Applied Mechanics and Engineering 195, nos. 37–40 (15 July): 4991–5010.
Cundall, P. A., and O. D. L. Strack. 1979. “A Discrete Numerical Model for Granular Assemblies.” Geotechnique 29, no. 1 (March): 47–65.
Davis, George H. 1978. “Monocline Fold Pattern of the Colorado Plateau.” In Laramide Folding Associated with Basement Block Faulting in the Western United States. Edited by Vincent Matthews III, 215–233. Boulder, Colorado: Geological Society of America, Memoir 151.
Davis, George H., and S. E. Tindall. 1996. “Discovery of Major Right-Handed Laramide Strike-Slip Faulting Along the Eastern Margin of the Kaibab Uplift, Colorado Plateau, Utah.” EOS, Transactions of the American Geophysical Union: F641–F642.
Davis, George H., and Stephen J. Reynolds. 1996. Structural Geology of Rocks and Regions. 2nd ed. New York, New York: John Wiley & Sons.
de Boer, R. B., P. J. C. Nactegaal, and E. m. Duyvis. 1977. “Pressure Solution Experiments on Quartz Sand.” Geochimica et Cosmochimica Acta 41, no. 2 (February): 257–264.
de Bresser, J. H. P., J. H. ter Heege, and C. J. Spiers. 2001. “Grain Size Reduction by Dynamic Recrystallization: Can it Result in Major Rheological Weakening?” International Journal of Earth Sciences (Geologische Rundschau) 90, no. 1 (May): 28–45.
DeCelles, Peter G., and James C. Coogan. 2006. “Regional Structure and Kinematic History of the Sevier Fold-and-Thrust Belt, Central Utah.” Geological Society of America Bulletin 118, nos. 7–8 (July–August): 841–864.
DeCelles, Peter G., Timothy F. Lawton, and Gautam Mitra. 1995. “Thrust Timing, Growth of Structural Culminations, and Synorogenic Sedimentation in the Type Sevier Orogenic Belt, Western United States.” Geology 23, no. 8 (August): 699–702.
den Brok, Bas. 1996. “The Effect of Crystallographic Orientation on Pressure Solution in Quartzite.” Journal of Structural Geology 18, no. 6 (June): 859–860.
den Brok, S. W. J. 1998. “Effect of Microcracking on Pressure-Solution Strain Rate: The Gratz Grain-Boundary Model.” Geology 26, no. 10 (October): 915–918.
den Brok, S. W. J., and C. J. Spiers. 1991. “Experimental Evidence for Water Weakening of Quartzite by Microcracking Plus Solution-Precipitation Creep.” Journal of the Geological Society of London 147, no. 3 (May): 541–548.
Dickinson, William R. 1981. “Plate Tectonic Evolution of the Southern Cordillera.” In Relations of Tectonics to Ore Deposits in the Southern Cordillera. Edited by William R. Dickinson and William D. Payne, 113–135. Tucson, Arizona: Arizona Geological Society, Digest 14.
Dickinson, William R., and Walter S. Snyder. 1978. “Plate Tectonics of the Laramide Orogeny.” In Laramide Folding Associated with Basement Block Faulting in the Western United States. Edited by Vincent Matthews III, 355–366. Boulder, Colorado: Geological Society of America, Memoir 151.
Dickinson, William R., Margaret A. Klute, Michael J. Hayes, Susanne U. Janecke, Erik A. Lundin, Mary A. McKittrick and Mark D. Olivares. 1987. “Laramide Tectonics and Paleogeography Inferred from the Sedimentary Record in Laramide Basins of Central Rocky Mountain Region.” Geological Society of America Abstracts with Programs 20, no. 5: 271.
Donath, Fred A., and Ronald B. Parker. 1964. “Folds and Folding.” Geological Society of America Bulletin 75, no. 1 (January): 45–62.
Dornbusch, H.-J., K. Weber, and W. Skrotzki. 1994. “Development of Microstructure and Texture in High-Temperature Mylonites from the Ivrea Zone.” In Textures of Geological Materials. Edited by H. J. Bunge, S. Siegesmund, W. Skrotzki, and K. Weber, 187–201. Oberursel, Germany: DGM Informationsgesellschaft-Verlag.
Drury, Martyn R. 1993. “Deformation Lamellae in Metals and Minerals.” In Defects and Processes in the Solid State: Geoscience Applications: The McLaren Volume. Edited by J. N. Boland, and J. D. Fitz Gerald, 195–212. Amsterdam, The Netherlands: Elsevier.
Drury, Martyn R., F. J. Humphreys, and S. H. White. 1985. “Large Strain Deformation Studies Using Polycrystalline Magnesium as a Rock Analogue. Part II: Dynamic Recrystallization Mechanisms at High Temperatures.” Physics of the Earth and Planetary Interiors 40, no. 3 (1 November): 208–222.
Drury, Martyn R., and Janos L. Urai. 1990. “Deformation-Related Recrystallization Processes.” Tectonophysics 172, nos. 3–4 (1 February): 235–253.
Dumitru, Trevor A., Ian R. Duddy, and Paul F. Green. 1994. “Mesozoic–Cenozoic Burial, Uplift, and Erosion History of the West-Central Colorado Plateau.” Geology 22, no. 6 (June): 499–502.
Dumitru, Trevor A., Phillip B. Gans, David A. Foster, and Elizabeth L. Miller. 1991. “Refrigeration of the Western Cordilleran Lithosphere during Laramide Shallow-Angle Subduction.” Geology 19, no. 11 (November): 1145–1148.
Dunham, Robert J. 1962. “Classification of Carbonate Rocks According to Depositional Texture.” In Classification of Carbonate Rocks. Edited by William E. Ham, 108–121. Tulsa, Oklahoma: The American Association of Petroleum Geologists, Memoir 1.
Durney, D. W. 1972. “Solution-Transfer, an Important Geological Deformation Mechanism.” Nature 235, no. 5337 (11 February): 315–317.
Edington, J. W., K. N. Melton, and C. P. Cutler. 1976. “Superplasticity.” Progress in Materials Science 21, nos. 1–2: 63–170.
Elias, Brian P., and Andrew Hajash, Jr. 1992. “Changes in Quartz Solubility and Porosity Due to Effective Stress: An Experimental Investigation of Pressure Solution.” Geology 20, no. 5 (May): 451–454.
Elston, Donald P. 1989. “Correlations and Facies Changes in Lower and Middle Cambrian Tonto Group, Grand Canyon, Arizona.” In Geology of Grand Canyon, Northern Arizona (with Colorado River Guides). Edited by Donald P. Elston, George H. Billingsley, and Richard A. Young, 131–136. Washington, DC: American Geophysical Union.
Epard, J.-L., and Richard H. Groshong, Jr. 1995. “Kinematic Model of Detachment Folding Including Limb Rotation, Fixed Hinges and Layer-Parallel Strain.” Tectonophysics 247, nos. 1–4 (July): 85–103.
Erickson, S. Gregg., and William R. Jamison. 1995. “Viscous-Plastic Finite-Element Models of Fault-Bend Folds.” Journal of Structural Geology 17, no. 4 (April): 561–573.
Essene, E. J., and D. R. Peacor. 1995. “Clay Mineral Thermometry—A Critical Perspective.” Clays and Clay Minerals 43 (1 October): 540–553.
Etchecopar, A., and G. Vasseur. 1987. “A 3-D Kinematic Model of Fabric Development in Polycrystalline Aggregates: Comparisons with Experimental and Natural Examples.” Journal of Structural Geology 9, nos. 5–6: 705–717.
Etheridge, Michael A., Bruce E. Hobbs, and Mervyn S. Paterson. 1973. “Experimental Deformation of Single Crystals of Biotite.” Contributions to Mineralogy and Petrology 38, no. 1 (March): 21–36.
Etheridge, Michael A., and Bruce E. Hobbs. 1974. “Chemical and Deformational Controls on Recrystallization of Mica.” Contributions to Mineralogy and Petrology 43, no. 2 (June): 111–124.
Etheridge, Michael A., and J. C. Wilkie. 1979. “Grainsize Reduction, Grain Boundary Sliding and the Flow Strengths of Mylonites.” Tectonophysics 58, nos. 1–2 (10 September): 159–178.
Etheridge, Michael A., and Ron H. Vernon. 1981. “A Deformed Polymictic Conglomerate—The Influence of Grain Size and Composition on the Mechanism and Rate of Deformation.” Tectonophysics 79, nos. 3–4 (10 November): 237–254.
Fairbairn, Harold W. 1939. “Correlation of Quartz Deformation with its Crystal Structure.” American Mineralogist 24, no. 6 (1 June): 351–368.
Fitz Gerald, J. D., Michael A. Etheridge, and Ron H. Vernon. 1983. “Dynamic Recrystallization in a Naturally Deformed Albite.” Textures and Microstructures 5, no. 4 (19 November): 219–237.
Flowers, Rebecca M., David L. Shuster, B. P. Wernicke, and Ken A. Farley. 2007. “Radiation Damage Control on Apatite (U-Th)/He Dates from the Grand Canyon Region, Colorado Plateau.” Geology 35, no. 5 (May): 447–450.
Flowers, Rebecca M., B. P. Wernicke, and Ken A. Farley. 2008. “Unroofing, Incision and Uplift History of the Southwestern Colorado Plateau from Apatite (U-Th)/He Thermochronometry.” Geological Society of America Bulletin 120, nos. 5–6 (May 1): 571–587.
Flowers, Rebecca M., and Ken A. Farley. 2012. “Apatite 4He/3He and (U-Th)/He Evidence for an Ancient Grand Canyon.” Science 338, no. 6114 (29 November): 1616–1619.
Flowers, Rebecca M., Richard A. Ketcham, David L. Shuster, and Ken A. Farley. 2009. “Apatite (U–Th)/He Thermochronometry Using a Radiation Damage Accumulation and Annealing Model.” Geochimica et Cosmochimica Acta 73, no. 8 (15 April): 2347–2365.
Folk, Robert L. 1955. “Student Operator Error in Determination of Roundness, Sphericity, and Grain Size.” Journal of Sedimentary Petrology 25, no. 4 (1 December): 297–301.
Folk, Robert L. 1959. “Practical Petrographic Classification of Limestones.” American Association of Petroleum Geologists Bulletin 43, no. 1 (January): 1–38.
Folk, Robert L. 1962. “Spectral Subdivision of Limestone Types.” In Classification of Carbonate Rocks–A Symposium. Edited by William E. Ham, 62–84. Tulsa, Oklahoma: The American Association of Petroleum Geologists, Memoir 1.
Folk, Robert L. 1966. “A Review of Grain-Size Parameters.” Sedimentology 6, no. 2 (March): 73–93.
Folk, Robert L. 1980. Petrology of Sedimentary Rocks. Austin, Texas: Hemphill Publishing Co.
Fossen, Haakon. 2016. Structural Geology. 2nd ed. Cambridge, United Kingdom: Cambridge University Press.
Frey, Martin, and Hanan J. Kisch. 1987. “Scope of Subject.” In Low Temperature Metamorphism. Edited by Martin Frey, 1–8. Glasgow, United Kingdom: Blackie.
Frey, Martin, and D. Robinson. Eds. 1999. Low-Grade Metamorphism. London, United Kingdom: Blackwell Science.
Friedman, Melvin. 1963. “Petrofabric Analysis of Experimentally Deformed Calcite-Cemented Sandstones.” The Journal of Geology 71, no. 1 (January): 12–37.
Freidman, Melvin, John Handin, John M. Logan, Kyung D. Min, and D. W. Stearns. 1976. “Experimental Folding of Rocks Under Confining Pressure: Part III. Faulted Drape Folds in Multilithologic Layered Specimens.” Geological Society of America Bulletin 87, no. 7 (July): 1049–1066.
Friedman, Melvin, R. H. H. Hugman III, and John Handin. 1980. “Experimental Folding of Rocks Under Confining Pressure, Part VIII—Forced Folding of Unconsolidated Sand and of Lubricated Layers of Limestone and Sandstone.” Geological Society of America Bulletin 91, no. 5 (May): 307–312.
Gallagher, J. J., Jr., Melvin Friedman, John Handin, and G. m. Sowers. 1974. “Experimental Studies Relating to Microfracture in Sandstone.” Tectonophysics 21, no. 3 (February): 203–247.
Gangi, Anthony F., Kyung D. Min, and John M. Logan. 1977. “Experimental Folding of Rocks Under Confining Pressure: Part IV. Theoretical Analysis of Faulted Drape-Folds.” Tectonophysics 42, nos. 2–4 (20 October): 227–260.
Gapais, Denis. 1989. “Shear Structures Within Deformed Granites: Mechanical and Thermal Indicators.” Geology 17, no. 12 (December): 1144–1147.
Gehrels, George E., Ronald C. Blakey, Karl E. Karlstrom, J. Michael Timmons, William Dickinson, and Mark E. Pecha. 2011. “Detrital Zircon U-Pb Geochronology of Paleozoic Strata in the Grand Canyon, Arizona.” Lithosphere 3, no. 3 (June 1): 183–200.
Ghosh, Subir Kumar. 1968. “Experiments of Buckling of Multilayers which Permit Interlayer Gliding.” Tectonophysics 6, no.3 (September): 207–249.
Gilotti, Jane A., and Joseph M. Hull. 1990. “Phenomenological Superplasticity in Rocks.” In Deformation Mechanisms, Rheology and Tectonics. Edited by Robert J. Knipe, and Ernest H. Rutter, 229–240. London, United Kingdom: Geological Society of London, Special Paper 54.
Goodwin, Laurel B., and Basil Tikoff. 2002. “Competency Contrast, Kinematics, and the Development of Foliations and Lineations in the Crust.” Journal of Structural Geology 24, nos. 6–7 (June–July): 1065–1085.
Gottstein, G., and H. Mecking. 1985. “Recrystallization.” In Preferred Orientation in Deformed Metals and Rocks: An Introduction to Modern Texture Analysis. Edited by Hans-Rudolf Wenk, 183–218. London, United Kingdom: Academic Press.
Gratier, J.-P., J. Richard, F. Renard, S. Mittempergher, M.-L. Doan, G. Di Toro, J. Hadizadeh, and A.-M. Boullier. 2011. “Aseismic Sliding of Active Faults by Pressure Solution Creep: Evidence from the San Andreas Fault Observatory at Depth.” Geology 39, no. 12 (December): 1131–1134.
Green, Harry W. 1992. “Analysis of Deformation in Geological Materials.” In Minerals and Reactions at the Atomic Scale: Transmission Electron Microscopy. Edited by Peter R. Buseck, 425–454. Washington, DC: Mineralogical Society of America, Reviews in Mineralogy, vol. 27.
Green, Harry W., David T. Griggs, and John M. Christie. 1970. “Syntectonic and Annealing Recrystallization of Fine-Grained Quartz Aggregates.” In Experimental and Natural Rock Deformation. Edited by P. Paulitsch, 272–335. Berlin, Germany: Springer-Verlag.
Green, Harry W., and S. V. Radcliffe. 1972. “The Nature of Deformation Lamellae in Silicates.” Bulletin of the Geological Society of America 83, no. 3 (March 1): 847–852.
Griggs, David T. 1936. “Deformation of Rocks Under High Confining Pressures: I. Experiments at Room Temperature.” The Journal of Geology 44, no. 5 (July–August): 541–577.
Griggs, David T. 1939. “Creep of Rocks.” The Journal of Geology 47, no. 3 (April–May): 225–251.
Griggs, David T. 1974. “A Model of Hydrolytic Weakening in Quartz.” Journal of Geophysical Research 79, no. 11 (10 April): 1653–1661.
Griggs, David T., Mervyn S. Paterson, H. C. Heard, and Fred J. Turner. 1960. “Annealing Recrystallization in Calcite Crystals and Aggregates.” In Rock Deformation: A Symposium. Edited by D. T. Griggs and J. Handin, 21–37. Boulder, Colorado: Geological Society of America, Memoir 79, 21–37.
Groshong, Richard H., Jr. 1988. “Low-Temperature Deformation Mechanisms and Their Interpretation.” Geological Society of America Bulletin 100, no. 9 (September): 1329–1360.
Groves, G. W., and A. Kelly. 1963. “Independent Slip Systems in Crystals.” Philosophical Magazine 8, no. 89: 877–887.
Guiton, Martin L. E., Yves M. Leroy, and William Sassi. 2003. “Activation of Diffuse Discontinuities and Folding of the Sedimentary Layers.” Journal of Geophysical Research 108, no. B4 (April): 2183. doi:10.1029/2002JB001770.
Hafner, W. 1951. “Stress Distributions and Faulting.” Geological Society of America Bulletin 62, no. 4 (April): 373–398.
Handin, John, Melvin Friedman, Kyung D. Min, and L. J. Pattison. 1976. “Experimental Folding of Rocks Under Confining Pressure: Part II. Buckling of Multi-Layered Rock Beams.” Geological Society of America Bulletin 87, no. 7 (July): 1035–1048.
Hansen, Edward C., and Iris Y. Borg. 1962. “The Dynamic Significance of Deformation Lamellae in Quartz of a Calcite-Cemented Sandstone.” American Journal of Science 260, no. 5 (1 May): 321–336.
Hansen, Edward C., Iris Y. Borg, and John C. Maxwell. 1959. “Dynamic Significance of Quartz Lamellae.” Journal of Geophysical Research 64, no.8 (August): 1104–1105.
Hansen, L. N., Mark E. Zimmerman, and D. L. Kohlstedt. 2011. “Grain Boundary Sliding in San Carlos Olivine: Flow Law Parameters and Crystallographic-Preferred Orientation.” Journal of Geophysical Research 116, no. B8 (5 August): B08201. doi:10.1029/2011JB008220.
Harrison, Tim Mark, Richard Lee Armstrong, Chris W. Naeser, and J. E. Harakal. 1979. “Geochronology and Thermal History of the Coast Plutonic Complex, near Prince Rupert, British Columbia.” Canadian Journal of Earth Sciences 16, no. 3 (March): 400–410.
Hatcher, Robert D., Jr., and Christopher M. Bailey. 2020. Structural Geology. 3rd ed. New York, New York: Oxford University Press.
Heard, Hugh C. 1960. “Transition from Brittle Fracture to Ductile Flow in Solenhofen Limestone as a Function of Temperature, Confining Pressure, and Interstitial Fluid Pressure.” In Rock Deformation: A Symposium. Edited by David T. Griggs and John Handin, 193-226. Boulder, Colorado: Geological Society of America, Memoir 79.
Hennig-Michae, Christa. 1977. “Microscopic Structure Studies of Experimentally and Naturally Deformed Hematite Ores.” Tectonophysics 39, nos. 1–3 (20 April): 255–271.
Hill, Carol A., and Stephen O. Moshier. 2009. “Flood Geology and the Grand Canyon: A Critique.” Perspectives in Science and Christian Faith 61, no. 2 (June): 99–115.
Hillier, Stephen, J. Mátyás, Albert Matter, and Guy Vasseur. 1995. “Illite/Smectite Diagenesis and Its Variable Correlation with Vitrinite Reflectance in the Pannonian Basin.” Clays and Clay Minerals 43, no. 2 (1 April): 174–183.
Hippertt, J. F. 1994. “Microstructures and C-Axis Fabrics Indicative of Quartz Dissolution in Sheared Quartzites and Phyllonites.” Tectonophysics 229, nos. 3–4 (30 January): 141–163.
Hiraga, Takehiko, Tomonori Miyazaki, Hidehiro Yoshida, and Mark E. Zimmerman. 2013. “Comparison of Microstructures in Superplastically Deformed Synthetic Materials and Natural Mylonites: Mineral Aggregation via Grain Boundary Sliding.” Geology 41, no. 9 (September): 959–962.
Hirth, Greg, and Jan Tullis. 1992. “Dislocation Creep Regimes in Quartz Aggregates.” Journal of Structural Geology 14, no. 2 (February): 145–160.
Hobbs, Bruce E. 1968. “Recrystallization of Single Crystals of Quartz.” Tectonophysics 6, no. 5 (November): 353–401.
Hobbs, Bruce. E., A. C. McLaren, and Mervyn S. Paterson. 1972. “Plasticity of Single Crystals of Synthetic Quartz.” In Flow and Fracture of Rocks. Edited by Hugh C. Heard, Iris Y. Borg, Neville L. Carter, and C. B. Raleigh, 29–53. Washington DC: American Geophysical Union, Geophysical Monograph Series, vol. 16.
Hobbs, Bruce E., W. D. Means, and Paul F. Williams. 1976. An Outline of Structural Geology. New York, New York: Wiley.
Horne, Richard, and Nicholas Culshaw. 2001. “Flexural-Slip Folding in the Meguma Group, Nova Scotia, Canada.” Journal of Structural Geology 23, no. 10 (October): 1631–1652.
Hower, J. 1981. “Shale Diagenesis.” In Clays and the Resource Geologist. Edited by Fred J. Longstaffe, 60–80. Quebec City, Canada: Mineralogical Association of Canada, Short Course Handbook 7.
Huang, Wuu-Liang, John M. Longo, and David R. Pevear. 1993. “An Experimentally Derived Kinetic Model for Smectite-to-Illite Conversion and Its Use as a Geothermometer.” Clays and Clay Minerals 41, no. 2 (1 April): 162–177.
Hubbert, M. King. 1951. “Mechanical Basis for Certain Familiar Geologic Structures.” Geological Society of America Bulletin 62, no. 4 (April): 355–372.
Hughes, Amanda N., and John H. Shaw. 2015. “Insights into the Mechanics of Fault-Propagation Folding Styles.” Geological Society of America Bulletin 127, nos. 11–12 (November): 1752–1765.
Huntoon, Peter W. 1993. “Influence of Inherited Precambrian Basement Structure on the Localization and Form of Laramide Monoclines, Grand Canyon, Arizona.” In Laramide Basement Deformation in the Rocky Mountain Foreland of the Western United States. Edited by Christopher J. Schmidt, Ronald B. Chase, and Eric A. Erslev, 243–256. Boulder, Colorado: Geological Society of America, Special Paper 280.
Huntoon, Peter W. 2003. “Post-Precambrian Tectonism in the Grand Canyon Region.” In Grand Canyon Geology. 2nd ed. Edited by Stanley S. Beus, and Michael Morales, 222–259. New York, New York: Oxford University Press.
Hurford, A. J. 1985. “On the Closure Temperature for Fission Tracks in Zircon.” Nuclear Tracks 10, no. 3 (January): 415.
Ilg, Bradley R., Karl E. Karlstrom, David P. Hawkins, and Michael L. Williams. 1996. “Tectonic Evolution of Paleoproterozoic Rocks in the Grand Canyon: Insights into Middle-Crustal Processes.” Geological Society of America Bulletin 108, no. 9 (September): 1149–1166.
Ingerson, Earl, and Joseph L. Ramisch. 1942. “Origin of Shapes of Quartz Sand Grains.” American Mineralogist 27, no. 9 (1 September): 595–606.
Ismat, Zeshan, and Gautam Mitra. 2005. “Fold-Thrust Belt Evolution Expressed in an Internal Thrust Sheet, Sevier Orogen: The Role of Cataclastic Flow.” Geological Society of America Bulletin 117, nos. 5–6 (May–June): 764–782.
Jackson, Ian, Ulrich H. Faul, and Richard Skelton. 2014. “Elastically Accommodated Grain-Boundary Sliding: New Insights from Experiment and Modeling.” Physics of the Earth and Planetary Interiors 228 (March): 203–210.
Jessell, M. W. 1988a. “Simulation of Fabric Development in Recrystallizing Aggregates—I. Description of the Model.” Journal of Structural Geology 10, no. 8: 771–778.
Jessell, M. W. 1988b. “Simulation of Fabric Development in Recrystallizing Aggregates—II. Example Model Runs.” Journal of Structural Geology 10, no. 8: 779–793.
Johnson, Scott E., Ron H. Vernon, and Phaedra Upton. 2004. “Foliation Development and Progressive Strain-Rate Partitioning in the Crystallizing Carapace of a Tonalite Pluton: Microstructural Evidence and Numerical Modeling.” Journal of Structural Geology 26, no. 10 (October): 1845–1865.
Jones, Craig H., G. Lang Farmer, Brad Sageman, and Shijie Zhong. 2011. “Hydrodynamic Mechanism for the Laramide Orogeny.” Geosphere 7, no. 1 (February 1): 183–201.
Kamb, W. Barclay. 1959. “Theory of Preferred Crystal Orientation Developed by Crystallization Under Stress.” The Journal of Geology 67, no. 2 (March): 153–170.
Karlstrom, Karl E., and J. Michael Timmons. 2012. “Faulting and Uplift in the Grand Canyon Region.” In Grand Canyon Geology: Two Billion Years of Earth’s History. Edited by J. Michael Timmons, and Karl E. Karlstrom, 93–107. Boulder, Colorado: Geological Society of America, Special Paper 489.
Karlstrom, Karl E., Bradley R. Ilg, Michael L. Williams, David P. Hawkins, Samuel A. Bowring, and S. J. Seaman. 2003. “Paleoproterozoic Rocks of the Granite Gorges.” In Grand Canyon Geology, 2nd ed. Edited by Stanley S. Beus, and Michael Morales, 9–38. New York, New York: Oxford University Press.
Karlstrom, Karl E., J. Michael Timmons, and Laura J. Crossey. 2012. “Introduction to Grand Canyon Geology.” In Grand Canyon Geology: Two Billion Years of Earth’s History. Edited by J. Michael Timmons, and Karl E. Karlstrom, 1–6. Boulder, Colorado: Geological Society of America, Special Paper 489.
Karlstrom, Karl E., James W. Hagadorn, George E. Gehrels, William Matthews, Mark D. Schmitz, Lauren Madronich, Jacob Mulder, Mark Pecha, Dominique Giesler, and Laura J. Crossey. 2018. “Cambrian Sauk Transgression in the Grand Canyon Region Redefined by Detrital Zircons.” Nature Geoscience 11, no. 6 (June): 438–443.
Karlstrom, Karl E., M.T. Mohr, Mark D. Schmitz, Frederick A. Sundberg, S.M. Rowland, Ronald C. Blakey, John R. Foster, Laura J. Crossey, Carol M. Dehler and James W. Hagadorn. 2020. “Redefining the Tonto Group of Grand Canyon and Recalibrating the Cambrian Time Scale.” Geology 48, no. 5 (1 May): 425–430.
Kelley, Shari A., Charles E. Chapin, and Karl E. Karlstrom. 2001. “Laramide Cooling Histories of the Grand Canyon, Arizona, and the Front Range, Colorado, Determined from Apatite Fission-Track Thermochronology.” In Colorado River: Origin and Evolution. Edited by Richard A. Young, and Earle E. Spamer, 37–42. Grand Canyon, Arizona: Grand Canyon Association, Monograph 12.
Kelley, Shari A., and Karl E. Karlstrom. 2012. “The Laramide and Post-Laramide Uplift and Erosional History of the Eastern Grand Canyon: Evidence from Apatite Fission-Track Thermochronology.” In Grand Canyon Geology: Two Billion Years of Earth’s History. Edited by J. Michael Timmons, and Karl E. Karlstrom, 109–117. Boulder, Colorado: Geological Society of America, Special Paper 489.
Kelly, Anthony, and G. W. Groves. 1970. Crystallography and Crystal Defects. London, United Kingdom: Longman.
Kenkmann, Thomas., and Georg Dresen. 2002. “Dislocation Microstructure and Phase Distribution in a Lower Crustal Shear Zone—An Example From the Ivrea-Zone, Italy.” International Journal of Earth Sciences (Geologische Rundschau) 91, no. 3 (May): 445–458.
Kennedy, L. A., and J. C. White. 2001. “Low-Temperature Recrystallization in Calcite: Mechanisms and Consequences.” Geology 29, no. 11 (November): 1027–1030.
Khan, M. Ibrahim, and M. Rafiqul Islam. 2008. “Reservoir Engineering and Secondary Recovery.” In The Petroleum Engineering Handbook: Sustainable Operations, 189–241. Amsterdam, The Netherlands: Elsevier, Gulf Publishing Company Imprint.
Kisch, H. J. 1983. “Mineralogy and Petrology of Burial Diagenesis (Burial Metamorphism) and Incipient Metamorphism in Clastic Rocks.” In Diagenesis in Sediments and Sedimentary Rocks. Vol. 2. Edited by Gunnar Larsen, and George V. Chilingar, 289–493. Amsterdam, The Netherlands: Elsevier.
Kisch, H. J. 1987. “Correlation Between Indicators of Very Low-Grade Metamorphism.” In Low Temperature Metamorphism. Edited by Martin Frey, 227–304. New York, New York: Chapman and Hall.
Kisch, H. J. 1991. “Illite Crystallinity: Recommendations on Sample Preparation, X-Ray Diffraction Settings, and Interlaboratory Samples.” Journal of Metamorphic Geology 9, no. 6 (November): 665–670.
Knipe, Robert J. 1989. “Deformation Mechanisms—Recognition from Natural Tectonites.” Journal of Structural Geology 11, nos. 1–2: 127–146.
Kruhl, Jörn H. 2001. “Crystallographic Control on the Development of Foam Textures in Quartz, Plagioclase and Analogue Material.” International Journal of Earth Sciences (Geologische Rundschau) 90, no. 1 (May): 104–117.
Kruhl, Jörn H., and Mark Peternell. 2002. “The Equilibration of High-Angle Grain Boundaries in Dynamically Recrystallized Quartz: The Effect of Crystallography and Temperature.” Journal of Structural Geology 24, nos. 6–7 (June–July): 1125–1137.
Kubler, B. 1964. “Les Argiles, Indicateurs de Métamorphisme.” Revue de L’Institut Française de Pétrole 19: 1093–1112.
Kubler, B. 1967. “La Cristallinité d’Illite et les Zones Tout à Fait Supérieures du Métamorphisme.” In Etages Tectoniques, Colloque de Neûchatel, 105–122. Neûchatel, Switzerland: Institute de Géologie, Université de Neûchatel.
Kubler, B. 1968. “Evaluation Quantitative de Métamorphisme par la Cristallinité de l’Illite.” Centre de Recherches de Pau Société Nationale de Pétroles d’Aquitaine Bulletin 2: 385–397.
Kubler, B., and D. Goy-Eggenberger. 2001. “La Cristallinité de l’Illite Revisitée, un-Bilan des Connaissances Acquises ces Trente Derniéres Années.” Clay Minerals 36, no. 2 (9 July): 143–157.
Kuenen, P. H. and L. U. de Sitter. 1938. “Experimental Investigation into the Mechanisms of Folding.” Leidshe Geologische Mededeelingen 10, no. 1: 217–240.
Lafrance, B., Barbara E. John, and James S. Scoates. 1996. “Syn-Emplacement Recrystallization and Deformation Microstructures in the Poe Mountain Anorthosite, Wyoming.” Contributions to Mineralogy and Petrology 122, no. 4 (January): 431–440.
Laney, Randy, and A. William Laughlin. 1981. “Natural Annealing of Pleochroic Haloes in Biotite Samples from Deep Drill Holes, Fenton Hill, New Mexico.” Geophysical Research Letters 8, no. 5 (May): 501–504.
Langdon, Terence G. 1970. “Grain Boundary Sliding as a Deformation Mechanism During Creep.” Philosophical Magazine 22, no. 178: 689–700.
Law, Richard D. 1990. “Crystallographic Fabrics: A Selective Review of Their Applications to Research in Structural Geology.” In Deformation Mechanisms, Rheology and Tectonics. Edited by Robert J. Knipe, and Ernest H. Rutter, 335–352. London, United Kingdom: Geological Society of London, Special Paper 54.
Law, Richard D. 2014. “Deformation Thermometry Based on Quartz c-Axis Fabrics and Recrystallization Microstructures: A Review.” Journal of Structural Geology 66 (September): 129–161.
Lee, L. C., and S. J. S. Morris. 2010. “Anelasticity and Grain Boundary Sliding.” Proceedings of the Royal Society A 466, no. 2121 (8 September): 2651–2671.
Lee, L. C., S. J. S. Morris, and J. Wilkening. 2011. “Stress Concentrations, Diffusionally Accommodated Grain Boundary Sliding and the Viscoelasticity of Polycrystals.” Proceedings of the Royal Society A 467, no. 2130 (8 June): 1624–1644.
Lister, Gordon S., Mervyn S. Paterson, and Bruce E. Hobbs. 1978. “The Simulation of Fabric Development in Plastic Deformation and its Application to Quartzite: The Model.” Tectonophysics 45, nos. 2–3 (15 February): 107–158.
Lister, Gordon S., and Bruce E. Hobbs. 1980. “The Simulation of Fabric Development During Plastic Deformation and its Application to Quartzite: The Influence of Deformation History.” Journal of Structural Geology 2, no. 3: 355–370.
Liu, Lijun, Michael Gurnis, Maria Seton, Jason Saleeby, R. Dietmar Müller, and Jennifer M. Jackson. 2010. “The Role of Oceanic Plateau Subduction in the Laramide Orogeny.” Nature Geoscience 3, no. 5 (28 March): 353–357.
Lloyd, Geoffrey E., and Brett Freeman. 1994. “Dynamic Recrystallization of Quartz Under Greenschist Conditions.” Journal of Structural Geology 16, no. 6 (June): 867–881.
Maltman, Alex. 1984. “On the Term ‘Soft-Sediment Deformation’.” Journal of Structural Geology 6, no. 5: 589–592.
Mancktelow, Neil S., and Giorgio Pennacchioni. 2004. “The Influence of Grain Boundary Fluids on the Microstructure of Quartz-Feldspar Mylonites.” Journal of Structural Geology 26, no. 1 (January): 47–69.
Mares, V. m., and A. K. Kroenenberg. 1993. “Experimental Deformation of Muscovite.” Journal of Structural Geology 15, nos. 9–10 (September–October): 1061–1075.
Masberg, H. P., E. Hoffer, and S. Hoernes. 1992. “Microfabrics Indicating Granulite-Facies Metamorphism in the Low-Pressure Central Damara Orogen, Namibia.” Precambrian Research 55, nos. 1–4 (March): 423–257.
Massey, Matthew A., David J. Prior, and David P. Moecher. 2011. “Microstructure and Crystallographic Preferred Orientation of Polycrystalline Microgarnet Aggregates Developed During Progressive Creep, Recovery, and Grain Boundary Sliding.” Journal of Structural Geology 33, no. 4 (April): 713–730.
Matsuoka, Hajime, and Teruo Nakai. 1974. “Stress-Deformation and Strength Characteristics of Soil Under Three Different Principal Stresses.” Proceedings of Japan Society of Civil Engineers 232 (December): 59–70.
Matthews, Vincent, III, ed. 1978. Laramide Folding Associated with Basement Block Faulting in the Western United States. Boulder, Colorado: Geological Society of America, Memoir 151.
Matthews, William, Bernard Guest, and Lauren Madronich. 2017. “Latest Neoproterozoic to Cambrian Detrital Zircon Facies of Western Laurentia.” Geosphere 14, no. 1 (December 20): 243–264.
Maxwell, John C. 1960. “Experiments on Compaction and Cementation of Sand.” In Rock Deformation—A Symposium. Edited by David Griggs and John Handin, 105–132. Boulder, Colorado: Geological Society of America, Memoir 79.
McClay, K. R. 1977. “Pressure Solution and Coble Creep in Rocks and Minerals: A Review.” Journal of the Geological Society of London 134, no. 1 (October): 57–70.
McKee, Edwin D. 1932. “Some Fucoids from the Grand Canyon.” Grand Canyon Study Notes 8: 58–161.
McKee, Edwin D. 1945. “Stratigraphy and Ecology of the Grand Canyon Cambrian: Part 1. Cambrian History of the Grand Canyon Region.” Carnegie Institute of Washington Publication 563, 1–168. Washington, DC: Carnegie Institute of Washington.
McLaren, A. C., and J. A. Retchford. 1969. “Transmission Electron Microscope Study of the Dislocations in Plastically Deformed Synthetic Quartz.” Physica Status Solidi 33, no. 2: 657–668.
Means, W. D., and Z. G. Xia. 1981. “Deformation of Crystalline Materials in Thin Section.” Geology 9, no. 11 (November): 538–543.
Means, W. D. 1989. “Synkinematic Microscopy of Transparent Polycrystals.” Journal of Structural Geology 11, no. 1–2: 163–174.
Means, W. D. 1990. “Kinematics, Stress, Deformation and Material Behavior.” Journal of Structural Geology 12, no. 8: 953–971.
Menegon, Luca, Florian Fusseis, Holger Stünitz, and Xianghui Xiao. 2015. “Creep Cavitation Bands Control Porosity and Fluid Flow in Lower Crustal Shear Zones.” Geology 43, no. 3 (March): 227–230.
Middleton, Larry T., and David K. Elliott. 2003. “Tonto Group.” In Grand Canyon Geology. 2nd ed. Edited by Stanley S. Beus, and Michael Morales, 90–106. New York, New York: Oxford University Press.
Mitra, Shankar, and Jan Tullis. 1979. “A Comparison of Intracrystalline Deformation in Naturally and Experimentally Deformed Quartzites.” Tectonophysics 53, nos. 1–2 (1 March): T21–T27.
Miyakawa, Kazuya, and Iwao Kawabe. 2014. “Pressure Solution of Quartz Aggregates Under Low Effective Stress (0.42–0.61 MPa) at 25–45°C.” Applied Geochemistry 40 (January): 61-69.
Morales, Michael. 2003. “Mesozoic and Cenozoic Strata of the Colorado Plateau Near the Grand Canyon.” In Grand Canyon Geology. 2nd ed. Edited by Stanley S. Beus, and Michael Morales, 212–221. New York, New York: Oxford University Press.
Morris, S. J. S., and Ian Jackson. 2009. “Diffusionally Assisted Grain-Boundary Sliding and Viscoelasticity of Polycrystals.” Journal of Mechanics and Physics of Solids 57, no. 4 (April): 744–761.
Mühlhaus, H.-B., F. Dufour, L. Moresi, and Bruce E. Hobbs. 2002. “A Director Theory for Visco-Elastic Folding Instabilities in Multilayered Rock.” International Journal of Solids and Structures 39, nos. 13–14 (June–July): 3675–3691.
Mukai, Hiroki, Håkon Austrheim, Christine V. Putnis, and Andrew Putnis. 2014. “Textural Evolution of Plagioclase Feldspar Across a Shear Zone: Implications for Deformation Mechanism and Rock Strength.” Journal of Petrology 55, no. 8 (August): 1457–1477.
Murrell, Stanley A. F. 1990. “Brittle-to-Ductile Transitions in Polycrystalline Non-Metallic Materials.” In Deformation Processes in Minerals, Ceramics and Rocks. Edited by D. J. Barber, and P. G. Meredith, 109–137. Boston, Massachusetts: Unwin Hyman.
Nabavi, Seyed Tohid, and Haakon Fossen. 2021. “Fold Geometry and Folding—A Review.” Earth-Science Reviews 222 (November): 103812
Naeser, Chris W., Ian R. Duddy, Donald P. Elston, Terry A. Dumitru, and Paul F. Green. 1989. “Fission-Track Dating: Ages for Cambrian Strata and Laramide and Post-Middle Eocene Cooling Events from the Grand Canyon, Arizona.” In Geology of Grand Canyon, Northern Arizona (with Colorado River Guides). Edited by Donald P. Elston, George H. Billingsley, and Richard A. Young, 139–144. Washington, DC: American Geophysical Union.
Naeser, Chris W., Ian R. Duddy, Donald P. Elston, Terry A. Dumitru, and Paul F. Green. 2001. “Fission-Track Analysis of Apatite and Zircon from the Grand Canyon, Arizona.” In Colorado River: Origin and Evolution. Edited by Richard A. Young, and Earle E. Spamer, 31–36. Grand Canyon, Arizona: Grand Canyon Association, Monograph 12.
Narr, W., and John Suppe. 1991. “Joint Spacing in Sedimentary Rocks.” Journal of Structural Geology 13, no. 9: 1037–1048.
Nicolas, A., and Jean-Paul Poirier. 1976. Crystalline Plasticity and Solid State Flow in Metamorphic Rocks. New York, New York: Wiley Interscience.
Nino, Fernañdo, Hervé Philip, and Jean Chéry. 1998. “The Role of Bed-Parallel Slip in the Formation of Blind Thrust Faults.” Journal of Structural Geology 20, no. 5 (14 May): 503–516.
Noble, Levi F. 1914. “The Shinumo Quadrangle, Grand Canyon District, Arizona.” U.S. Geological Survey Bulletin 549.
Noble, Levi F. 1922. “A Section of the Paleozoic Formations of the Grand Canyon at the Bass Trail.” U.S. Geological Survey Professional Paper 131-B: 23–73.
Passchier, Cees W., and Rudolph A. J. Trouw. 1996. Microtectonics. Berlin, Germany: Springer-Verlag.
Paterson, Mervyn S., and Francis J. Turner. 1970. “Experimental Deformation of Constrained Crystals of Calcite in Extension.” In Experimental and Natural Rock Deformation. Edited by P. Paulitsch, 109–141. Berlin, Germany: Springer-Verlag.
Paterson, Mervyn S. 1978. Experimental Rock Deformation—The Brittle Field. Berlin, Germany: Springer-Verlag.
Paterson, Mervyn S. 2001. “A Granular Flow Theory for the Deformation of Partially Molten Rock.” Tectonophysics 335, nos. 1–2 (June): 51–61.
Peak, B. A., Rebecca M. Flowers, F. A. Macdonald, and J. m. Cottle. 2021. “Zircon (U-Th)/He Thermochronology Reveals Pre-Great Unconformity Paleotopography in the Grand Canyon Region, USA.” Geology 49, no. 12 (August 12): 1462–1466.
Peters, Shanan E., and Robert R. Gaines. 2012. “Formation of the ‘Great Unconformity’ as a Trigger for the Cambrian Explosion.” Nature 484, no. 7394 (April 18): 363–366.
Pettijohn, Francis J., Paul E. Potter, and Raymond Siever. 1973. Sand and Sandstone. Berlin, Germany: Springer-Verlag.
Poirier, Jean-Paul., and Michel Guillopé. 1979. “Deformation Induced Recrystallization of Minerals.” Bulletin de Minéralogie 102, nos. 1–2: 67–74.
Poirier, Jean-Paul. 1985. Creep of Crystals. High-Temperature Deformation Processes in Metals, Ceramics and Minerals. New York, New York: Cambridge University Press.
Pollastro, Richard M. 1993. “Considerations and Applications of the Illite/Smectite Geothermometer in Hydrocarbon-Bearing Rocks of Miocene to Mississippian Age.” Clays and Clay Minerals 41, no. 2 (April): 119–133.
Powell, Chris McA. 1982. “Overgrowths and Mica Beards on Rounded Quartz Grains Enclosed by Cleavage Folia.” In Atlas of Deformational and Metamorphic Rock Fabrics. Edited by Graham J. Borradaile, M. Brian Bayly, and Chris McA. Powell, 300–301. New York, New York: Springer-Verlag.
Powers, Maurice Cary. 1953. “A New Roundness Scale for Sedimentary Particles.” Journal of Sedimentary Petrology 23, no. 2 (1 June): 117–119.
Pytte, A. m., and R. C. Reynolds. 1989. “The Thermal Transformation of Smectite to Illite.” In Thermal History of Sedimentary Basins. Edited by Nancy D. Naeser and Thane H. McCulloh, 133–140. Berlin, Germany: Springer-Verlag.
Ramsay, John G. 1967. Folding and Fracturing of Rocks. New York, New York: McGraw-Hill.
Ramsay, John G. 1974. “Development of Chevron Folds.” Geological Society of America Bulletin 85, no. 11 (November): 1741–1754.
Reches, Ze’ev. 1978a. “Development of Monoclines: Part I. Structure of the Palisades Creek Branch of the East Kaibab Monocline, Grand Canyon, Arizona.” In Laramide Folding Associated with Basement Block Faulting in the Western United States. Edited by Vincent Matthews III, 235–271. Boulder, Colorado: Geological Society of America, Memoir 151.
Reches, Ze’ev. 1978b. “Analysis of Faulting in Three-Dimensional Strain Field.” Tectonophysics 47, nos. 1–2 (19 May): 109–129.
Reches, Ze’ev, and Arvid M. Johnson. 1978. “Development of Monoclines: Part II. Theoretical Analysis of Monoclines.” In Laramide Folding Associated with Basement Block Faulting in the Western United States. Edited by Vincent Matthews III, 273–311. Boulder, Colorado: Geological Society of America, Memoir 151.
Reches, Ze’ev, and James H. Dieterich. 1983. “Faulting of Rocks in Three-Dimensional Strain Fields. I. Failure of Rocks in Polyaxial, Servo-Control Experiments.” Tectonophysics 95, nos. 1–2 (20 May): 111–132.
Reches, Ze’ev. 1983. “Faulting of Rocks in Three-Dimensional Strain Fields. II. Theoretical Analysis.” Tectonophysics 95, nos. 1–2 (20 May): 133–156.
Ree, J.-H. 1994. “Grain Boundary Sliding and Development of Grain Boundary Openings in Experimentally Deformed Octachloropropane.” Journal of Structural Geology 16, no. 3 (March): 403–418.
Renac, C., and A. Meunier. 1995. “Reconstruction of Palaeothermal Conditions in the Passive Margin Using Illite-Smectite Mixed-Layer Series (BA1 Scientific Deep Drill-Hole, Ardeche, France).” Clay Minerals 30, no. 2 (1 June): 107–118.
Resser, Charles E. 1945. “Cambrian Fossils of the Grand Canyon: Part II. Cambrian History of the Grand Canyon Region.” Carnegie Institute of Washington Publication 563, 168–232. Washington, DC: Carnegie Institute of Washington.
Rettger, R. E. 1935. “Experiments on Soft-Rock Deformation.” Bulletin of the American Association of Petroleum Geologists 19, no. 2 (February): 271–292.
Robinson, D., and R. J. Merriman. 1999. “Low-Temperature Metamorphism: An Overview.” In Low-Grade Metamorphism. Edited by Martin Frey, and D. Robinson, 1–9. Oxford, United Kingdom: Blackwell.
Rose, Eben C. 2003. “Depositional Environment and History of the Cambrian Tonto Group, Grand Canyon, Arizona.” M.S. Thesis (unpublished). Northern Arizona University, Flagstaff, Arizona.
Rose, Eben C. 2006. “Nonmarine Aspects of the Cambrian Tonto Group of the Grand Canyon, USA, and Broader Implications.” Palaeoworld 15, nos. 3–4 (August–November): 223–241.
Rose, Eben C. 2011. “Proposed Modification of the Nomenclature and Revised Depositional Model for the Cambrian Tonto Group of the Grand Canyon, Arizona.” In Cambrian Stratigraphy and Paleontology of Northern Arizona and Southern Nevada, The 16th Field Conference of the Cambrian Stage Subdivision Working Group, International Subcommission on Cambrian Stratigraphy. Edited by J. Stewart Hollingsworth, Frederick A. Sundberg, and John R. Foster, 77–98. Flagstaff, Arizona: Museum of Northern Arizona, Bulletin 67.
Roth, Wolfgang H., Joel Sweet, and Richard E. Goodman. 1982. “Numerical and Physical Modeling of Flexure Slip Phenomena and Potential for Fault Movement.” Rock Mechanics Supplement 12: 27–46.
Rowland, Richards A. 1946. “Grain-Shape Fabrics of Clastic Quartz.” Geological Society of America Bulletin 57, no. 6 (June 1): 547–564.
Rowland, Stephen M., Gerald D. Osborn, and David J. Graber. 1995. “Lower Paleozoic Stratigraphy of Fern Glen Canyon, Central Grand Canyon, Arizona.” Journal of the Arizona-Nevada Academy of Science 28, nos. 1/2: 1–11.
Rutter, Ernest H. 1974. “The Influence of Temperature, Strain Rate and Interstitial Water on the Experimental Deformation of Calcite Rocks.” Tectonophysics 22, nos. 3–4 (June): 311–334.
Rutter, Ernest H. 1976. “The Kinetics of Rock Deformation by Pressure Solution.” Philosophical Transactions of the Royal Society of London A283, no. 1312 (October 12): 203–219.
Sandhu, A. S., Lakhwant Singh, R. C. Ramola, Surinder Singh, and H. S. Virk. 1990. “Fission Track Annealing in Minerals.” Nuclear Tracks and Radiation Measurements 17, no. 3: 267–269.
Sanz, Pablo F., Ronaldo I. Borja, and David D. Pollard. 2007. “Mechanical Aspects of Thrust Faulting Driven by Far-Field Compression and Their Implications for Fold Geometry.” Acts Geotechnica 2, no. 1 (18 April): 17–31.
Sanz, Pablo F., David D. Pollard, Patricia F. Allwardt, and Ronaldo I. Borja. 2008. “Mechanical Models of Fracture Reactivation and Slip on Bedding Surfaces During Folding of the Asymmetric Anticline at Sheep Mountain, Wyoming.” Journal of Structural Geology 30, no. 9 (September): 1177–1191.
Schieber, Juergen, John B. Southard, Patrick Kissling, Britt Rossman, and Robert Ginsburg. 2013. “Experimental Deposition of Carbonate Mud from Moving Suspensions: Importance of Flocculation and Implications for Modern and Ancient Carbonate Mud Deposition.” Journal of Sedimentary Research 83: 1025–1031.
Schmid, Stefan M., J. N. Boland, and Mervyn S. Paterson. 1977. “Superplastic Flow in Finegrained Limestone.” Tectonophysics 43, nos. 3–4 (10 December): 257–292.
Schmid, Stefan M. 1982. “Microfabric Studies as Indicators of Deformation Mechanisms and Flow Laws Operative in Mountain Building.” In Mountain Building Processes. Edited by K. J. Hsü, 95–110. London, United Kingdom: Academic Press.
Schmid, Stefan M., and M. Casey. 1986. “Complete Fabric Analysis of Some Commonly Observed Quartz c-Axis Patterns.” In Mineral and Rock Deformation: Laboratory Studies (The Paterson Volume). Edited by Bruce E. Hobbs, and H. C. Heard, 263–286. Washington, DC: American Geophysical Union, Geophysical Monograph. Vol. 36.
Schmid, Stefan M., R. Panozzo, and S. Bauer. 1987. “Simple Shear Experiments on Calcite Rocks: Rheology and Microfabric.” Journal of Structural Geology 9, nos. 5–6: 747–778.
Schmid, Stefan M., Mervyn S. Paterson and J. N. Boland. 1980. “High Temperature Flow and Dynamic Recrystallization in Carrara Marble.” Tectonophysics 65, nos. 3–4 (1 June): 245–280.
Scholle, Peter A. 1979. A Color Illustrated Guide to Constituents, Textures, Cements, and Porosities of Sandstones and Associated Rocks. Tulsa, Oklahoma: The American Association of Petroleum Geologists, Memoir 28.
Scholle, Peter A., and Dana S. Ulmer-Scholle. 2003. A Color Guide to the Petrography of Carbonate Rocks: Grains, Textures, Porosity, Diagenesis. Tulsa, Oklahoma: The American Association of Petroleum Geologists, Memoir 77.
Schuchert, Charles. 1918. “The Cambrian of the Grand Canyon of Arizona.” American Journal of Science, 4th Series 45: 362–369.
Schultz, Richard A. 2019. Geologic Fracture Mechanics. Cambridge, United Kingdom: Cambridge University Press.
Shea, William T., Jr., and Andreas K. Kronenberg. 1993. “Strength and Anisotropy of Foliated Rocks with Varied Mica Contents.” Journal of Structural Geology 15, nos. 9–10 (September–October): 1097–1121.
Silliphant, Laura J., Terry Engelder, and Michael R. Gross. 2002. “The State of Stress in the Limb of the Split Mountain Anticline, Utah: Constraints Placed by Transected Joints.” Journal of Structural Geology 24, no. 1 (January): 155–172.
Simo, J. C., and R. L. Taylor. 1985. “Consistent Tangent Operators for Rate-Independent Elastoplasticity.” Computer Methods in Applied Mechanics and Engineering 48, no. 1 (February): 101–118.
Simpson, Carol. 1986. “Fabric Development in Brittle-to-Ductile Shear Zones.” Pure and Applied Geophysics 124, nos. 1–2 (January): 269–288.
Sloss, Laurence L. 1963. “Sequences in the Cratonic Interior of North America.” Geological Society of America Bulletin 42, no. 2 (February): 93–114.
Smart, G., and T. Clayton. 1985. “The Progressive Illitization of Interstratified Illite-Smectite from Carboniferous Sediments of Northern England and its Relationship to Organic Maturity Indicators.” Clay Minerals 30, no. 4 (December): 455–466.
Snelling, Andrew A. 2000. “Geochemical Processes in the Mantle and Crust.” In Radioisotopes and the Age of the Earth: A Young-Earth Creationist Research Initiative. Edited by Larry Vardiman, Andrew A. Snelling, and Eugene F. Chaffin, 123–304. El Cajon, California: Institute for Creation Research, and St. Joseph, Missouri: Creation Research Society.
Snelling, Andrew A. 2005a. “Radiohalos in Granites: Evidence for Accelerated Nuclear Decay.” In Radioisotopes and the Age of the Earth: Results of a Young-Earth Creationist Research Initiative. Edited by Larry Vardiman, Andrew A. Snelling, and Eugene F. Chaffin, 101–207. El Cajon, California: Institute for Creation Research, and Chino Valley, Arizona: Creation Research Society.
Snelling, Andrew A. 2005b. “Fission Tracks in Zircons: Evidence for Abundant Nuclear Decay.” In Radioisotopes and the Age of the Earth: Results of a Young-Earth Creationist Research Initiative. Edited by Larry Vardiman, Andrew A. Snelling, and Eugene F. Chaffin, 209–324. El Cajon, California: Institute for Creation Research, and Chino Valley, Arizona: Creation Research Society.
Snelling, Andrew A. 2009. Earth’s Catastrophic Past: Geology Creation and the Flood. Dallas, Texas: Institute for Creation Research.
Snelling, Andrew A. 2017a. “Determination of the Decay Constants and Half-Lives of Uranium-238 (238U) and Uranium-235 (235U), and the Implications for U-Pb and Pb-Pb Radioisotope Dating Methodologies.” Answers Research Journal 10 (January 18): 1–38. https://answersresearchjournal.org/radioisotope-decay-uranium/.
Snelling, Andrew A. 2017b. “Problems with the U-Pb Radioisotope Dating Methods—1. Common Pb.” Answers Research Journal 10 (July 26): 121–167. https://answersresearchjournal.org/problems-radioisotope-dating-u-pb-1/.
Snelling, Andrew A. 2018. “Problems with the U-Pb Radioisotope Dating Methods—2. U and Pb Mobility.” Answers Research Journal 11 (June 13): 85–140. https://answersresearchjournal.org/problems-radioisotope-dating-u-pb-2/.
Snelling, Andrew A. 2019. “Problems with the U-Pb Radioisotope Dating Methods—3. Mass Fractionation.” Answers Research Journal 12 (November 13): 355–392. https://answersresearchjournal.org/problems-radioisotope-dating-u-pb-3/.
Snelling, Andrew A. 2021a. “The Petrology of the Tapeats Sandstone, Tonto Group, Grand Canyon, Arizona.” Answers Research Journal 14 (June 23): 159–254. https://answersresearchjournal.org/petrology-tapeats-sandstone-tonto-group/.
Snelling, Andrew A. 2021b. “The Petrology of the Bright Angel Formation, Tonto Group, Grand Canyon, Arizona.” Answers Research Journal 14 (September 8): 303–414. https://answersresearchjournal.org/petrology-bright-angel-tonto-group/.
Snelling, Andrew A. 2022a. “The Petrology of the Muav Formation, Tonto Group, Grand Canyon, Arizona.” Answers Research Journal 15 (August 10): 139–262. https://answersresearchjournal.org/geology/petrology-muav-formation-tonto-group/.
Snelling, Andrew A. 2022b. The Genesis Flood Revisited. Green Forest, Arkansas: Master Books, and Hebron, Kentucky: Answers in Genesis.
Snelling, Andrew A. 2023a. “The Carbon Canyon Fold, Eastern Grand Canyon, Arizona.” Answers Research Journal 16 (February 22): 1–124. https://answersresearchjournal.org/geology/carbon-canyon-fold-arizona/.
Snelling, Andrew A. 2023b. “The Monument Fold, Central Grand Canyon, Arizona.” Answers Research Journal 16 (August 9): 301–432. https://answersresearchjournal.org/geology/monument-fold-grand-canyon/.
Snelling, Andrew A. 2024. “The Whitmore Helipad Fold, Western Grand Canyon, Arizona.” Answers Research Journal 17 (February 28): 63–192. https://answersresearchjournal.org/geology/whitmore-helipad-fold/.
Spry, Alan. 1969. Metamorphic Textures. Oxford, United Kingdom: Pergamon.
Stel, H. 1986. “The Effect of Cyclic Operation of Brittle and Ductile Deformation on the Metamorphic Assemblage in Cataclasites and Mylonites.” Pure and Applied Geophysics 124, nos. 1–2 (January): 289–307.
Stünitz, Holger. 1998. “Syndeformational Recrystallization—Dynamic or Compositionally Induced?” Contributions to Mineralogy and Petrology 131, nos. 2–3 (April): 219–236.
Stünitz, Holger, and J. D. F. Fitz Gerald. 1993. “Deformation of Granitoids at Low Metamorphic Grade. II: Granular Flow in Albite-Rich Mylonites.” Tectonophysics 221, nos. 3–4 (30 May): 299–324.
Sundberg, Marshall, and Reid F. Cooper. 2010. “A Composite Viscoelastic Model for Incorporating Grain Boundary Sliding and Transient Diffusion Creep: Correlating Creep and Attenuation Responses for Materials with a Fine Grain Size.” Philosophical Magazine 90, no. 20 (28 May): 2817–2840.
Suppe, John. 1983. “Geometry and Kinematics of Fault-Bend Folding.” American Journal of Science 283, no. 7 (September): 648–721.
Suppe, John., and Donald Medwedeff. 1990. “Geometry and Kinematics of Fault-Propagation Folding.” Ecologae Geologicae Helvetiae 83, no. 3 (January): 409–454.
Tanner, P. W. Geoff. 1989. “The Flexural-Slip Mechanism.” Journal of Structural Geology 11, no. 6: 635–655.
Tapp, Bryan, and Ken Wolgemuth. 2016. “Broken and Bent Rock: Fractures, Faults, and Folds”. In The Grand Canyon, Monument to an Ancient Earth; Can Noah’s Flood Explain the Grand Canyon? Edited by Carol A. Hill, Gregg Davidson, Tim Helble, and Wayne Ranney, 116–127. Grand Rapids, Michigan: Kregel Publications.
Thurston, Olivia G., William R. Guenthner, Karl E. Karlstrom, Jason W. Ricketts, Matthew T. Heizler, and J. Michael Timmons. 2022. “Zircon (U-Th)/He Thermochronology of Grand Canyon Resolves 1250 Ma Unroofing at the Great Unconformity and <20 Ma Canyon Carving.” Geology 50, no. 2 (November 2): 222–226.
Tindall, Sarah E., and George H. Davis. 1999. “Monocline Development by Oblique-Slip Fault-Propagation Folding: The East Kaibab Monocline, Colorado Plateau, Utah.” Journal of Structural Geology 21, no. 10 (October): 1303–1320.
Tullis, Jan. 1983. “Deformation of Feldspars.” In Feldspar Mineralogy. 2nd ed. Edited by Paul H. Ribbe, 297–323. Washington, DC: Mineralogical Society of America, Reviews in Mineralogy. Vol. 2.
Tullis, Jan, John M. Christie, and David T. Griggs. 1973. “Microstructures and Preferred Orientations of Experimentally Deformed Quartzites.” Geological Society of America Bulletin 84, no. 1 (January 1): 297–314.
Tullis, Jan, and Richard A. Yund. 1987. “Transition from Cataclastic Flow to Dislocation Creep of Feldspar: Mechanisms and Microstructures.” Geology 15, no. 7 (July 1): 606–609.
Tullis, Jan, and Richard A. Yund. 1991. “Diffusion Creep in Feldspar Aggregates: Experimental Evidence.” Journal of Structural Geology 13, no. 9: 987–1000.
Tullis, Jan, Holger Stünitz, C. Teyssier, and R. Heilbronner. 2000. “Deformation Microstructures in Quartzo-Feldspathic Rocks.” In Stress, Strain and Structure: A Volume in Honor of Win Means. Edited by Mark W. Jessell, and Janos L. Urai. Journal of the Virtual Explorer 2.
Tullis, Jan, Richard A. Yund, and J. Farver. 1996. “Deformation-Enhanced Fluid Distribution in Feldspar Aggregates and Implications for Ductile Shear Zones.” Geology 24, no. 1 (January): 63–66.
Turner, Francis J. 1948. “Note on the Significance of Deformation Lamellae in Quartz and Calcite.” Eos Transactions of the American Geophysical Union 29, no. 4 (August): 556–569.
Twiss, Robert J. 1974. “Structure and Significance of Planar Deformation Features in Synthetic Quartz.” Geology 2, no. 7 (July 1): 329–332.
Twiss, Robert J. 1976. “Some Planar Deformation Features, Slip Systems, and Submicroscopic Structures in Synthetic Quartz.” The Journal of Geology 84, no. 6 (November): 701–724.
Udden, Johan August. 1914. “Mechanical Composition of Clastic Sediments.” Bulletin of the Geological Society of America 25, no. 1 (January 1): 655–744.
Ulmer-Scholle, Dana S., Peter A. Scholle, Juergen Schieber, and Robert J. Raine. 2015. A Color Guide to the Petrography of Sandstones, Siltstones, Shales and Associated Rocks. Tulsa, Oklahoma: The American Association of Petroleum Geologists, Memoir 109.
Urai, Janos L. 1983. “Water-Assisted Dynamic Recrystallization and Weakening in Polycrystalline Bischofite.” Tectonophysics 96, nos. 1–2 (1 April): 125–157.
Urai, Janos L., W. D. Means, and Gordon S. Lister. 1986. “Dynamic Recrystallization of Minerals.” In Mineral and Rock Deformation: Laboratory Studies (The Paterson Volume). Edited by Bruce E. Hobbs, and H.C. Heard, 161–199. Washington, DC: American Geophysical Union, Geophysical Monograph. Vol. 36.
Vardiman, Larry, Andrew A. Snelling, and Eugene F. Chaffin. eds. 2005. Radioisotopes and the Age of the Earth: Results of a Young-Earth Creationist Research Initiative. El Cajon, California: Institute for Creation Research, and Chino Valley, Arizona: Creation Research Society.
Velde, B., and J. Espitalié. 1989. “Comparison of Kerogen Maturation and Illite/Smectite Composition in Diagenesis.” Journal of Petroleum Geology 12, no. 1 (January): 103–110.
Velde, B., and B. Lanson. 1993. “Comparison of I/S Transformation and Maturity of Organic Matter at Elevated Temperatures.” Clays and Clay Minerals 41 (1 April): 178–183.
Vernon, Ron H. 1965. “Plagioclase Twins in Some Mafic Gneisses from Broken Hill, Australia.” Mineralogical Magazine 35, no. 271 (September): 488–507.
Vernon, Ron H. 1975. “Deformation and Recrystallization of a Plagioclase Grain.” American Mineralogist 60, nos. 9–10 (October 1): 884–888.
Vernon, Ron H. 1976. Metamorphic Processes: Reactions and Microstructure Development. London, United Kingdom: Murby, and New York, New York: Wiley.
Vernon, Ron H. 1977a. “Relationships Between Microstructures and Metamorphic Assemblages.” Tectonophysics 39, nos. 1–3 (20 April): 439–452.
Vernon, Ron H. 1977b. “Microfabric of Mica Aggregates in Partly Recrystallized Biotite.” Contributions to Mineralogy and Petrology 61, no. 2 (January): 175–185.
Vernon, Ron H. 1981. “Optical Microstructure of Partly Recrystallized Calcite in Some Naturally Deformed Marbles.” Tectonophysics 78, nos. 1–4 (1 October): 601–612.
Vernon, Ron H., V. A. Williams, and William F. D’Arcy. 1983. “Grainsize Reduction and Foliation Development in a Deformed Granitoid Batholith.” Tectonophysics 92, nos. 1–3 (10 February): 123–145.
Vernon, Ron H. 2000. Beneath Our Feet: The Rocks of Planet Earth. Cambridge, United Kingdom: Cambridge University Press.
Vernon, Ron H., Scott E. Johnson, and E. A. Melis. 2004. “Emplacement-Related Microstructures in the Margin of a Deformed Pluton: The San José Tonalite, Baja California, México.” Journal of Structural Geology 26, no. 10 (October): 1867–1884.
Vernon, Ron H. 2018. A Practical Guide to Rock Microstructure. 2nd ed. Cambridge, United Kingdom: Cambridge University Press.
Walcott, Charles D. 1890. “Study of a Line of Displacement in the Grand Canyon of the Colorado in Northern Arizona.” Geological Society of America Bulletin 1: 49–64.
Waldron, John W. F., and Jean-François Gagnon. 2011. “Recognizing Soft-Sediment Structures in Deformed Rocks of Orogens.” Journal of Structural Geology 33, no. 3 (March): 271–279.
Wanless, Harold R., Jr. 1973. “Cambrian of the Grand Canyon—A Reevaluation of the Depositional Environment.” Ph.D. Thesis (unpublished). Johns Hopkins University, Baltimore, Maryland..
Wanless, Harold R., Jr. 1975. “Carbonate Tidal Flats of the Grand Canyon Cambrian.” In Tidal Flats – A Casebook of Recent Examples and Fossil Counterparts. Edited by R.N. Ginsburg, 269–277. New York, New York: Springer-Verlag.
Watanabe, Hiroyuki, Kouhei Kurimoto, Tokuteru Uesugi, Yorinobu Takigawa, and Kenji Higashi. 2013. “Accommodation Mechanisms for Grain Boundary Sliding as Inferred from Texture Evolution During Superplastic Deformation.” Philosophical Magazine 93, no. 22 (29 April): 2913–2931.
Weinberg, David M. 1979. “Experimental Folding of Rocks Under Confining Pressure: Part VII. Partially Scaled Models of Drape Folds.” Tectonophysics 54, nos. 1–2 (10 April): 1–24.
Wentworth, Chester K. 1922. “A Scale of Grade and Class Terms for Clastic Sediments.” The Journal of Geology 30, no. 5 (July–August): 377–392.
Wheeler, Russell B., and Albert R. Kerr. 1936. “Preliminary Report on the Tonto Group of the Grand Canyon, Arizona.” Grand Canyon Natural History Association Bulletin 5: 1–16.
Wheeler, John. 1992. “Importance of Pressure Solution and Coble Creep in the Deformation of Polymineralic Rocks.” Journal of Geophysical Research 97, no. B4 (10 April): 4579–4586.
Whisonant, Robert C. 1970. “Influence of Texture upon the Response of Detrital Quartz to Deformation of Sandstones.” Journal of Sedimentary Petrology 40, no. 3 (1 September): 1018–1025.
White, S. 1973a. “Syntectonic Recrystallization and Texture Development in Quartz.” Nature 422, no. 5144 (3 August): 276-278.
White, S. 1973b. “Deformation Lamellae in Naturally Deformed Quartz.” Nature: Physical Science 245 (10 September): 26–28.
White, S. H. 1977. “Geological Significance of Recovery and Recrystallization Processes in Quartz.” Tectonophysics 39, nos. 1–3 (20 April): 143–170.
Whitmore, John H., and Paul A. Garner. 2008. “Using Suites of Criteria to Recognize Pre-Flood, Flood, and Post-Flood Strata in the Rock Record with Application to Wyoming (USA).” In Proceedings of the Sixth International Conference on Creationism. Edited by Andrew A. Snelling, 425–448. Pittsburgh, Pennsylvania: Creation Science Fellowship; and Dallas, Texas: Institute for Creation Research.
Wiens, Roger. 2016. “So Just How Old is That Rock?” In The Grand Canyon, Monument to an Ancient Earth; Can Noah’s Flood Explain the Grand Canyon? Edited by Carol A. Hill, Gregg Davidson, Tim Helble, and Wayne Ranney, 88–97. Grand Rapids, Michigan: Kregel Publications.
Wilson, Colin J. L., and Ian A. Bell. 1979. “Deformation of Biotite and Muscovite: Optical Microstructures.” Tectonophysics 58, nos. 1–2 (10 September): 179–200.
Wintsch, R. P., and Keewook Yi. 2002. “Dissolution and Replacement Creep: A Significant Deformation Mechanism in Mid-Crustal Rocks.” Journal of Structural Geology 24, nos. 6–7 (June–July): 1179–1193.
Wolf, Karl H., and George V. Chilingarian. 1975. “Diagenesis of Sandstones and Compaction.” In Compaction of Coarse-Grained Sediments. I. Edited by George V. Chilingarian and Karl H. Wolf, 69–444. Amsterdam, The Netherlands: Elsevier, Developments in Sedimentology 18A.
Wojtal, Steven, Tom Blenkinsop, and Basil Tikoff. 2022. An Integrated Framework for Structural Geology: Kinematics, Dynamics, and Rheology of Deformed Rocks. Hoboken, New Jersey: John Wiley and Sons.
Wright, V. P. 1992. “A Revised Classification of Limestones.” Sedimentary Geology 76, nos. 3–4: 177–185.
Yardley, Bruce W. D., W. S. MacKenzie, and C. Guildford. 1990. Atlas of Metamorphic Rocks and Their Textures. Essex, United Kingdom: Longman.
Yund, Richard A., and Jan Tullis. 1991. “Compositional Changes of Minerals Associated with Dynamic Crystallization.” Contributions to Mineralogy and Petrology 108, no. 3 (September): 346–355.
Zeitler, Peter K. 1985. “Closure Temperature Implications of Concordant 40Ar/39Ar Potassium Feldspar and Zircon Fission-Track Ages from High-Grade Terranes.” Nuclear Tracks 10, no. 3: 441–442.
Zhamaletdinov, Abdullkhay A. 2019. “On the Nature of the Brittle-Ductile Transition Zone in the Earth’s Crust (Review).” In The Study of Continental Lithosphere Electrical Conductivity, Temperature and Rheology. Edited by Abdullkhay A. Zhamaletdinov, and Yury L. Rebetsky, 13–21. Springer Proceedings in Earth and Environmental Sciences. Cham, Switzerland: Springer International Publishing.
Supplementary Material
Appendix—Location and Petrographic Descriptions of Muav Formation Samples.