The views expressed in this paper are those of the writer(s) and are not necessarily those of the ARJ Editor or Answers in Genesis.
Abstract
Cephalopods are variable and very interesting animals, including octopuses, squids, cuttlefish, and nautiluses. They are deemed to be the most intelligent invertebrate group known to taxonomy. Cephalopods are underrepresented in both genome sequencing projects as well as baraminology studies. However, mitochondrial genome sequences for 47 cephalopod species as well as morphological character data sets are available for this group of invertebrate animals, two of which were used in this study. Using sequence alignment and clustering methods on whole mitochondrial genome sequences, five putative baramins were discovered—octopuses, squids I and II, cuttlefish, and nautiluses. However, even though analyzing the mitochondrial genome may have its advantages, the mitochondrial genome is only less than 0.01% of the nuclear genome, and does not contain enough information to draw final conclusions. The results from the genome analysis study were augmented with the analysis of two morphological character sets which, when combined cover 72 cephalopod species, even fossil taxa which represent the palaeobaramin. In total, 106 species were studied by at least one method. The first morphological analysis suggests that Decapods and Octopods each form a single holobaramin, whereas the second morphological analysis suggests that nautiluses form a separate, third holobaramin within the class Cephalopoda. These results are interesting; however, it would still be useful to further analyze cephalopod baramins in order to get a fully clear picture of the baraminic relationships within this class of invertebrate species.
Keywords: cephalopod, squid, cuttlefish, octopus, nautilus, mitochondrion, BDIST
Cephalopoda is a class of mollusks which is made up of the extant subclasses Coleoidea (coleoids), and Nautiloidea (nautiloids). According to the classification of Habe, Okutani, and Nishiwaki (1994), Coleoidea is divided into five orders, Sepiida, Sepiolida, Teuthida, Octopoda (octopuses), and Vampyromorpha (vampire squid). Octopoda is subdivided into two groups, Cirrata and Incirrata, characterized by a small internal shell and fins on their heads, or lack thereof. There are more than 800 extant species of cephalopods (Sanchez et al. 2018), exhibiting a high degree of morphological variability, belonging to 47 families and 139 genera. Cephalopods also live in places such as along the shallow coastline down to the deep ocean. They also range in size from 10 mm, such as species of Idiosepius to the giant squid, Architeuthis dux, which can reach as long as 42 m (Lindgren, Giribet, and Nishiguchi 2004). Many species exhibit bioluminescence (Bush, Robison, and Caldwell 2009).
According to Genesis 1:20–22 God created great whales and moving creatures in the waters on Day Five of creation. This would include cephalopods, even though some species such as octopuses have been known to hunt on land, and some squid species, such as the Japanese flying squid (Todarodes pacificus) have been known to sail as far as 30 m above the surface of the water in groups for several seconds.
The evolutionary phylogenetics of cephalopods is highly inconsistent and confusing (Lindgren, Giribet, Nishiguchi 2004; Steele et al. 2018). The fossil record of cephalopods is very rich, with many extinct cephalopods bearing a cone-shaped shell (Kröger, Vinther, and Fuchs 2011). Some evolutionists think that octopuses are derived from belemnites, an extinct order of cephalopods (Bergman 2017), which have three morphological variants, which is relatively diverse for such supposedly early cephalopod forms (Iba, Sano, and Mutterlose 2014). According to other theories, cephalopods evolved from monoplacophoran-like ancestors, however, deeper evolutionary relationships based on molecular-based phylogenetic trees are missing (Kröger, Vinther, and Fuchs 2011). Molecular studies also show contradictory topologies of phylogenetic trees, based on several mitochondrial genes (Strugnell and Nishiguchi 2007).
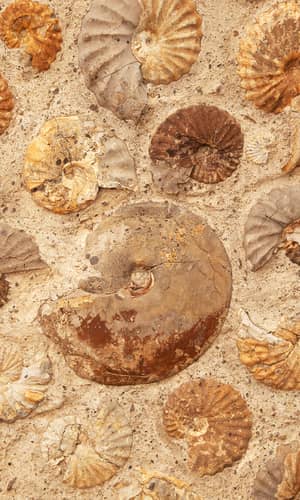
There are actually several soft-bodied cephalopod fossils which have been described in the scientific literature, despite their lack of bones or hard tissue; species with shells such as the nautiluses being fairly represented in the fossil record. Fig. 1 shows the smooth spiral shell of a fossilized Nautilus species found in the Gerecse mountains in Hungary (indicating that this land-locked country was covered by the waters of the Flood sometime during the past). Fossil cephalopods very much resemble their modern-day counterparts. Octopuses have always been octopuses and show no signs of change in the fossil record (Sherwin 2016). For example, Kruta et al. (2014) described a form of fossil octopus called Proteroctopus ribeti, which was discovered in 1982 in La Boissine, France, and which very much resembles the modern Vampyroteuthis, the so-called vampire squid. Based on morphological reconstructions, both species have fins on both sides of its mantle, both lack an ink sac, and both have eight arms. Based on the morphological similarities, it is likely that this species is a living fossil.
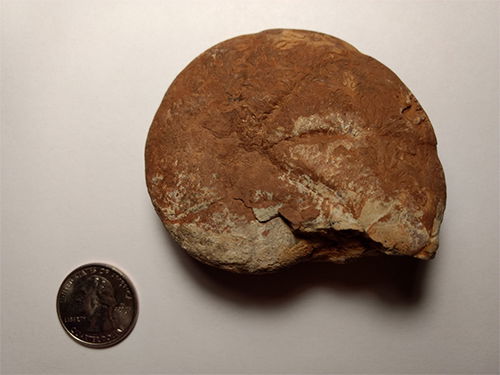
Fig. 1. Image of a fossil Nautilus from the Gerecse mountains west of Budapest.
Cephalopods are underrepresented in both genome sequencing projects as well as baraminology studies, with the majority of baraminology studies including vertebrates and plants (Wood 2016). However, with a large number of mitochondrial genome sequences available for a large number of species, a preliminary baraminology study of cephalopod species is still possible based on analyzing the mitochondrial genome. Furthermore, two morphological data sets by Lindgren, Giribet, and Nishiguchi (2004), and Sutton, Perales-Raya, and Gilbert (2015) will be analyzed to augment the mitochondrial genome study in order to accurately define baramins within the cephalopods.
Baraminic analysis of cephalopods based on the mitochondrial genome
According to the Cephalopod Sequencing Consortium, both octopods and decapods have estimated genome sizes ranging from 2.1–4.5 Gbp (Albertin et al. 2012). These genome size values are just estimates as to the size of the cephalopod genomes, meaning that the whole genome sequences are not yet available for these species. However, the mitochondrial genome sequence of 47 cephalopod species were available at the NCBI database. However, the metazoan mitochondrial genome usually carries the same number of genes, which are each other’s orthologs. The analysis of mitochondrial DNA is much simpler than the analysis of the nuclear genome where paralogous genes complicates the picture. Furthermore, analyzing the entire mitochondrial genome sequence is much more advantageous than analyzing single genes, which often produce conflicting tree topologies (Akasaki et al. 2006; Carlini, Reece, and Graves 2000; Strugnell and Nishiguchi 2007; Yokobori et al. 2007).
After downloading these sequences and aligning them, the sequence identity between each of the 1081 combinatorically possible species pairs was determined and visualized (fig. 2). The results correlate well with previous cephalopod mitochondrial DNA studies (Cheng et al. 2013; Strugnell et al. 2017), and will now be discussed in detail.
Fig. 2. Heatmap of the mitochondrial genome sequence similarity for an all-versus-all sequence comparison between 47 cephalopod species. Brighter, yellow/white colors represent higher sequence similarity scores between species pairs (continuity, same baramin). Darker, redder colors represent lower mitochondrial sequence similarity scores (discontinuity, different baramins). Click image for larger view.
Results
Cephalopod holobaramins based on mitochondrial genome alignments
Table 1 lists all 47 species, the accession number of their genome, the length of the mitochondrial genome, as well as the cluster that they were assigned to be k-means clustering. We can see four well-formed clusters, and some smaller clusters and other species which are harder to classify. The statistics for the four main groups are listed in table 2. Data include the name of the putative group, number of species, size of mitochondrial genome as well as p-values showing how significantly the group’s species separate from all other species.
| Latin Name | Accession No. | Mt Genome Length | Cluster No. |
|---|---|---|---|
| Allonautilus scrobiculatus voucher AMNH:AMCC224119 | NC_026997.1 | 16132 | 1 |
| Amphioctopus aegina | KX108697.1 | 15843 | 6 |
| Amphioctopus fangsiao | AB240156.1 | 15979 | 6 |
| Amphioctopus marginatus | KY646153.1 | 15719 | 6 |
| Architeuthis dux isolate 2099 | KC701749.1 | 20332 | 5 |
| Argonauta hians | KY649285.1 | 16130 | 3 |
| Bathyteuthis abyssicola | AP012225.1 | 20075 | 7 |
| Cistopus chinensis | KF017606.1 | 15706 | 6 |
| Cistopus taiwanicus | KF017605.1 | 15793 | 6 |
| Doryteuthis opalescens | KP336703.1 | 17370 | 4 |
| Dosidicus gigas | EU068697.1 | 20324 | 5 |
| Heterololigo bleekeri | AB029616.1 | 17211 | 4 |
| Idiosepius sp. NEH-2013 | KF647895.1 | 16183 | 3 |
| Illex argentinus | KP336702.1 | 20278 | 5 |
| Loligo bleekeri | NC_002507.1 | 17211 | 4 |
| Loligo opalescens isolate 2001 MB-1 | GQ225110.1 | 17387 | 4 |
| Loliolus beka | NC_028034.1 | 17483 | 4 |
| Loliolus japonica | NC_030208.1 | 17232 | 4 |
| Loliolus uyii | NC_026724.1 | 17134 | 4 |
| Nautilus macromphalus | DQ472026.1 | 16258 | 1 |
| Octopus bimaculatus | KT581981.1 | 16084 | 6 |
| Octopus bimaculoides | KU295559.1 | 15733 | 6 |
| Octopus conispadiceus | KJ789854.1 | 16027 | 6 |
| Octopus minor | HQ638215.1 | 15974 | 6 |
| Octopus vulgaris | AB158363.1 | 15744 | 6 |
| Ommastrephes bartramii | AB715401.1 | 20308 | 7 |
| Semirossia patagonica | AP012226.1 | 17086 | 2 |
| Sepia aculeate | NC_022959.1 | 16219 | 8 |
| Sepia apama | AP013073.1 | 16184 | 8 |
| Sepia esculenta | AB266516.1 | 16199 | 8 |
| Sepia latimanus | AP013074.1 | 16225 | 8 |
| Sepia lycidas | AP013075.1 | 16244 | 8 |
| Sepia officinalis | AB240155.1 | 16163 | 8 |
| Sepia pharaonic | KC632521.1 | 16208 | 8 |
| Sepiadarinum austrinum | KX657686.1 | 16775 | 3 |
| Sepiella inermis | KF040369.1 | 16191 | 8 |
| Sepiella japonica | AB675082.1 | 16172 | 8 |
| Sepiella maindroni | KR912215.1 | 16170 | 8 |
| Sepioteuthis lessoniana voucher 269 | KP893075.1 | 16605 | 4 |
| Spirula spirula voucher NMV:Z7946 | KU893141.1 | 15472 | 2 |
| Sthenoteuthis oualaniensis isolate DS-1 | EU658923.1 | 20308 | 5 |
| Todarodes pacificus | AB158364.1 | 20254 | 5 |
| Uroteuthis chinensis | NC_028189.1 | 17353 | 4 |
| Uroteuthis duvaucelii | KR051264.1 | 17413 | 4 |
| Uroteuthis edulis | AB675081.1 | 17351 | 4 |
| Vampyroteuthis infernalis | AB266515.1 | 15617 | 6 |
| Watasenia scintillans | AB240152.1 | 20093 | 7 |
| Holobaramin Name | Number of Species | Mitochondrial Genome Size | p-value |
|---|---|---|---|
| Octopuses | 12 | 15838.1 ± 153.932 | 4.2 × 10-68 |
| Squids I | 5 | 20299.2 ± 32.6374 | 8.4 × 10⁻¹¹ |
| Squids II | 11 | 17250 ± 238.261 | 5.8 × 10⁻³⁴ |
| Cuttlefish | 11 | 16197.5 ± 26.5 | 5.3 × 10-50 |
Octopods
The first cluster includes 11 species of octopods, (with a p-value of 4.2 × 10-68), corresponding to the order Octopodiformes. All of these species belong to the family Octopodidae, except Vampyroteuthis infernalis (the vampire squid), which belongs to the family Vampyroteuthidae. O. bimaculatus and O. bimaculoides have the highest similarity based on mitochondrial genome sequence similarities. These two similar species occur sympatrically. O. vulgaris is also a rather large species complex (Acosta-Jofré et al. 2012).
Many authors think that Vampyromorpha and Octobrachia, the two groups that V. infernalis and Octopodidae belong to are sister taxa, based on developmental and embryological data (von Boletzky 2003), as well as radial sucker symmetry, sperm morphology, and outer statocyst capsules (Lindgren, Giribet, and Nishiguchi 2004). V. infernalis has eight legs, connected by webby skin, and lives in the deep ocean. Carlini, Reece, and Graves (2000) conclude that based on alignments of actin genes, octopods and V. infernalis are monophyletic. The morphology of the gladius (a hard internal body part) is more like that of squids, which have either been lost or reduced in octopods.
Cuttlefish
A second, larger cluster corresponds to the family Sepiidae, the cuttlefish, with ten species, with a p-value of 5.3 × 10-50. Two genera, Sepia and Sepiella belong to this group. Cuttlefish are best characterized by their radulae, their tentacular clubs as well as the shape of their cuttlebone. Evolutionary gene studies show conflicting tree topologies for the mitochondrial COI gene, as well as the mitochondrial 16S and 12S rRNA (Yoshida, Tsuneki, and Furuya 2006), underscoring the importance for analyzing the whole mitochondrial genome and not just a small handful of genes.
Squids I
A third larger cluster with 11 species (with a p-value of 5.8 × 10⁻³⁴) is made up of species from two genera, Loliolus and Uroteuthis, as well as a species from the genera Loligo and Heterloligo. Also, the species Doryteuthis opalescens, Sepioteuthis lessoniana voucher 269, which are squid species which correspond to the order Myopsida, which are characterized by their eyes not coming into direct contact with water.
Squids II
A fourth, smaller cluster includes the species Architeuthis dux isolate 2099, Dosidicus gigas, Illex argentinus, Sthenoteuthis oualaniensis isolate DS-1, and Todarodes pacificus, with a p-value of 8.4 × 10⁻¹¹. These are all squid species, which belong to Oegopsida, a suborder of the coleoid cephalopods, characterized by their eyes coming into direct contact with water. According to Strugnell et al. (2017), the species Watasenia scintillans (the firefly squid) also belongs to this group. According to Strugnell and Nishiguchi (2007) this group is monophyletic, supporting the idea that this group might be a holobaramin.
Other groups
Besides these four well-formed clusters there are species triplets and species pairs which are hard to classify, and due to their small number, it would be better to revisit their baraminic classification with more data.
One species triplet with a low p-value (1.1 × 10⁻⁴) consists of Bathyteuthis abyssicola, Ommastrephes bartramii, and Watasenia scintillans, which belong both to the order Oegopsida and Bathyteuthoidea. It may be that Oegopsida is made up of several groups. Another group of three species, however with an insignificant p-value (0.13) include Argonauta hians, Idiosepius sp. NEH-2013, and Sepiadarium austrinum. A. hians (the winged argonaut) belongs to the order Octopoda, but belongs to a separate family, Argonautidae than the ten species of Octopodidae. Indeed, A. hians differs from the octopuses in that it has a spiral shell.
Spirula spirula voucher NMV Z7946 (the ram’s horn squid) has a light-emitting organ and also an appendage on its mantle which resembles a ram’s horn. It is the only extant species in the genus Spirula, and the family Spirulidae, which belongs to the order Spirulida. It clusters with Semirossia patagonica, which belongs to a separate order of cephalopods, the Sepiolida.
Lastly, two species cluster together, namely Allonautilus scrobiculatus voucher AMNH:AMCC224119 and Nautilus macromphalus, with a mitochondrial genome sequence similarity of 0.904, which is the sixth highest sequence similarity score among all species pairs. These two species belong to an entirely separate suborder of cephalopods than the Coleoidea, to which the other 45 species belong to in this study. Nautiloids are considered to be living fossils, but with substantial nucleotide diversity, according to a study by Combosch et al. (2017), based on six nautiloid species. This might indicate that nautiloids belong to a separate holobaramin.
Gene order
Akasaki et al. (2006) also studied the gene order in six cephalopod species coming from different groups. These are: Octopus ocellatus from the order Octopoda, which, even though was not used in this analysis, would most likely fall into holobaramin Octopus (see table 2). Loligo bleekeri and Sepioteuthis lessonia both come from the suborder Myopsida, and would come from the holobaramin Squids II. The species Todarodes pacificus comes from the suborder Oegopsida, and belongs to the holobaramin Squids I. The species Sepia officinalis comes from the order Sepiida, and belongs to the holobaramin Cuttlefish. The species Watasenia scintillans also belongs to Oegopsida, but was not classified by our analysis.
Akasaki’s group found that the mitochondrial gene order in these lineages is very different. For example, the gene order in O. ocellatus is CO3, ND3, ND2, CO1, CO2, ATP8, ATP6, ND5, ND4, ND4L, Cytb, ND6, ND1, 16S, 12S. For S. officinalis, it is CO3, ND1, CO1, CO2, ATP8, ATP6, ND1, 16S, 12S, ND3, ND5, ND4, ND4L, Cytb, ND6. For L. bleekeri, it is CO3, ND3, Cytb, ND6, ND1, 16S, 12S, ND2, CO1, CO2, ND5, ND4, ND4L, ATP8, ATP6. In S. lessonia, the order is the same, except that 16S and 12S have been translocated to a position after ND4L. Lastly, in T. pacificus, the gene order is CO3, ND2, CO1, CO2, ATP8, ATP6, ND5, ND4, ND4L, Cytb, ND6, ND1, 16S, CO3, ND3, CO1, CO2, ATP8, ATP6, 12S. The gene order is the same as in W. scintillans.
What is interesting is that the mitochondrial gene order is so different in species representing the four different holobaramins discovered in this analysis. Furthermore, as we can see in table 2, the mean mitochondrial genome size is also quite different for each of the four holobaramins, with low standard deviations. This suggests that these holobaramins were created each with a mitochondrial genome with a separate gene order. Furthermore, since the earth is a mere several thousand years old, this also signifies that there has not been much time for the gene order of these mitochondrial genomes to get scrambled beyond recognition. Since a distinct gene order can be discerned in the mitochondrial genome of these four holobaramins, it means they were created separately.
Cephalopod baramins based on morphological characters
The picture looks somewhat different based on the analysis of morphological characters. In the following, two cephalopod character sets were analyzed in order to draw conclusions about the baraminic status of several dozen cephalopod species.
Sutton, Perales-Raya, and Gilbert 2015
Sutton, Perales-Raya, and Gilbert (2015) measured 132 morphological characteristics of 79 living and fossil neocoleoid species. These characters and species were filtered so as to get a species/ character matrix that could be analyzed by using the BDIST method of Wood (Robinson and Cavanaugh 1998; Wood 2005, 2008).
The 79 species were filtered so that only 28 species were left which had character values for at least 66 characteristics (half of all total characters). Two of the species are fossilized, Glyphiteuthis libanotica and Rachiteuthis donovani. The raw data as well as the BDIST results are in Supplementary Data File 2. The results of the classification of these 28 species can be seen in table 3. The character data matrix was fed into the BDIST software at a character relevance cutoff of 0.75. Eight-five of the 132 characters had a relevance which passed filter. Two of the 28 species had a taxic relevance of less than 0.66 (Glyphiteuthis libanotica and Rachiteuthis donovani). The 3D MDS figure (fig. 3) shows that only two holobaramins separate from each other clearly enough. However, according to the stress graph (fig. 4), there is minimal stress at seven dimensions (0.0842), therefore, there must be distortion in the 3D depiction of the data. Fig. 5 shows the baraminic distance correlation matrix.
| Species | Classification (Sutton, Perales-Raya, and Gilbert 2015) |
Classification (Lindgren,Giribet, and Nishiguchi 2004) |
Note |
|---|---|---|---|
| Abralia trigonura | Decapoda | — | |
| Abraliopsis pfefferi | — | Decapoda | |
| Ancistrocheirus lesueuri | — | Decapoda | |
| Architeuthis dux | Decapoda | Decapoda | |
| Argonauta nodosa | — | Octopoda | |
| Bathypolypus arcticus | — | Octopoda | |
| Bathyteuthis abyssicola | Decapoda | Decapoda | |
| Batoteuthis skolops | — | Decapoda | |
| Benthoctopus sp. | — | Octopoda | Palaeobaramin |
| Chiroteuthis veranyi | — | Decapoda | |
| Chtenopteryx sicula | Decapoda | Decapoda | |
| Cirrothauma murrayi | Octopoda | Octopoda | |
| Cranchia scabra | Decapoda | Decapoda | |
| Cycloteuthis sirventi | Decapoda | Decapoda | |
| Discoteuthis laciniosa | — | Decapoda | |
| Doryteuthis Amerigo pealeii | Decapoda | — | |
| Eledone cirrosa | — | Octopoda | |
| Enoploteuthis leptura | — | Decapoda | |
| Glyphiteuthis libanotica | Decapoda | — | |
| Gonatus antarcticus | Decapoda | Decapoda | |
| Gonatus fabricii | — | Decapoda | Palaeobaramin |
| Graneledone verrucosa | — | Octopoda | |
| Haliphron atlanticus | Octopoda | Octopoda | |
| Haliphron sp. | — | Octopoda | |
| Heteroteuthis hawaiiensis | — | Decapoda | |
| Histioteuthis celetaria | Decapoda | — | |
| Histioteuthis corona | Decapoda | Decapoda | |
| Histioteuthis hoylei | — | Decapoda | |
| Histioteuthis reversa | — | Decapoda | |
| Idiosepius pygmaeus | Decapoda | Decapoda | |
| Illex coindeti | — | Decapoda | |
| Japetella diaphana | — | Octopoda | |
| Joubiniteuthis portieri | — | Decapoda | |
| Leachia atlantica | — | Decapoda | |
| Lepidoteuthis grimaldii | Decapoda | Decapoda | |
| Loligo formosana | — | Decapoda | |
| Loligo pealei | — | Decapoda | |
| Mastigoteuthis agassizi | Decapoda | Decapoda | |
| Mastigoteuthis magna | — | Decapoda | |
| Moroteuthis knipovitchi | — | Decapoda | |
| Nautilus pompilius | — | Nautiloida | |
| Nautilus scrobiculatus | — | Nautiloida | |
| Neoteuthis thielei | — | Decapoda | |
| Octopoteuthis nielseni | — | Decapoda | |
| Octopoteuthis sicula | Decapoda | Decapoda | |
| Octopus vulgaris | Octopoda | — | |
| Ocythoe tuberculata | — | Octopoda | |
| Ommastrephes bartrami | Decapoda | Decapoda | |
| Onychoteuthis banksii | Decapoda | — | |
| Opisthoteuthis agassizi | Octopoda | — | |
| Opisthoteuthis sp. | — | Octopoda | |
| Ornithoteuthis antillarum | — | Decapoda | |
| Psychroteuthis sp. | — | Decapoda | |
| Pterygioteuthis gemmata | — | Decapoda | |
| Pyroteuthis margaretifera | — | Decapoda | |
| Rachiteuthis donovani | Decapoda | — | |
| Rossia pacifica | Decapoda | — | |
| Rossia palpebrosa | — | Decapoda | |
| Sepia officinalis | Decapoda | Decapoda | |
| Sepiella inermis | — | Decapoda | |
| Sepiola affinis | — | Decapoda | |
| Sepioteuthis lessoniana | — | Decapoda | |
| Spirula spirula | Decapoda | Decapoda | |
| Stauroteuthis syrtensis | Octopoda | Octopoda | |
| Sthenoteuthis oualaniensis | — | Decapoda | |
| Stoloteuthis leucoptera | — | Decapoda | |
| Thaumeledone guntheri | — | Octopoda | |
| Thysanoteuthis rhombus | Decapoda | — | |
| Vampyroteuthis infernalis | Undecided | Octopoda |
Fig. 3. 3D MDS figure depicting a larger baramin (Decapoda; blue dots) along with a smaller baramin (Octopoda; red dots). The Sutton, Perales-Raya, and Gilbert (2015) data was used for this figure. Vampyroteuthis indernalis was depicted in orange, since it showed neither continuity, nor discontinuity with either baramin, and was thus classified as “Undecided.”
Fig. 4. Stress graph showing stress values at different dimensions for the Sutton, Perale-Raya, and Gilbert (2015) data set. The minimal stress is at seven dimensions.
Fig. 5. Baraminic distance correlation matrix for the Sutton, Perales-Raya, and Gilbert (2015) study showing two large groups. Black boxes show continuity between species, white circles show discontinuity between species. The large Decapod baramin can be seen with 22 species, including two species in the upper right corner which belong to the paleobaramin. Vampyroteuthis infernalis stands by itself showing neither continuity or discontinuity. The smaller Octopod baramin can be seen with five species.
The first baramin, in red, (tentatively called Octopoda) is made up of five species, namely Octopus vulgaris, Haliphron atlanticus, Steuroteuthis syrtensis, Opistoteuthis agassizi, and Cirrothauma murrayi. The second baramin (tentatively called Decapoda) is made up of the rest of 28 species, in blue, save Vampyroteuthis infernalis, in orange, whose position is somewhat unsure. In fig. 2 we can see the five species of the first baramin designated by red spheres well separated from the 22 species of the second baramin, designated by blue spheres. According to the mitochondrial genome analysis, V. infernalis groups together with the Octopoda baramin, therefore it was designated with an orange colored sphere, positioned midway between the two larger baramins. For this species the mean bootstrap value is 76.4, therefore we cannot draw any conclusions about its membership in either the Octopoda or Decapoda baramins. However, when we look at the values for V. infernalis in the correlation matrix, we can see that it has positive, albeit slight positive values with all five of the species in the Octopoda baramin (mean value: 0.054), and slight negative correlation values with the 22 species in the Decapoda baramin (mean value: –0.181).
The members of the Octopoda baramin give correlation values with a range of (0.75; 0.999), and a mean correlation of 0.86. They also gave negative correlation values with members of the Decapoda baramin, with a range of (–0.97; 0.174), and a mean correlation value of –0.744. The bootstrap values within Octopoda had an average value of 87.5, and a range of (62; 100).
The members of the Decapoda baramin have significant positive correlation values with one another, with a range of (–0.026; 0.991) and a mean value of 0.71, except for Glyphiteuthis libanotica and Rachiteuthis donovani. If these two species are taken out of the Decapoda baramin, then the mean correlation value increases to 0.729.
The members of the Decapods baramin also have significant negative correlation values with the five members of the Octopoda baramin, as discussed previously. They also have bootstrap values with a range of (0.39; 1.0) and a mean bootstrap value of 94.43.
Glyphiteuthis libanotica and Rachiteuthis donovani both have bootstrap values less than 90 with the 20 other species of the Decapoda baramin. The reason these two species might be showing such behavior is because they are known in only fossil form, and therefore are lacking measurements for a number of their characteristics. Both of these species have a taxic relevance of less than 0.66. These two species could be considered to be members of the Decapoda palaeobaramin.
Lindgren, Giribet, and Nishiguchi 2004
Lindgren, Giribet, and Nishiguchi (2004) studied 86 morphological characters for 78 mollusk species from five classes. Of these 78 species, we selected 60 cephalopod species with at most 39 characters with undefined values. The scaphopod species Antalis pilsbryi was used as an outgroup. A relevance cutoff value of 0.75 was selected for this analysis as well. 80 characters passed filter, and 60 species had a minimum taxic relevance of 0.66. Unfortunately, due to technical problems with the BDIST website, bootstrap values are not available for this analysis, therefore we are not able to draw as strong conclusions about the baraminic relationships between the species studied here as we would wish.
Fig. 6 depicts the 3D MDS graph. The stress graph is shown in fig. 7, with a minimum stress value is 0.048485 at five dimensions indicating that there is also distortion in the way the species are depicted in the 3D MDS figure. Fig. 8 depicts the baraminic distance correlation matrix.
Fig. 6. 3D MDS figure depicting three baramins from the 60 species from the Lindgren, Giribet, and Nishiguchi (2004) study. A larger baramin (Decapoda; blue dots), a medium-sized baramin (Octopoda; green dots), and a very small baramin (Nautiluses; yellow dots). The non-cephalopod species Antalis pilsbryi was used as an outlier.
Fig. 7. Stress graph showing stress values at different dimensions for the Lindgren, Giribet, and Nishigushi (2004) data set. The minimal stress is at five dimensions.
Fig. 8. Baraminic distance correlation matrix for the Lindgren, Giribet, and Nishigushi (2004) study showing three groups. Black boxes show continuity between species, white circles show discontinuity between species. Forty-three species belong to the larger Decapods group, 14 to the medium-sized Octopoda group, and two species belong to the Nautilus group. Click image for larger view.
In the 3D MDS graph we can see two larger holobaramins, that of Octopoda in green, with 14 species, and Decapoda, forming a tight cloud with 43 species in blue. The two Nautilus species, N. pompilius and N. scrobiculatus in yellow, stand very close to each other. The outlier species, A. pilsbyri, in red, is standing separately from all other groups. The species Brachioteuthus sp., depicted in gray, is actually a species of squid. In the baraminic distance correlation matrix in fig. 8 we can see that for some reason it clusters together with the two Nautilus species. However, it shows discontinuity only with species from the Octopoda holobaramin, but not with the species from the Decapod holobaramin. On average, this species gave a Pearson correlation value of –0.274 and a mean baraminic distance of 0.4 with Octopoda and a mean correlation value of –0.046 and a mean baraminic distance of 0.381 with Decapoda.
The two Nautilus species gave a very high correlation value of 0.999. The members of the Octopoda baramin had a correlation range of (0.575; 1.0) with a mean value of 0.897. With all other species, they gave a correlation value range of (–0.691; 0.301), with a mean value of –0.339. The members of the Decapoda baramin had a correlation range of (0.928; 1.0) with a mean value of 0.98. With all other species, they gave a correlation value range of (–0.547; 0.301), with a mean value of –0.201.
The species Argonauta nodosa was classified as a member of the holobaramin Octopoda. Yet, externally it has some superficial semblances to nautiluses due to its external shell. However, even evolutionists admit that these similarities are only a case of what they believe to be convergent evolution. For example, the spiral shell of argonauts is thinner than that of nautiluses, and it is used only by the larger-sized females as a receptacle for their eggs. Furthermore, the shell is held in place by the argonaut’s tentacles, whereas nautiluses occupy only the terminal open chamber of their shells. Argonauts need to swim to the surface of the water in order to capture air into the dorsal aperture of the shell. Therefore, they can occupy only shallow portions of the sea. In contrast, the shell of nautiluses is made up of several chambers, connected by a siphuncle, which adjusts the proper ratio of air and fluid to achieve proper balance in the deeper waters that they occupy. Furthermore, argonauts have eight arms with two rows of suckers on them, whereas nautiluses have many arms without suckers (Finn and Norman 2010).
Discussion and Conclusion
Based on the alignment of the mitochondrial genome from 47 species we see that octopuses and cuttlefish form a single baramin, and that squids form two holobaramins. It is possible that nautiluses also form a separate holobaramin. Gene order in the mitochondrial genomes coming from the Akasaki et al. study (2006) also reinforces these conclusions.
However, based on the analysis of morphological characters from the data set of Sutton, Perales-Raya, and Gilbert (2015) using the BDIST method, we find only two holobaramins, namely Octopoda which cover the octopus species, and Decapoda, which cover the two squid baramins and the cuttlefish baramins found in the mitochondrial genome analysis. For example, Bathyteuthis abyssicola, Sepia officinalis, and Architeuthis dux all belong to the larger baramin defined by the BDIST method, whereas they belong to separate clusters in the heat map in fig. 2. According to the results of the BDIST method on the Lindgren, Giribet, and Nishiguchi (2004) data set we get three holobaramins, namely Octopoda, Decapoda, and Nautiloidea (the latter not being present in the Sutton, Perales-Raya, and Gilbert data set).
Since the mitochondrial genome makes up less than 0.01% of the entire genome (meaning its informational contribution is slight), it could make sense to split up cephalopods into three holobaramins, namely Octopoda, Decapoda, and Nautiloidea. This is because the results of the two morphological studies agree with each other, as compared to the mitochondrial genome study. Species from the holobaramin Decapoda would thus be characterized by having ten arms as opposed to eight in the Octopoda holobaramin, and Nautiloids being characterized by smooth, round, chambered shells.
On the other hand, despite its disadvantages (and also taking into consideration its advantages), using the results from the mitochondrial analysis might make sense when determining cephalopod holobaramins, because the genotype determines the phenotype. Morphological studies are very important in their own regard, but they might fall victim to morphological convergence (however, the BDIST algorithm correctly classified Argonauta nodosa as an as a member of the Octopoda holobaramin). Species with similar morphology might have very different genetic backgrounds, and vice-versa organisms with similar genomes may have different morphology. Thus, it could make more sense in making primary use of genetic information when determining holobaramins. The very fact that the mitochondrial genome size as well as the gene order on the mitochondrial genome is different for each of the baramins predicted by the mitochondrial genome analysis indicates that these might represent independent baranomes in the process of differentiation during the short time period after Creation. This way cephalopods could be classified into four or even more baramins. These results are similar to early baraminology studies which classified turtles into a number of separate baramins, based on both morphological evidence and also evidence from the mitochondrial genome (Robinson 1997).
This preliminary baraminology analysis may be the first in the phylum Mollusca. Since the correlation and bootstrap values were not always significant for the two morphological studies, and since bootstrap values were missing from the second morphological analysis, these results are somewhat tentative. Furthermore, incorporating more genetic/ genomic data would also be very useful. For example, if the whole genome sequence/protein content could be determined for the 47 cephalopod species in this study, gene content similarity could be used to determine holobaramins (O’Micks 2017). A more detailed analysis of more cephalopod species in this way will give us a clearer picture of relationships between cephalopod baramins, either to reinforce or challenge these results.
Materials and Methods
Fig. 2 was generated using R version 3.4.3, using the heatmap.2 function in R. The clustering for fig. 2 was done using the kmeans function in R. The mitochondrial genome sequences for 47 cephalopod species were downloaded from NCBI. Some species had multiple isolates, therefore only one was taken at random for such species. The accession numbers for each species are listed in table 1, along with the number of the cluster for each species. The mitochondrial genomes were aligned using the CLUSTALW2 program in Linux, and the sequence identity matrix was generated using BioEdit (Hall 1999) version 7.2.6.1. The identity matrix is available in Supplementary File 1. Figs. 4, 5, 7, and 8 were all made by the BDIST software at http://coresci.org/bdist.html. The results of the BDIST analyses are available in Supplementary data files 2 and 3. Figs. 3 and 6 were made using the MAGE software available at http://kinemage.biochem.duke.edu/software/mage.php. Supplementary data files are available at the Github website at https://github.com/jeanomicks/cephalopods.
References
Acosta-Jofré, Maria Soledad, Ricardo Sahade, Jürgen Laudien, and Marina B. Chiappero. 2012. “A Contribution to the Understanding of Phylogenetic Relationships Among Species of the Genus Octopus (Octopodidae: Cephalopoda).” Scientia Marina 76, no. 2: 311–318.
Akasaki, Tetsuya, Masato Nikaido, Kotaro Tsuchiya, Susumu Segawa, Masami Hasegawa, and Norihiro Okada. 2006. “Extensive Mitochondrial Gene Arrangements in Coleoid Cephalopoda and their Phylogenetic Implications.” Molecular Phyologenetics and Evolution 38, no. 3: 648–658.
Albertin, Caroline B., Laure Bonnaud, C. Titus Brown, Wendy J. Crookes-Goodson, Rute R. da Fonseca, Carlo Di Cristo, Brian P. Dilkes, et al. 2012. “Cephalopod Genomics: A Plan of Strategies and Organization.” Standards in Genomic Sciences 7, no. 1: 175–188.
Bergman, J. 2017 Fossil Forensics: Separating Fact from Fantasy in Paleontology. Burlington, Massachusetts: Bartlett Publishing.
Bush, Stephanie L., Bruce H. Robison, and Roy L. Caldwell. 2009. “Behaving in the Dark: Chromatic, Postural, and Bioluminescent Behaviors of the Deep-Sea Squid Octopoteuthis deletron Young 1972.” Biological Bulletin 216, no. 1: 7–22.
Carlini, David B., Kimberly S. Reece, and John E. Graves. 2000. “Actin Gene Family Evolution and the Phylogeny of Coleoid Cephalopods (Mollusca: Cephalopoda).” Molecular Biology and Evolution 17, no. 9: 1353–1370.
Cheng, Rubin, Xiaodong Zheng, Yuanyuan Ma, and Qi Li. 2013. “The Complete Mitochondrial Genomes of Two Octopods Cistopus chinensis and Cistopus taiwanicus: Revealing the Phylogenetic Position of the Genus Cistopus within the Order Octopoda.” PLoS One 8, no. 12: e84216.
Combosch, David J., Sarah Lemer, Peter D. Ward, Neil H. Landman, and Gonzalo Giribet. 2017. “Genomic Signatures of Evolution in Nautilus—An Endangered Living Fossil.” Molecular Ecology 26, no. 21: 5923–5938.
Finn, Julian K., and Mark D. Norman. 2010. “The Argonaut Shell: Gas-Mediated Buoyancy Control in a Pelagic Octopus”. Proceedings of the Royal Society B 277, no. 1696: 2967–2971.
Habe, T., T. Okutani, and S. Nishiwaki. eds. 1994. Handbook of Malacology. Vol. 1. Tokyo, Japan: Scientist Inc.
Hall, Thomas A. 1999. “BioEdit: A User-Friendly Biological Sequence Alignment Editor and Analysis Program for Windows 95/98/NT.” Nucleic Acids Symposium Series 41: 95–98.
Iba, Yasuhiro, Shin-ichi Sano, and Jörg Mutterlose. 2014. “The Early Evolutionary History of Belemnites: New Data From Japan.” PLoS One 9 , no. 5: e95632.
Kröger, Björn, Jakob Vinther, and Dirk Fuchs. 2011. “Cephalopod Origin and Evolution: A Congruent Picture Emerging from Fossils, Development and Molecules.” Bioessays 33, no. 8: 602–613.
Kruta, Isabelle, Isabelle Rouget, Sylvain Charbonnier, Jérémie Bardin, Vincent Fernandez, Damien Germain, Arnaud Brayard, and Neil Landman. 2014. “Proteroctopus ribeti in Coleoid Evolution.” Palaeontology 59, no. 6: 767–773.
Lindgren, A. R., G. Giribet, and M. K. Nishiguchi. 2004. “A Combined Approach to the Phylogeny of Cephalopoda (Mollusca).” Cladistics 20: 454–486.
O’Micks, Jean. 2017. “Baraminology Classification Based on Gene Content Similarity Measurement.” Creation Research Society Quarterly 54, no. 1: 27–37.
Robinson, D.A. 1997. “A Mitochondrial DNA Analysis of the Testudine Apobaramin.” Creation Research Society Quarterly 33: 262–272.
Robinson, D. Ashley, and David P. Cavanaugh. 1998. “A Quantitative Approach to Baraminology With Examples From the Catarrhine Primates.” Creation Research Society Quarterly 34, no. 4: 196–208.
Sanchez, Gustavo, Davin H. E. Setiamarga, Surangkana Tuanapaya, Kittichai Tongtherm, Inger E. Winkelmann, Hannah Schmidbaur, Tetsuya Umino, et al. 2018. “Genus- Level Phylogeny of Cephalopods Using Molecular Markers: Current Status and Problematic Areas.” PeerJ 6:e4331. doi. org/10.7717/peerj.4331.
Sherwin, Frank. 2016. “Octopus Genome as Large as Human Genome.” http://www.icr.org/article/octopus-large-humangenome/.
Steele, Edward J., Shirwan Al-Mufti, Kenneth A. Augustyn, Rohana Chandrajith, John P. Coghlan, S. G. Coulson, Sudipto Ghosh et al. 2018. “Cause of Cambrian Explosion— Terrestrial or Cosmic?” Progress in Biophysics and Molecular Biology, 136: 3–23.
Strugnell, Jan, and Michele K. Nishiguchi. 2007. “Molecular Phylogeny of Coleoid Cephalopods (Mollusca: Cephalopoda) Inferred From Three Mitochondrial and Six Nuclear Loci: A Comparison of Alignment, Implied Alignment and Analysis Methods.” Journal of Molluscan Studies 73, no. 4: 300–410.
Strugnell, Jan M., Nathan E. Hall, Michael Vecchione, Dirk Fuchs, and A. Louise Allcock. 2017. “Whole Mitochondrial Genome of the Ram’s Horn Squid Shines Light on the Phylogenetic Position of the Monotypic Order Spirulida (Haeckel, 1896).” Molecular Phylogenetics and Evolution 109: 296–301.
Sutton, Mark, Catalina Perales-Raya, and Isabel Gilbert. 2015. “A Phylogeny of Fossil and Living Neocoleoid Cephalopods.” Cladistics 32, no. 3: 1–11.
von Boletzky, Sigurd. 2003. “Biology of Early Life Stages in Cephalopod Molluscs.” Advances in Marine Biology 44: 143–203.
Wood, Todd Charles. 2005. “Visualizing Baraminic Distances Using Classical Multidimensional Scaling.” Origins (GRI) 57: 9–29.
Wood, Todd Charles. 2008. BDISTMDS software. v. 2.0. Dayton, Tennessee: Core Academy of Science.
Wood, T. C. 2016. “A List and Bibliography of Baraminology Studies.” Journal of Creation Theology and Science Series B: Life Sciences 6: 91–101.
Yokobori, Shin-ichi, Dhugal J. Lindsay, Mari Yoshida, Kotaro Tsuchiya, A. Yamagishi, T. Maruyama, and T. Oshima. 2007. “Mitochondrial Genome Structure and Evolution in the Living Fossil Vampire Squid, Vampyroteuthis infernalis, and Extant Cephalopods.” Molecular Phylogenetics and Evolution 44, no. 2: 898–910.
Yoshida, Masaaki, Kazuhiko Tsuneki, and Hidetaka Furuya. 2006. “Phylogeny of Selected Sepiidae (Mollusca, Cephalopoda) Based on 12S, 16S, and COI Sequences, with Comments on the Taxonomic Reliability of Several Morphological Characters.” Zoological Science 23, no. 4: 341–351.


