The views expressed in this paper are those of the writer(s) and are not necessarily those of the ARJ Editor or Answers in Genesis.
Abstract
Evolutionists believe that modern humans have descended from a common ancestor with Neanderthals, who went extinct as modern humans continued to evolve. This view is supported by a recently published phylogenetic tree showing that Neanderthal and Denisovan Y chromosomes are different from all modern Y chromosomes. But this tree is rooted to show that all humans, including Neanderthals, and Denisovans, descend from a common ancestor with chimpanzees. The study presented here uses a reconstruction of this Y chromosome tree based on the biblical assumption that all humans have descended from Noah. The tree, constructed using a proposed ‘Noah’ root, shows that Neanderthal and Denisovan Y chromosomes descended from Noah’s Y chromosome in the line of Ham. The ancient Y chromosomes are compared to moderns by analysis of sequence similarity and shared alleles revealing that, although they differ from most moderns, they are like modern Y chromosomes in the A haplogroup. The long tree branches in this proposed Noah-rooted tree indicate high Y chromosome mutation rates for the Neanderthal, Denisovan, and modern A haplogroup Y chromosomes. The Neanderthal Y chromosome is also compared to other Stone Age Y chromosomes with similar results. Issues discussed include the problems of using ancient DNA, the causes of high mutation rates, the migration of Neanderthal into Europe following the Babel event and the likely causes of Neanderthal extinction. Since Neanderthal Y chromosome lineages may persist in the world, a plan to find these lineages is proposed. The conclusions of this analysis remain tenuous due to the small sample size, just a few Neanderthal Y chromosomes have been sequenced, and the difficulty of using ancient DNA. Yet, understanding the genetics of human history requires that data be interpreted in the light of Genesis, which records that all men have descended from Noah.
Keywords: Neanderthal, Denisovan, Ham, Noah, ancient DNA, Y Chromosome, phylogenetic
Introduction
According to the Bible all living people have descended from Noah and dispersed over the whole earth from the Mesopotamian city of Babel (Genesis 11:9). If Neanderthals are descendants of Noah, then they are fully human. But since they are a distinct people, perhaps we should call them Homo sapiens neanderthalensis. The most ancient human remains found in Europe belong to the Neanderthals, who fled from Babel to Western Eurasia and the plains of Northern Europe. There they lived as hunter-gatherers following the Pleistocene herds of mammoths and red deer while the advancing glaciers of the Ice Age forced them south into France and Spain (Lubenow 2004, 263; Oard 2003, 217).
But are Neanderthals really descended from Noah? Or could they be among the people who were wiped out by the Flood? The fact that Neanderthal remains have been found buried in graves and cave floor sediments is strong evidence that they lived in the post-Flood world because the Flood wiped the earth’s surface clean of all traces of the antediluvian civilization (Clarey 2023). So, Neanderthals were likely the first people to inhabit Europe after Babel. Later other migrants brought agriculture to Europe (Colledge et al. 2019; Shennan and Edinborough 2007). Neanderthals interbred with them and were absorbed into the rapidly increasing population. Consistent with the historical record of Genesis, the rise and fall of the ancient European Neanderthal culture can be pictured in this manner.
In contrast to this biblical view, the conventional understanding is that Neanderthals evolved in Africa, migrated into Europe, and lived as hunter-gatherers for several hundred thousand years, while multiple ice ages advanced and retreated over northern Europe. They did not innovate or advance in their technology but used the same kinds of weapons for 200,000 years, without even tinkering (Villa and Roebroeks 2014). Eventually, Neanderthals interbreed with ancient, anatomically modern humans (AMH), who had also migrated out of Africa into Europe (Sankararaman et al. 2014). The AMH are ancient humans, anatomically indistinguishable from modern humans, whose skeletons differ from Neanderthal skeletons by being more gracile and lacking typical Neanderthal cranial morphology. Neanderthals became extinct about 40,000 years ago as the population of the more advanced AMH expanded. According to this view the process of evolution had left the Neanderthals behind. They were replaced by the AMH who had sharper intellect, greater dexterity, and more complex linguistic communication. Unlike Neanderthals, European AMH rapidly developed agriculture and metallurgy (Villa and Roebroeks 2014). Thus, the Neanderthals became extinct as the Ice Ages ended and AMH brought Bronze Age technology into Europe from the Mediterranean and Middle East. Consistent with evolutionary theory, the rise and fall of the ancient European Neanderthal culture can be pictured in this manner.
Clearly, the secular and biblical views are at odds concerning the history of Neanderthals. Each side recruits Neanderthals to their cause, in support of evolutionary theory on the one hand and in support of biblical history on the other (Habermehl 2010). The recent advent of ancient DNA (aDNA) sequencing brought this controversy into the realm of genetics by the publication of the Neanderthal genome. And not surprisingly, by a few assumptions, either side can interpret this new genetic data in support of their paradigm. The genetic data is not in dispute. Rather, it is different assumptions which produce these different Neanderthal histories. What follows is an illustration of this principle using Neanderthal Y chromosome data.
The Max Planck Institute of Evolutionary Anthropology published a paper titled “The evolutionary history of Neanderthal and Denisovan Y chromosomes” (Petr et al. 2020) displaying Y chromosome data from three Neanderthals, two Denisovans, and 20 modern men in a phylogenetic tree with a chimpanzee Y chromosome as the outgroup. The tree was rooted in an evolutionary fashion, with humans sharing a common ancestor with Neanderthals who supposedly lived 245,000 years ago. The Neanderthals in turn shared a common ancestor with Denisovans (a sister group to Neanderthals) who supposedly lived 370,000 years ago and all humans shared a common ancestor with chimpanzees. A major conclusion of this study is that “Neanderthal Y chromosomes cluster together and fall outside the variation of present-day human Y chromosomes” (Petr et al. 2020, 1653). The implication, of course, is that Neanderthals diverged from AMH who continued to evolve while Neanderthals, being genetically inferior, lacked survival value and went to extinction. Thus, the genetic data was interpreted using an evolutionary assumption, resulting in an evolutionary conclusion. This view may convince some Christians to believe that humans have evolved from apes because they think the genetic data of Neanderthals proves human evolution and overturns the record of Genesis. But the same genetic data can be interpreted with biblical assumptions to produce a result consistent with Genesis.
This paper presents a reinterpretation of this Max Planck study according to the record of Genesis, which is according to the assumption that all men, including Neanderthals and Denisovans, have descended from Noah. The biblical assumption involves rerooting the Max Planck phylogenetic tree away from the chimpanzee to a human common ancestor whose Y chromosome sequence is like that of moderns. Specifically, the Noah Y chromosome root proposed by Jeanson (2019; 2022, 174), described below, is used to root the tree. In this Noah-rooted tree, the Max Planck Y chromosome data now shows that Neanderthal and Denisovan Y chromosomes fall close to the present-day human Y chromosomes in the A haplogroup. This interpretation is supported by sequence similarity between the ancient Y chromosomes and the A haplogroup modern Y chromosome of the Max Planck study. Further support comes from comparing mutation similarity between one of the Max Planck Neanderthal Y chromosomes and Y chromosomes of the Stone Age. Interpretated in the light of Genesis, ancient Y chromosome DNA shows Neanderthals and Denisovans descending from Noah in the line of Ham.
Methods
Y Chromosome Datasets
The Max Planck data, provided in variant call format (VCF), was downloaded (February 24, 2022) from the European Nucleotide Archive (accession number PRJEB39390). This VCF file contained Y chromosome data from three Neanderthals, two Denisovans, 20 modern men and chimpanzee. The file lists segments of the Y chromosome sequence amounting to the 6.9 million bases (MB) with genotypes called relative to the GRCh37 reference genome for 221,138 single nucleotide polymorphisms (SNPs).
The Y chromosome data from Karmin et al. (2015) was downloaded on September 5, 2020 from the Estonian Biocentre (http://www.ebc.dd/free_data/Ychr). From this file, the genotypes of 38,073 SNPs belonging to 13 samples (four from A haplogroups and nine from B haplogroups) were obtained. These additional modern samples were used for supplementing of the Max Planck modern samples which had only one sample in the A haplogroup and one sample in the B haplogroup. The Karmin samples were restricted to only those positions listed in the 6.9 MB of sequence used in the Max Planck data. The data from these 13 samples were then combined with the Max Planck VCF file, including the data from the three Neanderthals and two Denisovans and the file was shortened to include just the 221,138 SNP positions present in the Max Planck VCF. This combined VCF file contained 38 samples, the 25 original Max Planck samples minus the chimpanzee, plus 13 additional samples from the Karmin data. This is called the Max Planck Karmin VCF file.
The following four files were downloaded on August 16, 2022, from the Allen Ancient DNA Resource (Mallick et al. 2023) of the David Reich Lab at Harvard (https://reich.hms.harvard.edu/allen-ancient-dna-resource-aadr-downloadable-genotypes-present-day-and-ancient-dna-data).
- A file containing meta-information for each of the 12,650 aDNA samples (“v52.2_1240K_public.txt”).
- A file with three columns: individual ID, sex, and population (“Allen_aDNA_samples.ind”).
- A file with information on each analyzed SNP position including identification number, chromosome position on GRCh37 reference genome, reference allele, and variant allele (“Allen_aDNA_variants.SNP”).
- A file listing SNP positions as rows and listing genotypes as columns for all 12,650 samples (“v52.2_1240K_public.estratForJM.geno”).
This genotype file was in the “packedancestrymap” format, which was opened into human readable form using the proprietary software available online from the Reich Lab. Then a VCF file was made including only Y chromosome genotypes for the 32,670 Y chromosome SNPs of the Allen dataset.
Analysis of Y Chromosomes
From the VCF file of the Max Planck dataset, the transversion SNPs were converted into a FASTA file using a custom Python script. From this a phylogenetic tree was produced using MEGA11 (neighbor-joining algorithm with default settings) available online at https://www.megasoftware.net and Fig Tree available online at http://tree.bio.ed.ac.uk/software/figtree. A close reproduction of the published Max Planck tree was then constructed by the midpoint rooting of the tree. A second tree was made using the same FASTA file and the same algorithms, but this tree was rooted in Noah so that the Y chromosome haplogroups are partitioned as follows: haplogroups A–H belonging to Ham, haplogroups I–J belonging to Japheth, and haplogroups K–T belonging to Shem. This Noah root is according to the proposal of Jeanson (2022, 174).
From the Max Planck Karmin VCF file, a FASTA file of only transversion SNPs was made. From this FASTA file a similar Noah rooted phylogenetic tree were produced using MEGA11 and Fig Tree software.
Custom Python scripts were written to compare the Y chromosome sequence similarities of all the samples in the Max Planck 6.9 MB VCF file to the GRCh37 reference genome and statistical analysis of the results was done. The transversion SNP genotype calls for the Neanderthal and Denisovan Y chromosomes were compared to the modern Y chromosomes in the Max Planck Karmin VCF file using the Jaccard Index of Similarity (JC), which is the number of shared derived alleles divided by the total number of derived alleles in the pair of samples. The Mezmaiskaya 2 (Mez2) Neanderthal Y chromosome SNP genotype calls of the Max Planck dataset were also compared to those of a selection of 99 Stone Age Y chromosomes from the Allen dataset. This selection of aDNA samples from the Allen dataset was based on the requirement that the samples be older than 3,000 years before present and that they have at least 3,000 genotype calls for the 5,226 Y chromosome SNP positions common to the Max Planck and Allen data sets. The two Denisovans (Den4 and Den8) and Neanderthals Spy 1 and Elsidron, all from the Max Planck dataset, did not meet these criteria and so they were not included for comparison with the 99 Stone Age samples. The one Neanderthal and the 99 Stone Age Y chromosomes were then analyzed by JC and principal components.
Pairwise allele-sharing distance matrices were made from the transversion SNPs of the VCF files for Principal Component Analysis (PCA) using the PCA algorithm available online from SKlearn (https://scikitlearn.org/stable/).
The VCF files for this investigation along with Python scripts, “similarity2_snp.py” and “pca_play.py”, are available on Zenodo in the repository “https://zenodo.org/deposit/8115044”. Additional data is available on request.
Results
Y Chromosome Phylogenetic Trees
Fig. 1 is a reproduction of the published Max Planck tree minus the chimpanzee outgroup branch. The ancient Y chromosomes samples are in red ink and the moderns are in green ink, except for the a00_A00 sample which is in blue ink. The Neanderthals branch together and Denisovans branch together. As noted in the Max Planck paper, these ancient Y chromosome samples are apart from all the moderns, with the closest modern Y chromosome being the a00_A00 sample. According to this interpretation, the most recent common ancestor of all modern Y chromosomes lived 249,000 years ago. The common ancestor between Neanderthals and all moderns lived 370,000 years ago and the common ancestor between Neanderthals and Denisovans lived 700,000 years ago according to the Max Planck evolutionary rooting of the tree.
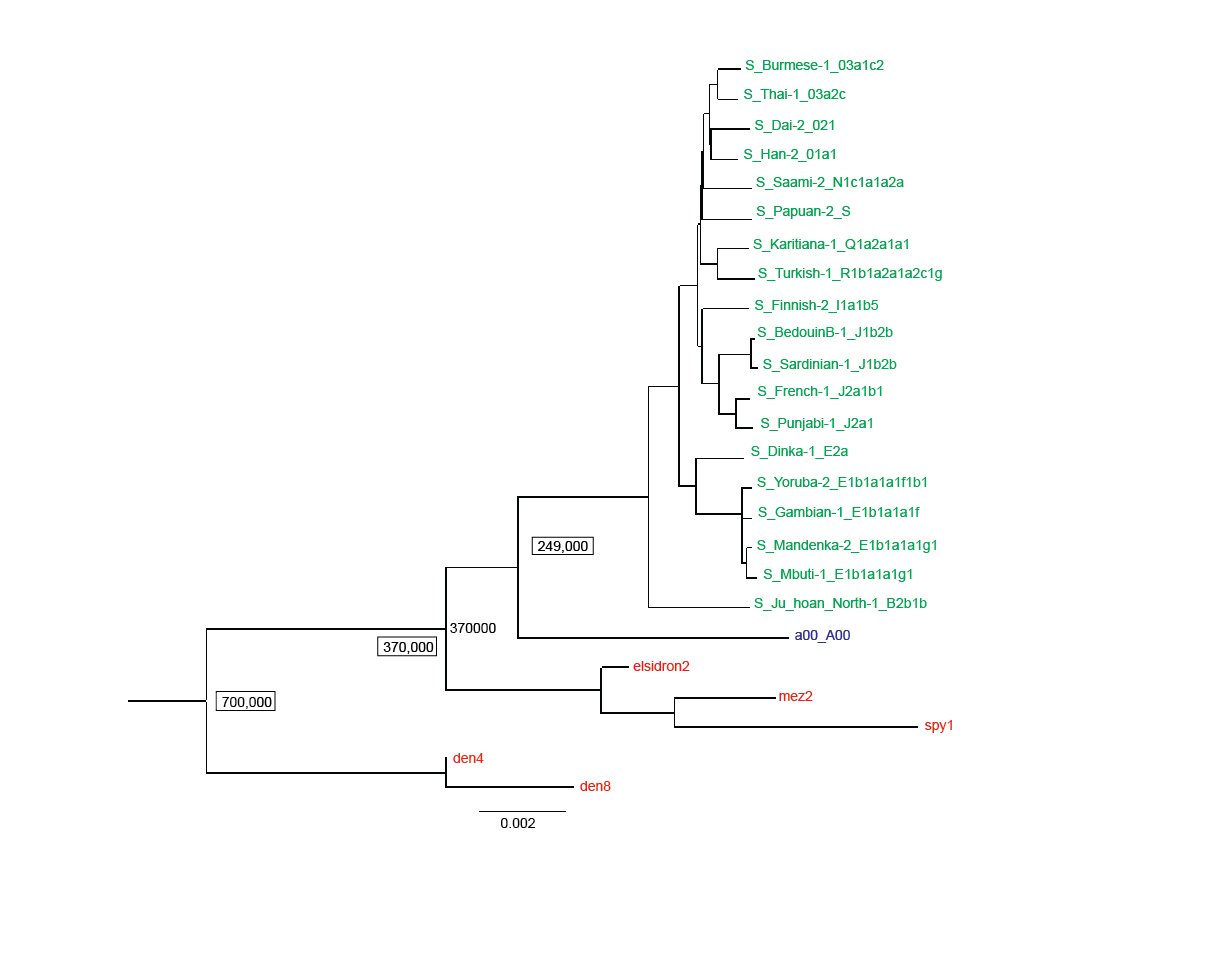
Fig. 1. A Y chromosome phylogeny of Neanderthals, Denisovans and moderns. A reproduction of the Max Planck Y chromosome phylogenetic tree (Petr et al. 2020) based on transversion SNPs, absent the chimp out group. The Max Planck assigned ages are given for time to the most recent common ancestors of all modern men (249,000 years), all modern men and Neanderthals (370,000 years), and Neanderthals and Denisovans (700,000 years). Neanderthals (elsidron2, mez2, spy1) and Denisovans (den4, den8) are in red ink, the a00_A00 modern in blue ink, and the rest of the moderns in green ink.
Fig. 2 is the tree made from the same Max Planck data as fig. 1, but re-rooted to Noah (Jeanson, 2022, 174). Three branches come from this Noah root: Shem is haplogroups N–R (in green), Ham is haplogroups A–E (in blue), and Japheth is haplogroups I–J (in orange). Now the Neanderthals and Denisovans are seen to descend from Noah in the line of Ham and branch from the B haplogroups along with the a00_A00 sample. In this Noah rooted Y chromosome tree modern men in the A haplogroup share common ancestry with Neanderthals and Denisovans. To the Noah root a date of 2500 B.C. is assigned, this being a commonly accepted date of the Flood. The date of separation of the A and B haplogroups is assigned to 2100 B.C. according to Jeanson (2022, 70).
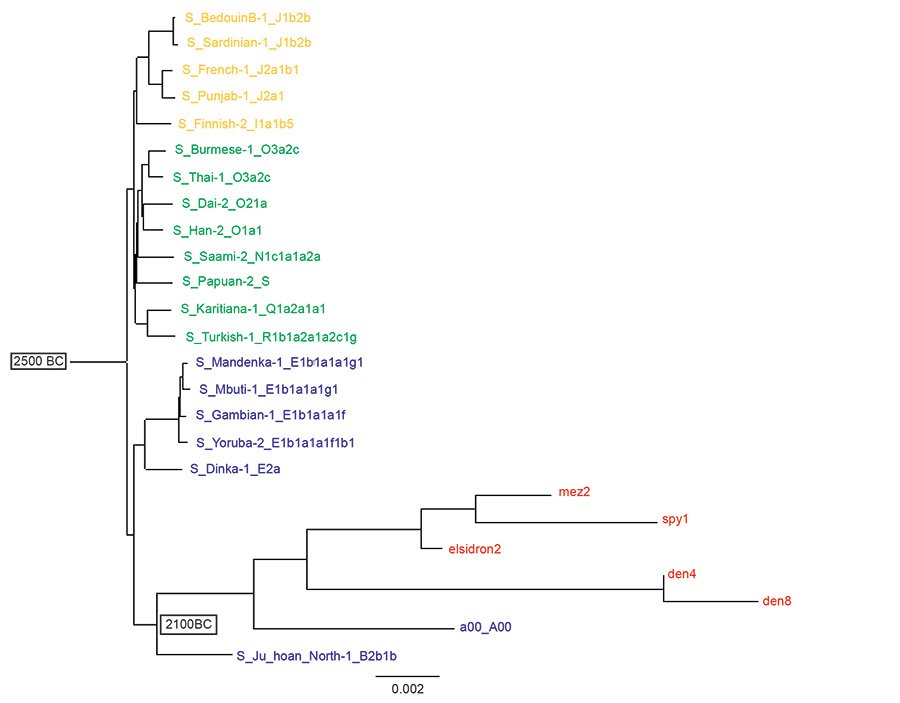
Fig. 2. A reinterpretation of Neanderthal, Denisovan and modern Y chromosomes descending from Noah. A Noah-rooted Y chromosome tree using the same transversion SNPs of the Max Planck study as the tree in fig. 1. The Flood is assigned a date of 2500 B.C. and the split of the A and B haplogroups a date of 2100 B.C. according to Jeanson (2022). Neanderthals (elsidron2, mez2, spy1) and Denisovans (den4, den8) are in red, Ham descendants in blue, Shem descendants in green and Japheth descendants in orange. The Noah-root is the Jeanson proposal (Jeanson 2022, 174).
Fig. 3 is the Max Planck tree with the Noah root to which more A and B haplogroup Y chromosome samples from the Karmin dataset have been added. In this tree, the Neanderthals and Denisovans are seen branching among members of the A haplogroup after the A and B branches separate. Here the Denisovans appear more closely related to the A3 and the Neanderthals appear more closely related to A00 haplogroups.
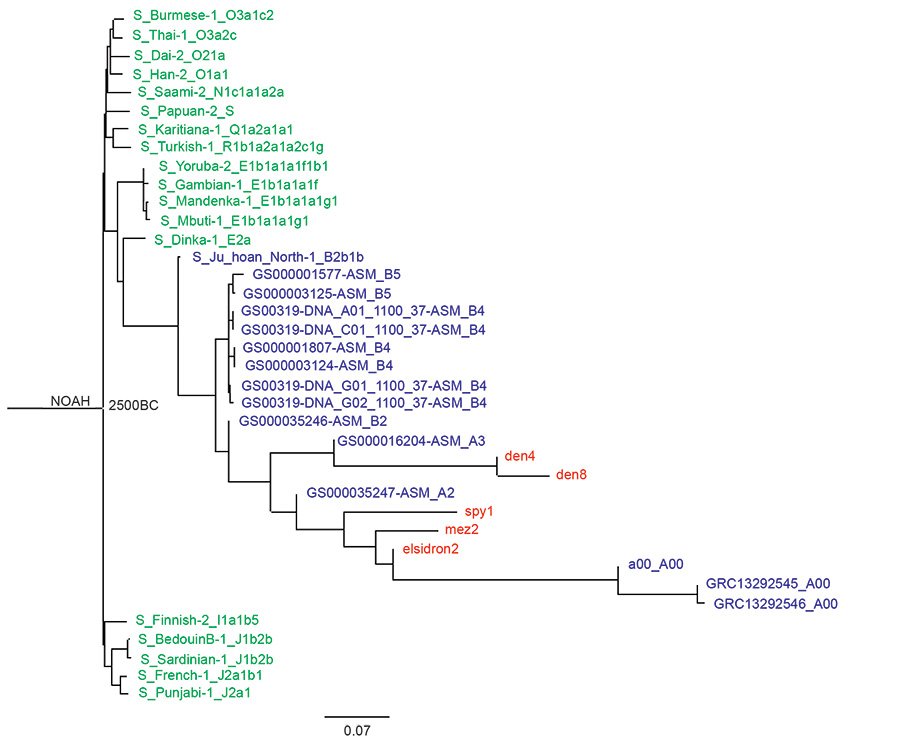
Fig. 3. A Noah-rooted Y chromosome phylogenetic tree made from the transversion SNPs of the Max Planck Karmin VCF. The Flood date is the root at 2500 B.C. Neanderthals (elsidron2, mez2, spy1) and Denisovans (den4, den8) are in red, A haplogroup and B haplogroup in blue, and the other moderns, all from the Max Planck study, in green. The Noah-root is the Jeanson proposal (Jeanson 2020, 174).
Y Chromosome Sequence Similarities
Table 1 shows the computed sequence similarities of the Y chromosome samples to the GRCh37 reference genome for all Y chromosomes in the Max Planck 6.9 MB VCF file. The mean sequence similarity of the 5 ancient samples to the GRCh37 reference genome is 0.9992 (standard deviation = 3.28E-4). The mean sequence similarity of the 20 modern samples to the GRCh37 reference genome is 0.9999 (standard deviation = 7.42E-5). These means are significantly different at the 0.05 significance level (p = 7.4E-5). The sequence similarity of the a00_A00 modern sample differs significantly from the mean modern sequence similarity (z = -4.027, p = 0.28E-4) but it does not differ significantly from the mean of the Neanderthals and Denisovans (z = 1.1687, p = 0.12086). In other words, the Max Planck a00_A00 Y chromosome is like the Neanderthal and Denisovan Y chromosomes in that they all differ significantly from most modern sequences, but they do not differ significantly from each other when all are compared to the reference genome. Fig. 4 is a histogram of the results of Table 1. The modern a00_A00 haplogroup Y chromosome (A00 in fig. 4) is seen to be more like the ancients than the moderns in fig. 4 and is most like the Mez2 Neanderthal Y chromosome.
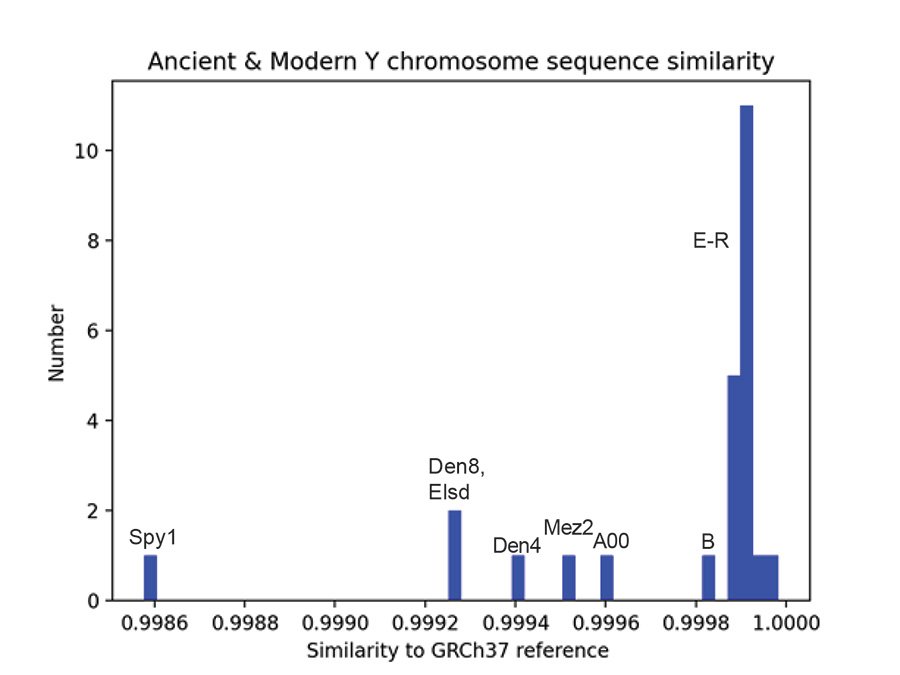
Fig. 4. Ancient and modern Y chromosome sequence similarity. A histogram of sequence similarity to the reference genome GRCh37 for ancient and modern Y chromosomes of the Max Planck VCF file containing 6.9 million bases. The modern Y chromosomes are A00, B, and E–R haplogroups. The Neanderthals are Mez2, Elsd, and Spy1. The Denisovans are Den4 and Den8. “Elsd” is elsidron in the Max Planck data. “A00” is the a00_A00 modern in the Max Planck data.
Table 1. Max Planck Y Chromosome sequence identities. Identities compared to the GRCh37 reference genome for 6.9 million bases of Y chromosome sequence. Mean sequence identity and standard deviation are given for the ancient samples of Neanderthals (Mez2, Elsidron2, Spy1) and Denisovans (Den4, Den8) and for the modern samples in the Max Planck study (Petr et al. 2020). The ancient and modern means differ significantly at the 0.05 level (p = 0.00007). As seen in the Z values of the fourth column, sequence identities for the Neanderthals and the a00_A00 modern differ significantly from the mean of the moderns. However, the a00_A00 sequence identity does not differ significantly from the mean of the ancient Y chromosomes (Z = 1.17073, p = 0.12086).
| Sample Name | Group | Sequence identity | Z vs Modern mean |
|---|---|---|---|
| Den4 | Ancient | 0.999403 | -6.56757 |
| Den8 | Ancient | 0.999276 | -8.28378 |
| Mez2 | Ancient | 0.999517 | -5.02703 |
| Elsidron2 | Ancient | 0.999263 | -8.45946 |
| Spy1 | Ancient | 0.998577 | -17.72973 |
| Mean ancient identity | 0.999207 ± 0.000328 | -9.21622 | |
| a00_A00 | Modern | 0.999591 | -4.02703 |
| S_BedouinB-1_J1b2b | Modern | 0.999908 | 0.25676 |
| S_Burmese-1_O3a1c2 | Modern | 0.999917 | 0.37838 |
| S_Dai-2_O21a | Modern | 0.999915 | 0.35135 |
| S_Dinka-1_E2a | Modern | 0.999879 | -0.13514 |
| S_Finnish-2_I1a1b5 | Modern | 0.999910 | 0.28378 |
| S_French-1_J2a1b1 | Modern | 0.999915 | 0.35135 |
| S_Gambian-1_E1b1a1a1f | Modern | 0.999877 | -0.16216 |
| S_Han-2_O1a1 | Modern | 0.999915 | 0.35135 |
| S_Ju_hoan_North1_B2b1b | Modern | 0.999835 | -0.72973 |
| S_Karitiana-1_Q1a2a1a1 | Modern | 0.999936 | 0.63514 |
| S_Mendenka1_E1b1a1a1g1 | Modern | 0.999877 | -0.16216 |
| S_Mbuti-1_E1b1a1a1g1 | Modern | 0.999874 | -0.2027 |
| S_Papuan-2_S | Modern | 0.999914 | 0.33784 |
| S_Punjabi-1_J2a1 | Modern | 0.999915 | 0.35135 |
| S_Saami-2_N1c1a1a2a | Modern | 0.999913 | 0.32432 |
| S_Sardinian-1_J1b2b | Modern | 0.999909 | 0.27027 |
| S_Thai-1_O3a2c | Modern | 0.999918 | 0.39189 |
| S_Turkish1_R1b1a2a1a2c1g | Modern | 0.999982 | 1.25676 |
| S_Yoruba-2_E1b1a1a1f1b1 | Modern | 0.999877 | -0.16216 |
| Mean Modern identity | 0.999889 ± 0.000074 | 0 | |
| Chimpanzee | 0.966915 | -445.59459 |
Comparison of Y Chromosomes by Jaccard Coefficient
Table 2 shows the JC for Y chromosome derived allele similarity comparing the Neanderthals and Denisovans to the moderns in the Max Planck Karmin VCF file. The Elsidron Neanderthal is not included in this table, or in any of the JC computations, since the data for Elsidron were obtained from only 560 kb of sequence versus 6.9 Mb for the other ancients (Petr et al. 2020). Mean JC scores are listed with standard deviations (SD). No SD are given for N, Q, and R since there was only one modern sample in each of these haplogroups. Fig. 5 shows a plot of the JC values given in table 2. Comparing derived alleles by JC, the Y chromosomes of the Neanderthals and Denisovans of the Max Planck study most closely resemble the Y chromosomes of the A haplogroup.
Table 2. Comparing Neanderthal and Denisovan Y chromosomes to moderns. Jaccard coefficient values comparing Y chromosome shared derived alleles of Neanderthals (Mez2, Spy1) and Denisovans (Den4, Den8) of the Max Planck Karmin VCF to modern samples in the listed Y chromosome haplogroups A–R. Means are given along with the range of one standard deviation. No standard deviations are given for N, Q, and R since there was only one sample in each of these haplogroups.
| A | B | E | J | N | O | Q | R | |
|---|---|---|---|---|---|---|---|---|
| Den4 | 0.326 ±.124 |
0.221 ±.058 |
0.046 ±.001 |
0.035 ±.001 |
0.034 | 0.033 ±.001 |
0.026 | 0.004 |
| Den8 | 0.377 ±.119 |
0.258 ±.065 |
0.045 ±.001 |
0.036 ±.001 |
0.035 | 0.036 ±.001 |
0.028 | 0.008 |
| Mez2 | 0.437 ±.086 |
0.297 ±.057 |
0.097 ±.001 |
0.074 ±.001 |
0.07 | 0.071 ±.001 |
0.053 | 0.014 |
| Spy1 | 0.358 ±.161 |
0.238 ±.070 |
0.019 ±.001 |
0.010 ±.001 |
0.011 | 0.011 ±.0001 |
0.19 | 0.044 |
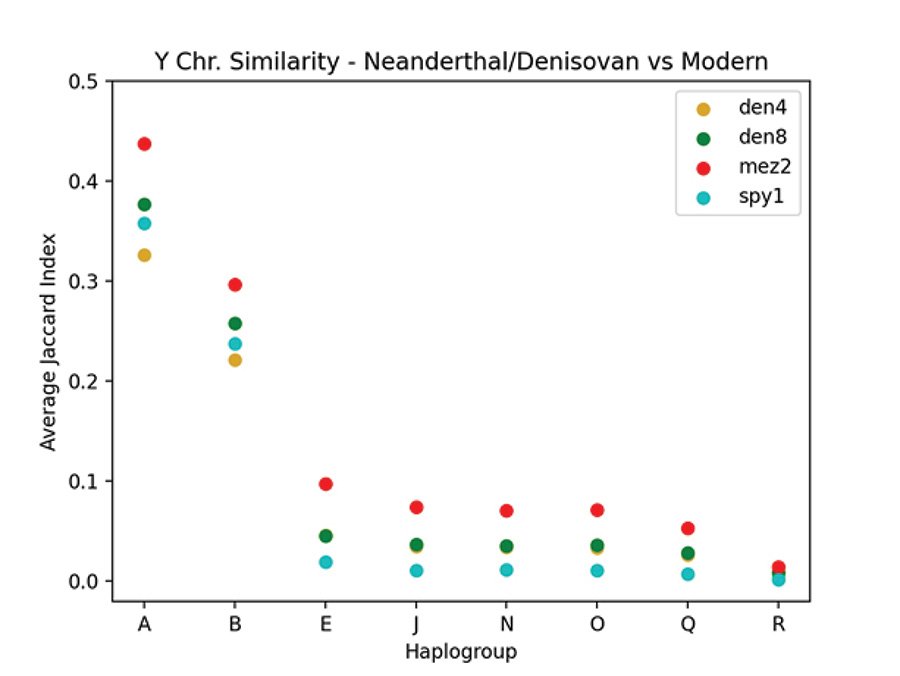
Fig. 5. Comparing SNPs of Neanderthal and Denisovan to modern Y chromosomes. A plot showing the average JC values comparing the Neanderthal and Denisovan Y chromosomes to those of the Max Planck modern Y chromosomes as listed in table 2. The vertical axis is the average JC and the horizontal axis lists the haplogroups. The Neanderthals are mez2 and spy1. The Denisovans are den4 and den8.
Table 3 shows the JC for derived allele similarity comparing the Mezmaiskaya 2 Neanderthal Y chromosome from the Max Planck data to 99 Stone Age Y chromosomes from the Allen Ancient DNA Resource. The mean JC for each haplogroup is given along with the range of one standard deviation. Haplogroups represented by only 1 or 2 samples among the 99 Stone Age Y chromosomes are not given in table 3. Fig. 6 is a plot of the values listed in table 3 with the addition of a bar for the one E haplogroup sample. The error bars represent one standard deviation. Both figs. 5 and 6 use JC values to compare humans according to their alleles at Y chromosome variant positions (SNPs). Fig. 5 compares the 2 Neanderthals and the 2 Denisovans to all the modern humans in the Max Planck study. Fig. 6 compares the one Neanderthal with data in the Allen Ancient DNA Resource to other ancient humans in that data set. Metadata for the 99 Stone Age samples that were compared to the Neanderthal in fig. 6 is in table 4. Comparing derived alleles of transversion SNPs, the Mezmaiskaya 2 Neanderthal Y chromosome most closely resembles the Stone Age Y chromosome in the A haplogroup. Full metadata for table 4 is available in file “v52.2_1240K_public.txt” which can be downloaded from “Allen Ancient DNA Resource https://reich.hms.harvard.edu/allen-ancient-dnaresource-aadr-downloadable-genotypes-present-day-and-ancient-dna-data”, version 52.2.
Table 3. Comparing a Neanderthal to Stone Age Y chromosomes. Jaccard index (JC) values for shared derived alleles comparing the Mezmaiskaya 2 Neanderthal Y chromosome to 99 Stone Age Y chromosomes from the Allen Ancient DNA Resource. Means for each listed haplogroup (A–R) are given along with the range of one standard deviation. JC values are not given for those haplogroups represented by only 1 or 2 samples among the 99 Stone Age samples.
| A | B | C | G | I | N | Q | R | |
|---|---|---|---|---|---|---|---|---|
| Mez2 | 0.891 ±.005 |
0.576 ±.066 |
0.416 ±.067 |
0.315 ±.080 |
0.299 ±.035 |
0.261 ±.104 |
0.214 ±.057 |
0.167 ±.114 |
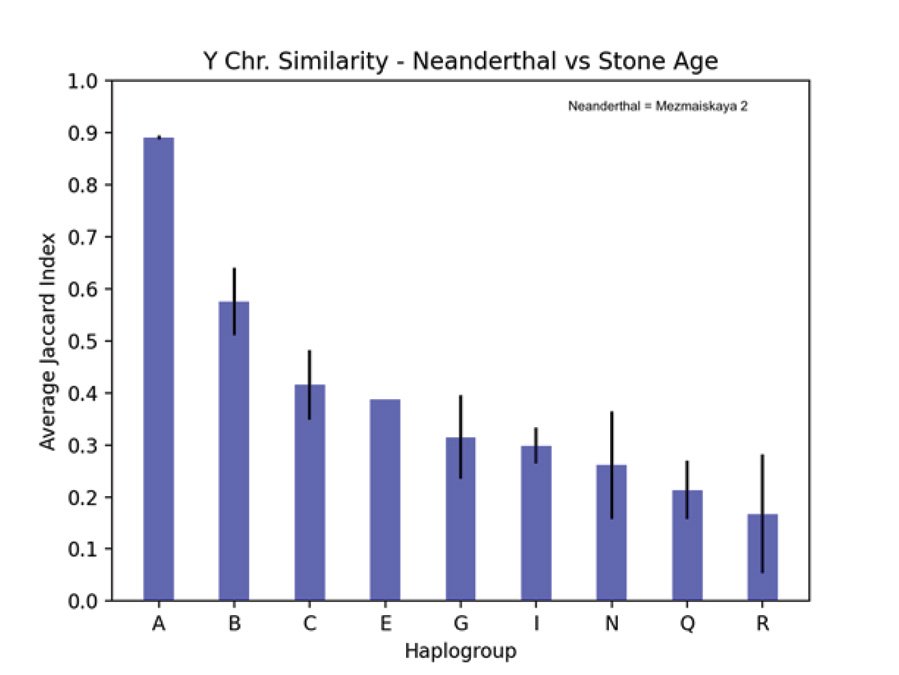
Fig. 6. Comparing SNPs of Neanderthal to Stone Age Y chromosomes. A plot of the JC values listed in table 3 comparing the Mezmaiskaya 2 Neanderthal Y chromosome to 99 Stone Age Y chromosomes from the Allen Ancient DNA Resource. A bar for the one E haplogroup Stone Age sample has been added. The vertical axis is the average JC for derived allele similarity between the Mezmaiskaya 2 Neanderthal Y chromosome and Stone Age Y chromosomes of the haplogroup listed on the horizontal axis. The error bars represent one standard deviation.
Table 4. Metadata for the 99 Stone Age samples. Metadata from the Allen Ancient DNA Resource for Y chromosomes used in construction of table 3, fig. 6 and fig. 9. The columns are the Allen dataset index (Index), the Allen dataset master ID (Master ID), biological source of the sample (Specimen), secular C-14 age (Age), the country where the sample was found (Country), the Y chromosome haplogroup (Haplogroup), and the type of the find (Site). Haplogroups may have been shortened, indicated with ending “~”. “Site” is the venue in which the remains were found as listed in the Allen metadata file. “lab” means a laboratory or museum skeleton. “tomb” means a burial or grave associated with a stone structure or monolith. “..” means not specified.
| Index | Master ID | Specimen | Age | Country | haplogroup | Site |
|---|---|---|---|---|---|---|
| 32 | I0231 | bone | 4844 | Russia | R1b1a1b1b3 | .. |
| 321 | I5207 | petrous | 7150 | Austria | J2a1 | .. |
| 582 | I3442 | petrous | 4998 | Belize | Q1b1a1a | burial |
| 689 | Sumidouro5 | .. | 10372 | Brazil | Q1b1a1a | .. |
| 782 | I10871 | petrous | 7913 | Cameroon | A00 | burial |
| 783 | I10872 | petrous | 7820 | Cameroon | B | burial |
| 784 | I10873 | petrous | 3097 | Cameroon | B | burial |
| 1154 | A460 | .. | 5130 | Chile | Q1b1a1a | cave |
| 1647 | HOP001 | .. | 4240 | Czech.Rep. | R1b1a1b1a1~ | .. |
| 1752 | KO1002 | .. | 4533 | Czech.Rep. | R1b1a1b1a1a | .. |
| 1962 | MIB022 | .. | 3866 | Czech.Rep. | R1b1a1b1a1~ | .. |
| 2483 | I2452 | petrous | 4052 | UK | R1b1a1b1a1~ | lab |
| 2971 | I12440 | petrous | 5600 | UK | I2a1b1a1a1 | tomb |
| 2981 | I13899 | tooth | 5600 | UK | I2a1b1a1a1b | tomb |
| 2982 | I20821 | tooth | 5486 | UK | I2a1b1a1a1 | tomb |
| 2983 | I21385 | tooth | 5680 | UK | I2a1a1b | tomb |
| 3558 | 2HC51961131 | rib | 5161 | France | I2a1b1b | tomb |
| 3725 | SATP | petrous | 13282 | Georgia | J1 | .. |
| 4116 | I1560 | tooth | 5350 | Germany | J21b1a | grave |
| 4123 | MX259 | petrous | 4246 | Germany | R1b1a1b1a1~ | .. |
| 4291 | I0070 | bone | 4000 | Greece | J2a1a1a2b1b | .. |
| 4841 | I1495 | petrous | 6367 | Hungary | I2a1a1b | .. |
| 5311 | rath2 | petrous | 3819 | Ireland | R1b1a1b1a1~ | .. |
| 5332 | prs010 | tooth | 5522 | Ireland | I2a1b1a1a | tomb |
| 5335 | prs016 | tooth | 5539 | Ireland | I2a1b1a1a1 | tomb |
| 5336 | prs018 | tooth | 5643 | Ireland | I2a1a2 | tomb |
| 5341 | ANN1 | petrous | 5405 | Ireland | I2a1b1a1a1b | burial |
| 5344 | ASH1 | petrous | 5501 | Ireland | I2a1b1a1a1b | .. |
| 5355 | PB2031 | petrous | 5431 | Ireland | I2a1a1b | tomb |
| 5357 | PB581 | petrous | 5413 | Ireland | I2a1b1a1a1 | tomb |
| 5358 | PB672 | petrous | 5442 | Ireland | I2a1a1b | tomb |
| 5359 | PB675 | petrous | 5171 | Ireland | I2a1a1b | tomb |
| 5663 | I26771 | petrous | 11868 | Italy | I2a1b2 | .. |
| 5693 | RISE487 | tooth | 5207 | Italy | I2a1a1a1~ | grave |
| 5712 | JK2839 | tooth | 3111 | Italy | G2a2b2b | .. |
| 5852 | RIP001 | tooth | 16736 | Italy | I2a1b1 | .. |
| 6070 | I6459 | petrous | 3234 | Jordan | J1a2a1a2d~ | .. |
| 6254 | I3767 | tooth | 3684 | Kazakhstan | R1a1a1b2a~ | .. |
| 6277 | BOT15 | .. | 5143 | Kazakhstan | N | .. |
| 6296 | I11541 | petrous | 3684 | Kazakhstan | R1a1a1b2a2 | burial |
| 6806 | Donkalnis4 | .. | 7823 | Lithuania | I | .. |
| 7301 | I13173 | petrous | 3722 | Mongolia | N | grave |
| 7403 | TAF013 | petrous | 14500 | Morocco | E1b1b1a | .. |
| 8274 | I4253 | tooth | 4266 | Poland | R1b1a1b | grave |
| 8309 | I2403 | bone | 4667 | Poland | I2a1b1a2b | .. |
| 8324 | RISE1165 | petrous | 4754 | Poland | I2a1b1a2b | .. |
| 8329 | RISE1168 | petrous | 4672 | Poland | I2a1b1a2b | .. |
| 8362 | pcw420 | petrous | 4300 | Poland | R1a1a | .. |
| 8580 | I11902 | petrous | 5950 | Romania | I2 | .. |
| 8581 | I11906 | petrous | 5950 | Romania | H | .. |
| 8613 | I3950 | petrous | 4707 | Russia | Q1b2a1a~ | .. |
| 8634 | I3949 | petrous | 4569 | Russia | Q1b | .. |
| 8654 | RISE512 | tooth | 3328 | Russia | R1a1a1b2a2 | .. |
| 8659 | irk025 | tooth | 4350 | Russia | Q1b1b~ | .. |
| 8660 | irk036 | tooth | 4720 | Russia | Q1b1b~ | .. |
| 8670 | I3427 | tooth | 4270 | Russia | Q1b1a3a1~ | .. |
| 8671 | RISE718 | tooth | 4434 | Russia | Q1b1a3a1~ | .. |
| 8679 | RISE675 | bone | 4517 | Russia | R1b1a1b1b | grave |
| 8843 | RISE495 | tooth | 3100 | Russia | R1a1a1b2a~ | .. |
| 8848 | I0211 | tooth | 8450 | Russia | J1 | .. |
| 8861 | kra001 | tooth | 4170 | Russia | N1a1a1a1a | .. |
| 8864 | DA354 | tooth | 4591 | Russia | Q1b1b~ | grave |
| 8870 | irk075 | tooth | 5397 | Russia | Q1b1b~ | .. |
| 8884 | irk068 | tooth | 4468 | Russia | Q1b1b~ | .. |
| 8885 | irk007 | tooth | 8801 | Russia | N1a2 | .. |
| 8905 | I6294 | tooth | 4709 | Russia | R1b1a1b1b | .. |
| 9002 | KDC001 | petrous | 3838 | Russia | J2b2a1 | grave |
| 9021 | I0439 | bone | 5021 | Russia | R1b1a1b | .. |
| 9024 | I0444 | bone | 5003 | Russia | R1b1a1b1b3 | grave |
| 9064 | DA248 | tooth | 7646 | Russia | N1a2 | grave |
| 9110 | kzb003 | .. | 3653 | Russia | R1a1a1 | burial |
| 9137 | Sunghir1 | bone | 33209 | Russia | C1a2 | .. |
| 9139 | Sunghir3 | bone | 34517 | Russia | C1a2 | .. |
| 9140 | Sunghir4 | bone | 34323 | Russia | C1a2 | .. |
| 9163 | I1526 | tooth | 4779 | Russia | Q1b1b~ | .. |
| 9164 | I7335 | tooth | 4465 | Russia | Q1b1a3 | .. |
| 9225 | Yana2 | tooth | 31850 | Russia | P1~ | .. |
| 9369 | I2631 | petrous | 4957 | UK | I2a1a2 | .. |
| 9776 | EHU001 | tooth | 4121 | Spain | R1b1a1b | .. |
| 9833 | I4559 | tooth | 3550 | Spain | R1b1a1b1a1a | .. |
| 9889 | I3209 | phalanx | 7815 | Spain | F | .. |
| 9891 | I8130 | tooth | 7957 | Spain | CT | .. |
| 10356 | RISE207 | tooth | 3344 | Sweden | I1 | .. |
| 10382 | vbj007 | tooth | 4469 | Sweden | I2 | .. |
| 10386 | vbj014 | tooth | 4802 | Sweden | I | .. |
| 10411 | Olsund | .. | 4306 | Sweden | R1a1a1 | .. |
| 10435 | Ajvide70 | .. | 4700 | Sweden | I2a1a1b | .. |
| 10966 | ART017 | petrous | 5166 | Turkey | J2a1a1a2b~ | .. |
| 10978 | ART024 | petrous | 5384 | Turkey | G2a2b1 | .. |
| 11057 | I0709 | petrous | 8085 | Turkey | H | .. |
| 11061 | I0746 | petrous | 7928 | Turkey | G2a2b2a1~ | .. |
| 11062 | I1096 | petrous | 8300 | Turkey | I2 | .. |
| 11076 | Bar31 | petrous | 8272 | Turkey | G2a | .. |
| 11079 | MA2200 | .. | 3575 | Turkey | J2a1a1a2b~ | .. |
| 11216 | I5884 | tooth | 4735 | Ukraine | R1b1a1b1b | grave |
| 11307 | ShukaKaa | tooth | 10366 | USA | Q1b1 | cave |
| 11423 | AHUR770c | .. | 10988 | USA | Q1b1a1a | .. |
| 11583 | I1775 | .. | 3563 | UK | R1b1a1b1a~ | cave |
| 11849 | C2036 | bone | 4224 | China | Q2 | .. |
Principle Component Analysis of Y Chromosome Alleles
Fig. 7 is the PCA graph of the Max Planck Y chromosomes based on the pairwise allele-sharing distance matrix. Shem haplogroups N-R are in green, Ham haplogroup E is in purple, and Japheth haplogroups I-J are in orange. The modern samples clump tightly together, except for the A and B haplogroups. The three Neanderthals clump together and are separate from the 2 Denisovans which also clump together. The Neanderthals, Denisovans, and modern a00_A00 haplogroup Y chromosomes are genetically distinct from each other and from the other modern Y chromosomes. This pattern is recapitulated in the PCA graph of the Max Planck Karmin VCF Y chromosome transversion SNPs (fig. 8). Here, the three A00 Y chromosomes cluster closest to the Neanderthals and away from all other Y chromosomes.
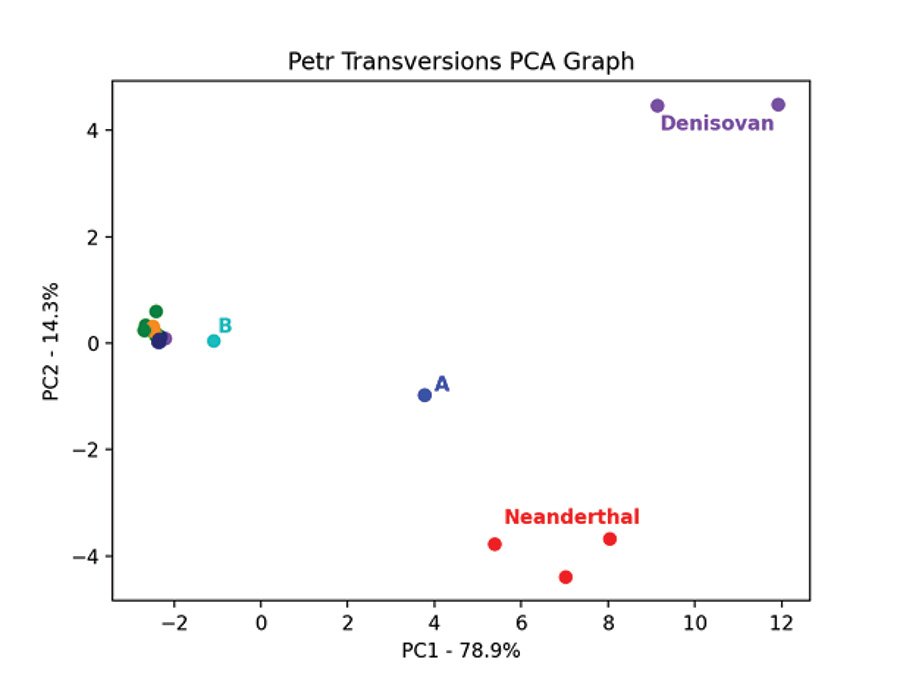
Fig. 7. PCA of Neanderthal and Denisovan and modern Y chromosomes. Principal component analysis graph of the pairwise allele-sharing distance matrix made from the transversion SNPs of the Y chromosomes in the Max Planck VCF file. The modern samples, except for the one A and one B haplogroup, cluster tightly together and are colored purple for haplogroup E, green for haplogroups N–S, and orange for haplogroups I, J.
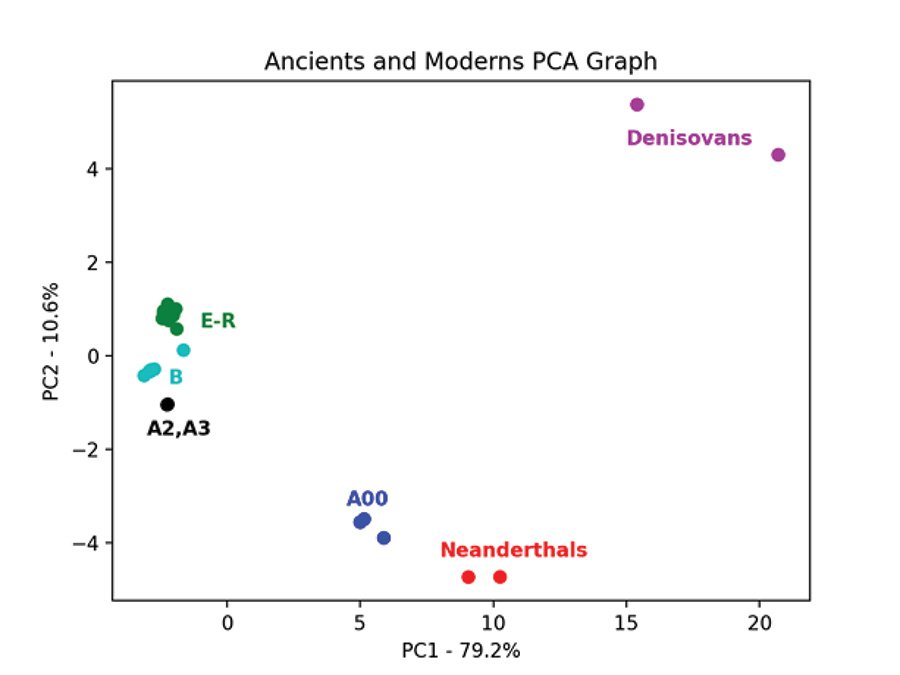
Fig. 8. PCA of Y chromosomes of Neanderthals and Denisovans and moderns with additional A and B haplogroups. Principal component analysis graph of the pairwise allele-sharing distance matrix made from the transversion SNPs of the Y chromosomes of the Max Planck Karmin VCF file. As in fig. 7, the Max Planck moderns cluster tightly, but now additional samples in the A and B haplogroups have been added from the Karmin dataset. Haplogroups E–R are in green.
Fig. 9 is the PCA graph of the Mesmaiskaya 2 Neanderthal Y chromosome, and 99 Stone Age Y chromosomes based on the pairwise allele-sharing distance matrix made from transversion SNPs. Except for the one modern sample, the Max Planck a00_A00 Y chromosome, this graph contains only Y chromosome aDNA data from the Allen Ancient DNA Resource and Y chromosome aDNA data from the one Neanderthal of the Max Planck study who also had SNP data in the Allen Ancient DNA Resource. The Neanderthal Y chromosome clumps with the two A haplogroup and one of the two B haplogroup Y chromosomes. While there is much scattering in the PCA graph, a clear separation is seen between this clump and all the other Stone Age Y chromosomes. The PCA graph shows that the Mezmaiskaya 2 Neanderthal Y chromosome is like the two A haplogroup and the one B haplogroup Y chromosomes and genetically distinct from all other Stone Age Y chromosomes. Note that the modern A00 sample from the Max Planck dataset and the aDNA A00 sample, the Camaroonian, from the Allen dataset clump together. This is evidence that aDNA can be reliably compared to modern DNA when comparison is restricted to transversions, as in this PCA graph. Table 4 is the metadata from the Allen dataset for the 99 Stone Age Y chromosome samples used to produce the results presented in fig. 6 and fig. 9.
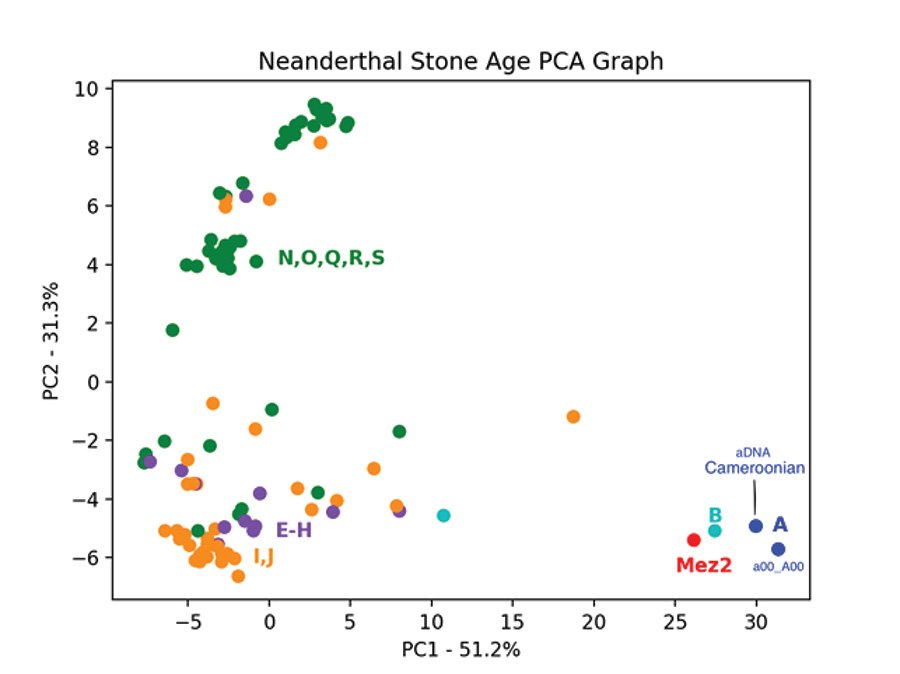
Fig. 9. PCA of Neanderthal and Stone Age Y chromosomes. Principal component analysis of the pairwise allele-sharing distance matrix made from 99 Stone Age Y chromosome samples, the Max Planc a00_A00 modern, and one Neanderthal (Mez2). Haplogroups E–H are in purple, I–J are in orange, and N–S are in green. The two B haplogroup samples are cyan, and the two A haplogroup samples, one modern and one ancient from Cameroon, are in blue.
Discussion
The analysis presented here attempts to replace an evolutionary interpretation of Neanderthal/Denisovan Y chromosome genetics with one possible biblical interpretation, that of Jeanson (2022, 174). This change involved rerooting the Y chromosome tree away from common ancestry with the chimpanzee to common ancestry with Jeanson’s proposed Noah root. Other possible roots to the tree could have been chosen with biblical assumptions, but all root designations have the effect of simply folding the branches of the tree to fit differing arbitrary timescales from root to tip. For example, the tree in fig. 3 was rerooted to two alternative roots given by Jeanson (2019), namely his “gamma,” and “epsilon” roots, and the Neanderthal and Denisovan Y chromosomes still branch among the A haplogroup Y chromosomes. This consistent branching pattern is because the neighbor-joining algorithm used to construct the tree produces an unrooted tree with the most similar sequences branching together. Thus, similar sequences can only be made to branch separately if the root of the tree is placed exactly between these similar branches. In the evolutionary tree (fig. 1) the long branches of the Neanderthals and Denisovans represent divergence of their Y chromosome sequence from that of moderns over a supposed 700,000 years as humans continued to evolve. With Jeanson’s Noah root and the shrinking of the timescale to 4,500 years, the long Neanderthal and Denisovan branches appear to represent hypermutation on their Y chromosomes as they have descended from Noah. By this reinterpretation, Neanderthal and Denisovan Y chromosomes appear to descend among A haplogroup Y chromosomes in the line of Ham. According to the evolutionary interpretation Neanderthal and Denisovan Y chromosomes are genetically distinct from all modern Y chromosomes due to their great antiquity, which allows many mutations to accumulate on the sequence. But according to this biblical interpretation they are genetically distinct due to a high Y chromosome mutation rate. Both interpretations involve choosing the root to the tree and choosing the timescale in a manner to support their primary assumptions. In this way, both are examples of circular reasoning because the assumptions foreordain the conclusions. Therefore, the battle between them is a worldview conflict with each attempting to argue for their view of human origins. We will now compare these opposing views and then discuss the cause of the high mutation rates, the difficulty of aDNA sequencing, the geographical distribution of Neanderthal remains, and the cause of Neanderthal extinction.
The Secular View of Neanderthal
Recent Nobel laureate Svante Pääblo of the Max Planck Institutes summarized the current secular understanding of human phylogeny by stating that Neanderthals and Denisovans existed for hundreds of thousands of years and yet remained in the Stone Age, while modern humans rapidly evolved, attained advanced technology, and spread around the world in just a few thousand years (Pääblo 2022). The Max Planck study (Petr et al. 2020) lends support to this opinion by rooting the Y chromosome tree in a common ancestor with the chimpanzee which has the effect of causing the Neanderthal and Denisovan Y chromosomes to branch separately from all modern Y chromosomes. It would be easy for anyone hearing the Nobel speech and reviewing the Max Planck study to conclude that the genetic data from Neanderthal Y chromosomes proves that humans have evolved from apes. That this conclusion is entirely based on evolutionary assumptions is not readily apparent to the casual observer.
The evolutionary assumptions serve one central purpose. That purpose is to present a picture of human history lasting hundreds of thousands of years. That long time allegedly allows enough time for the process of evolution to produce modern humans as archaic strains are left behind in the descent of man from ape ancestors. Accordingly, a “strict molecular clock” is used with the evolutionary interpretation so that all mutations have accumulated on the Y chromosome at a constant rate for all lineages (Carter, Lee, and Sanford 2018). The Max Planck paper uses a strict molecular clock to arrive at an age of 249,000 years for the time to the most recent common ancestor (TMRCA) of all modern humans. Essentially, they accepted the C-14 age of 45,000 years assigned to the remains of a hunter-gatherer from Siberia (Fu et al. 2014) and, by counting the genotype differences between this man’s Y chromosome and a panel of non-African modern Y chromosomes, they computed a mutation rate of 7.34E-10 per base pair per year. This mutation rate was then applied to the genotype differences between their A00 Y chromosome and their non-African Y chromosomes to get 249,000 years (Petr et al. 2020, supplement 22). In the same way, using genotype differences between the three Neanderthals and modern Y chromosomes, they calculated TMRCA between Neanderthals and modern humans of 370,000 years ago. This use of a strict molecular clock and a uniformitarian C-14 date results in age estimates incompatible with the biblical timescale and supporting the evolutionary timescale with its implications regarding human evolution. However, when all men, including Neanderthals and Denisovans, are assumed to have descended from Noah, who lived about 4,500 years ago, an entirely different picture emerges.
A Biblical View of Neanderthal
The Noah-rooted trees show Neanderthal and Denisovan Y chromosomes branching among A haplogroup Y chromosomes descending from Noah in the line of Ham. Because Neanderthals and Denisovans are post-Flood descendants of Noah, their Y chromosomes are just copies of Noah’s Y chromosome with added mutations. The variants common to Neanderthal, Denisovan, and A haplogroup Y chromosomes must be the earliest mutations in the A haplogroup lineages descending from Ham. When all genotype differences among the Y chromosomes are assumed to have accumulated since Noah, in about 4,500 years, the obvious explanation for discrepancies in the branch lengths of the Y chromosome tree is variable mutation rates between the Y chromosome lineages (Jeanson and Holland 2019). Thus, Neanderthal Y chromosomes differ from most moderns not because they have diverged from moderns over several hundred thousand years, but because Neanderthals have a much higher mutation rate. In the same way, A00 haplogroup Y chromosomes appear to differ from non-African Y chromosomes due to a higher mutation rate. From this analysis, one is tempted to conclude that the Neanderthals are like modern people. However, only Y chromosome divergence is being considered here. Different parts of the genome may have different divergence histories revealing Neanderthals and Denisovans to be much different than moderns on a genetic basis.
The Jeanson Noah root is one of several possible biblical assumptions. Other roots may be consistent with the historical record of Genesis and cause different folding of the tree branches so that branch lengths are not as disparate. The deep branches of this tree, representing the first few generations after the Flood, might be more equal in length than the Jeanson rooted tree, indicating that all lineages descending from Noah had higher mutation rates in the past, soon after the Flood. Because Neanderthals and Denisovans lived only a few generations after the Flood, this may explain their higher mutation rate. Perhaps all men had higher mutation rates back then. So which Noah root would better fit the genetic data? This question might be answered by comparing Neanderthal Y chromosomes to other Stone Age Y chromosomes.
How does the Neanderthal Y chromosome mutation rate compare to that of other Stone Age men? Did they all have higher mutation rates than modern men? An answer could come from comparing the Stone Age Y chromosome sequences to the reference genome as was done with the Max Planck data (see table 1). But direct sequence comparisons between Y chromosomes of Stone Age men cannot be done using the Allen dataset since it contains only genotype calls for selected SNPs. So, to answer this question, Neanderthal and other Stone Age Y chromosomes were compared using PCA of pairwise allele sharing distances of transversion SNPs. This PCA graph (fig. 9) showed the Neanderthal grouping closest to the A haplogroup men, but there was much scatter in the pattern and groups were not clearly separate, unlike the PCA graph for Neanderthals and moderns (fig. 8). The scattered pattern of the PCA graph implies that Neanderthals and Stone Age men were not so different in their Y chromosome mutation rates as Neanderthals and modern men. However, sequencing errors and irregular coverage, discussed below, may account for the increased scatter in the Stone Age PCA graph. Yet it remains true, according to biblical assumptions, that the Neanderthal Y chromosomes are genetically distinct from most moderns in having a high mutation rate. Possible explanations for the extraordinary mutation rate of Neanderthal Y chromosomes include “patriarchal drive” and defective DNA repair mechanisms.
Causes of the High Neanderthal Mutation Rate
Neanderthal and Denisovan Y chromosomes appear to be highly divergent from most modern Y chromosomes. The first issue that must be addressed concerning the large number of variant alleles found on these ancient Y chromosomes is whether these are due to errors in a DNA sequencing or to mutations that have accumulated as these men have descended from Noah.
Indeed, much of the past two decades have been devoted by labs, such as those at the Max Planck Institute, to overcoming the problems of sequencing highly fragmented and degraded aDNA. The majority of those working on aDNA now agree that the Neanderthal genome is highly divergent from modern human genomes, and this is not solely from errors in sequencing aDNA.
The transition SNPs are to be avoided since they are more likely artifacts of decay. The remaining transversion SNPs on the Neanderthal Y chromosome are thought to be mostly mutations that have accumulated during natural descent.
Still uncertainty persists. Exactly what fraction of the Neanderthal Y chromosome variants are artifacts versus inherited mutations? Ignoring the transition SNPs, which are more likely to be artifacts of decay, does not convince one that all the transversion SNPs are valid. When constructing phylogenetic trees or analyzing shared variant alleles, as in JC and PC analysis, the specific transition SNPs that define haplogroup lineages determine the results. Other variants, whether artifacts or actual inherited variant alleles, are not significant and are assumed to be “private variants,” which are found on all Y chromosomes, some having more than others. Y chromosome lineages with mutation rates of two or three per generation tend to have few of these private variants, while lineages with higher mutation rates will have more private variants. Neanderthal and Denisovan Y chromosomes share many significant SNPs with A haplogroup Y chromosomes. This is why they branch together in phylogenetic trees and cluster together in PCA graphs. But the cause of the large divergence of Neanderthal and Denisovan Y chromosomes as seen on fig. 4, where all variation is counted, both transitions and transversions, must be due to many private variants of which some are artifacts and the rest inherited mutations. The ability to discern which of the rarest Neanderthal Y chromosome transversions are artifacts and which are inherited mutations awaits further progress in the science of aDNA sequencing.
If sequencing errors did not cause the excessive number of Neanderthal Y chromosome variant alleles, the only other option is hypermutation. So, what caused the high mutation rate found in Neanderthal Y chromosomes? One possibility is patriarchal drive, which causes increasing mutations in children born to fathers of advanced age (Carter 2019). Because the male spermatogonia constantly reproduce throughout a man’s life, and because mutations occur whenever DNA is replicated, more mutations are found in the sperm of older fathers. The oogonia of the mother are not subject to mutation accumulation since these cells do not divide throughout the mother’s life, but they are in the state of rest awaiting ovulation. So increased mutations occur in children born to fathers of advancing age. Because men of the immediate post-Flood period may have retained some of the longevity of antediluvian men (Carter 2023; Habermehl 2010), patriarchal drive may be a factor in increasing mutations in people born soon after the Flood. Could the high mutation accumulation found on Neanderthal Y chromosomes be due to patriarchal drive which affected all Y chromosomes for a few generations after the Flood? This is one possibility because patriarchal drive is correlated to paternal longevity and men living in the early post-Flood period lived to great ages. For a discussion of Neanderthal longevity, see Buried Alive by Jack Cuozzo (1998).
Another possible explanation is that Neanderthals (and perhaps other descendants of Ham) have inherited, early in their descent from Ham, a defect in one of their DNA repair mechanisms. These repair mechanisms involve complex interaction of multiple protein enzymes, which might become defective if they were to suffer mutations. In humans, Progeroid syndromes are rare genetic disorders which may be caused by single gene mutations in DNA repair mechanisms. For example, consider Werner syndrome, an autosomal recessive disorder caused by a mutation on the gene encoding DNA helicase on Chromosome 8. The mean survival for those with this rare mutation is 54 years (Sinha, Ghosh, and Raghunath 2014). A severely deleterious mutation of this kind would result in rapid extinction of a lineage, the carriers of the mutation being unable to survive to reproductive age. But a less deleterious mutation to the DNA repair mechanisms may cause a higher, but non-lethal, mutation rate which is passed on in that lineage. Defective DNA repair could have been a cause of Neanderthal extinction as mutations accumulated in their genome reducing their fitness while the snows of the ice age piled up around them. Evolutionists are loath to acknowledge the possibility of Neanderthal hypermutation, apparently because it contradicts the strict molecular clock assumption. Instead, when considering possible genetic causes of extinction, they prefer to blame inbreeding, leading to increased homozygosity allowing the expression of recessive deleterious mutations (Harris 2016). Certainly, inbreeding may well have contributed to Neanderthal extinction, a point of agreement between evolutionists and creationists.
If the high mutation rate indicated by divergence of the Neanderthal Y chromosome is due to defective DNA repair, it should affect the entire Neanderthal genome. Perhaps the great divergence of the Neanderthal mitochondrial genome from moderns is also due to hypermutation.
The Reliability of aDNA Sequencing
The results of this study may be questioned because aDNA sequencing is thought by some to be unreliable (Thomas and Tomkins 2014). Although the science of aDNA sequencing has greatly advanced in the last 20 years, many problems remain, as illustrated by the difficulties encountered when working with the Allen dataset. For example, among the 4,747 male samples who were older than 3,000 years before present in the Allen dataset, only 99 were found to have sufficient genotype calls for the JC and PC analysis. And only one Neanderthal from the Max Planck study had adequate genotype calls among the Allen dataset SNPs to be included. This poor data quality is due to the difficulty of sequencing aDNA which has decayed into small fragments. Most fragments are less than 100 base pairs long. Fragments less than 35 base pairs long are routinely discarded due to excessive decay (Petr et al. 2020, supplement). When the remaining fragments are sequenced and assembled, they lack continuous coverage on the Y chromosome. This is unlike sequencing whole genomes of fresh DNA, where one starts with the entire genome which is then fragmented in the sequencing process and then reassembled. Another problem with aDNA is that some cytosines are degraded to uracil, particularly at the ends of the fragments. Since uracil is not a DNA base, the sequencing machine will call the uracil thymine (Prüfer et al. 2014). This problem is somewhat relieved by using only transversion SNPs in the analysis, an approach adopted by the Max Planck study and continued in this study. The transversion SNPs are thought to be less subject to sequencing errors caused by nucleotide degradation than transition SNPs. A third major problem with aDNA sequencing is contamination with modern DNA, human and bacterial. This was one of the first major problems that had to be overcome in aDNA sequencing. Lab techniques developed to avoid this contamination include working in a sterile lab environment, sterilizing the exterior of the specimens, and drilling deep into the specimen to get the DNA sample. Because fresh contaminating DNA from humans and soil bacteria is long-stranded intact DNA, it is removed from the specimen to leave behind the fragmented aDNA for study.
Taking into consideration the above noted problems, when one is working with aDNA the transition SNPs should be avoided. The fact that the Neanderthal Y chromosome presents a similar pattern of shared transversion alleles when compared to both modern Y chromosomes and Stone Age Y chromosomes is evidence that the aDNA sequencing is accurate, as long as transition SNPs are avoided. Furthermore, the Stone Age Cameroonian A00 Y chromosome clusters close to the modern a00_A00 Y chromosome on the PCA graph of fig. 9 even though the two samples are separated by several thousand years, and one is aDNA and the other fresh DNA. If aDNA sequencing were invalid, these two A00 samples would not cluster together. This represents a significant advance in the reliability of aDNA sequencing.
The Rise and Fall of the Neanderthal Lineage
This investigation raises a phylogeographic question. If Neanderthal Y chromosomes are in the A haplogroup, why are remains of Neanderthals only found in Europe, Asia, and the Middle East? The A haplogroup is found today in Sub-Saharan Africa where no Neanderthal remains have yet been found. A plausible explanation for this discrepancy is afforded by the Genesis record that humans spread into Europe and Asia soon after the Babel event (Robertson and Sarfati 2003). It may be that the A haplogroup split into those men who migrated into Europe and Asia, the ancestors of Neanderthals and Denisovans, and their brothers who subsequently migrated to sub-Saharan Africa. Since both the Neanderthal Y chromosomes and A haplogroup Y chromosomes appear to exhibit hypermutation, any genetic defect in DNA repair would need to have occurred in the common ancestor of these two prior to the Babel dispersion under this scenario.
Allele comparisons and sequence similarity show that Neanderthal Y chromosomes have close affinity to the A00 haplogroup, a very rare lineage today. This finding is not based on an assumption or an arbitrary tree root but is a characteristic of the Y chromosomes in the Max Planck and Allen datasets. Although Neanderthals are widely believed to be extinct, could Neanderthal Y chromosome lineages persist in the world today? Several lines of evidence suggest that this possibility is worthy of consideration. All humans outside of Africa today have Neanderthal motifs in their autosomal DNA at levels between 1.5–2.1 % (Prüfer et al. 2014). This is not a small amount of DNA since humans have about 1.5% of the autosomal DNA of an ancestor who lived six generations ago. Recently, the mummified remains of a man who lived about 5,250 years ago on the secular timescale, in the Western European Chalcolithic age, appeared out of a melting glacier in the Alps. Ötzi the “ice man” belongs to haplogroup G2a2b and his lineage was found to persist in Corsica and Sardinia today (Keller et al. 2012) where this rare lineage finds its highest incidence in Europe (Kivisild 2017). This provokes the following question. Is it possible that the Neanderthal Y chromosome persists in Europe or Asia as a rare lineage? The path to finding an extant Neanderthal Y chromosome lineage is clear. The International Society of Genetic Genealogy (https://isogg.org) has labeled the SNP A21560, a G-to-C transversion, the specific marker of Neanderthal in haplogroup A000-T. The Mezmaiskaya 2 Neanderthal carries this marker. If modern A haplogroup Y chromosomes are found with the ‘C’ allele at the A21560 position, the persistence of the Neanderthal Y chromosome lineage would be nearly proven. Of course, a homoplasy could produce a ‘C’ allele at this position, but the coincidence of finding a modern Y chromosome in the A haplogroup with that homoplasy would be improbable. Only time will provide enough modern Y chromosome data to demonstrate if the Neanderthal Y persists.
Since millions of modern European Y chromosomes have been sequenced and yet no telltale sign of the Neanderthal lineage has been found, most scientists of both the evolutionary and creationist camps believe that the Neanderthals are extinct. But the cause of their extinction is still hotly debated, and many opinions have been offered for their demise, from cannibalism to climate change (Timmermann 2020). The Y chromosome data as analyzed in this paper suggests that hypermutation could be a factor in Neanderthal extinction. Also, European Neanderthal sites indicate that Neanderthals lived in small populations (Hayden 2012) with inbreeding among closely related individuals. This inbreeding caused Neanderthal genomes to have low heterozygosity, about one third that of present-day Europeans (Prüfer et al. 2018). The burden of hypermutation and inbreeding would seem to be a perfect storm of genetic entropy capable of wiping out small, widely scattered groups of hunter-gatherers. This picture of genomic deterioration is the opposite of what evolutionary theory proposes. According to evolutionary theory mutations favored by natural selection is the engine of evolutionary progress. This secular view does not allow any genetic entropy. So, the prevailing secular opinion for the cause of Neanderthal extinction favors the notion of competition and assimilation with evolutionarily more advanced AMH (Villa and Roebroeks 2014; Timmermann, 2020; Vaesen, Dusseldorp, and Brandt 2021). Whether Neanderthal extinction was due to a combination of inbreeding and a high mutation rate or due to demographic replacement by AMH, the long Neanderthal Y chromosome branches remain as an indication of hypermutation. The branches of modern haplogroups A–E are longer than branches of the other haplogroups, which is clearly seen when the Y chromosome tree is rooted in the Jeanson Noah root (Jeanson 2022, color plate 22). This suggests that these descendants of Ham also have higher Y chromosome mutation rates than other Y chromosome haplogroups, possibly due to an inherited defect in DNA repair mechanism. Does this mean they are doomed to extinction like the Neanderthals? Not if inbreeding is kept to a minimum, which is easily accomplished in this era of world-wide mobility between large populations.
Interpreting Neanderthal in the Light of Scripture
It has been said that “data does not speak for itself but must be interpreted.” Although not always true, this adage applies to the study of Neanderthal and modern human genetics. If the assumptions involved with the interpretation of Neanderthal aDNA are not clearly laid out for consideration, the line between assumption and fact maybe obscured. This is especially true for the novice enquirer into this scientific discipline. The failure to explain the evolutionary assumptions involved with interpreting Neanderthal aDNA may lead many to conclude that the science of genetics proves humans have evolved from apes. The Max Planck study, analyzed here, does state in its title that the Neanderthal and Denisovan Y chromosomes are being interpreted in an evolutionary framework. But after the title is read, one finds no further discussion of the assumptions which determine the main conclusion of the paper. Unacknowledged, and likely unrecognized by the authors as an assumption, is their claim that several hundred thousand years were required to account for the divergence of Neanderthal and modern Y chromosomes. The strict molecular clock assumption supports this “deep time” notion by greatly expanding the timescale of the Y chromosome tree. Thus, long branch lengths in their tree are assumed to represent mutation accumulation over a quarter of a million years rather than mutation accumulation over a much shorter time due to high mutation rates in some lineages. The Max Planck study illustrates that it is common for evolutionists to assume deep time and then fail to acknowledge this as an interpretation of the data (Froede and Akridge 2023). The argument is very simple, and the data interpreted with these assumptions is very clear: evolution produced modern humans while sending Neanderthals to extinction. Alternative assumptions and different conclusions are not worthy of consideration by evolutionists.
However, Neanderthal genetics can be interpreted in the light of Scripture. According to Genesis all men alive today have descended from Noah: “Now the sons of Noah who came out of the ark were Shem and Ham and Japhet . . . These three were the sons of Noah, and from these the whole earth was populated” (Genesis 9:18–19, NASB). Assuming Neanderthal remains are post-Flood, biblical creationists must conclude that Neanderthals too have descended from Noah. When the Y chromosome data of the Max Planck study is interpreted with this biblical assumption both the Neanderthal and Denisovan Y chromosomes appear to descend along with A haplogroup Y chromosomes in the line of Ham. This interpretation supports the biblical worldview, not the evolutionary one.
Three predictions result from interpreting Neanderthal genetics in the light of Scripture.
- Neanderthal and Denisovan genomes will be found to carry mutations in genes involved with DNA repair.
- Pedigree mutation rate measurements of A00 haplogroup Y chromosomes will be much higher than normal (Jeanson and Holland 2019).
- The Neanderthal Y chromosome may persist in the world today.
Whether these predictions prove true or not, only in the light of God’s Word can the true history of our brothers, the Neanderthals, be understood.
Conclusion
Using biblical assumptions based on the historical record of Genesis, a recent study comparing three Neanderthal and two Denisovan Y chromosomes to modern Y chromosomes is reinterpreted to show that these Neanderthals and Denisovans belong to lineages of post-Flood men descending from Noah in the line of Ham. A specific Noah root proposal is used to root the Y chromosome tree, showing the Neanderthal and Denisovan Y chromosomes to branch with moderns in the A haplogroup. This interpretation is supported by sequence similarity and shared-allele similarity between the Y chromosomes of Neanderthals, Denisovans and men in the A haplogroup. When the tree is rooted in this fashion, the long Neanderthal branches indicate a high Y chromosome mutation rate, which could have contributed to Neanderthal extinction. Based on a small sample from only three Neanderthals and two Denisovans, it cannot be concluded that all Neanderthal and Denisovan men descended from Ham, or that all Neanderthals and Denisovans had high mutation rates affecting their entire genomes. Answering such questions requires additional investigation when more ancient DNA data becomes available. The relatively recent antiquity of Noah and the fact that all people today have some Neanderthal DNA in their genomes encourages one to think that an extant Neanderthal Y chromosome lineage may be found in the world today when enough modern Y chromosome sequences become available for analysis. This study shows that genetic data can contribute to our understanding of human history, but the data must be interpreted in the light of Scripture, which is an infallible historical record proclaiming that God “has made from one man every nation of mankind to live on all the face of the earth . . .” Acts 17:26 (NASB).
Acknowledgments
Thanks to Matthew Cserhati for his help in opening the Allen Ancient DNA Resource into human-readable form.
References
Carter, Robert W. 2019. “Patriarchal Drive in the Early Post-Flood Population.” Journal of Creation 33, no. 1 April: 110–118.
Carter, Robert. 2023. “The Extreme Rarity of Long-Lived People in the Post-Flood Era.” Journal of Creation 37 no. 2 (August): 63–67.
Carter, Robert, Stephen Lee, and John C. Sanford. 2018. “An Overview of the Independent Histories of the Human Y Chromosome and the Human Mitochondrial Chromosome.” In Proceedings of the Eighth International Conference on Creationism. Edited by John H. Whitmore, 133–151. Pittsburgh, Pennsylvania: Creation Science Fellowship.
Clarey, Timothy. 2023. “Neanderthals Possibly Used Pre-Flood Methods to Make Tar.” Creation Science Update, July 27. https://www.icr.org/article/Neanderthals-Possibly-Used-Pre-Flood-Methods/
Colledge, Sue, James Conolly, Enrico Crema, and Stephen Shennan. 2019. “Neolithic Population Crash in Northwest Europe Associated with Agricultural Crisis.” Quaternary Research 92, no. 3 (23 August): 1–22.
Cuozzo, Jack. 1998. Buried Alive: The Startling, Untold Story About Neanderthal Man. Green Forest, Arkansas: Master Books.
Froede, Carl R. Jr., and A. Jerry Akridge. 2023. “Rocks Don’t Lie–Battling Worldviews.” Journal of Creation 37, no. 2 (August): 6–8.
Fu, Qiaomei, Heng Li, Priya Moorjani, Flora Jay, Sergey M. Slepchenko, Aleksei A. Bondarev, Philip L. F. Johnson, et al. 2014. “The Genome Sequence of a 45,000-Year-Old Modern Human from Western Siberia.” Nature 514, no. 7523 (22 October): 445–449.
Habermehl, Anne. 2010. “Those Enigmatic Neanderthals: What Are They Saying? Are We Listening?” Answers Research Journal 3 (January 13): 1–21. https://answersresearchjournal.org/those-enigmatic-neanderthals/.
Harris, Kelley, Rasmus Nielsen. 2016. “The Genetic Cost of Neanderthal Introgression.” Genetics 203, no. 2 (1 June): 881–891.
Hayden, Brian. 2012. “Neandertal Social Structure?” Oxford Journal of Archaeology 31 no. 1 (February): 1–26.
Jeanson, Nathaniel T. 2019. “Testing the Predictions of the Young-Earth Y Chromosome Molecular Clock: Population Growth Curves Confirm the Recent Origin of Human Y Chromosome Differences.” Answers Research Journal 12 (December 4): 405–423. https://answersresearchjournal.org/human-y-chromosome-molecular-clock/.
Jeanson, Nathaniel T. 2022. Traced: Human DNA’s Big Surprise. Green Forest, Arkansas: Master Books.
Jeanson, Nathaniel T., and Ashley Holland. 2019. “Evidence for a Human Y Chromosome Molecular Clock: Pedigree-Based Mutation Rates Suggest a 4,500-Year History for Human Paternal Inheritance.” Answers Research Journal 12 (December 4): 393–404. https://answersresearchjournal.org/evidence-y-chromosome-molecular-clock/.
Karmin, Monika, Lauri Saag, Mário Vicente, Melissa A. Wilson Sayres, Mari Järve, Ulvi Gerst Talas, Siiri Rootsi, et al. 2015. “A Recent Bottleneck of Y Chromosome Diversity Coincides with a Global Change in Culture.” Genome Research 25, no. 4 (April): 459–466.
Keller, Andreas, Angela Graefen, Markus Ball, Mark Matzas, Valesca Boisguerin, Frank Maixner, Petra Leidinger, et al. 2012. “New Insights into Tyrolean Iceman’s Origin and Phenotype as Inferred by Whole-Genome Sequencing.” Nature Communications 689 (28 February).
Kivisild, Toomas. 2017. “The Study of Human Y Chromosome Variation Through Ancient DNA.” Human Genetics 136 no. 5 (4 March): 529–546.
Lubenow, Marvin L. 2004. Bones of Contention: A Creationist Assessment of Human Fossils. Grand Rapids, Michigan: Baker Books.
Mallick, Swapan, Adam Micco, Matthew Mah, Harald Ringbauer, Iosif Lazaridis, Iñigo Olalde, Nick Patterson, and David Reich. “The Allen Ancient DNA Resource (AADR): A Curated Compendium of Ancient Human Genomes.” bioRxiv 2023 April 6, 2023.04.06.535797. doi:10.1101/2023.04.06.535797.preprint.
Oard, M. 2003. “Neanderthal Man—The Changing Picture: An Overview of How This Alleged ‘Subhuman’ is Being Progressively Rehabilitated, Despite the Evolutionary Bias Resisting the Trend.” Answers. https://answersingenesis.org/human-evolution/neanderthal/neandertal-man-the-changing-picture/.
Pääblo, S. 2022. “The Neandertal Genome and the Evolution of Modern Humans.” Nobel Prize Lecture presented at Aula Medica, Karolinska Institutet in Stockholm, Sweden on 7 December, 2022. https://www.nobelprize.org/prizes/medicine/2022/paabo/lecture/.
Petr, Martin, Mateja Hajdinjak, Qiaomei Fu, Elena Essel, Hélène Rougier, Isabelle Crevecoeur, Patrick Semal, et al. 2020. “The Evolutionary History of Neanderthal and Denisovan Y Chromosomes.” Science 369, no. 6511 (25 September) 1653–1656.
Prüfer, Kay, Fernando Racimo, Nick Patterson, Flora Jay, Sriram Sankararaman, Susanna Sawyer, Anja Heinze, et al. 2014. “The Complete Genome Sequence of a Neandertal From the Altai Mountains.” Nature 505, no. 7418 (January 2): 43–49.
Prüfer, Kay, Cesare de Filippo, Steffi Grote, Fabrizio Mafessoni, Petra Korlevic´, Mateja Hajdinjak, Benjamin Vernot, et al. 2018. “A High-Coverage Neandertal Genome From Vindija Cave in Croatia.” Science 358 no. 6363 (November 3): 655–658.
Robertson, Mark, and Jonathan Sarfati. 2003. “More Evidence Neandertals Were Fully Human.” TJ 17, no. 3 (December): 13.
Sankararaman, Sriram, Swapan Mallick, Michael Dannemann, Kay Prüfer, Janet Kelso, Svante Pääbo, Nick Patterson, and David Reich. 2014. “The Landscape of Neanderthal Ancestry in Present-Day Humans.” Nature 507, no. 7492 (March 20): 354–357.
Shennan, S. and K. Edinborough. 2007. “Prehistoric Population History: From the Late Glacial to the Late Stone Age in Central and Northern Europe.” Journal of Archaeological Science 34, no. 8 (August): 1339–1345.
Sinha, Jitendra Kumar, Shampa Ghosh, and Manchala Raghunath. 2014. “Progeria: A Rare Genetic Premature Ageing Disorder.” Indian Journal of Medical Research 139, no. 5 (May): 667–674.
Thomas, Brian, and Jeffrey Tomkins. 2014. “How Reliable Are Genomes from Ancient DNA?” Journal of Creation 28 no. 3 (December): 92–98.
Timmermann, Axel. 2020. “Quantifying the Potential Causes of Neanderthal Extinction: Abrupt Climate Change Versus Competition and Interbreeding.” Quaternary Science Reviews 238 (15 June): 106331.
Vaesen, Krist, Gerrit L. Dusseldorp, and Mark J. Brandt. “An Emerging Consensus in Palaeoanthropology: Demography was the Main Factor for the Disappearance of Neanderthals.” Sceintific Reports 11, 1 March: 4925. https://www.nature.com/articles/s41598-021-84410-7
Villa, Paola, and Wil Roebroeks. 2014. “Neanderthal Demise: An Archaeological Analysis of the Modern Human Superiority Complex.” PLoS One 9, no. 4, (April 30): e96424.


