The views expressed in this paper are those of the writer(s) and are not necessarily those of the ARJ Editor or Answers in Genesis.
Abstract
Baraminology studies are beginning to use genetic data more regularly to elucidate the distance between the kinds. However, we do not know whether to expect all kinds to be internally equidistant or if there will be variance in sequence similarity between kinds. Nor do we know what factors may contribute to the genetic similarity or dissimilarity within and between kinds. This lack of knowledge seriously hampers our ability to estimate the boundaries of a given kind. This paper proposes that kinds should not be expected to be equidistant and suggests several lineage-related factors that would influence the genetic diversity of these kinds. Using mitochondrial sequence similarities, this paper analyzes sampled taxa, speciation rates, and founding population size to see which metrics correlate with sequence divergence. Other possible metrics are suggested, some of which are unavailable at present, while others could be the subject of future studies. These metrics may help predict the divergence levels of created kinds in future studies.
Keywords: Baraminology, mtDNA, speciation rates, genetic diversity, baramin, diversification
Introduction
Baraminology, the study of created kinds, has existed since Linneaus (Linnaeus 2003, 113), though the word baramin did not come into existence until much later (Marsh 1941), and the word baraminology even later than that (Wise 1990). Statistics followed shortly thereafter (Robinson and Cavanaugh 1998). While there has been some effort to determine what a kind is (Lightner, Hennigan, and Purdom 2011; Wood 2006; Wood et al. 2003), there has been little effort to set forth what results should be expected when conducting statistical baraminological analysis.
Precisely what a kind is remains a subject of some debate. Most baraminologists have assumed it is generally at the family level of the Linnean classification system (Wood 2006). However, there are known exceptions (for example, Proboscidea) (Lightner 2012), and some baraminologists have taken issue with the estimation. Wilson (2021) has proposed using taxonomically restricted genes to identify kind boundaries. While this could be helpful, gene loss is possible, making these genes only a partial solution to identifying the boundaries of kinds. For the purposes of this paper, the kind will be assumed to be at the family level, unless previous research has shown it to be elsewhere.
The Bible gives us only minimal information about the original baramins. We do not know how many individuals comprised the original kinds, nor how broad the variation between those individuals was. It may be reasonable to assume, since the Bible tells us that the fish and the birds were abundant, that there were more than pairs. However, that assumption is not explicitly stated. For air-breathing, land-dwelling animals, we have a little bit more information. We are told that anywhere from two to seven (or 14) individuals of each kind entered the ark (Genesis 7:2) and that they were reproductive groups (Genesis 6:19, Genesis 7:3, Genesis 8:17).
From these limited statements, we can infer that kinds were groups of reproductively compatible organisms in the past, though they may not be today. We can also infer, based on simple genetic principles, that kinds with more starting individuals should potentially be more diverse today, all other things being equal. All other things, however, are not usually equal. Different kinds have diversified differently since exiting the Ark. For example, there are hundreds of extant species of Muridae, but just one of Phascolarctidae, yet both were on the Ark, with just two founding members. The two kinds must have followed very different pathways to reach the modern number of species.
Several factors could be influencing the diversification rates across kinds, including generation times, mutation rates, starting diversity, starting population size, dispersal ability, and habitat variability, among others. Mutation rates are an obvious predictor of diversity within a kind. Generally speaking, the lower a mutation rate is in each species, the lower its genetic diversity (Feng et al. 2017; Xu et al. 2019). A broad study of birds and mammals found that mitochondrial DNA diversity is strongly associated with mtDNA mutation rates (Nabholz, Glémin, and Galtier 2009). A separate study, also in birds, linked the mutation rate to the diversification rate (Lanfear et al. 2010). In plants, the substitution rate has been linked to the rate of diversification as well (Bromham et al. 2015).
However, even within species, mutation rates are not always uniform, with one study of vertebrate mutation rates finding that mammalian and avian males had higher mutation rates on average than females, and that the among-species rate varied by a factor of 40 (Bergeron et al. 2023). Diversity is further driven by the initial DNA variation of the founders. If the original kinds were created heterozygous (Jeanson and Lisle 2016; Sanders 2025), then they began with maximum diversity already present. While the Flood narrative tells us nothing about genetics, we can assume from the variability shown by many kinds today that at least some of the kinds on the Ark were maximally diverse. If this is true, then mutation rates may have merely added to existing diversity, rather than driving it. Of course, in a small population as would have existed post-Flood, it is easy for certain alleles to become fixed while others fade out of the population (Gamache et al. 2003; Hagan et al. 2024; Hundertmark and Van Daele 2010). However, these founder effects may not strongly reduce diversity in some instances (Bergman et al. 2025; Eales, Thorpe, and Malhotra 2008).
Long generation times have been associated with the maintenance of genetic diversity in a number of species (Hailer et al. 2006; Lippe, Dumont, and Bernatchez 2006). However, mutation rates are higher in short-generation species, theoretically increasing genetic diversity within those taxa (Thomas et al. 2010; Weller and Wu 2015). This is complicated, however, by the Y chromosome having a higher mutation rate than the X, and having a faster rate in long, not short generation species (Goetting-Minesky and Makova 2006). However, assuming created heterozygosity, and knowing that heterozygosity drops by half in each generation, the fewer generations a kind has undergone since the flood, the higher its expected heterozygosity will be. The ability of organisms within a kind to disperse from their natal areas could also have an impact on expected genetic diversity. It has been proposed that moderate dispersal ability would lead to the most species-rich groups, but the hypothesis requires further testing (Cadotte 2006; Yamaguchi 2022). Dispersal within a species helps to maintain genetic diversity (Meyer, Kalko, and Kerth 2009), but diversity is largely reduced at the margins of the species range (Cahill and Levinton 2016). Where dispersal is limited, diversity tends to be lower as well (Dubey and Shine 2010).
Some of these variables are complex and difficult to model at the kind level, since different members may have different behaviors. It would not be fair or accurate to model the dispersal behavior of all felids on Panthera leo. In P. leo females only disperse in certain environmental conditions (VanderWaal, Mosser, and Packer 2009), and males almost always disperse from their natal territories (Elliot et al. 2014). However, in P. pardus only about 60% of the males disperse (Fattebert et al. 2015a, 2015b). The mutation rate for one species may differ from the mutation rate of another species in the same kind, and so on. However, there are a few things we can measure. Using modern genetic algorithms, we can estimate how similar the genetic sequences of the members of a given kind are. We can estimate from Scripture roughly how many members of each kind were on the Ark. We can also infer a speciation rate by taking the number of members of a given kind in the present and dividing by years since the Flood.
Using the available information, there are some possible questions that can be answered. Are all kinds internally genetically equidistant? Is there a genetic cutoff beyond which species A and B cannot be members of the same kind? If not, in what situations would we expect the members of the same kind to have high levels of genetic similarity? I present the following hypotheses:
- Kinds will not be internally genetically equidistant from one another.
- Kinds with more species will be less genetically similar to one another.
- Kinds with an elevated rate of speciation will be more genetically diverse.
- Kinds with a larger starting population in the post-Flood world will have higher diversity and have more species in the modern world.
Materials and Methods
Genetic similarity values for over 100 mammalian families were obtained, with permission, from the supplemental material of Cserhati (2026). Numbers of extant species in each mammalian family were obtained from the Mammal Diversity Database (Burgin et al. 2025). All taxonomic groups with three or fewer members were removed, leaving 47 groups for analysis. Speciation rates were calculated by dividing the number of species per family by the number of years since the Flood, estimated at 4,326 years. The founding Ark population size was inferred from Scripture, with 14 being chosen for the clean and flying kinds. For kinds that may have survived outside the Ark, like dolphins and whales, the number was set to ten, to account for the heavy cull the Flood would have caused.
To determine whether mitochondrial sequence dissimilarity was correlated with the number of species in the given kind, a beta-regression model was used, with a log transformation of the number of species to account for variation in group size. A beta-regression model was then used with a log transformation of the speciation rate to test for correlation between speciation rate and mitochondrial sequence dissimilarity. A third beta-regression model was performed to test correlations between starting populations and mitochondrial sequence dissimilarity. The three variables were then combined into a single beta-regression model to determine which ones significantly contributed to mitochondrial dissimilarity. Beta-regression was used because the data ranged between zero and one. In each case, a linear model was run as a sanity check. A permutation test was also performed for each model, using 999 permutations, to ensure the effect was not an artifact of data structure. Statistics were done in R (R Core Team 2025).
Results/Discussion
Sequence similarity was correlated with all three primary variables. The regression analysis between sequence similarity and the number of species was significant (p = 0.0015), indicating that the lower sequence similarity was associated with the increased number of species (Fig. 1). The permutations were significant (p = 0.03). The linear model was also significant (p = 0.0053). This is not unexpected. Different species within the same kind have different mutation rates (Nabholz, Glémin, and Galtier 2008). The different rates and lineage-specific mutations will build up differences between species’ mitochondrial sequences. The more species there are within a given kind, the larger the divergence in their sequences, and therefore the smaller their sequence similarity. However, the number of sampled species does not tell the whole story, because in many cases, there are more species in the kind than those for which mtDNA is available. The extent of missing data was calculated by subtracting the number of species included in the dataset from the number of extant species in each family, summing the results, then dividing the result by the number of families in the dataset. The mean number of missing species across all the families is 45.4. These missing species may explain why, when the combined model is run, the log of sampled species has no effect.
Speciation rate, because it was calculated from extant species numbers, suffers from no such ill effects. The regression analysis of sequence similarity and speciation rate indicating lower sequence similarity was associated with a higher speciation rate (p = 0.001) (Fig. 2). Permutations were significant (p < 0.001). The linear model was also significant (p = 0.001). Because speciation occurs at different times, from different ancestral taxa, carrying different mtDNA sequences, increasing the number of species in each kind would be expected to increase mtDNA sequence diversity. However, this can be mediated by environmental conditions. In bacteria, taxonomic diversity is negatively correlated with gene diversity due to changes in soil pH (Wang et al. 2023). In other words, bacterial genetic diversity decreases as pH increases. However, this analysis is confounded by the likelihood of multiple kinds within the bacteria sampled. The drawback is that speciation rates are almost certainly higher for every kind in the dataset because some species are extinct. While the more species rich kinds are likely to have more extinct taxa, some extant kinds have only a few living members but many extinct taxa. However, it seems clear that the higher the speciation rate within a kind, the more diverse its mtDNA sequences should be expected to be.
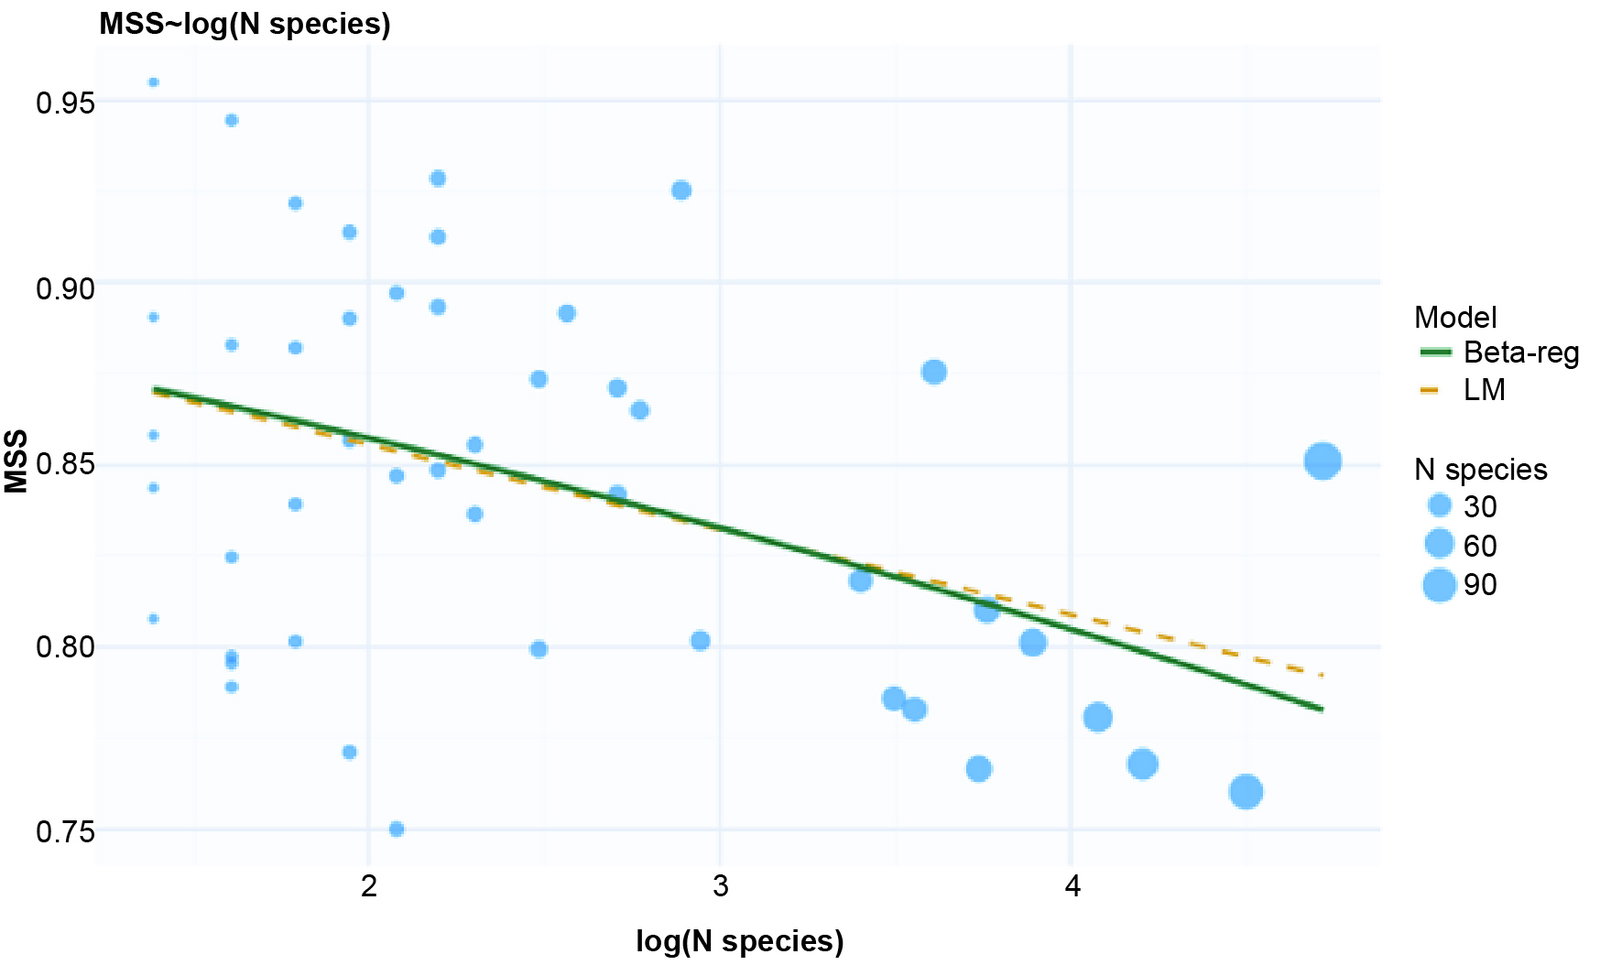
Fig. 1. Beta-regression for the correlation between the log of the sampled species and mitochondrial sequence divergence.
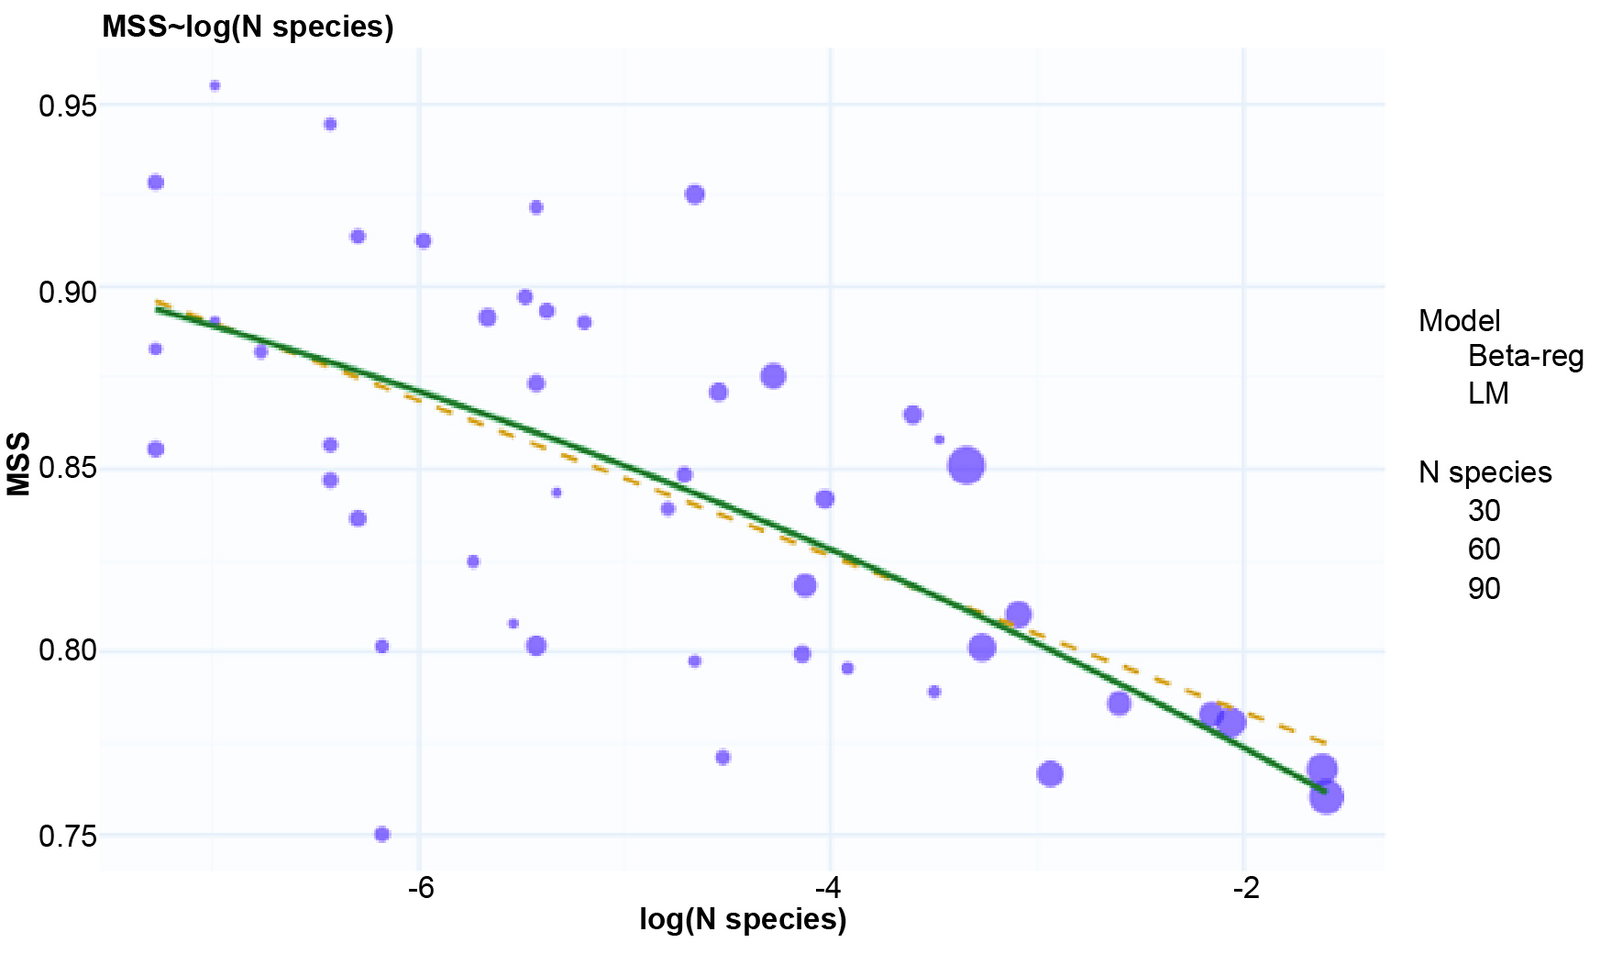
Fig. 2. Beta-regression for the correlation between the log of the speciation rate and the mitochondrial sequence diversity.
The regression analysis of the sequence similarity with starting population size was significant (p = 0.019). Permutations for the sequence similarity compared to starting population were also significant (p = 0.015). The linear model was also significant (p = 0.0498). While these results are significant, starting population size, while equally correlated with sequence divergence, cannot be given the same strength as speciation rate, for two reasons. First, the mammalian kinds that existed outside the Ark, such as the Delphinidae or Balaenopteridae have a starting population size that is unknown. The Bible does not record how many of them survived the Flood, since they were not on the Ark. While we are told the unclean animals came in pairs, there is debate about whether the clean and flying kinds came in sevens or fourteens. In either case, the starting population of the clean and flying kinds was larger than the unclean kinds.
The combined model had two significant variables. Speciation rate and starting population size were significant (p = 0.001 for both), while number of extant species was not significant (p = 0.8322). Permutations were significant for speciation rate and starting population (p = 0.001, p = 0.004), but not significant for the number of extant species (p = 0.8929). These results can help illuminate what we should expect when attempting to elucidate the boundaries of kinds. Those boundaries cannot be expected to be homogeneous. Development in different habitats, at different times, with different rates of adaptation and mutation, would preclude different kinds from having similar cutoffs of similarity. This may also apply to morphological studies, although no work has been done in that area yet. It may be possible in the future to use known speciation rates to predict the genetic diversity of a given kind. However, much more research is needed in this area. In the future, mutation rates, habitat, behavioral data, and dispersal capabilities should be evaluated as predictors of current genetic diversity within kinds.
Conclusion
Speciation rates and starting population size correlate with sequence divergence in mammalian kinds. The number of sampled species also correlated but was not significant in the full model. Speciation rate, along with other demographic factors, may help drive diversification and, as such, may serve as predictors of genetic diversity within kinds. However, this is a highly underexplored area, and much more research needs to be done to build a full model capable of predicting the diversity of a given kind.
Acknowledgements
I wish to thank Matthew Cserhati for allowing me to use data from his paper to help with the analysis in this paper.
References
Bergeron, Lucie A., Søren Besenbacher, Jiao Zheng, Panyi Li, Mads Frost Bertelsen, Benoit Quintard, Joseph I. Hoffman, et al. 2023. “Evolution of the Germline Mutation Rate Across Vertebrates.” Nature 615, no. 7951 (March): 285–291.
Bergman, Nora M., Petteri Lehikoinen, Edward Kluen, Staffan Bensch, Camilla Lo Cascio Sætre, Fabrice Eroukhmanoff, Frode Fossøy, et al. 2025. “Combined Evidence Reveals the Origin of a Rapid Range Expansion Despite Retained Genetic Diversity and a Weak Founder Effect.” Molecular Ecology 34, no. 19 (October): e70077.
Burgin, Connor J., Jelle S. Zijlstra, Madeleine A. Becker, Heru Handika, Jesse M. Alston, Jane Widness, Schuyler Liphardt, David G. Huckaby, and Nathan S. Upham. 2025. “How Many Mammal Species are there Now? Updates and Trends in Taxonomic, Nomenclatural, and Geographic Knowledge.” Journal of Mammalogy 106, no. 5 (October): 1082–1117.
Bromham, Lindell, Xia Hua, Robert Lanfear, and Peter F. Cowman. 2015. “Exploring the Relationships Between Mutation Rates, Life History, Genome Size, Environment, and Species Richness in Flowering Plants.” The American Naturalist 185, no. 4 (April): 507–524.
Cadotte, Marc William. 2006. “Dispersal and Species Diversity: A Meta-Analysis.” The American Naturalist 167, no. 6 (June): 913–924.
Cahill, Abigail E. and Jeffrey S. Levinton. 2016. “Genetic Differentiation and Reduced Genetic Diversity at the Northern Range Edge of Two Species with Different Dispersal Modes.” Molecular Ecology 25, no. 2 (January): 515–526.
Cserhati, M. 2026. “Mitogenomic Baraminology Analysis and the Search for the Baraminic Demarcation Values Among Class Mammalia.” Creation Research Society Quarterly 62, no. 4 (Spring): 276–284.
Dubey, S., and R. Shine. 2010. “Restricted Dispersal and Genetic Diversity in Populations of an Endangered Montane Lizard (Eulamprus leuraensis, Scincidae).” Molecular Ecology 19, no. 5 (March): 886–897.
Eales, J., R. S. Thorpe, and A. Malhotra. “Weak Founder Effect Signal in a Recent Introduction of Caribbean Anolis.” Molecular Ecology 17, no. 6 (5 February): 1416–1426.
Elliot, Nicholas B., Samuel A. Cushman, Andrew J. Loveridge, Godfrey Mtare, and David W. Macdonald. 2014. “Movements Vary According to Dispersal Stage, Group Size, and Rainfall: The Case of the African Lion.” Ecology 95, no. 10 (October), 2860–2869.
Fattebert, Julien, Guy Balme, Tristan Dickerson, Rob Slowtow, and Luke Hunter. 2015a. “Density-Dependent Natal Dispersal Patterns in a Leopard Population Recovering from Over-Harvest.” PLoS One 10, no. 4: 0122355.
Fattebert, Julien, Hugh S. Robinson, Guy Balme, Rob Slotow, and Luke Hunter. 2015b. “Structural Habitat Predicts Functional Dispersal Habitat of a Large Carnivore: How Leopards Change Spots.” Ecological Applications 25, no. 7 (October): 1911–1921.
Feng, C., Mats Pettersson, Sangeet Lamichhaney, Carl-Johan Rubin, Nima Rafati, Michele Casini, Arild Folkvord, and Leif Andersson. 2017. “Moderate Nucleotide Diversity in the Atlantic Herring is Associated with a Low Mutation Rate.” eLife 6 (June): 23907.
Gamache, Isabelle, Juan Pablo Jaramillo-Correa, Serge Payette, and Jean Bousquet. 2003. “Diverging Patterns of Mitochondrial and Nuclear DNA Diversity in Subarctic Black Spruce: Imprint of a Founder Effect Associated with Postglacial Colonization.” Molecular Ecology 12, no. 4 (April): 891–901.
Goetting-Minesky, M. Paula, and Kateryna D. Makova. 2006. “Mammalian Male Mutation Bias: Impacts of Generation Time and Regional Variation in Substitution Rates.” Journal of Molecular Evolution 63, no. 4 (October): 537–544.
Hagan, Thomas, Guiling Ding, Gabriele Buchmann, Benjamin P. Oldroyd, and Rosalyn Gloag. 2024. “Serial Founder Effects Slow Range Expansion in an Invasive Social Insect.” Nature Communications 15 (29 April): Article number 3608.
Hailer, Frank, Björn Helander, Alv O. Folkestad, Sergei A. Ganusevich, Steinar Garstad, Peter Hauff, Christian Koren, Torgeir Nygård, Veljo Volke, Carles Vilà, and Hans Ellegren. 2006. “Bottlenecked but Long-Lived: High Genetic Diversity Retained in White-Tailed Eagles Upon Recovery from Population Decline.” Biology Letters 2, no. 2 (March 8): 316–319.
Hundertmark, Kris J., and Larry J. Van Daele. 2010. “Founder Effect and Bottleneck Signatures in an Introduced, Insular Population of Elk.” Conservation Genetics 11 (24 November): 139–147.
Jeanson, Nathaniel T., and Jason Lisle. 2016. “On the Origin of Eukaryotic Species’ Genotypic and Phenotypic Diversity.” Answers Research Journal 9 (April 20): 81–122. https://answersresearchjournal.org/origin-eukaryotic-species-diversity/.
Lanfear, Robert, Ho, Simon Y. W., Dominic Love, and Lindell Bromham. 2010. “Mutation Rate Linked to Diversification in Birds.” Proceedings of the National Academy of Sciences USA, 107, no. 47 (November 8): 20423–20428.
Lightner, Jean, Tom Hennigan, and Georgia Purdom. 2011. “Determining the Ark Kinds.” Answers Research Journal 4 (November 16): 195–201. https://answersresearchjournal.org/determining-the-ark-kinds/.
Lightner, Jean. 2012. “Mammalian Ark Kinds.” Answers Research Journal 5 (October 31): 151–204. https://answersresearchjournal.org/mammalian-ark-kinds/.
Linnaeus, Carl. 2003. Philosophia Botanica. Translated by Stephen Freer. Oxford, United Kingdom: Oxford University Press.
Lippé, Catherine, Pierre Dumont, and Louis Bernatchez. 2006. “High Genetic Diversity and No Inbreeding in the Endangered Copper Redhorse, Moxostoma hubbsi (Catostomidae, Pisces): The Positive Sides of a Long Generation Time.” Molecular Biology 15, no. 7 (June): 1769–1780.
Marsh, Frank L. 1941. Fundamental Biology. Lincoln, Nebraska: Self-published.
Meyer, Christoph F. J., Elisabeth K. V. Kalko, and Gerald Kerth. 2009. “Small-Scale Fragmentation Effects on Local Genetic Diversity in Two Phyllostomid Bats with Different Dispersal Abilities in Panama.” Biotropica 41, no. 1 (January): 95–102.
Nabholz, Benoit, Sylvain Glémin, and Nicolas Galtier. 2008. “Strong Variations of Mitochondrial Mutation Rate across Mammals—The Longevity Hypothesis.” Molecular Biology and Evolution 25, no. 1 (January): 120–130.
Nabholz, Benoit, Sylvain Glémin, and Nicolas Galtier. 2009. “The Erratic Mitochondrial Clock: Variations of Mutation Rate, not Population Size, Affect mtDNA Diversity across Birds and Mammals.” BMC Evolutionary Biology 9 (10 March): Article number 54.
R Core Team 2025. “A Language and Environment for Statistical Computing.” R Foundation for Statistical Computing, Vienna, Austria: https://www.R-project.org/.
Robinson, D. Ashley, and David P. Cavanaugh. 1998. “A Quantitative Approach to Baraminology with Examples from the Catarrhine Primates.” Creation Research Society Quarterly 34, no. 4 (March): 196–208.
Sanders, Harry. 2025. “Original Polyploidy as a Contributor to Diversification.” Creation Research Society Quarterly 61, no. 3 (Winter): 189–201.
Thomas, Jessica A., John J. Welch, Robert Lanfear, and Lindell Bromham. “A Generation Time Effect on the Rate of Molecular Evolution in Invertebrates.” Molecular Biology and Evolution 27, no. 5 (May): 1173–1180.
VanderWaal, Kimberly L., Anna Mosser, and Craig Packer. 2009. “Optimal Group Size, Dispersal Decisions and Postdispersal Relationships in Female African Lions.” Animal Behaviour 77, no. 4 (April): 949–954.
Wang, Cong, Qing-Yi Yu, Niu-Niu Ji, Yong Zheng, John W. Taylor, Liang-Dong Guo, and Cheng Gao. 2023. “Bacterial Genome Size and Gene Functional Diversity Negatively Correlate with Taxonomic Diversity along a pH Gradient.” Nature Communications 14 (17 November): Article number 7437.
Weller, Cory, and Martin Wu. 2015. “A Generation-Time Effect on the Rate of Molecular Evolution in Bacteria.” Evolution 69, no. 3 (March): 643–652.
Wilson, G. 2021. “Genomic Equivalence and Speciation: Proposing a New Criterion for Baraminology.” Journal of Creation Theology and Science Series B: Life Sciences 11: 42–46.
Wise, Kurt. P. 1990. “Baraminology: A Young-Earth Creation Biosystematic Method.” In Proceedings of the Second International Conference on Creationism. Edited by R. E. Walsh, 345–358. Pittsburgh, Pennsylvania: Creation Science Fellowship.
Wood, Todd C. 2006. “The Current Status of Baraminology.” Creation Research Society Quarterly 43, no. 3 (December): 149–158.
Wood, T.C., Wise, K.P., Sanders, R., and N. Doran. 2003. “A Refined Baramin Concept.” Occasional Papers of the BSG (Baraminology Study Group 3: 1–14.
Xu, Shuqing, Jessica Stapley, Saskia Gablenz, Justin Boyer, Klaus J. Appenroth, K. Sowjanya Sree, Jonathan Gershenzon, Alex Widmer, and Meret Huber. 2019. “Low Genetic Variation is Associated with Low Mutation Rate in Giant Duckweed.” Nature Communications 10: Article number 1243.
Yamaguchi, Ryo. 2022. “Intermediate Dispersal Hypothesis of Species Diversity: New Insights.” Ecological Research 37, no. 3 (May): 301–315.