The views expressed in this paper are those of the writer(s) and are not necessarily those of the ARJ Editor or Answers in Genesis.
Abstract
Since the original 2005 report for the chimpanzee (chimp) genome assembly (5X rough draft), an additional one-fold redundant coverage has been added. Using the new 6X chimpanzee assembly, a sequential comparison to the human genome was performed on an individual chromosome basis. The chimpanzee chromosomes, were sliced into new individual query files of varying string lengths and then queried against their human chromosome homolog using the BLASTN algorithm. Using this approach, queries could be optimized for each chromosome irrespective of gene/feature linear order. Non-DNA letters (gap filling ‘N’s) were stripped from the query data and excluded from the analyses. The definition of similarity for each chromosome was the amount (percent) of optimally aligned chimp DNA. This definition was considered to be conservative because it did not include the amount of human DNA absent in chimp nor did it include chimp DNA that was not aligned to the human genome assembly (unanchored sequence contigs). For the chimp autosomes, the amount of optimally aligned DNA sequence provided similarities between 66 and 76%, depending on the chromosome. In general, the smaller and more gene-dense the chromosomes, the higher the DNA similarity—although there were several notable exceptions defying this trend. Only 69% of the chimpanzee X chromosome was similar to human and only 43% of the Y chromosome. Genome-wide, only 70% of the chimpanzee DNA was similar to human under the most optimal sequence-slice conditions. While, chimpanzees and humans share many localized protein-coding regions of high similarity, the overall extreme discontinuity between the two genomes defies evolutionary timescales and dogmatic presuppositions about a common ancestor.
Keywords: comparative genomics, human-chimp DNA similarity, human genome, chimpanzee genome, DNA sequencing, genome sequencing
Introduction
A common evolutionary claim is that the DNA of chimpanzees (Pan troglodytes) and humans (Homo sapiens) are nearly identical. However, this over-simplified and often-touted claim is now becoming much less popular among primate evolutionists as modern DNA research is showing much higher levels of discontinuity between the structure and function of the human and chimp genomes. This change in attitude within the secular research community was well-characterized by leading primate evolutionist Todd Preuss when he made the following statement in the abstract of a 2012 Proceedings of the National Academy of Sciences of the United States of America review.
It is now clear that the genetic differences between humans and chimpanzees are far more extensive than previously thought; their genomes are not 98% or 99% identical (Preuss 2012, p. 10709).
One of the major problems with past research in comparative DNA analysis between chimps and humans was recently reviewed in several reports (Bergman and Tomkins 2012; Tomkins and Bergman, 2012). They found that there is a great deal of preferential and selective treatment of the data being analyzed. In many cases, only the most promising data such as gene-rich sequences that exist in both species (homologs) is utilized from a much larger data pool. This pre-selected data is often further subjected to more filtering before being analyzed and discussed. Non-alignable regions and large gaps in DNA sequence alignments are also typically omitted, thus increasing the levels of reported similarity.
The major milestone publication regarding the chimp genome comparison to human was the 2005 Nature paper from the International Chimpanzee Genome Sequencing Consortium. Unfortunately, this paper presented the comparative data with human in a highly selective and obfuscated format and the non-similar data from the alignments was largely absent. In general, the paper was more concerned with hypothetical evolutionary analyses for various divergence rates and selective forces in selected homologous regions than reporting the true levels of discontinuity between chimp and human DNA. In fact, the critical issue of overall genome similarity was largely avoided.
Nevertheless, enough data from the 2005 chimp genome project was available to allow rough estimates of overall genome similarity. Tomkins and Bergman (2012) derived a calculation that included published concurrent information from the human genome project along with the data reported in the 2005 chimpanzee paper and estimated an overall genome DNA similarity of 80.6%, which they proposed as a very conservative figure (see Tomkins and Bergman 2012, for details).
Interestingly, geneticist Richard Buggs took an even more exacting approach in calculating genome-wide DNA similarity using data from both the 2005 chimp genome report and the human genome project in a brief news report published in 2008. Because Buggs’ estimates closely match the outcome of this study, his work is quoted below.
To compare the two genomes, the first thing we must do is to line up the parts of each genome that are similar. When we do this alignment, we discover that only 2,400 million of the human genome’s 3,164.7 million “letters” align with the chimpanzee genome—that is, 76% of the human genome. Some scientists have argued that the 24% of the human genome that does not line up with the chimpanzee genome is useless “junk DNA”. However, it now seems that this DNA could contain over 600 protein-coding genes, and also code for functional RNA molecules.
Looking closely at the chimpanzee-like 76% of the human genome, we find that to make an exact alignment, we often have to introduce artificial gaps in either the human or the chimp genome. These gaps give another 3% difference. So now we have a 73% similarity between the two genomes.
In the neatly aligned sequences we now find another form of difference, where a single “letter” is different between the human and chimp genomes. These provide another 1.23% difference between the two genomes. Thus, the percentage difference is now at around 72%.
We also find places where two pieces of human genome align with only one piece of chimp genome, or two pieces of chimp genome align with one piece of human genome. This “copy number variation” causes another 2.7% difference between the two species. Therefore the total similarity of the genomes could be below 70%.
This figure does not include differences in the organization of the two genomes. At present we cannot fully assess the difference in structure of the two genomes, because the human genome was used as a template (or “scaffold”) when the chimpanzee draft genome was assembled (Buggs 2008).
Outside of these analyses of the original 2005 chimp report, additional genome-wide comparisons of an objective nature have been very limited. However, there have been several recent reports that are noteworthy.
At the time of this report, the details of a research study in which the individual chromosomes of chimp were compared to their counterpart in human is available in a privately published, but well-documented and freely available report (Progetto cosmo 2012). This effort employed an algorithm that involved the random selection of 10,000 30-base sequences from the query (chimp chromosome) and then determined their identity based on a query against their human chromosome counterpart. Excluding the Y chromosome, this study came up with an average 63% DNA identity (similarity) genome-wide. While the approach of this study was novel, it only involved the random sampling of a limited subset of small chromosomal pieces from each chimp chromosome across the genome.
In 2011 Tomkins queried 40,000 chimpanzee genomic DNA sequences against four different versions of the human genome assembly using a wide variety of BLASTN algorithm parameters (Tomkins 2011c). For just the aligned regions, depending on the algorithm parameter combinations, an 86–89% DNA similarity was observed. However, less than 20% of the total chimp DNA sequence actually aligned under the most optimal algorithm conditions. The average length of the chimp query sequences in the Tomkins 2011 study were 740 bases. These results indicate that localized regions of human-chimp DNA similarity breaks down significantly at stretches of DNA 740 bases long or less on average. The question then arises as to what query sequence lengths would be more optimal for comparing the chimp genome against human.
For a recent review of the creationist literature on human-chimp DNA similarity, see Tomkins (2011c, pp. 234–236). For several recent reviews of the secular (evolutionary) literature on the subject of human-chimp DNA similarity, see Bergman and Tomkins (2012) and Tomkins and Bergman (2012).
Since the original 2005 chimpanzee genome paper, additional redundant coverage has been added to the rough draft assembly of the chimpanzee genome as stated at the web site for the Genome Institute at Washington University—one of the lead sequencing centers on the project. The present chimpanzee genome assembly now includes a total 6-fold redundant coverage (http://genome.wustl.edu/genomes/view/pan_troglodytes/). Despite the fact that a DNA clone-based physical map has been constructed for chimpanzee, the 6-fold rough draft assembly of the chimpanzee genome is still largely based on the human genome assembly (Warren et al. 2006). In several recent review papers, Tomkins discussed how the chimp genome assembly was performed and listed a variety of important caveats and evolutionary biases associated with the technology (Tomkins 2011a; Tomkins 2011b).
For ongoing research, the chimpanzee genome assembly is now more complete and is also freely available as individual chromosome files that are homologous to their human counterparts to which they were anchored and assembled. This allows for a new less biased and complete comparison between the chimp and human genomes on an individual chromosome basis.
The preliminary analyses of Buggs (2008) and Progetto cosmo (2012) indicate that in conflict with evolutionary claims, overall chimp DNA similarity compared to human may be as low as 70% or less. These results demand a deeper re-evaluation of the data. The study testing BLASTN algorithm parameters in chimp DNA queries against the human genome by Tomkins (2011c), warrants an even more comprehensive genome analysis using smaller sequence slices that would maximize the alignment of chimp DNA. Using a range of smaller sequence slices for queries would not only allow for individual chromosome optimization, but would also increase alignment levels because it would be irrespective of gene/feature linear order. Therefore, a comprehensive chromosome-by-chromosome genome comparison between chimpanzee and human was undertaken using a complete range of sub-experiments based on different chimp DNA sequence slices. This allowed for the selection of chromosome-specific, sequence-slice optimized comparisons.
Materials and Methods
The most recent versions of the chimpanzee and human chromosome assemblies were downloaded from the UCSC Genome Browser FTP site (ftp://hgdownload.cse.ucsc.edu/goldenPath/panTro2/chromosomes/, http://hgdownload.cse.ucsc.edu/goldenPath/hg19/chromosomes/). Each chimp and human chromosome was unpackaged in fasta format. Individual human chromosome query databases were created using the makeblastdb program. A python script written by author Tomkins and Daryl Robbins (Institute for Creation Research, Manager of Information Technology) was used to produce new fasta query files taking filename and desired sequence slice size as arguments. BLASTN jobs were individually employed using a set of sequentially modified POSIX shell scripts via VIM commands and a perl script written by author Tomkins. BLASTN results were outputted as CSV format text files. Output *.csv files were parsed and analyzed via an integrated set of python and POSIX shell scripts written by Tomkins.
The computational server employed for BLASTN searches (Altschul et al. 1990) utilized an ASUS Sabertooth 990FX motherboard containing a single 6-CORE AMD FX-6200 CPU running at 3.8 GHz with 32 GB of DDR3 RAM and a Crucial 512 GB SSD main drive containing the Debian 6.0 Linux operating system. The most recent 64-bit version of the BLAST software package (ncbi-blast-2.2.27+) was utilized (ftp://ftp.ncbi.nlm.nih.gov/blast/executables/blast+/LATEST/).
BLASTN algorithm parameters for the main study were as follows: -word_size 11, -evalue 10, -max_target_seqs 1, -dust no, -soft_masking false, -ungapped. These optimized parameters were chosen largely on the results of Tomkins (2011c) and an extensive set of preliminary studies performed for the present project to optimize alignments. Preliminary issues analyzed prior to the main experiment included the testing of sequence slices as small as 50 bases, word size increases to 15, evalue stringencies to 0.00001, and the allowance/negation of sequence masking of both target and query data. Typically, multiple query jobs were run simultaneously using BLASTN CPU optimization for thread numbers (parameter ‘-num_threads’).
Post BLASTN output file analyses were transferred following completion, from the linux computational server using lftp and performed on a dual quad core Intel Xeon Apple Mac G5 Desktop system with 20 gigabytes of ram (Mac OS v10.8.2). Graph development for the data was performed in Excel using MS Office 2011 for Mac.
Results and Discussion
The most recent version of the chimpanzee chromosome assembly (aligned and anchored to human) was downloaded from the UCSC Genome Browser site. On an individual chromosome basis, new fasta query subfiles were created that produced fasta header line demarcated query files with sequences of 100 to 450 bases in 50-base increments for chimp chromosomes 1 to 4. For example, the first chimp chromosome 1 file contained sequences of 100 bases in length, the second file 150 bases, etc. Chimp chromosomes 2A and 2B were concatenated prior to processing for queries against human chromosome 2. In addition, the script used for making new fasta files also removed all ‘N’s from the chimp sequence that would have produced false alignments to the large spans of ‘N’s in the human assembly. Thus, for chromosomes 1 to 4, there were 8 different BLASTN query file experiments per chromosome for a total of 32 query experiments (Fig. 1). The top percentages for chimp DNA aligned to human are then reported in Table 1. For comparison of these results to the known gene density and level of sequence completion for human chromosomes, see Table 2 which contains data extracted from current information available from Cold Spring Harbor’s “Guide to the Human Genome” available at the www.cshlp.org web site.
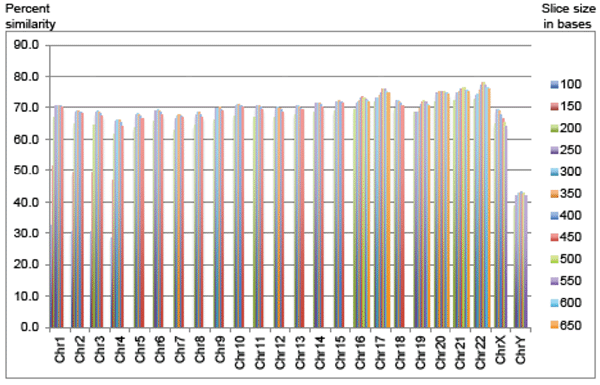
Fig. 1. Percent of chimp sequence aligned using optimized sequence slices sorted by chromosome.
Since the sequence slices below 200 bases produced non-optimal alignments, they were omitted for the rest of the chimp chromosomes (Fig. 1). For chimp chromosomes 5 to 15, and chromosome 18, sequence slice files of 200 to 450 base increments provided a complete range of results to select an optimal query slice. For chimp chromosomes 16, 17, and 19 to 22, sequence slice files of 200 to 650 base increments provided a complete range of results to select an optimal query file string size (10 query files per chromosome). In general, the larger chimp chromosomes, which contained larger stretches of non-coding DNA, had regions of similarity that were on average shorter than the smaller and more gene-dense chimp chromosomes, although there were several exceptions to this trend as discussed below.
| Chromosomes compared | Optimized slice size producing top similarity (number bases) | Percent chimp sequence aligned to human |
| 1 | 350 | 70.9 |
| 2A, 2B vs 2 (human) | 300 | 69.0 |
| 3 | 300 | 68.9 |
| 4 | 300 | 66.1 |
| 5 | 300 | 68.2 |
| 6 | 300 | 69.2 |
| 7 | 350 | 67.3 |
| 8 | 300 | 68.4 |
| 9 | 350 | 70.1 |
| 10 | 300 | 71.0 |
| 11 | 300 | 70.8 |
| 12 | 300 | 70.1 |
| 13 | 300 | 70.8 |
| 14 | 300 | 71.6 |
| 15 | 350 | 72.0 |
| 16 | 450 | 73.3 |
| 17 | 500 | 76.1 |
| 18 | 250 | 72.5 |
| 19 | 500 | 72.0 |
| 20 | 400 | 75.2 |
| 21 | 500 | 76.2 |
| 22 | 450 | 77.9 |
| X | 300 | 69.4 |
| Y | 400 | 43.2 |
| Chromosome | Total size (Mb) | Sequenced (Mb) | Genes | Genes/Mb | Genes/sequenced MB |
| 1 | 249.3 | 225.3 | 1959.0 | 7.9 | 8.7 |
| 2 | 243.2 | 238.2 | 1184.0 | 4.9 | 5.0 |
| 3 | 198.0 | 194.8 | 1029.0 | 5.2 | 5.3 |
| 4 | 191.2 | 187.7 | 721.0 | 3.8 | 3.8 |
| 5 | 180.9 | 177.7 | 835.0 | 4.6 | 4.7 |
| 6 | 171.1 | 167.4 | 1002.0 | 5.9 | 6.0 |
| 7 | 159.1 | 155.4 | 855.0 | 5.4 | 5.5 |
| 8 | 146.4 | 142.9 | 638.0 | 4.4 | 4.5 |
| 9 | 141.2 | 120.1 | 748.0 | 5.3 | 6.2 |
| 10 | 135.5 | 131.3 | 714.0 | 5.3 | 5.4 |
| 11 | 135.0 | 131.1 | 1236.0 | 9.2 | 9.4 |
| 12 | 133.9 | 130.5 | 987.0 | 7.4 | 7.6 |
| 13 | 115.2 | 95.6 | 305.0 | 2.7 | 3.2 |
| 14 | 107.3 | 88.3 | 577.0 | 5.4 | 6.5 |
| 15 | 102.5 | 81.7 | 547.0 | 5.3 | 6.7 |
| 16 | 90.4 | 78.9 | 783.0 | 8.7 | 9.9 |
| 17 | 81.2 | 77.8 | 1111.0 | 13.7 | 14.3 |
| 18 | 78.1 | 74.7 | 257.0 | 3.3 | 3.4 |
| 19 | 59.1 | 55.8 | 1332.0 | 22.5 | 23.9 |
| 20 | 63.0 | 59.5 | 518.0 | 8.2 | 8.7 |
| 21 | 48.1 | 35.1 | 213.0 | 4.4 | 6.1 |
| 22 | 51.3 | 34.9 | 418.0 | 8.2 | 12.0 |
| X | 155.3 | 151.1 | 806.0 | 5.2 | 5.3 |
| Y | 59.4 | 25.7 | 65.0 | 1.1 | 2.5 |
The definition of similarity for each chimp chromosome was the amount (percent) of optimally aligned chimp DNA (minus ‘N’s). This definition was considered to be quite conservative because it did not include the amount of human DNA absent in the chimp genome nor does it include chimp DNA that could not be aligned to the human genome assembly—a category of chimp DNA termed “unanchored contigs”. The inclusion of chimp DNA not able to be aligned and anchored to human, although negligible for most chromosomes, would have produced slightly lower overall similarities. Likewise, if the amount of human DNA not present in chimp could have also been factored in, this would have also produced somewhat lower overall chromosome similarities as well.
For the chimp autosomes, the amount of optimally aligned DNA sequence provided similarities between 66% and 76%, depending on the chromosome. In general, the smaller and more gene-dense the chromosomes, the higher the DNA similarity. Interestingly, the one autosome (chromosome 22) that was selected by secular researchers in 2004 for extensive comparison to human (Watanabe et al. 2004) also happens to be the most similar chromosome in the chimp genome at 77.9% in the present study. Furthermore, Watanabe et al. omitted large sections of chromosome 22 that contained extreme dissimilarities.
However, there were several exceptions to this generalized trend. For example, the most gene-dense human chromosome at 22.5 genes per megabase (Mb) of DNA is chr 19, and was not present in the top five highest chromosomes regarding percent chimp-human DNA similarity. Furthermore, the human chromosome that had the second highest similarity with chimp, which was number 21, only has a gene density of 4.4 genes per Mb—one of the lowest levels.
This data illustrates the fact that gene density is not always a dependable predictor of high similarity between chimp and human DNA. In the past, evolutionists have selectively used certain homologous gene-dense DNA segments between human and chimps to produce high levels of DNA similarity, claiming that it represented genome-wide patterns (Bergman and Tomkins, 2012; Tomkins and Bergman, 2012). This is clearly not always the case, even within gene-dense chromosomes.
Only 69% of the chimpanzee X chromosome was similar to human and only 43% of the Y chromosome.The MSY regions of the chimp and human Y-chromosomes were recently compared in great detail and found to be extremely dissimilar in not only DNA sequence similarity, but also gene content (Hughes et al. 2010). This present study confirms the striking difference between human and chimp Y chromosomes, and indicates that these differences are still being largely understated.
Genome-wide, only 70% of the chimpanzee DNA was similar to human under the most optimal sequence-slice conditions. In fact, this would be considered to be a conservative estimate well within the range of results provided by other recent attempts by Buggs (2008) and Progetto cosmo (2012), mentioned above. One must also keep in mind the fact that the chimpanzee genome assembly is still based largely on the human genomic framework as discussed in detail by author Tomkins in several journal publications (Tomkins, 2011a; Tomkins 2011b). In fact, this current study did not use any of the unanchored chimpanzee sequencing contigs that could not be aligned to the human genome.
Had these additional segments of DNA been included, similarities would have been lowered even further, although only slightly. Furthermore, human DNA not found in chimp was also not included in the comparison—another factor that would have lowered similarity estimates. While, chimpanzees and humans do share many localized protein-coding regions of very high similarity, there is overall an extreme DNA sequence discontinuity between the two genomes, which defies evolutionary time-scales and dogmatic presuppositions about a common ancestor.
Conclusions
Since the original publication of the chimpanzee (chimp) genome assembly (5X rough draft) in 2005, an additional one-fold redundant coverage has been performed and integrated into the currently available version of the chimpanzee genome assembly. Using the currently available 6X chimpanzee assembly, a new genome-wide sequential comparison of chimp DNA to the human genome was performed on an individual chromosome basis. The chimp chromosomes were sliced into new individual query files of varying string lengths and then queried against their human chromosome homolog using the BLASTN algorithm with optimized parameters.
Using this approach, multiple queries could be performed for each chromosome and the most optimized set of results could be selected that provided the highest percentage of DNA alignment. Further enhancing the amount of alignment is the fact that this analysis was performed irrespective of the linear order of genes and other genomic features. The non-DNA letters (gap-filling ‘N’s) present in the chimp DNA were also stripped from the query data and excluded from the analyses—reducing the presence of false positives associated with matching ‘N’s.
The definition of DNA similarity for each chromosomal comparison was the amount (percent) of optimally aligned chimp DNA (excluding ‘N’s). This definition was considered to be conservative because it did not include the amount of human DNA absent in chimp nor did it include chimp DNA that was not aligned to the human genome assembly referred to as unanchored contigs.
For the chimp autosomes, the amount of optimally aligned DNA sequence provided similarities between 66% and 76%, depending on the chromosome. In general, the smaller and more gene-dense the chromosomes, the higher the DNA similarity. However, there were several notable exceptions (chimp chromosomes 19 and 21) that not only defied this trend, but proved that not all gene-rich areas of the chimp and human genomes are highly similar.
Summary
Only 69% of the chimpanzee X chromosome was similar to human and only 43% of the Y chromosome. Chimp autosomal similarity to human on average was 70.7% with a range of 66.1% to 77.9%, depending on the chromosome (Table 1 and Fig. 1). Genome-wide, only 70% of the chimpanzee DNA was similar to human under the most optimal sequence-slice conditions.
Chimpanzees and humans share many localized protein-coding regions of high similarity. However, overall there is extreme DNA sequence discontinuity between the two genomes. The current study along with several other recent reports confirm this. This defies standard evolutionary time-scales and dogmatic presuppositions about a common ancestor.
References
Altschul, S. F., W. Gish, W. Miller, E. W. Myers, and D. J. Lipman. 1990. Basic local alignment search tool. Journal of Molecular Biology 215, no. 3:403–410.
Bergman, J. and J. Tomkins. 2012. Is the human genome nearly identical to chimpanzee? A reassessment of the literature. Journal of Creation 26, no. 1:54–60.
Buggs, R. 2008. Chimpanzee? Reformatorisch Dagblad. Retrieved from http://www.refdag.nl/.chimpanzee_1_282611.
Hughes, J. F. et al. 2010. Chimpanzee and human Y chromosomes are remarkably divergent in structure and gene content. Nature 463:536–539.
International Human Genome Sequencing Consortium. 2004. Finishing the euchromatic sequence of the human genome. Nature 431:931–945.
Preuss, T. M. 2012. Human brain evolution: From gene discovery to phenotype discovery. Proceedings of the National Academy of Sciences of the United States of America 109:10709–10716.
Progetto cosmo. 2012. An automatic comparison of the human and chimpanzee genomes. Retrieved from http://progettocosmo.altervista.org/index.php?option=content&task=view&id=130.
The Chimpanzee Sequencing and Analysis Consortium. 2005. Initial sequence of the chimpanzee genome and comparison with the human genome. Nature 437:69–87.
Tomkins, J. 2011a. How Genomes are Sequenced and Why it Matters: Implications for Studies in Comparative Genomics of Humans and Chimpanzees. Answers Research Journal 4:81–88. Retrieved from http://www.answersingenesis.org/articles/arj/v4/n1/implications-for-comparative-genomics.
Tomkins, J. 2011b. Response to Comments on “How Genomes are Sequenced and Why it Matters: Implications for Studies in Comparative Genomics of Humans and Chimpanzees” Answers Research Journal 4:161–162. Retrieved from http://www.answersingenesis.org/articles/arj/v4/n1/response-genomes-chimpanzees-humans.
Tomkins, J. P. 2011c. Genome-Wide DNA Alignment Similarity (Identity) for 40,000 Chimpanzee DNA Sequences Queried against the Human Genome is 86–89%. Answers Research Journal 4:233–241. Retrieved from http://www.answersingenesis.org/articles/arj/v4/n1/blastin.
Tomkins, J. and J. Bergman. 2012. Genomic monkey business—estimates of nearly identical human-chimp DNA similarity re-evaluated using omitted data. Journal of Creation 26, no. 1:94–100.
Warren, R. L. et al. 2006. Physical map assisted whole-genome shotgun assemblies. Genome Research 16, no. 6:768–775.
Watanabe, A. F. et al. 2004. DNA sequence and comparative analysis of chimpanzee chromosome 22. Nature 429, no. 6990:382–388.
