
The views expressed in this paper are those of the writer(s) and are not necessarily those of the ARJ Editor or Answers in Genesis.
Abstract
Seven paired sand samples were collected from beach and nearby dunes along the Oregon and California coastlines. Sand was also sampled from the Nebraska Sandhills and some other inland dune locations for comparison. The samples were examined under the petrographic microscope after cementing the loose sand with epoxy, cutting into thin sections and staining for K-feldspar. Size and roundness statistics were generated for the 14 beach-dune samples and three Nebraska Sandhills samples. The quartz and especially K-feldspar showed statistically significant rounding from the beach to the dune over distances as small as 100 m. When comparing the rounding of quartz and K-feldspar from the coastal dunes and the Nebraska Sandhills, K-feldspar was significantly (p ≤ 0.05) more rounded than quartz in all dune locations except for one of the Nebraska Sandhills sites. It is difficult to understand how K-feldspar sand could survive in a large erg without becoming well-rounded, unless there was a nearby beach or stream acting as the source for the angular sand. A predominance of angular K-feldspar grains in supposed ancient eolian deposits (large fossil ergs), without direct sedimentological evidence of nearby streams or beaches (like the Coconino Sandstone), may be cause to question the eolian origin of such deposits.
Introduction
Quartz and K-feldspar are common minerals in most sedimentary settings, both modern and ancient. The minerals are easily distinguished under the petrographic microscope when the sample has been stained for K-feldspar (leaving quartz white and making K-feldspar yellow). While studying the petrology of some ancient sandstones, we became interested in the rate at which K-feldspar sand grains were rounded in comparison with quartz sand grains in natural settings. In this preliminary study, we collected both beach and nearby dune samples from California and Oregon coastlines so we could make comparisons between the two minerals to see if there was a significant difference in rounding due to eolian transport. It was assumed the dune sand was transported by eolian processes from the nearby beach environment to make the dunes. For comparison we collected and analyzed samples from the unlithified dunes of the Nebraska Sandhills and some other modern inland dunes. Our results have important implications for supposed ancient eolian sand deposits, many of which contain angular K-feldspar sand grains like the Coconino Sandstone (Whitmore et al. 2014) and the Hopeman Sandstone (Maithel, Garner, and Whitmore 2015).
Previous Work
It has been known for some time that eolian saltation/traction processes favor rounding of sand-sized particles over aqueous stream/wave traction and saltation processes (Garzanti et al. 2015; Russell 1939; Twenhofel 1945). This probably occurs due to a number of factors including the mineral species, hardness, cleavage properties, brittleness, and densities of the species involved and the fact that water most likely cushions the grain-to-grain contact more effectively than air when sand grains collide.
Twenhofel (1945) made some observations in the same locations as our study. He determined that the beach sands of the area were quite angular, but also stated the dunes in our study area had about the “same degree of angularity and rounding as the sands of the adjacent beaches.” In addition he stated that “Dune sands on the Oregon and Washington coasts about the mouth of the Columbia River show no rounding whatsoever. These sands were derived from the adjacent beaches and have been transported by winds for only short distances. Other dunes on the Oregon coast as far south as the mouth of Pistol River contain fine grained quartz sands which differ little in degree of roundness from similar sands on the adjacent beaches . . .” (Twenhofel 1945, 68). Twenhofel was only making a general statement about the sand along this coastline and did not provide any analytical data.
Experimental work has produced contrasting results. Thiel (1940) completed some experimental work on the relative resistance to abrasion of various sand-sized minerals in water and Marsland and Woodruff (1937) completed experimental work on the effects of wind transportation on various minerals including quartz and orthoclase (K-feldspar); they found very little change in grain shape over the short duration of their laboratory experiment. Kuenen (1960) experimented with eolian abrasion of quartz, feldspar, and limestone and found that quartz abrades several orders of magnitude faster than limestone and feldspar probably on account of it being more brittle. However, Pye and Tsoar (2009, 72) report the K-feldspar becomes round faster than quartz in eolian settings simply because of its lower hardness, but did not provide experimental or observational references in support of the statement. Garzanti et al. (2012, 2015) found that sand transported by longshore currents along the southwestern African coast remains angular for hundreds of kilometers and becomes rapidly rounded only when it enters the Namib Erg. Anderson, Struble, and Whitmore (2017) studied the effect of water and wind transportation on muscovite and quartz sand in a laboratory experiment and found muscovite disappears quickly under simulated eolian conditions, but not aqueous ones. Some preliminary study on the subject of this paper was completed at Cedarville University as student projects by McKevitt (2012) and by McMaster, Whitmore, and Strom (2010).
Methods
We collected one beach sample and one nearby dune sample from seven locations along the California and Oregon coastline (Fig. 1 and Table 1). All paired samples were collected less than 2 km from each other. Locations were (north to south) Florence, Oregon; Winchester Bay, Oregon; Coos Bay, Oregon; Hunter’s Cove, Oregon; Tolowa Dunes, California; Morro Beach, California; and Pismo Beach, California. The beach samples were collected from the swash zone and the dune samples were collected from the crest or the slip face of various sized coastal dunes. Samples were also collected from the Nebraska Sandhills and some other inland dunes for comparison (Table 1). The loose sand was impregnated with epoxy so a thin section could be cut. The thin sections were stained for K-feldspar and then examined under the petrographic microscope.
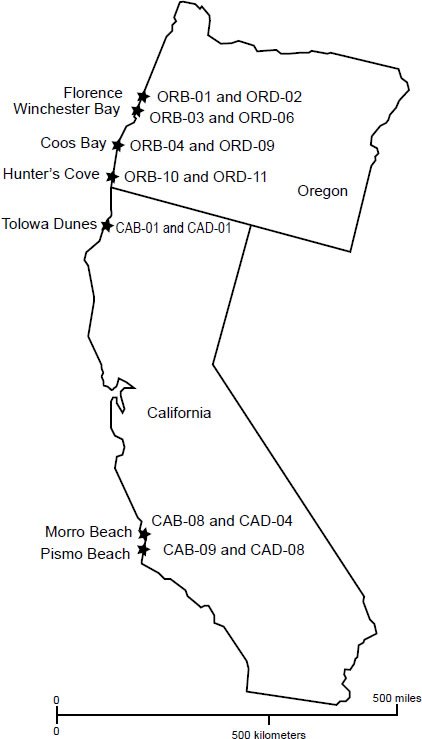
Fig. 1 Locations and sample numbers of beach-dune paired samples that were collected for this study along the west coast of the United States.
|
Location |
Latitude |
Longitude |
Sample # |
Quartz |
K-Feldspar |
|||||
|---|---|---|---|---|---|---|---|---|---|---|
|
Sample Size (Grains) |
Mean Grain Size (um) |
Mean Rounding |
Sample Size (Grains) |
Mean Grain Size (um) |
Mean Rounding |
|||||
|
Beach |
Florence, OR |
44.01417 |
124.13843 |
ORB-01 |
116 |
264 |
2.8 |
108 |
279 |
2.4 |
|
Winchester Bay, OR |
43.63253 |
124.21350 |
ORB-03 |
112 |
311 |
3.1 |
115 |
294 |
3.2 |
|
|
Coos Bay, OR |
43.45408 |
124.27772 |
ORB-04 |
104 |
458 |
2.9 |
107 |
440 |
3.1 |
|
|
Hunter’s Cove, OR |
42.31097 |
124.41601 |
ORB-10 |
105 |
232 |
2.7 |
109 |
257 |
2.9 |
|
|
Tolowa Dunes, CA |
41.86920 |
124.21345 |
CAB-01 |
106 |
521 |
2.9 |
35 |
492 |
3.2 |
|
|
Morro Beach, CA |
35.30452 |
120.87527 |
CAB-08 |
96 |
317 |
3.0 |
104 |
311 |
3.1 |
|
|
Pismo Beach, CA |
35.09538 |
120.63088 |
CAB-09 |
98 |
234 |
2.8 |
107 |
222 |
2.7 |
|
|
Dunes |
Florence, OR |
44.01322 |
124.13627 |
ORD-02 |
114 |
300 |
3.1 |
103 |
293 |
3.7 |
|
Winchester Bay, OR |
43.63000 |
124.20112 |
ORD-06 |
110 |
274 |
3.7 |
112 |
271 |
3.9 |
|
|
Coos Bay, OR |
43.45030 |
124.25292 |
ORD-09 |
110 |
278 |
3.2 |
117 |
274 |
3.7 |
|
|
Hunter’s Cove, OR |
42.31228 |
124.41507 |
ORD-11 |
106 |
210 |
3.0 |
110 |
193 |
3.7 |
|
|
Tolowa Dunes, CA |
41.86890 |
124.21250 |
CAD-01 |
99 |
326 |
2.8 |
103 |
347 |
3.6 |
|
|
Morro Beach, CA |
35.30285 |
120.87498 |
CAD-04 |
108 |
253 |
3.0 |
96 |
267 |
3.5 |
|
|
Pismo Beach, CA |
35.08300 |
120.62180 |
CAD-08 |
113 |
246 |
2.9 |
105 |
241 |
3.1 |
|
|
Nebraska Sandhills |
42.62461 |
100.88469 |
NES-07 |
128 |
191 |
3.9 |
93 |
175 |
4.2 |
|
|
Nebraska Sandhills |
42.61234 |
100.88520 |
NES-14 |
111 |
199 |
4.0 |
103 |
244 |
4.3 |
|
|
Nebraska Sandhills |
42.60067 |
100.91284 |
NES-18 |
90 |
347 |
4.4 |
69 |
354 |
4.7 |
|
|
Kelso Dunes, CA |
34.89875 |
115.70745 |
KD-04B |
- |
- |
- |
- |
- |
- |
|
|
Kelso Dunes, CA |
34.89683 |
115.70647 |
KD-06 |
- |
- |
- |
- |
- |
- |
|
|
Little Sahara D., CA |
39.63617 |
112.39067 |
LSD-07 |
- |
- |
- |
- |
- |
- |
|
|
Bruneau Dunes, ID |
42.89775 |
115.69864 |
BD-02 |
- |
- |
- |
- |
- |
- |
|
|
Salton Sea D., CA |
33.18197 |
115.85250 |
SSD-09 |
- |
- |
- |
- |
- |
- |
|
|
Great Sand D., CO |
37.74395 |
105.52952 |
GD-02 |
- |
- |
- |
- |
- |
- |
|
|
Mesquite Sand D., CA |
36.61273 |
117.11717 |
MSD-01 |
- |
- |
- |
- |
- |
- |
|
|
Glamis Dunes, CA |
32.98252 |
115.13448 |
GLD-02 |
- |
- |
- |
- |
- |
- |
|
In each field of view under the microscope (for those samples for which statistics were calculated), all quartz and all the K-feldspar grains were measured and graded for rounding. Multiple fields of view were observed from each of the 14 slides until approximately 100 grains of each mineral species (or the total number of grains of a particular mineral species if less than 100 existed) had been counted. A Nikon Eclipse petrographic microscope with the Br software was used. This made measuring and scoring the grains for roundness relatively easy. The roundness scale developed by Powers (1953) and modified by Folk (1955) was used. This scale (Fig. 2) identifies six classes of rounding from 0 to 6: 0.5 is very angular, 1.5 is angular, 2.5 is sub-angular, 3.5 is sub-rounded, 4.5 is rounded, and 5.5 is well-rounded. When scoring grains, roundness was estimated to the nearest 0.5. A single microscope operator (JHW) had the rounding scale at hand when scoring and did all the scoring over a two-week period of time so rounding bias could be limited. Rounding and grain size measurements were made from each slide and the results were entered into a spreadsheet (Microsoft Excel) so means, standard deviations and t-tests could be calculated from the data.
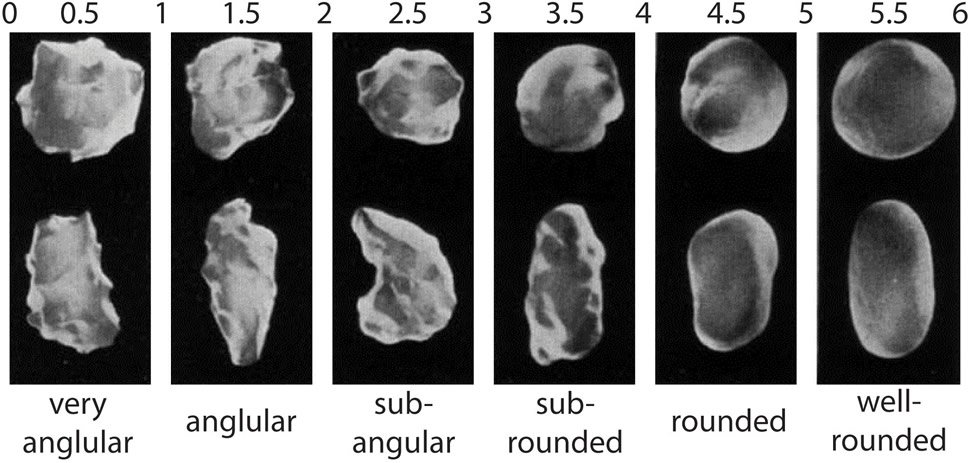
Fig. 2. The Powers (1953) roundness scale modified by Folk (1955).
A mean sand size was calculated for each mineral species from each dune location to ensure that the same-sized grains could be compared for the beach-dune samples. We wanted to compare shapes of the same-sized populations of grains because smaller grain sizes are often more angular (and bigger ones more rounded). Once the mean was found for each dune sample, a population of one standard deviation from each side of that mean was determined. Rounding of the same-sized grains was then compared with the paired beach environment to see how much rounding took place in each of the mineral species studied. For example, if in a dune the mean long axis size of K-feldspar was 250 μm and the standard deviation was 50 μm, the rounding of all the K-feldspar grains on the beach between 200 and 300 μm was used for comparison. It was assumed there was a negligible change in long axis length as the transport occurred.
A similar method of finding the quartz mean and then comparing it to the same-sized K-feldspar grains was used in comparing quartz and K-feldspar rounding in the same dune sample.
Results
In the coastal samples, longer distances of transport (greater than about 125 m) of quartz sand showed a small but significant change in rounding (p ≤ 0.05) from the beach to the dune (Table 2). This was not true over shorter distances where the t-test showed no significant difference in the rounding of quartz between the beach and dune samples. K-feldspar always showed a significant change in rounding even over shorter distances (Table 2). All of the K-feldspar results were significant with p values less than 0.01 except for one case which had a p value of less than 0.05.
|
Location |
Quartz |
K-feldspar |
||||||||||
|---|---|---|---|---|---|---|---|---|---|---|---|---|
|
Beach Rounding |
Transport Distance (m) |
Dune Rounding |
Change in Rounding |
p Value |
Beach Rounding |
Transport Distance (m) |
Dune Rounding |
Change in Rounding |
p Value |
|||
|
Florence, OR |
2.8 |
141 |
3.1 |
+0.3 |
0.007 |
2.4 |
141 |
3.7 |
+1.3 |
0.000 |
||
|
Winchester Bay, OR |
3.1 |
1036 |
3.7 |
+0.6 |
0.000 |
3.2 |
1036 |
3.9 |
+0.7 |
0.000 |
||
|
Coos Bay, OR |
2.9 |
2035 |
3.2 |
+0.3 |
0.002 |
3.1 |
2035 |
3.7 |
+0.6 |
0.000 |
||
|
Hunter’s Cove, OR |
2.7 |
42 |
3.0 |
+0.3 |
0.178 |
2.9 |
42 |
3.7 |
+0.8 |
0.000 |
||
|
Tolowa Dunes, CA |
2.9 |
68 |
2.8 |
-0.1 |
0.518 |
3.2 |
68 |
3.6 |
+0.4 |
0.038 |
||
|
Morro Beach, CA |
3.0 |
115 |
3.0 |
0 |
0.359 |
3.1 |
115 |
3.5 |
+0.4 |
0.001 |
||
|
Pismo Beach, CA |
2.8 |
773 |
2.9 |
+0.1 |
0.033 |
2.7 |
773 |
3.1 |
+0.4 |
0.000 |
||
When comparing the quartz and K-feldspar rounding within the same dune samples, t-tests showed that K-feldspar was significantly more rounded than quartz in all except for one of the Nebraska Sandhills samples (Table 3). Representative thin section images are shown in Figs. 3(a) and 3(b) for the beach-dune pairs, Fig. 4 for the Nebraska Sandhills samples, and Fig. 5 for some other inland dune locations.
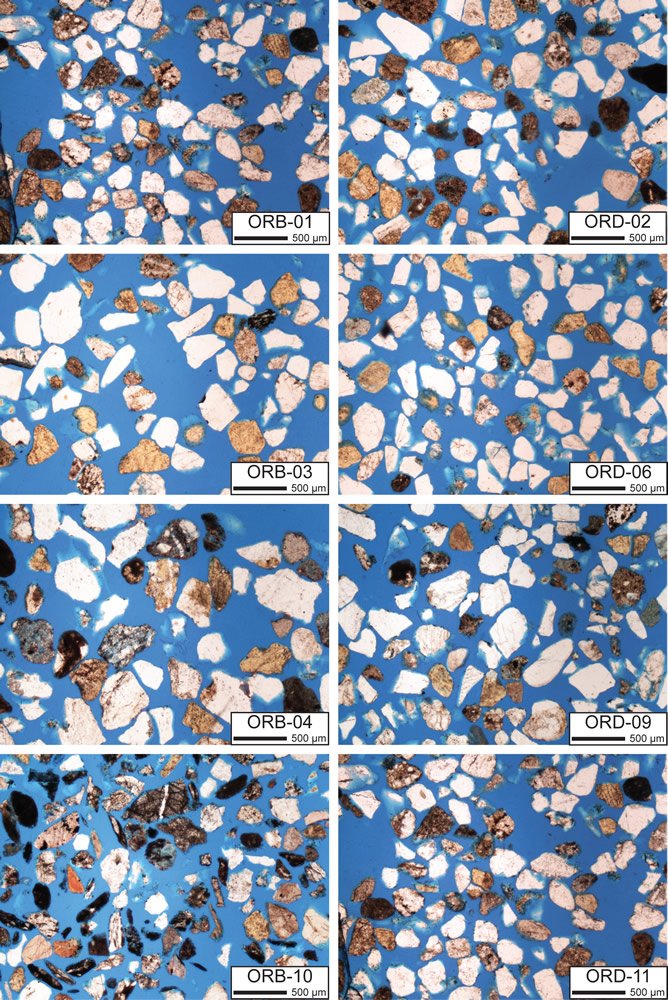
Fig. 3a. Thin sections of beach-dune samples from Oregon. Beach samples are on the left and dune samples are on the right. ORB-01/ORD-02 are a pair from Florence; ORB-03/ORD-06 are a pair from Winchester Bay; ORB-04/ORD-09 are a pair from Coos Bay; and ORB-10/ORD-11 are a pair from Hunter’s Cove. Location coordinates are given in Table 1. Quartz sand is white; K-feldspar sand has been stained yellow.
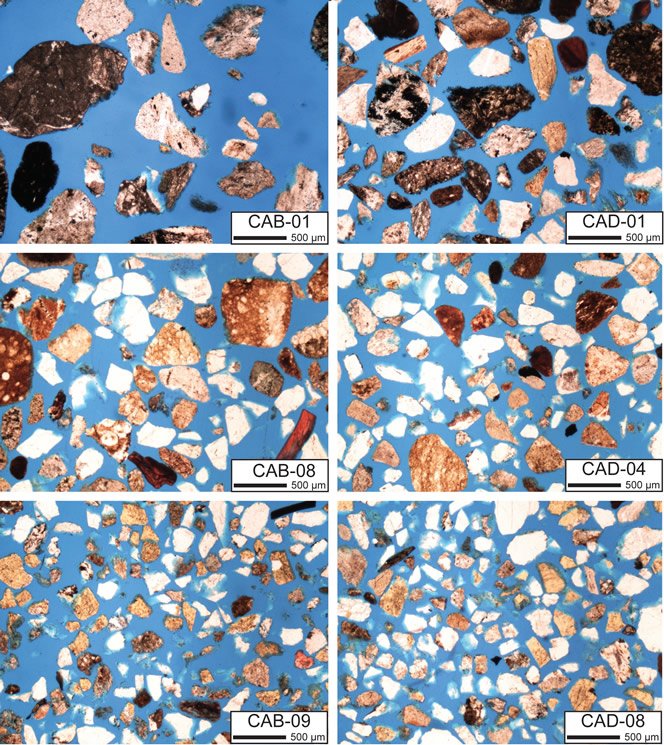
Fig. 3b. Thin sections of beach-dune samples from California. CAB-01/CAD-01 are a pair from Tolowa Dunes; CAB-08/CAD-04 are from Morrow Beach; and CAB-09/CAD-08 are from Pismo Beach.
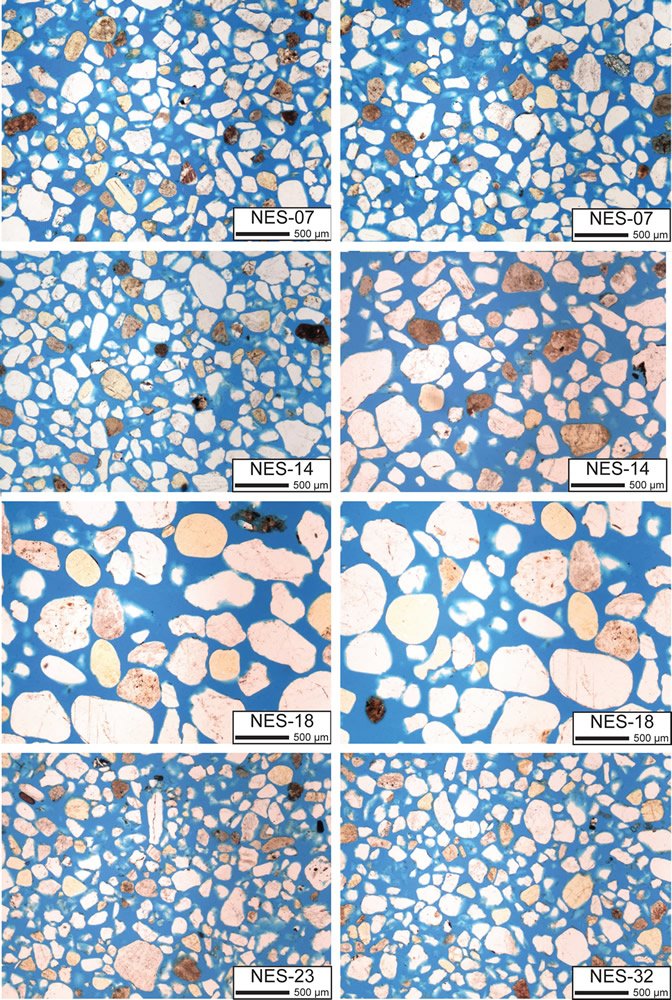
Fig. 4. Thin sections of Nebraska Sandhills dune sand. Location coordinates are given in Table 1. Quartz sand is white; K-feldspar sand has been stained yellow.
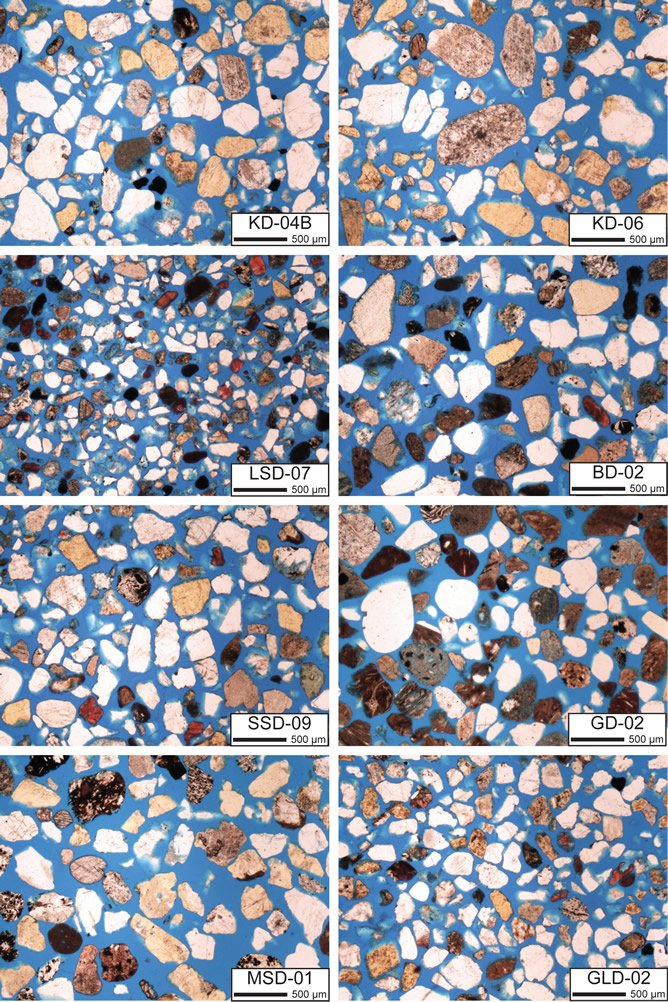
Fig. 5. Various inland dune samples from the western United States. Locations and names can be found in Table 1. Quartz sand is white; K-feldspar sand has been stained yellow.
|
Location |
Sample # |
Quartz |
K-Feldspar |
Difference in Rounding Between Quartz and K-feldspar |
p Value |
|||||||
|---|---|---|---|---|---|---|---|---|---|---|---|---|
|
Sample Size (Grains) |
Mean Grain Size (um) |
Mean Rounding |
Sample Size (Grains) |
Mean Grain Size (um) |
Mean Rounding |
|||||||
|
Florence, OR |
ORD-02 |
114 |
300 |
3.1 |
103 |
293 |
3.7 |
0.6 |
0.000 |
|||
|
Winchester Bay, OR |
ORD-06 |
110 |
274 |
3.7 |
112 |
271 |
3.9 |
0.2 |
0.000 |
|||
|
Coos Bay, OR |
ORD-09 |
110 |
278 |
3.2 |
117 |
274 |
3.7 |
0.5 |
0.000 |
|||
|
Hunter’s Cove, OR |
ORD-11 |
106 |
210 |
3.0 |
110 |
193 |
3.7 |
0.7 |
0.000 |
|||
|
Tolowa Dunes, CA |
CAD-01 |
99 |
326 |
2.8 |
103 |
347 |
3.6 |
0.8 |
0.000 |
|||
|
Morro Beach, CA |
CAD-04 |
108 |
253 |
3.0 |
96 |
267 |
3.5 |
0.5 |
0.000 |
|||
|
Pismo Beach, CA |
CAD-08 |
113 |
246 |
2.9 |
105 |
241 |
3.1 |
0.2 |
0.014 |
|||
|
Nebraska Sandhills |
NES-07 |
128 |
191 |
3.9 |
93 |
175 |
4.2 |
0.3 |
0.084 |
|||
|
Nebraska Sandhills |
NES-14 |
111 |
199 |
4.0 |
103 |
244 |
4.3 |
0.3 |
0.046 |
|||
|
Nebraska Sandhills |
NES-18 |
90 |
347 |
4.4 |
69 |
354 |
4.7 |
0.3 |
0.006 |
|||
Discussion
These results are only a small sample of many more analyses that could have been completed along the Oregon and California coastlines and with inland dunes; we encourage more study. Nonetheless, we think that these results are expected. Garzanti et al. (2012, 2015) found similar results. In hundreds of kilometers of northerly transport of sand by longshore currents off coastal Africa from the Orange River delta to the coast of Namibia, they found sand underwent very little change in mineral composition and rounding. When the sand is picked up by southwesterly winds and carried into the erg it became rapidly rounded (Garzanti et al. 2012, 2015).
Quartz is slightly harder than K-feldspar on Mohs scale of hardness (7 and 6 respectively). Quartz has conchoidal fracture and K-feldspar may come apart easier because of its cleavage. The minerals have about the same density (2.6) making them equally likely to be picked up and transported. In consideration of these properties, it seems reasonable that K-feldspar would be more easily rounded than quartz during eolian transport from the beach to the dune, which our results show. The results of Marsland and Woodruff’s (1937) experiments also suggest that quartz is slightly more resistant to rounding than K-feldspar, although these results seem to somewhat conflict with Kuenen’s (1960) experimental findings.
There have been some studies showing that rounded grains are more easily transported in eolian settings than angular ones (MacCarthy and Huddle 1938) but there are many examples of desert dunes in which the sands are composed of subrounded or subangular sand (see Pye and Tsoar 2009, 83, for a list). Folk (1978) reported that most of the grains of the large longitudinal dunes of the Simpson Desert were angular. There appears to be only limited experimental or observational data to support wind selectively transporting rounded grains over angular ones and there now seems to be general agreement that rounded grains are not transported any better than angular ones (Garzanti et al. 2015, 992). Indeed, our observations of many different dune fields indicate a wide range of grain shapes, roundness, sizes and mineral species (Fig. 5).
When comparing the beach/eolian samples in our study with inland dune samples from the Nebraska Sandhills and other inland locations, most K-feldspar grains are quite rounded compared to the quartz (Figs. 3(a), 3(b), 4, and 5). There are some angular K-feldspar grains in these samples, but these might be easily explained by aqueous transport of the mineral by streams close to where eolian processes were forming sand dunes. Many of our eolian samples were collected in small ergs or close to the edges of larger ergs, so in these samples we often see both angular and rounded K-feldspar grains. Garzanti et al. (2012, 2015) found that angular grains were best explained by transport from a nearby stream or beach, independent of how far the material had been transported by aqueous processes.
When examining angular quartz grains in dune samples, one also needs to keep in mind that smaller grains tend to be more angular than their larger counterparts (Khalaf and Gharib 1985; Kuenen 1960). Quartz grains smaller than 0.05 mm (4.32 ϕ) are not appreciably rounded in eolian settings (Kuenen 1960). Larger grains have more mass and can experience more energetic collisions that cause rounding. This is probably true with other mineral species as well so we might expect smaller K-feldspar grains to be more angular than larger ones. Nevertheless, it is evident that a large number of K-feldspar grains have undergone enough transport in the relatively small ergs we studied to make a large number of them almost perfectly round. It might be expected that K-feldspar sand grains in a very large erg, where all the grains are only delivered over great distances by wind, that nearly all should be rounded, at least down to a minimum size. Almost all sand grains of all mineral species that have undergone significant eolian transport in the Namibian erg are well rounded (Garzanti et al. 2015). In quartz, further size reduction and rounding decreases rapidly as grains become spherical (Kuenen 1960). Perhaps this is also true of K-feldspar. After distant transport in an erg, one might expect that K-feldspar would disappear completely leaving only the harder more resistant minerals like quartz; but Garzanti et al. (2012, 2015) found that even though significant rounding occurs in all mineral species, the only minerals that disappear are the micas. Otherwise, mineral composition remains fairly constant.
Considering our data, well-rounded K-feldspar should be an important criterion for ancient ergs. McKee and Bigarella (1979) have written extensively on such deposits from around the world. However, if a significant number of angular K-feldspar grains would be found in such sandstones, and there is no sedimentary evidence of a stream or beach facies (which could supply angular K-feldspar grains) in the vicinity of such a deposit, then this should be considered significant evidence for the subaqueous origin of the rock. For example, we have found many angular K-feldspar grains in the Coconino Sandstone of Arizona throughout its aerial and vertical extent (Fig. 6) which is considered by many to be a “type” example of an ancient eolian deposit (McKee and Bigarella 1979). Most of the Coconino Sandstone consists of large cross-beds and no reports have been made of fluvial or beach sedimentary sequences in the unit as a whole (Middleton, Elliot, and Morales 2003, 177). However, in places, the Coconino does appear to intertongue with deposits that are clearly marine. Some have reported that deposits on the northern edge of the Coconino (along the Arizona-Utah border) laterally intertongue with the marine Toroweap Formation (Billingsley 2000; Doelling et al. 2010; Sorauf 1962). Blakey and Ranney (2008, 50–51) believe that the upper part of the Coconino in the vicinity of Oak Creek Canyon vertically intertongues with the Toroweap and probably represents coastal dunes. We would expect to find angular K-feldspars in such a setting, but they are also found throughout the Coconino as a whole. This, along with a host of other data (Whitmore et al. 2014; Whitmore, Forsythe, and Garner 2015) causes us to question that the Coconino was a large inland erg that covered nearly all of Arizona and parts of New Mexico (Blakey and Ranney 2008, 50).
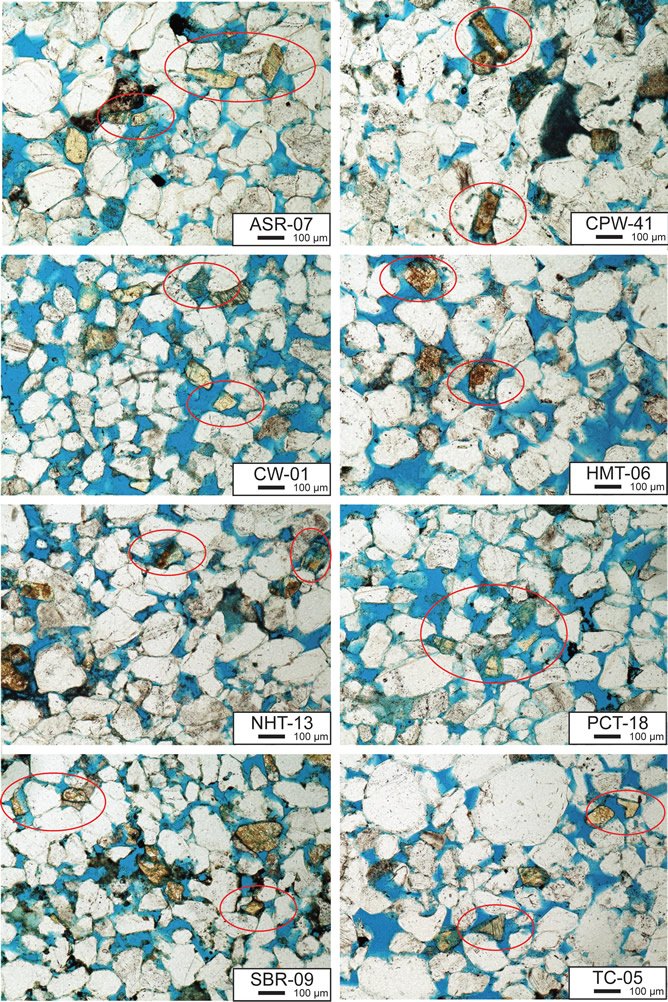
Fig. 6. A variety of widespread Coconino Sandstone samples from northern Arizona. ASR: American Sandstone Ridge near Paulden. CPW: Chino Point West, near Seligman. CW: Cottonwood Wash, near Clay Springs. HMT: Hermit Trail, Grand Canyon. NHT: New Hance Trail, Grand Canyon. PCT: Pine Creek Trail, near Pine. SBR: Sedona Brins Ridge, near Sedona. TC: Trail Canyon, near Whitmore Point. All of these sample have some rounded and angular K-feldspar grains. Some of the more angular grains have ellipses drawn around them.
When examining thin sections of cemented sandstones, one needs to use caution when determining angularity. It is common for quartz and rarer for K-feldspar to display overgrowths as part of the cement that holds the rock together. Overgrowths will give the mineral grain a straight edge and sometimes an angular “corner” where cement has grown around the weathered grain to form a new crystal. Angularity needs to be determined on the shape of the weathered grain which often is easily seen as a “dust rim” around the original grain (Fig. 7).
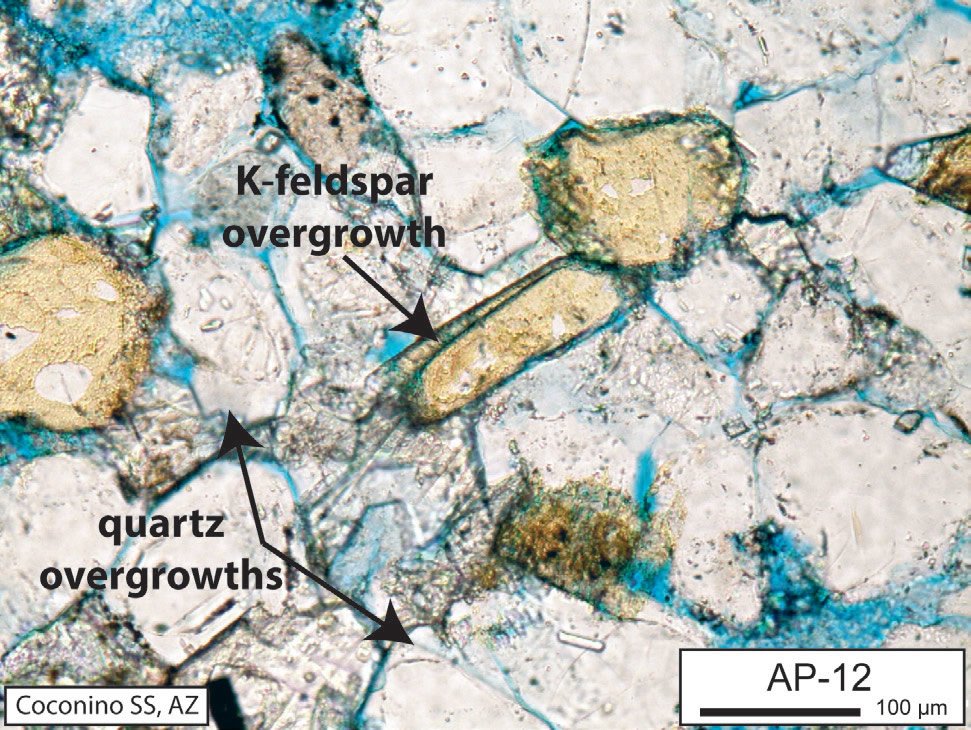
Fig. 7. Both quartz and K-feldspar (more rarely) overgrowths can occur due to a new crystal growing around the edges of a weathered grain. Caution is urged in determining angularity of quartz and K-feldspar in cemented sandstones because sometimes overgrowths can make the grains appear angular when they are not. Overgrowths are separated from the weathered grains by a thin “dust rim” which shows the outline of the original grain.
Conclusion
In this observational study it was found that K-feldspar sand grains showed statistically significant rounding even over distances of just hundreds of meters as they were transported from beach to dune environments along the Oregon and California coastlines. Quartz showed a small amount of change, but change in the K-feldspar was especially evident. It is reasonable to assume that even greater distances of transport and over long periods of time would result in much greater rounding of K-feldspar. Further examination of K-feldspar sand grains from other dune settings showed a mix of angular to very well rounded K-feldspar grains. Angular K-feldspar grains in modern eolian dunes are likely the result of being transported short distances from a nearby stream or beach. This can explain all of the angular K-feldspar in our modern dune samples. We predict that most if not all K-feldspar grains in the centers of extensive ergs will be quite rounded. Indeed, this was found in the study of the Namibian erg by Garzanti et al. (2012, 2015). If significant numbers of angular K-feldspar grains can be found in extensive “blanket” sandstones (term used by Baars 1969) it may be a helpful criterion suggesting a subaqueous origin.
Acknowledgments
Most of the samples used in this work were collected as part of the FAST project during the years of 2008 and 2009 which was partially funded by ICR. Other parts of this project were funded by Calgary Rock and Materials Services Inc. and private sources. Cedarville University provided logistical support. The authors thank the many people who have provided help, support and funding over the years. Thanks also go to Jess Whitmore who helped collect the coastal and inland dune samples and Paul Garner who helped collect the Nebraska Sandhills samples. We appreciate the helpful comments that several reviewers made.
References
Anderson, C. J., A. Struble, and J. H. Whitmore. 2017. “Abrasion Resistance of Muscovite in Aeolian and Subaqueous Transport Experiments.” Aeolian Research 24: 33–37.
Baars, D. L. 1969. “Permian Blanket Sandstones of the Colorado Plateau.” In Geometry of Sandstone Bodies. Edited by J. L. Peterson and J. C. Osmond, 179–207. Tulsa, Oklahoma: American Association of Petroleum Geologists.
Billingsley, G. H. 2000. Geologic Map of the Upper Parashant Canyon and Vicinity, Mohave County, Northwestern Arizona. Map MF-2343 (map and pamphlet). U.S. Department of the Interior, U.S. Geological Survey.
Blakey, R. C., and W. Ranney. 2008. Ancient Landscapes of the Colorado Plateau. Grand Canyon, Arizona: Grand Canyon Association.
Doelling, H. H., R. E. Blackett, A. H. Hamblin, J. D. Powell, and G. L. Pollock. 2010. “Geology of Grand Staircase-Escalante National Monument, Utah.” In Geology of Utah’s Parks and Monuments. 3rd ed. Edited by D. A. Sprinkel, T. C. Chidsey, Jr., and P. B. Anderson, 193–235. Salt Lake City: Utah Geological Association and Bryce Canyon Natural History Association, Utah Geological Association Publication 28.
Folk, R. L. 1955. Student Operator Error in Determination of Roundness, Sphericity, and Grain Size.” Journal of Sedimentary Petrology 25 (4): 297–301.
Folk, R. L. 1978. “Angularity and Silica Coatings of Simpson Desert Sand Grains, Northern Territory, Australia.” Journal of Sedimentary Petrology 48 (2): 611–624.
Garzanti, E., S. Andò, G. Vezzoli, M. Lustrino, M. Boni, and P. Vermeesch. 2012. “Petrology of the Namib Sand Sea: Long-Distance Transport and Compositional Variability in the Wind-Displaced Orange Delta.” Earth-Science Reviews 112 (3–4): 173–189.
Garzanti, E., A. Resentini, S. Andò, G. Vezzoli, A. Pereira, and P. Vermeesch. 2015. “Physical Controls on Sand Composition and Relative Durability of Detrital Minerals During Ultra-Long Distance Littoral and Aeolian Transport (Namibia and Southern Angola).” Sedimentology 62 (4): 971–996.
Khalaf, F. I., and I. M. Gharib. 1985. “Roundness Parameters of Quartz Grains of Recent Aeolian Sand Deposits in Kuwait.” Sedimentary Geology 45 (1–2): 147–158.
Kuenen, P. H. 1960. “Experimental Abrasion 4: Eolian Action.” The Journal of Geology 68 (4): 427–449.
MacCarthy, G. R., and J. W. Huddle. 1938. “Shape-Sorting of Sand Grains by Wind Action.” American Journal of Science (5th series), 35 (205): 64–73.
Maithel, S. A., P. A. Garner, and J. H. Whitmore. 2015. “Preliminary Assessment of the Petrology of the Hopeman Sandstone (Permo-Triassic), Moray Firth Basin, Scotland.” Scottish Journal of Geology 51 (2): 177–184.
Marsland, P. S., and J. G. Woodruff. 1937. “A Study of the Effects of Wind Transportation on Grains of Several Minerals.” Journal of Sedimentary Petrology 7 (1): 18–30.
McKee, E. D., and J. J. Bigarella. 1979. “Ancient Sandstones Considered to be Eolian.” In A Study of Global Sand Seas. Edited by E. D. McKee, 187–238. United States Geological Survey Professional Paper 1052.
McKevitt, D. 2012. “Analysis of California Coastal Dune and Beach Samples.” Unpublished poster for an independent study project at Cedarville University.
McMaster, K., J. H. Whitmore, and R. Strom. 2010. “A Comparison of Beach and Dune Sands Along the Southern Oregon Coast, USA.” Geological Society of America Abstracts with Programs 42 (5): 311.
Middleton, L. T., D. K. Elliot, and M. Morales. 2003. “Coconino Sandstone.” In Grand Canyon Geology. 2nd ed. Edited by S. S. Beus and M. Morales, 163–179. New York, New York: Oxford University Press.
Powers, M. C. 1953. “A New Roundness Scale for Sedimentary Particles.” Journal of Sedimentary Petrology 23 (2): 117–119.
Pye, K., and H. Tsoar. 2009. Aeolian Sand and Sand Dunes. Berlin, Germany: Springer-Verlag.
Russell, R. D. 1939. “Effects of Transportation on Sedimentary Particles.” In Recent Marine Sediments. Edited by P. D. Trask, 32–47. Tulsa, Oklahoma: AAPG.
Sorauf, J. E. 1962. Structural Geology and Stratigraphy of the Whitmore Area, Mohave County, Arizona. Ph.D. diss., University of Kansas.
Thiel, G. A. 1940. “The Relative Resistance to Abrasion of Mineral Grains of Sand Size.” Journal of Sedimentary Petrology 10 (3): 103–124.
Twenhofel, W. H. 1945. “The Rounding of Sand Grains.” Journal of Sedimentary Petrology 15 (2): 59–71.
Whitmore, J. H., G. Forsythe, and P. A. Garner. 2015. “Intraformational Parabolic Recumbent Folds in the Coconino Sandstone (Permian) and Two Other Formations in Sedona, Arizona (USA).” Answers Research Journal 8: 21–40, https://answersingenesis.org/geology/rock-layers/intraformational-parabolic-recumbent-folds/.
Whitmore, J. H., R. Strom, S. Cheung, and P. A. Garner. 2014. “The Petrology of the Coconino Sandstone (Permian), Arizona, USA.” Answers Research Journal 7: 499–532, https://answersingenesis.org/geology/rock-layers/petrology-of-the-coconino-sandstone/.


