
The views expressed in this paper are those of the writer(s) and are not necessarily those of the ARJ Editor or Answers in Genesis.
Abstract
Scholars routinely look with suspicion on the dates and ages given in the early chapters of Genesis. Several passages are confusing, multiple textual traditions have been preserved with differing numbers, and historians have had difficulty in reconciling the biblical numbers with the histories of other nations. The numbers given in the various texts of the Scriptures will be taken at face value. Others can worry about the validity of the numbers. The goal is to show that the lifespans of Old Testament people born after the Flood reveal a numerical pattern known as an exponential decay curve. Thus, the purpose of this paper is to derive a mathematical equation that predicts, with reasonable accuracy, the lifespan of people born after the Flood, given the number of years that they were born after the Flood. This is true for all of the texts examined. It will further be shown that only the Masoretic text predicts that the human lifespan will level off to approximately 70 to 75 years.
Introduction
An equation of the form y = AeBx is called an exponential growth or exponential decay curve, depending on whether B is positive or negative. This is crucial to the understanding of this paper, so a few words need to be spent for the benefit of those who are not mathematicians.
Suppose a certain town has 1000 people and is growing at 10% a year. In a year it will have 1000 plus 10% of 1000, which is 100, residents and 1000 + 100 = 1100. For the second year it will have 1100 plus 10% of 1100, which is 110, residents and 1100 + 110 = 1210. Notice that it added more people the second year than the first. This is exponential growth. Now suppose the town of 1000 people is losing 10% a year. Then after a year it will have 1000−100 = 900 residents. After two years it will have 900−90 = 810 residents. This is exponential decay.
Most people are familiar with the mathematical number π which is approximately 3.14. Another very famous number, but only with those who study mathematics, is e which is approximately 2.718. Now consider the town of 1000 with a growth rate of 10% per year. The equation y = 1000e0.10x, with x being the number of years and y being the number of residents, models this growth. Thus, in two years (x = 2) one would have y = 1000e0.20 = 1221.40 residents (using a calculator). This disagrees with the 1210 found above. Why? Suppose that the calculations are done monthly. Dividing the 10% yearly growth between the 12 months, each month the town would grow 10%. Now, thanks to the power of compounding, the town will have approximately 1220.39 residents after the two years. If it is compounded daily for two years, there will be 1221.37 residents. If we compound every second for two years, it will have 1221.40 residents, in agreement with the equation. The equation, y = AeBx, assumes that the growth is continuous (compounded over very short time intervals). One realizes that for the town it is not the case that there were 1000 residents for 364 days and suddenly 100 more moved in on the 365th day. Rather, it is better to say that growth is being added daily, or continuously.
As the lifespans of people born after the Flood are generally decreasing, one expects an exponential decay curve—like the town that is losing 10% a year (y = 1000e-0.10x), but here the lifespan is getting smaller, not the population. Exponential decay curves (y = AeBx) will have a negative B value. (Exponential growth curves have a positive B value.) This pattern to the biblical texts has been noticed by others, for example Strickling in 1973 and Dillow in 1981 have observed this pattern.
However, there is a problem with using this equation to predict human lifespans; namely, as time goes by the predicted lifespan will get closer and closer to zero. This is a serious shortcoming! (Consider the town that was losing 10% a year. How many residents will there be in 100 years?) It was apparent from the start that one needed an equation of the form y = AeBx + C, with B less than zero. In this equation x represents the number of years a person was born after the Flood, and y is their predicted lifespan. A, B, and C are constants, unknown at present. Now, as time passes, AeBx will approach zero and thus AeBx + C will approach C. This means that the equation predicts that the human lifespan will level off to the value of C. The only problem with the equation y = AeBx + C is that the mathematics are complicated. The goal will be to find the very best values of the constants A, B, and C for any set of data. The question then arises as to what is meant by “the very best values of A, B, and C.” Suppose Isaac was born 452 years after the Flood and lived 180 years. Now for any values of A, B, and C one can let x = 452 and find the predicted lifespan, y (using the equation). Ideally the equation would predict 180 years, but no values of A, B, and C will give perfect results for all individuals. However, one could calculate the difference between the predicted age (y) and the actual age (180 for Isaac). Now this difference could be calculated for all the people and one could add up all these differences (the sum of all the errors). The best value for A, B, and C would be those values that make the smallest total error. However, there is still a problem as one error (predicted age minus actual age) might be 10 years and another might be −10 years, then adding 10 + (−10) = 0 one has a perfect fit—but not really, for both are off by 10 years. Mathematicians get around this by the method of least squares where one finds the values of A, B, and C that will yield the smallest total of the squares of the errors, here 102 + (−10)2 = 100 + 100 = 200. Notice that squaring the errors makes them all positive. Finding A, B, and C to make this sum as small as possible involves material usually covered in Calculus III. The derivation will be covered in this paper, but can be skipped without any loss of insight. One then realizes that it is possible to find the very best values of A, B, and C to make the sum of the squares of all the errors as small as possible, with trust in the mathematician.
The Advanced Math
Least squares curve fitting will be used to find the best values of A, B, and C. Data will be stored in the form (xi, yi), where xi represents the number of years the person was born after the Flood, and yi represents the life span of the person. Thus, the first person, Arphaxad is (2438); he was born two years after the Flood and lived 438 years. (Using whatever starting point for the Flood that the Scripture is referring to.) One wants to choose the values of A, B, and C in such a way that they minimize S in the equation:
Note that AeBxi + C−yi is predicted age minus actual age, thus the error. Σ is the math symbol for summing the errors, n is the number of people. Also, the errors are squared so that positive errors and negative errors don’t cancel each other out. The goal is to minimize this sum of errors, S.
This is a standard calculus problem and leads to the equations:
and
The first, and most difficult, equation is solved for B using the bisection method. Then, knowing B, the other equations yield A and C directly. (All calculations were done by computer, of course. Indeed, this probably would have been impossible to solve before the computer era.)
Now the question becomes, “How good is the fit?” Statisticians have created a method of evaluating the exactness of the fit, called the correlation coefficient. Let
where yave is the average of the y values.
Then define
where S was defined previously. A perfect fit will have S = 0, and hence cc = 1. Thus, we desire cc to be close to 1.
Data from the Masoretic Text
The following numbers are generally easy to derive from the Masoretic text. All years are from the Flood. The Flood is considered to be year 0 for the purpose of this paper. Thus, Terah was born 222 years after the Flood, died 427 years after the Flood, and died at the age of 205 (Table 1).
| Name | Born | Died | Lifespan |
|---|---|---|---|
| Arpachshad | 2 (Gen. 11:10) | 440 (Gen. 11:13) | 438 |
| Shelah | 37 (Gen. 11:12) | 470 (Gen. 11:15) | 433 |
| Eber | 67 (Gen. 11:14) | 531 (Gen. 11:17) | 464 |
| Peleg | 101 (Gen. 11:16) | 340 (Gen. 11:19) | 239 |
| Reu | 131 (Gen. 11:18) | 370 (Gen. 11:21) | 239 |
| Serug | 163 (Gen. 11:20) | 393 (Gen. 11:23) | 230 |
| Nahor | 193 (Gen. 11:22) | 341 (Gen. 11:25) | 148 |
| Terah | 222 (Gen. 11:24) | 427 (Gen. 11:32) | 205 |
Obviously, numbers were rounded to the nearest year, so some cumulative error is to be expected. The New Testament adds some confusion at two points; namely when was Abraham born and when did the 430 years in Egypt begin? The period of the kings is also confusing because of overlapping reigns, but fortunately these are fairly well established. In the Appendix of Scholarly Sources, a table of reasoned dates is given, from which one can see that the differences will have minimal effects on this paper.
Genesis 11:26 will be used to establish the year of the birth of Abraham (Table 2). A different date can be established using Acts 7:2–4 together with Genesis 12:4. Stephen states that Abraham left Haran after his father died (Acts 7:4) and that Abraham was 75 years old when he left Haran (Gen. 12:4). Thus, Abraham left Haran in 427 (or later) and was born in 427 − 75 = 352. This makes Terah 352 − 222 = 130 years old when he became the father of Abraham, which detracts from the amazement of Abraham having Isaac at age 100, although we don’t know the age of Terah’s wife. This variation will be examined later. (Perhaps this could be reconciled by assuming that Terah had three children, the first born when he was 70, and Abraham was born later, in agreement with Stephen.)
| Name | Born | Died | Lifespan |
|---|---|---|---|
| Abraham | 292 (Gen. 11:26) | 467 (Gen. 25:7) | 175 |
| Sarah | 302 (Gen. 17:17) | 429 (Gen. 23:1) | 127 |
| Ishmael | 378 (Gen. 16:16) | 515 (Gen. 25:17) | 137 |
| Isaac | 392 (Gen. 21:5) | 572 (Gen. 35:28) | 180 |
| Jacob | 452 (Gen. 25:26) | 599 (Gen. 47:28) | 147 |
Jacob entered Egypt in 582 (Gen. 47:28). Joseph was 30 when he stood before Pharaoh (Gen. 41:46). In the second year of the famine (after seven good years), Jacob came to Egypt (Gen. 45:6). Therefore, Joseph was about 30 + 7 + 2 = 39 when he sent for his father. Thus, Joseph was born around 582 – 39 = 543 (Table 3).
| Name | Born | Died | Lifespan |
|---|---|---|---|
| Joseph | 543 (above) | 653 (Gen. 50:22) | 110 |
Exodus 12:40–41 states that the sons of Israel (Jacob) lived in Egypt 430 years. Thus, the Exodus from Egypt took place in 582 + 430 = 1012. However, Paul, in Galatians 3:17, adds some significant confusion to this number. Paul says that the 430 years was from the promise to Abraham until the giving of the law. (Perhaps Paul is referring to God’s repetition of the promise to Israel in Genesis 46:2–4?) If one takes Genesis 17 as the giving of the promise, when Abraham was 99, then this is the year 391. Thus, the law came in 391 + 430 = 821. This sets the Exodus at about 821. The following uses 1012 as the date of the Exodus, the variation will be examined later.
Exodus 7:7 gives Moses’ and Aaron’s age when they spoke to Pharaoh. Using this as a good approximation of the Exodus, dated at 1012, one concludes (Table 4).
| Name | Born | Died | Lifespan |
|---|---|---|---|
| Aaron | 929 (Ex. 7:7) | 1052 (Num. 33:39) | 123 |
| Moses | 932 (Ex. 7:7) | 1052 (Deut. 34:7) | 120 |
Assuming Joshua’s commission as a spy was shortly after the Exodus we have: (see Table 5)
| Name | Born | Died | Lifespan |
|---|---|---|---|
| Joshua | 972 (Joshua 14:7) | 1082 (Joshua 24:29) | 110 |
1 Kings 6:1 states that it was 480 years from the Exodus until the beginning of the work on the temple. This yields the year 1012 + 480 = 1492. But 1 Kings 6:1 also says that this was the fourth year of Solomon’s reign, so Solomon began to reign in 1488. Taking this to be the year David died one has: (see Table 6)
| Name | Born | Died | Lifespan |
|---|---|---|---|
| David | 1418 (2 Sam. 5:4) | 1488 (above) | 70 |
Due to overlapping reigns, the dating of the kings from the Bible is difficult. However, they are fairly well established. In a chronology table the New American Standard Master Study Bible (1981) lists the number of years a king reigned and what year they began to reign. For comparison, an appendix comparing the reasoned year of death of the kings of known lifespan has been added. One can see that Archer (1979), Kaiser (1998), Merrill (2008), Steinmann (2011), and Thiele (1965) vary slightly, but not enough to make significant changes to the outcome of this paper. For many, but not all, of the kings of Judah the Bible gives their lifespan. Interestingly, the lifespan is never given for a king of Israel in the divided kingdom. According to the New American Standard Bible, Solomon began to reign in 971 BC, which corresponds to 1488 years after the Flood (Thus allowing the translation of other BC numbers to years after the Flood). As lifespans are being examined, any king that was killed was eliminated from the study—acknowledging that for most the cause of death simply isn’t stated. Thus using the New American Standard Bible to establish the year of death, and the Masoretic text to establish the year of birth one establishes (see Table 7).
| Name | Born | Died | Lifespan |
|---|---|---|---|
| Rehoboam | 1487 (1 Kings 14:21) | 1545 | 58 |
| Jehoshaphat | 1552 (1 Kings 22:42) | 1612 | 60 |
| Joram | 1573 (2 Kings 8:17) | 1613 | 40 |
| Uzziah | 1675 (2 Kings 15:2) | 1743 | 68 |
| Jotham | 1684 (2 Kings 15:33) | 1725 | 41 |
| Ahaz | 1704 (2 Kings 16:2) | 1740 | 36 |
| Hezekiah | 1705 (2 Kings 18:2) | 1759 | 54 |
| Manasseh | 1760 (2 Kings 21:1) | 1827 | 67 |
Summary of Findings
As demonstrated above, there were two points where some confusion arose in the Masoretic text. The details (above) only give one version, but the others can be expounded similarly. This creates the following four possibilities:
-
Abraham’s birth
- Using Genesis 11:26 one dates Abraham’s birth at 292 years after the Flood.
- Using Acts 7:2–4 and Genesis 12:4 one dates his birth at 352 years after the Flood.
-
Dating the Exodus
- Exodus 12:40–41 states that the sons of Israel lived in Egypt for 430 years.
- Paul says in Galatians 3:17 that the 430 years was from the promise to Abraham until the giving of the law.
This gives us four possible variations on the numbers. Again, x is the number of years that the person was born after the Flood and y is the person’s predicted lifespan. For the correlation coefficient (cc), 1 is perfect. Therefore, using the possibilities listed above and in Table 8 one has.
| 1. | Using 1a and 2a: | y = 398.9729e−0.00527141x + 73.2280, cc = 0.9444 |
| 2. | Using 1a and 2b: | y = 397.8322e−0.00506664x + 70.4089, cc = 0.9461 |
| 3. | Using 1b and 2a: | y = 388.2459e−0.00495112x + 75.5548, cc = 0.9395 |
| 4. | Using 1b and 2b: | y = 386.6480e−0.00473604x + 72.7802, cc = 0.9409 |
For the record, Bishop Ussher, whose numbers are closest to Version Four, yields:
y = 386.6835e−0.00462214x + 70.6508, cc = 0.9425
Note that there is some variation in all the numbers; this is to be expected as changes were made to the data. Still, the numbers are close. One observes that in all five cases the correlation coefficient is close to 0.94, a very good fit. Indeed, they are so close that it is impossible to argue that one is truly better than another. Also, the lifespan will level off towards the final number in each equation (73.2280, 70.4089, 75.5548, 72.7802, and 70.6508). Thus, the life span should level off somewhere between 70 and 76, a reasonable number. This is consistent with Psalm 90:9–10, “For all our days have declined in Thy fury; We have finished our years like a sigh. As for the days of our life, they contain seventy years, Or if due to strength, eighty years . . . .”
Using Version 1 (Abraham born in 292, Exodus in 1012), the people who outlived their predicted lifespan by at least 10% were Eber, Abraham, Isaac, Jacob, Joseph, Aaron, Moses, and Joshua. The people who died at least 10% before their predicted lifespans were Peleg, Reu, Nahor, Sarah, Rehoboam, Jehoshaphat, Jehoram, Azariah, Ahaz, and Hezekiah. Obviously the patriarchs did very well! Relatively, the kings (even three good kings) did poorly. A great deal of the error between the predicted lifespans and the actual lifespans seems to be related to God blessing the patriarchs and being unhappy with His people during the period of the kings.
The Septuagint (Brenton 1851) only covers the Old Testament, and Stephen’s comment in the New Testament was not considered. The same verses can be used to establish data as for the Masoretic text. However, Terah’s lifespan is not given, only that he lived 205 years in Haran. Exodus 12:40–41 states that the 430 years covers both Canaan and Egypt, agreeing with Paul. There are two versions of the Septuagint, with differing numbers, thus:
Vaticanus: y = 616.1522e−0.00074379x − 66.5446, cc = 0.9842
Alexandrinus: y = 627.0388e−0.00091571x − 39.8892, cc = 0.9756
These are incredibly good fits. However, they predict that the human life span will become negative, namely −66.5 or −39.9 years. This is a problem! Using Vaticanus, for example, the equation predicts that 2992 years after the Flood the average human life span will be zero.
The Israelite Samaritan Pentateuch (Tsedaka 2013), of course, only covers the first five books of the Old Testament. The Samaritan Pentateuch has Terah living to age 145, which means that Abraham left Haran the year Terah died. This is the only text covered that agrees with Stephen in Acts 7. Does this say anything about Stephen’s source, or the original text? The Samaritan Pentateuch agrees with the Septuagint and with Paul that the 430 years covers the time in Canaan and Egypt. Here, only people from Arpachshad to Moses are covered, Joshua and the kings must be omitted for this study. Thus:
Samaritan Pentateuch:
y = 422.0756e−0.00149422x + 54.8058, cc = 0.9613
This, too, is a very good fit. It predicts the human lifespan will level off to 54.8058. This is not unreasonable, modern medicine is extending life.
For comparison, using Version One of the Hebrew Pentateuch only, with Abraham born in 292 and the Exodus in 1012:
y = 374.4562e−0.00742649x + 118.5363, cc = 0.9325
It is curious that it levels off to 118.5363 years, far from our usual 70–76. This is consistent with Genesis 6:3, “Then the Lord said, ‘My Spirit shall not strive with man forever, because he also is flesh; nevertheless his days shall be one hundred and twenty years.’”
Also, using the Septuagint (Vaticanus) with the Pentateuch only
y = 1174.7635e−0.00029138x − 643.3137, cc = 0.9787
This is interesting as the numbers changed quite a bit from the full version. Once again the equation predicts that the human lifespan will become negative, approaching −643 years. Obviously this is not possible.
Conclusion
From the correlation coefficients one can say with confidence that the human lifespans of those born after the Flood follow an exponential decay curve of the form y = AeBx + C, and this is true for every text examined. The Masoretic text, in all its possible readings, is consistent with Psalm 90:10. Interestingly, the two versions of the Septuagint have higher correlation coefficients than the Masoretic text, but both predict that the human lifespan will eventually drop below zero. This is not possible, but one could argue that it is not feasible to extrapolate too far outside of the given data set. The Samaritan Pentateuch does rather well on correlation coefficient and on predicted lifespan.
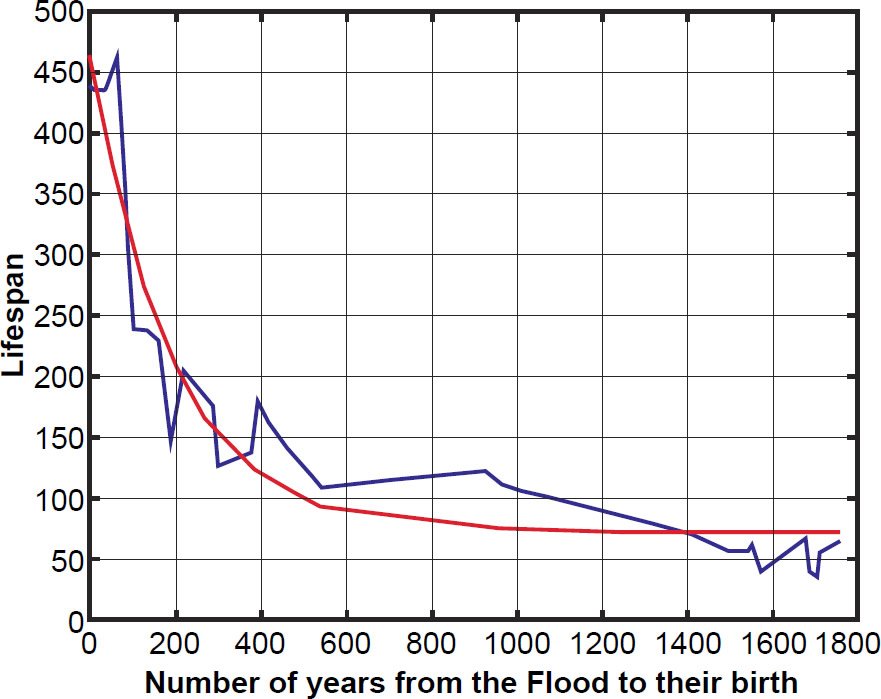
Fig. 1. Lifespans of people born after the Flood.
That the various sets of numbers follow equations that would have been unknown to the authors of the texts seems to supply some credence to the general flow of the numbers given, despite the fact that different texts have different numbers.
The graph in Fig. 1 represents Version One from the Masoretic text (Abraham born in 292, Exodus in 1012). All the other versions and texts have graphs that are nearly identical to this one. The smooth curve is the predicted lifespans; the erratic curve connects the actual lifespans of the known individuals.
Summary of the Data for Version One of the Masoretic Text
Some texts did considerably better than Version One. This version predicted that the human lifespans would approach 73.2280. Note that, rounded to the nearest year, the human lifespan had leveled off to 73 years by David’s day (Table 9).
| Name | Years Born After the Flood | Actual Lifespan | Predicted Lifespan |
|---|---|---|---|
| (rounded to the nearest year) | |||
| Arphaxad | 2 | 438 | 468 |
| Salah | 37 | 433 | 402 |
| Eber | 67 | 464 | 353 |
| Peleg | 101 | 239 | 307 |
| Reu | 131 | 239 | 273 |
| Serug | 163 | 230 | 242 |
| Nahor | 193 | 148 | 217 |
| Terah | 222 | 205 | 197 |
| Abraham | 292 | 175 | 159 |
| Sarah | 302 | 127 | 154 |
| Ishmael | 378 | 137 | 128 |
| Isaac | 392 | 180 | 124 |
| Jacob | 452 | 147 | 110 |
| Joseph | 543 | 110 | 96 |
| Aaron | 929 | 123 | 76 |
| Moses | 932 | 120 | 76 |
| Joshua | 972 | 110 | 76 |
| David | 1418 | 70 | 73 |
| Rehoboam | 1487 | 58 | 73 |
| Jehoshaphat | 1552 | 60 | 73 |
| Jehoram | 1573 | 40 | 73 |
| Azariah | 1675 | 68 | 73 |
| Jotham | 1684 | 41 | 73 |
| Ahaz | 1704 | 36 | 73 |
| Hezekiah | 1705 | 54 | 73 |
| Manasseh | 1760 | 67 | 73 |
Acknowledgments
This study began as a paper presented at the Evangelical Theological Society in 2000 by a mathematician (Holladay) and a theologian (Dr. Jonathan Watt). Without Dr. Watts zeal this paper would never have risen above a bit of mathematical curiosity.
References
Archer, G.L. Jr. 1979. “The Chronology of the Old Testament.” In The Expositor’s Bible Commentary. Vol.1. Edited by F.E. Gæbelein. Grand Rapids, Michigan: Zondervan.
Brenton, L.C.L. 1851. The Septuagint with Apocrypha: Greek and English. Grand Rapids, Michigan: Zondervan.
Dillow, J.C. 1981. The Waters Above: Earth’s Pre-Flood Vapor Canopy. Chicago, Illinois: Moody Press.
Holman Bible Publishers. eds. 1981. Master Study Bible New American Standard. Nashville, Tennessee: Holman Bible Publishers.
Kaiser, W.C. 1998. A History of Israel: From the Bronze Age Through The Jewish Wars. Nashville, Tennessee: Broadman and Holman.
Merrill, E.H. 2008. Kingdom of Priests: A History of the Old Testament Israel. Grand Rapids, Michigan: Baker Academic.
Steinmann, A.E. 2011. From Abraham to Paul: A Biblical Chronology. St. Louis, Missouri: Concordia Publishing House.
Strickling, J.E. 1973. “A Quantitative Analysis of the Life Spans of the Genesis Patriarchs.” Creation Research Society Quarterly 10 (3): 149–154.
Thiele, E.R. 1965. The Mysterious Numbers of the Hebrew Kings. Grand Rapids, Michigan: Eerdmans.
Tsedaka, B. 2013. The Israelite Samaritan Version of the Torah: First English Translation Compared with the Masoretic Version. Grand Rapids, Michigan: Eerdmans.
Ussher, J. 1869. “Chronological Table.” In An Illustrated History of The Holy Bible. Edited by J. Kitto. Norwich, Connecticut: Henry Bill.
Appendix of Scholarly Sources
| Year of Death | |||||
|---|---|---|---|---|---|
| NASB | EBC | MKH | KP | HI | |
| David | 970 | 970 | 971 | 971 | 971 |
| Rehoboam | 913 | 913 | 913 | 913 | 913 |
| Jehoshaphat | 847 | 848 | 848 | 848 | 848 |
| Joram | 846 | 841 | 841 | 841 | 841 |
| Uzziah | 716 | 739 | 740/39 | 740 | 740 |
| Jotham | 734 | 736 | 732 | 731 | 731 |
| Ahaz | 719 | 725 | 716/15 | 715 | 715 |
| Hezekiah | 700 | 697 | 687/86 | 686 | 686 |
| Manasseh | 632 | 642 | 643/42 | 642 | 642 |


