The views expressed in this paper are those of the writer(s) and are not necessarily those of the ARJ Editor or Answers in Genesis.
Abstract
Genomic data is proving to be a valuable addition to the science of baraminology in its task of classifying organisms according to their originally created kinds. Here, order Galliformes is characterized as belonging to two putative holobramins based on a statistical clustering of mitochondrial genome sequences and nuclear genome k-mer signatures. These two holobaramins are the Megapodiidae and the remaining four galliform families (Phasianidae, Numididae, Cracidae, and Odontophoridae). This study affirms the results of a previous study of Galliformes using morphological and hybridization data. The conclusions remain tenuous due to probable genetic changes in the original created kinds brought about by the population bottleneck of the Flood, genetic drift, and other natural processes to which all living things are subject. Also, a dearth of genomic data contributes to the difficulty of discerning the Galliformes baraminology. Yet our Lord is glorified as we study and marvel at the beautiful birds he has created.
Keywords: Baraminology, Galliformes, landfowl, molecular, mitochondria, genome, hybridization
Introduction
The astonishing creative genius and power of God are displayed by the wonderful creatures he has made, especially the birds. These winged beings, with their resplendent feathers and gracile wings, call to mind the Seraphim of Isaiah chapter six, who continually give glory to the Lord of Hosts. An order of birds that have been a particular blessing to humanity as a source of nourishment is the avian order Galliformes. Recently, in a landmark study, Brophy and Mullis (2021) defined two holobaramins from the five families of the order Galliformes based on hybridization data informed by morphological baraminology. In the present study an analysis of genomic data will be presented to further our understanding of the order Galliformes. This analysis lends support to the conclusions of Brophy and Mullis (2021) that the galliform birds consist of two holobaramins. Before presenting this analysis, a few definitions are in order.
The term “baramin” comes from combining the Hebrew words bara meaning “created” and min meaning “kind” (Strong 2010). A baramin consists of organisms that are assumed to reproduce according to their kind (Genesis 1:11–12, 21) (Lightner, Hennigan, and Purdom 2014). The original created kinds were not the result of reproduction but were directly created. The term “archaebaramin” is used to define the original baramin created directly by God during Creation Week (Wise 1990).
As the created kinds from the archaebaramins of Genesis 1 diversified, various traits appeared due to genetic variation that God had programmed into their original genomes. This variation was enhanced due to adaptation, genetic drift, and other natural processes, to the point that some varieties could no longer reproduce with other members of the same baramin.
The term “holobaramin” describes all species that have descended from the original archaebaramin, including those varieties that can no longer interbreed successfully. The task of baraminology is to discern which of many similar species belong to the same holobaramin (ReMine 1990; Wise 1990).
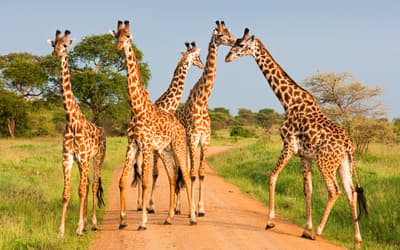
The taxonomic classification of the order Galliformes has shifted several times since its first definition by Carl Linnaeus. He listed four kinds of these large-bodied, short-winged game birds: chickens, turkeys, pheasants, and partridges (Linnaeus 1748). The Linnean classification stands as an excellent approximation and an example of human cognition using perception and wisdom to define created kinds (Sanders and Wise 2003). Birds of the order Galliformes are attractive to men as food since they are often seen where men live, and they are of a size worthy of the effort to hunt them. They are adapted to life on the ground, although some such as cracids live in trees. Most are non-migratory, and they tend to fly fast over short distances (Haverschmidt 2023). To people living in North America the chickens, turkeys and pheasants seem to form an obvious group of similar birds. While the megapodes (incubator birds or mound-builders) of Australasia are unfamiliar to Americans. In form and behavior, they resemble turkeys allowing them to be included in the Galliformes. The same can be said for the cracids of Central and South America. Today, one common classification of the order Galliformes, based on morphology and behavior as in the Linnean system, consists of five extant families: Megapodiidae (mound builders), Cracidae (guans, chachalacas, curassows), Numididae (guineafowl), Odontophoridae (New World quail), and Phasianidae (grouse, Old World quail, peafowl, junglefowl, turkeys, partridges, pheasants) (Dyke, Gulas, and Crowe 2003; Hosner et al. 2015). However, some classify them into three families, (Megapodiidae, Cracidae and Phasianidae) with the superfamily Phasianidae containing subfamilies: Odontophoridae, Numididae, and Phasianinae (Crowe et al. 2006, table 2). This paper will use the five-family classification at the onset of the analysis.
Genomic data for galliform birds is in short supply but is increasing slowly as DNA sequencing becomes more efficient and less expensive. Mitochondrial genomes are available for many of the approximately 290 species of galliform birds but are unavailable for more than half of the 60 studied by Brophy and Mullis (2021). This means a direct comparison of molecular and morphological baraminology on the same taxa cannot be done. Completely sequenced nuclear genomes are even harder to find than mitochondrial genomes. A careful search found 18 complete nuclear genome sequences, including at least one sample in each of the five families, although only seven of the 18 are among the taxa studied by Brophy and Mullis (2021).
This study is an analysis of the clustering of this genomic data. First, mitochondrial genome similarity data are presented for species in the five families of the order Galliformes, and two out-group families, Anatidae (ducks) and Columbidae (doves). Next, correlations of whole genome k-mer scores for nuclear genomes are presented for species in these same families. The molecular data was then interpreted in the light of hybridization data in the manner of Brophy and Mullis (2021) to suggest that the order Galliformes consists of two baramins, the family Megapodiidae and the superfamily Phasianoidea. Phasianoidea includes Phasianidae, Odontophoridae, Numidiae, and Cracidae.
Biblical Information
On the fifth day of Creation Week, God created “every winged bird after its kind” (Genesis 1:20), indicating a finite number of bird kinds. Because galliform birds are clean birds (Deuteronomy 14:11–18), there were seven pairs of them on Noah’s Ark according to Genesis 7:2–3. This fact may explain the large diversity of galliform birds and other clean birds found in the post-Flood world. Other than these facts, the Bible does not provide any more information helpful to this study of galliform baraminology.
Methods
On January 1, 2025, mitochondrial genomes (mitogenomes) for 82 taxa were downloaded from the National Center for Biotechnology Information (NCBI n.d.), including 72 Galliformes, five Anatidae (waterfowl), and five Columbidae (doves and pigeons). Among the Galliformes mitogenomes, several were discarded from this analysis due to annotations indicating “contamination” or “unconfirmed” status. Samples from the family Phasianidae were overrepresented in the collection, so only 30 Phasianidae were chosen (with samples from all regions where they are endemic), along with three Numididae, three Cracidae, three Megapodiidae, and five Odontophoridae. This left mitogenomes of 53 taxa for analysis: 44 Galliformes, four Anatidae, and five Columbidae. These are listed in Supplementary Table S1. The mitochondrial sequences were analyzed as follows. An “all-by-all” similarity matrix and a heat map were made using custom Python scripts. Next, k-means clustering was done to produce an elbow plot, and a Hopkins clustering index was computed. Finally, multidimensional scaling (MDS) was done on the similarity matrix using a package from sklearn software (Pedregosa et al. 2011).
On January 26–29, 2025, 18 complete whole nuclear genomes were downloaded from three websites: NCBI n.d., European Nucleotide Archive n.d., and B10K Database n.d. (Shaohong et al. 2011). These included samples from each of the galliform families (six Phasianidae, three Odontophoridae, one Megapodiidae, one Numididae, one Cracidae) plus, for out-groups, three Anatidae (waterfowl) and three Columbidae (doves and pigeons). They are listed in Table S2 in the supplementary information. Note that only one complete nuclear genome sequence was found for three of the five galliform families: one Megapodiidae, one Numididae, one Cracidae.
With a Python script, whole genome k-mer scores for 12-mers were computed for these 18 samples. The k-mer represents a stretch of DNA that is 12 bases long. We used 12-mers rather than shorter k-mers because the larger k-mers produced increased discrimination among the genomes. In other words, the longer a k-mer is, the more specific it is. Shorter k-mers can occur by chance more easily. The k-mer scores were compared for all pairs of samples using Pearson Correlation Coefficients, and these were recorded in a square matrix and submitted to heatmap and k-means clustering analysis, following the protocol used by Cserhati (2020).
Galliform hybrid data was obtained from the “Handbook of Avian Hybrids of the World” (McCarthy, 2006) and put into a hybridogram using an R script.
Supplemental Information is available on Zenodo (zenodo.org/deposit/15587074), where one can find the similarity and correlation matrices described above and the tables listing the taxa.
Results
Mitochondrial genome similarity
Fig. 1 is a heatmap made from the mitogenome sequence similarity matrix. The Hopkins clustering statistic for this matrix is 0.895, indicating good clustering. Three large groups can be seen: an outgroup (Anatidae) in the left upper corner, another out-group (Columbidae) in the right lower corner, and the large, central block of Galliformes, which includes twelve small clusters. Fig. 2 is the Elbow plot from the k-means clustering algorithm, which indicates four significant clusters because the decline in the total within sum of squares (TWSS) from five to four clusters represents a change of 0.009, less than the significance threshold of 0.05. Accordingly, the heatmap (fig. 1) has four significant putative clusters, which are labeled in red. The first group is Anatidae, the waterfowl outgroup. The second group consists of three galliform families: Phasianidae, Numididae, and Odontophoridae. The third group is Cracidae and Megapodiidae. Group four is Columbidae, the dove and pigeon outgroup. Based on the clustering of these mitogenomes, one might conclude that the order Galliformes should consist of two holobaramins with Cracidae and Megapodiidae forming a baramin separate from the other three galliform families. However, the whole genome data and the hybridization data put Cracidae together with the other three families in the Order Galliformes.
Whole genome k-mer score correlations
Fig. 3 is a heatmap of the whole genome k-mer score Pearson Correlation matrix for 12-mers. The Hopkins clustering statistic is 0.691, indicating moderate clustering. Based on the k-means clustering Elbow plot for this data (fig. 4), there are only three significant clusters: the two outgroups and order Galliformes. Only three clusters are significant since the change in the TWSS falls below 0.05 after k = 3. The one Megapodiidae, Alectura lathami, appears to be outside the block of galliformes on the heatmap, but being a singleton species, it cannot be a cluster. The single species of Cracidae, Penelope pileata clusters with the galliforms.
The Pearson Correlation matrix used to compute the heatmap of fig. 3 was subjected to statistical analysis with the results shown in table 1. The p-value for a cluster shows how statistically significantly the species in the cluster separate from all the other species. To calculate the p-value, the PCC values for in-cluster species are compared to the PCC for all other species paired against the in-cluster species (Cserhati 2020). The p-values are all less than the 0.05 threshold of significance, showing that the difference between the 3 clusters is unlikely to be due to chance. When the k-mer scores of the isolated Megapodiidae species, Alectura lathami, are compared to those of the galliform species, a p-value of 6.574 E-14 is found, showing that Alectura lathami is not in the galliform cluster.
Hybridization data
The hybridogram depicted in fig. 5 details documented hybrids (strong hybridization) or hybrids with the same third species (weak hybridization) for many of the taxa listed in supplementary table S1. Weak hybridization is present if two species hybridize with the same third species but have not yet been demonstrated to hybridize with each other. Weak hybridization suggests genetic differentiation has occurred within a baramin so that some members of the baramin can no longer mate to produce offspring. Extensive strong hybridization was found within each family. Strong or weak hybrids are found in crosses between four of the five galliform families. No hybrid records were available for the three Megapodiidae species in this study, so the hybridogram contains no such taxa. The family Numididae, represented by Acryllium vulturinum, hybridize strongly with species from Phasianidae. Weak hybridization with Gallus gallus (from which the domestic chicken was derived) was found to unite Cracidae with Phasianidae. The family Odontophoridae, represented by Colinus virginianus (northern bobwhite), are united to Phasianidae only by weak hybridization with Perdix sp. and Coturnix sp. None of the Anatidae (waterfowl) or Columbidae (doves and pigeons) hybridize with any of the galliform birds.
Multidimensional scaling
Fig. 6 is the multi-dimensional scaling (MDS) plot made from the mitogenomes similarity matrix showing four groups: Anatidae (“A”), the Columbidae (“C”), the Megapodiidae (“M”), and the Phasianidae (“P”). The MDS plot shows entities based on their pairwise similarities/dissimilarities. In three-dimensional MDS, the X, Y, and Z coordinates represent the information of an N x N matrix where N = 3. Most information is retained by approximating the separation between the data points (Brophy and Mullis 2021; Mead 1992). These three dimensions have no exact biological meaning. In this plot, order Galliformes is split into two holobaramins, Megapodiidae and a superfamily that includes the other four families in this study (Phasianidae, Numididae, Cracidae, and Odontophoridae).
Table 2 summarizes the results of this study, showing how the mitogenome data, the whole genome data, and the hybridization data split the order Galliformes into two holobaramins. The MDS plot, fig. 6, is labelled to reflect this result by putting the Megapodiidae family into a holobaramin separate from the other four galliform families, which are grouped together and have been labeled as “pheasants.”
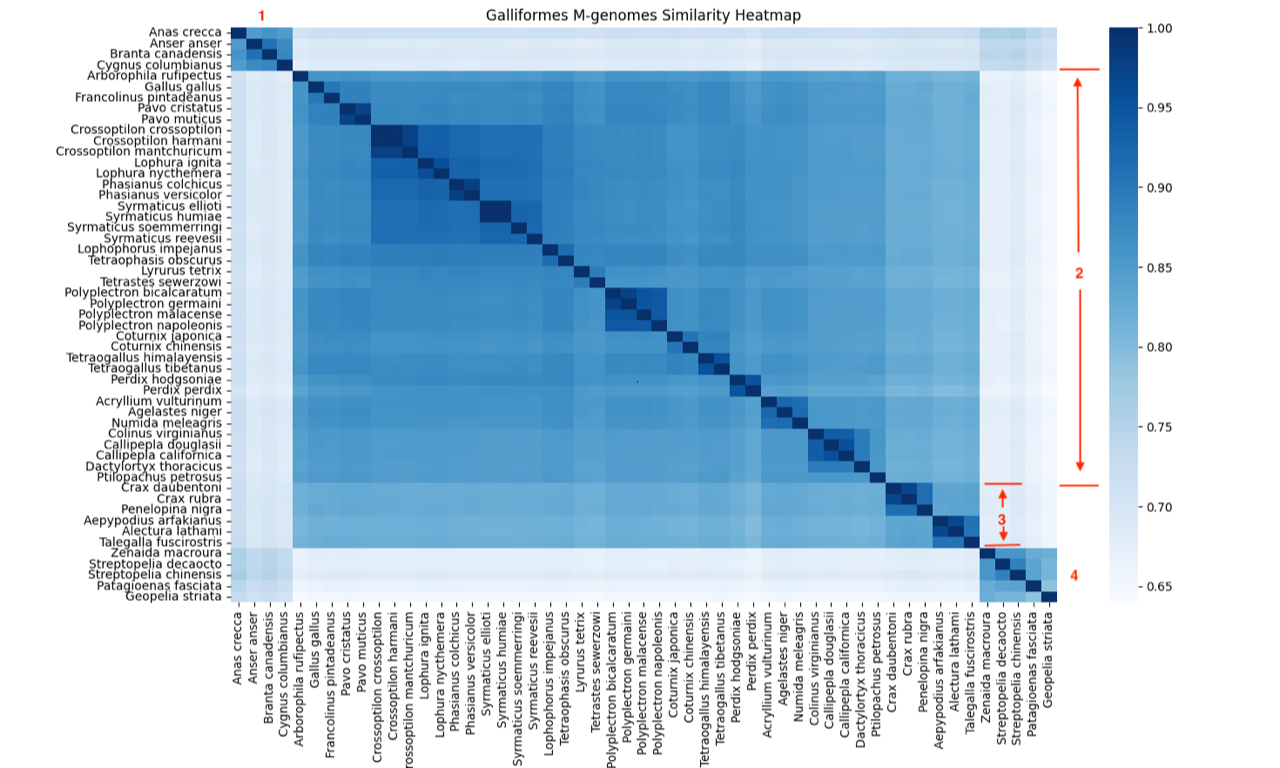
Fig. 1. A heatmap based on mitogenome similarity of order Galliformes (44 taxa), Anatidae (four taxa), and Columbidae (five taxa). The four identified clusters are marked in red: 1. Anatidae. 2. Galliform families Numididae, Odontophoridae, and Phasianidae. 3. Galliform families Cracidae and Megapodiidae. 4. Columbidae.
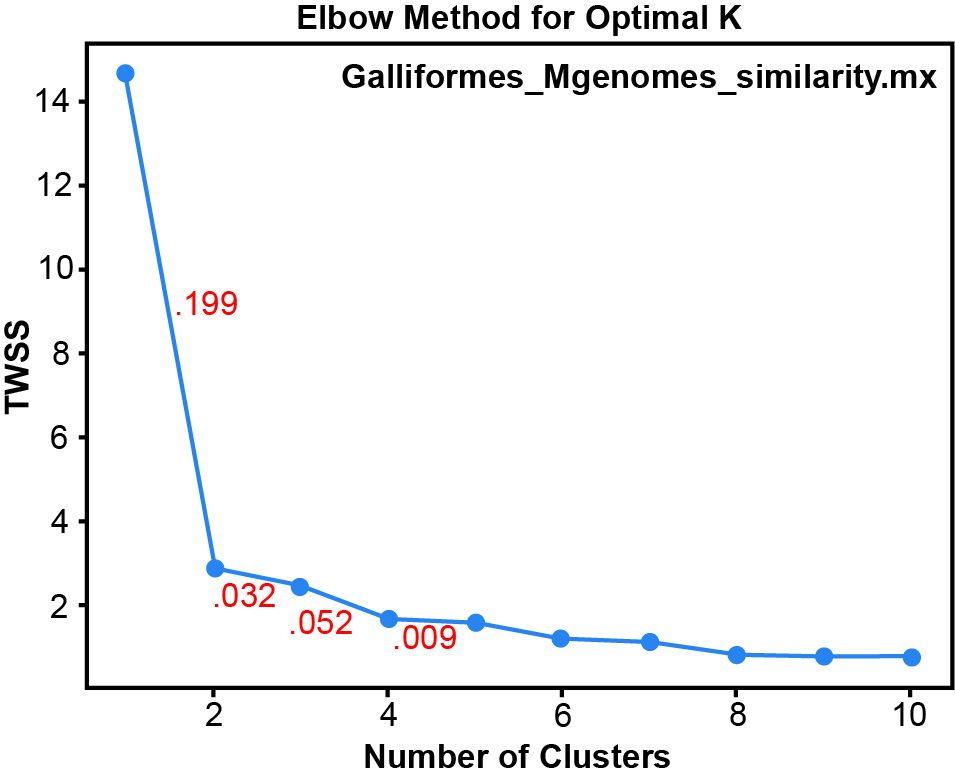
Fig. 2. The Elbow plot from k-means clustering for the mitogenome similarity matrix. The numbers in red are the fractional change in the total within sum of squares value (TWSS) from one cluster to the next.
Discussion
The discipline of baraminology is a dynamic balancing act between two opposed concepts of separation and inclusion. The statistical clustering methods applied to morphology and molecular data define the separation of living things into distinct baramins. In contrast, hybridization data defines which species should be included in the same baramin. The balance of continuity and discontinuity is the focus of baraminology. The molecular baraminology of Galliformes presented here follows the same pattern observed in the morphological study by Brophy and Mullis (2021). In both cases, the clustering algorithms initially distinguished two galliform holobaramins by separating Cracidae and Megapodiidae from the other three families. In contrast, the hybridization data moved the Cracidae to join the other three families, leaving the Megapodiidae as a separate baramin, a result supported by the whole genome k-mer correlations presented above. The results of the whole genome method should be preferred over the results of the mitogenome similarity since far more genetic information is in the nuclear genome than the mitogenome. The information provided by the hybridization data is paramount because members of the same baramin can hybridize (Wood et al. 2003, 2). This biological law derives directly from Scripture.
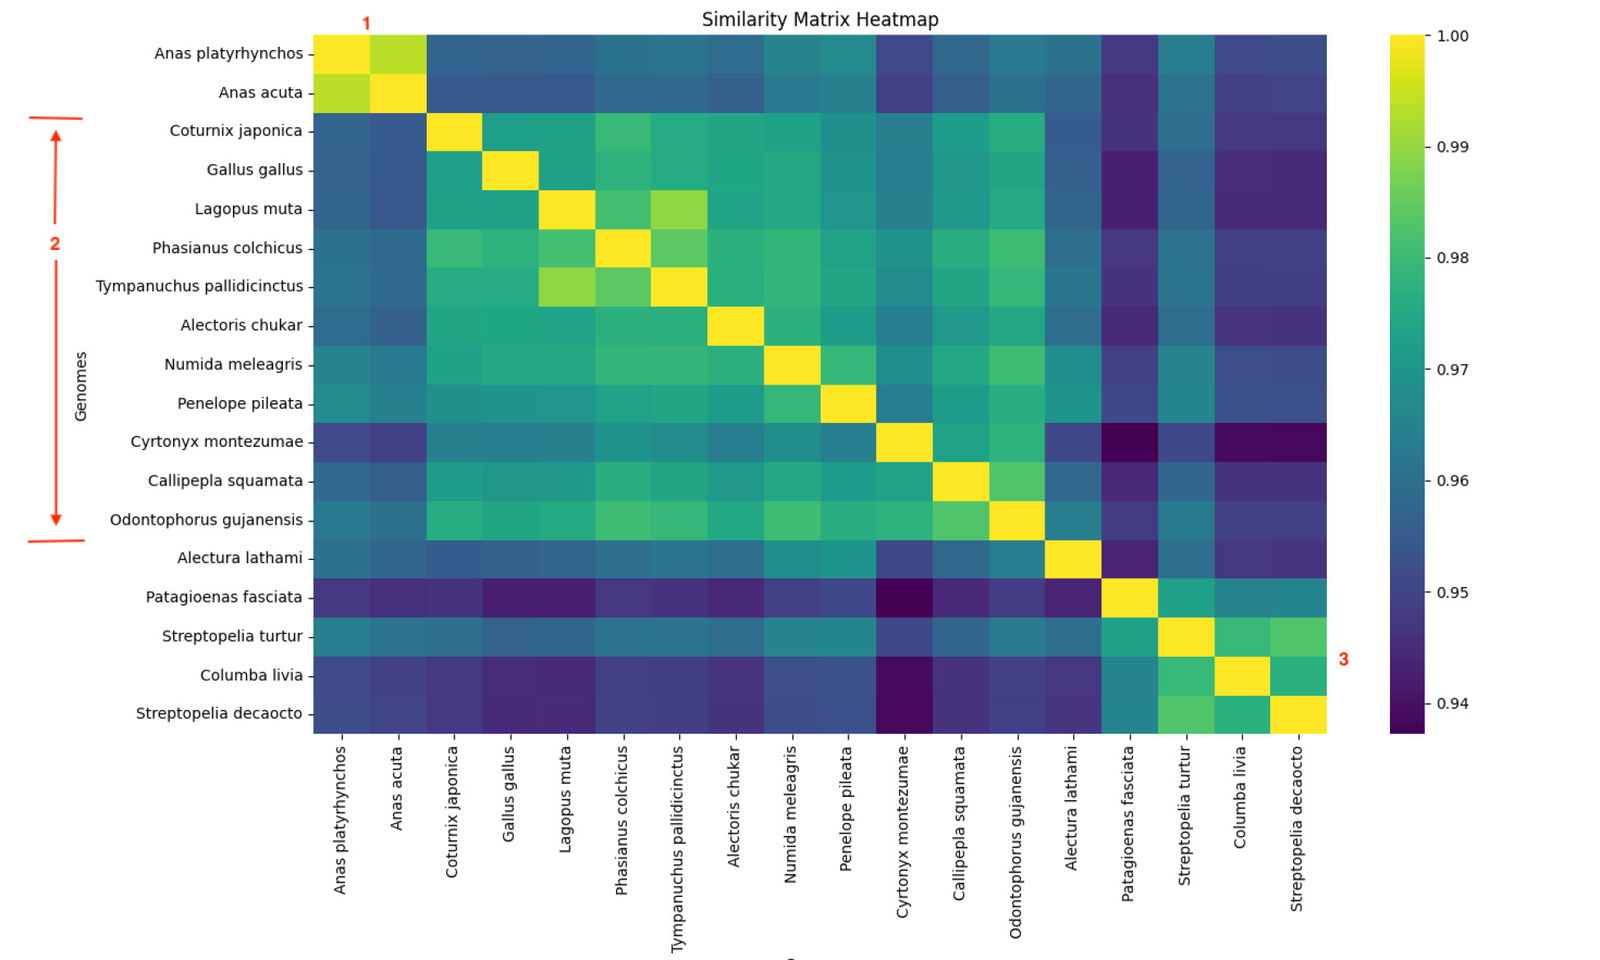
Fig. 3. A heatmap based on the Pearson Correlations of Whole Geome K-mer Signatures using 12-mers of 18 nuclear genomes, which include Galliformes, Anatidae, and Columbidae. The three identified clusters are marked in red: 1. Anatidae. 2. Galliformes except Megapodiidae. 3. Columbidae. The lone Megapodiidae species, Alectura lathami, is isolated between clusters 2 and 3.
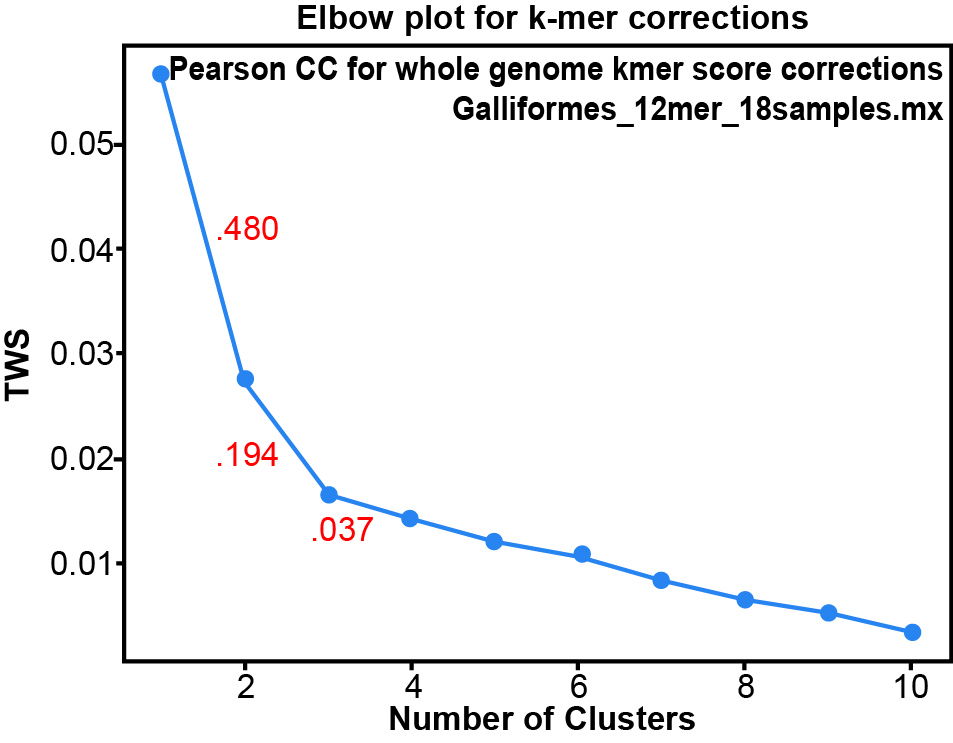
Fig. 4. The Elbow plot for k-means clustering of the Whole Genome K-mer Signature Pearson Correlations in the whole genome correlation matrix The numbers in red are the fractional change in the TWSS value from one cluster to the next.
It is a matter of discussion whether in vitro fertilization and partial embryological development constitute a valid demonstration of hybridization (Scherer 1993). For animals, survival to birth or hatching demonstrates that the genetic information in the hybrid is superbly functional, even if, as in the case of the mule, the offspring is usually sterile (Lightner et al. 2011). However, failure to demonstrate hybridization is not evidence that two species belong to different baramins, as will be explained below. The baramin concept provides an explanation of how the post-Flood world could be filled with such an astonishing variety of birds in the 4,500 years since the Flood. Consider the kinds and numbers of birds that survived the Flood on Noah’s Ark.
God told Noah, “You shall take with you seven pairs of every clean animal, a male and his female . . .” (Genesis 7:2) For clean birds, such as galliforms, waterfowl, and doves, there would have been 14 individuals from each kind. These birds that were brought by God to the Ark had all descended from the archaebaramins created during Creation Week (Wise 1990). Given the prospect of created heterozygosity (Jeanson and Lisle 2016), whereby God created the genomes of archaebaramins with a variety of traits (differing base pairs in diploid genomes), the potential for an abundance of differing animals was inherent in the survivors of the Flood. Indeed, the vast number of species in the post-Flood world shows that the animals that came off the Ark had been loaded with “diversity-generating mechanisms” (Cserhati and Carter 2020).
Furthermore, while on the Ark these birds may have reproduced during the year-long Flood. When large numbers of birds scattered from the Ark, the genetic diversity of each baramin was partitioned in many ways as birds founded remote communities where they rapidly reproduced to refill the world. Members of Galliformes, being mostly non-migratory and dispersing on foot, may have spread out more slowly than other birds. Rapid dispersal and its associated geographic isolation are required to promote genetic diversification from a few members of a baramin into many species. One might suppose that because Galliformes dispersed mostly on foot that the conditions for rapid genetic diversification were not present. But the effects of a rapid dispersal and geographic isolation are appreciated in the statement, “galliforms appear to have undergone successive rapid radiations” (Hosner et al. 2015). This comment suggests that the Galliformes left the Ark and spread rapidly around the world, differentiating into the many varieties we see today. The founder effect, selection pressure, and genetic drift would likely cause some members of a baramin to differentiate to the point of rendering them unable to hybridize with other members of their baramin. The failure of two genera to hybridize is not proof that they belong to different baramins (Wise 1990; Wood et al. 2003).
The mitogenome similarity data analyzed in this paper segregated species of Galliformes, Anatidae, and Columbidae into four significant clusters, with the families Cracidae and Megapodiidae grouped together separately from the other three families. But hybrids have been documented between four of the galliform families, leaving only Megapodiidae as a separate group.
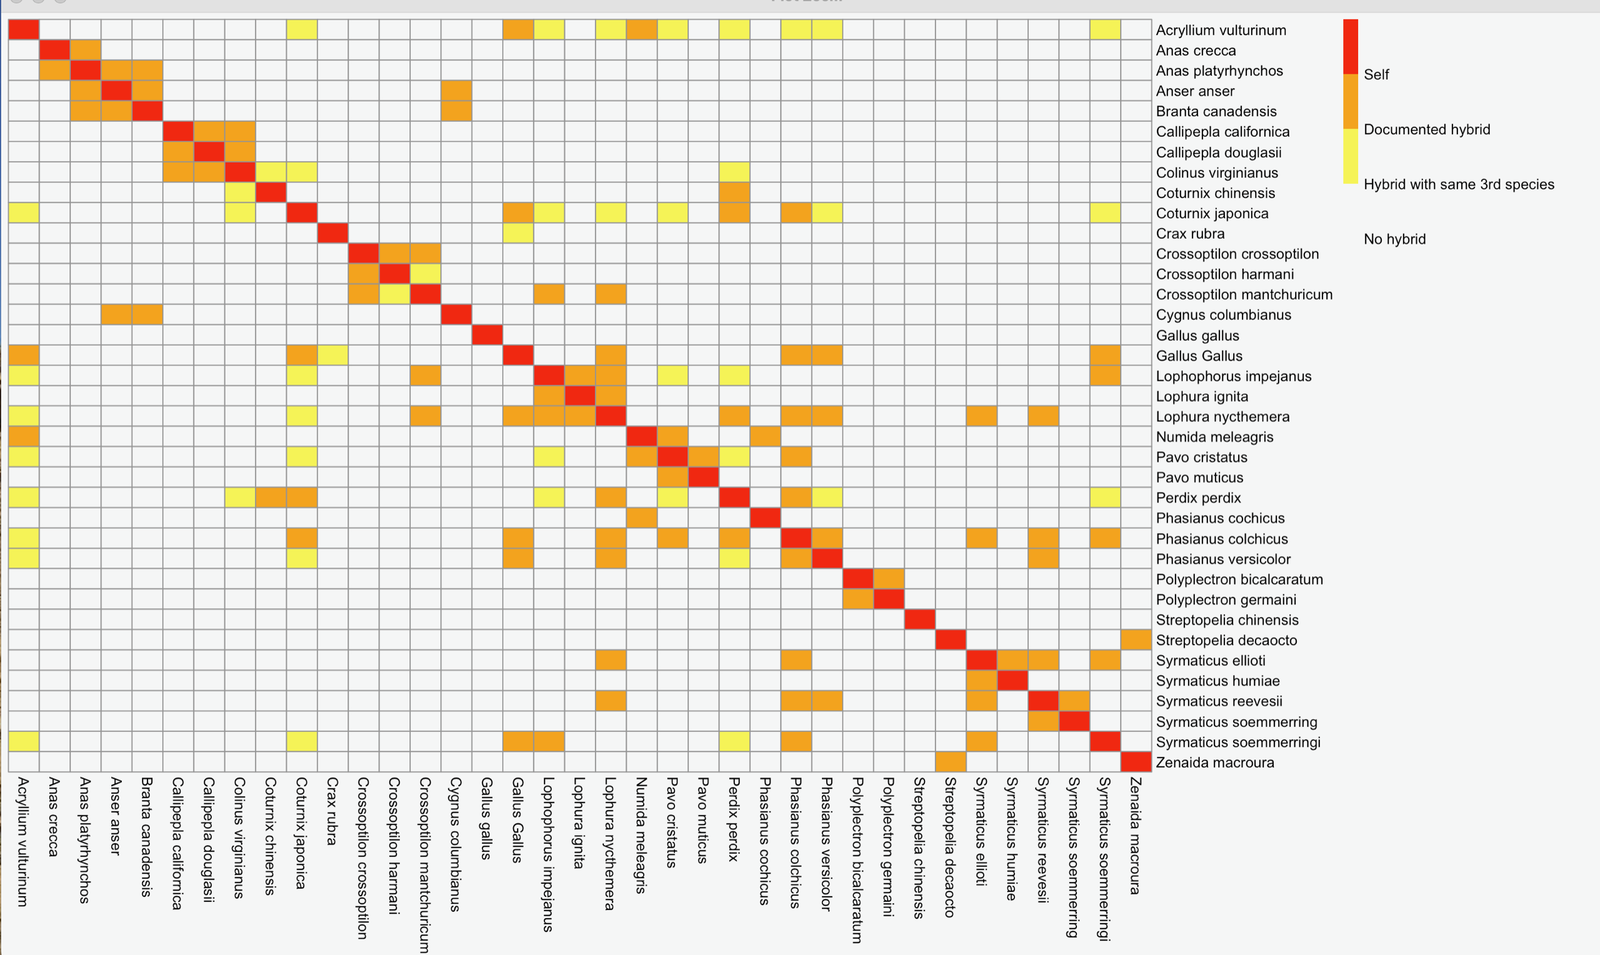
Fig. 5. The hybridogram for the species listed in Supplementary Table 1. Data was obtained from (McCarthy 2006). If no hybrid data was found, the species listed in table 1 are not included in this hybridogram.
The whole genome k-mer score correlations presented in this paper showed that species from all of the galliform families clustered together except the one species from Megapodiidae. Four of the five Galliformes families form a single holobaramin, excluding the Megapodiidae. Because only one Megapodiidae nuclear genome was available, the k-mer score correlations could not place Megapodiidae into a separate group but only isolate it from the other galliform families. A major weakness of this analysis of whole nuclear genomes is the small sample size. There are only a few galliform nuclear genomes available in the public databases. The separation of Megapodiidae into its own holobaramin would be better established by a study of many more samples.
| Cluster | Number of species | Min PCC | Mean PCC | Max PCC | PCC std. dev. | p-value |
| Anatidae | 2 | 0.994 | 0.994 | 0.994 | 0 | 2.12 E-07 |
| Galliformes | 11 | 0.964 | 0.974 | 0.99 | 0.005 | 1.21 E-52 |
| Columbidae | 4 | 0.966 | 0.974 | 0.983 | 0.006 | 2.92 E-16 |
Table 1. Group statistics for three clusters found by k-means in fig. 2 heatmap from WGKS of 12-mers.
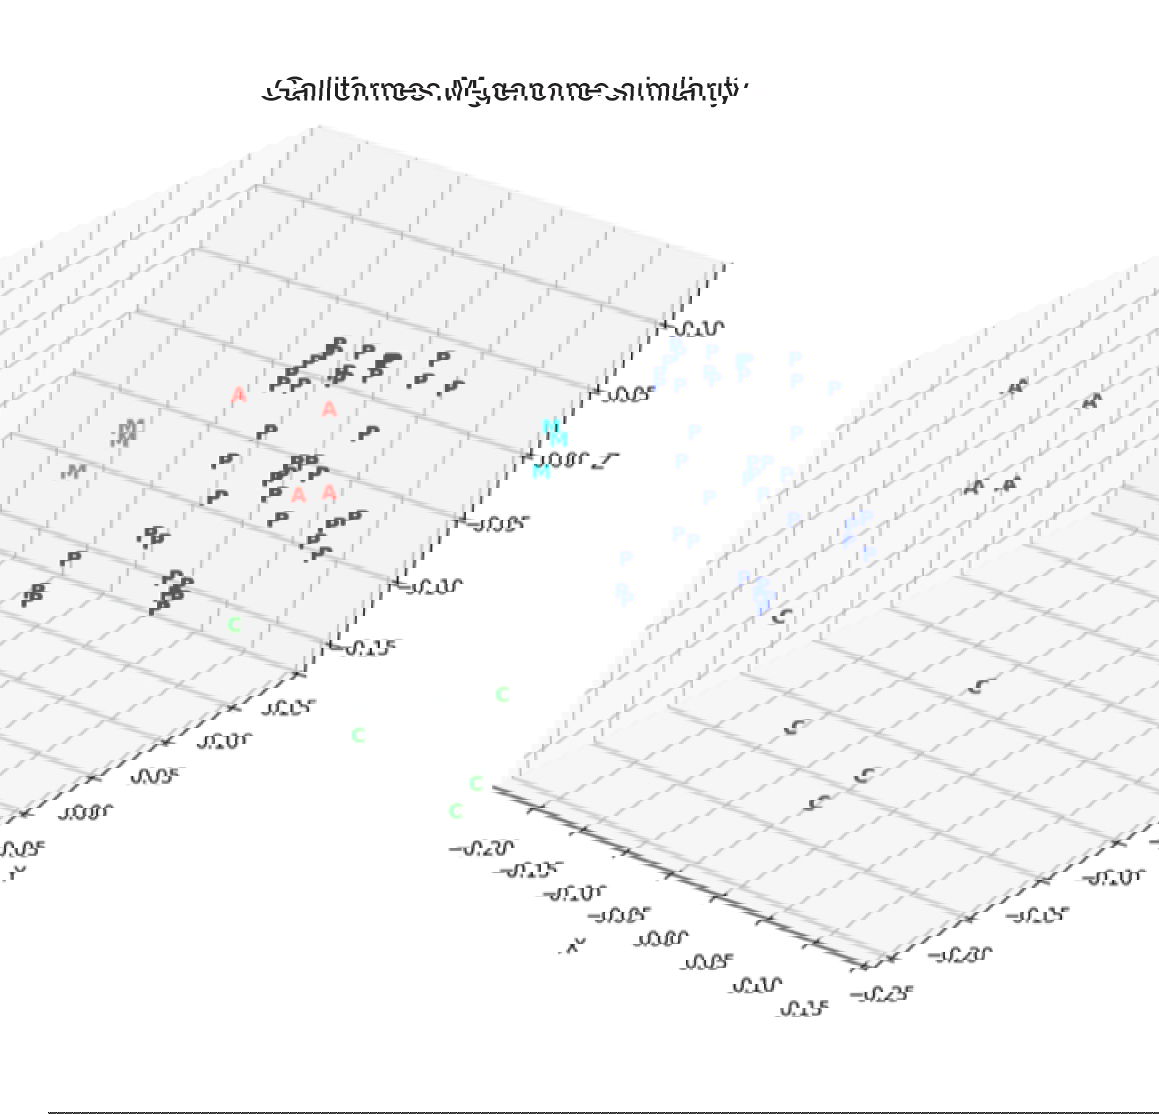
Fig. 6. 3D multidimensional scaling plot of the mitogenome similarity matrix for the species in table 1. A is Anatidae. C is Columbidae. M is Megapodiidae. P is Phasianoidae (Phasianidae, Odontophoridae, Numidiae, and Cracidae).
The following question needs to be addressed. Is it reasonable to separate the Megapodiidae and the Cracidae into different baramins since they look so much alike? They are both game birds resembling turkeys. Yet they differ significantly in reproductive behavior. As their name implies, the Megapodiidae build large mounds of rotting vegetation in which they lay their eggs. The heat generated by decay of the vegetation serves to incubate the eggs and no incubation brooding is required. In contrast, the Cracidae build nests in trees and provide incubation brooding. The difference in reproductive strategy suggests the Megapodiidae and Cracidae belong in different baramins. If coming off Noah’s Ark they originally belonged to the same baramin, the geographic separation of these families may have resulted in their differentiation to the point that they cannot hybridize. Their status as belonging to separate baramins hinges on this failure to hybridize. Demonstrating hybridization between Megapodiidae and Cracidae would thus collapse them into a single holobaramin comprised of the entire order Galliformes.
One pleasing result of this molecular baraminology study is the correspondence with the results of the morphological baraminology of Brophy and Mullis (2021). Both studies found three to four clusters in the data but reached the same conclusion, namely that species from order Galliformes fall into two holobaramins based on hybridization data. In this case, the hard work of baraminologists studying morphology has not been overturned but has been verified and augmented by the usage of molecular data.
| Galliform Family | Mitochondrial Similarity | Whole Genome K-mer Signature | Hybridization |
| Phasianidae | 1 | 1 | 1 |
| Numididae | 1 | 1 | 1 |
| Odontophoridae | 1 | 1 | 1 |
| Cracidae | 2 | 1 | 1 |
| Megapodiidae | 2 | 2 | 2 |
Table 2. The Galliformes families are divided into two baramins (1 and 2) by the three methods used in this study. These methods agree, except for the case of Cracidae, which clusters with Megapodiidae according to mitogenome similarity.
Molecular baraminology is a relatively young discipline, having started in the 1990s with the sequencing of mitochondria. When more genetic data and more hybridization studies become available, the conclusions of this paper identifying two galliform holobaramins may need to be reconsidered. For example, suppose hybrids of Megapodiidae and Cracidae are discovered, placing the Megapodiidae among the other four families in a holobaramin made of the entire order Galliformes. This would be a tribute to the creative genius of God in his placing an even larger degree of diversity into the original landfowl genomes which have caused the world to be populated with so many wonderful birds.
Conclusion
The molecular baraminology and hybridization study presented here used the statistical clustering of genomic data to show that the avian order Galliformes should be comprised of two holobaramins. This result confirms an earlier morphological baraminology study of the order Galliformes. In both studies, hybridization data support this classification. When mitochondrial similarity and whole genome k-mer signatures of galliform species were analyzed, two significant clusters were identified. Among the five families of the order Galliformes, four of them (Phasianidae, Odontophoridae, Numidiae, and Cracidae) clustered together and are known to hybridize. These form a holobaramin. Because members of the family Megapodiidae clustered separately and did not hybridize with the other families, the Megapodiidae form a holobaramin separate from the other galliforms. The astonishing variety and beauty of the birds in the order Galliformes should cause all to give glory to God for his creative power.
Supplemental Information
Supplemental information is available at https://zenodo.org/records/15587074.
Acknowledgments
The authors would like to thank Dr. Kurt Wise for helping with the correct usage of the terminology in the article.
References
B10K Database. n.d. https://db.cngb.org/search/project/CNP0000505/
Brophy, T. R., and M. Mullis. 2021. “A Baraminological Analysis of the Landfowl (Aves: Galliformes).” Journal of Creation Theology and Science Series B: Life Sciences 11: 55–64. https://digitalcommons.liberty.edu/bio_chem_fac_pubs/195/
Crowe, Timothy M., Rauri C. K. Bowie, Paulette Bloomer, Tshifhiwa G. Mandiwana, Terry A. J. Hedderson, Ettore Randi, Sergio L. Pereira, and Julia Wakeling. “Phylogenetics, Biogeography, and Classification of, and Character Evolution in, Gamebirds (Aves: Galliformes): Effects of Character Exclusion, Data Partitioning and Missing Data.” Cladistics 22, no. 6 (December): 495–532.
Cserhati, Matthew. 2020. “A New Baraminology Method Based on Whole Genome K-mer Signature Analysis and Its Application to Insect Classification.” Journal of Creation 34, no. 1 (April): 86–95.
Cserhati, Matthew, and Robert Carter. 2020. “Hierarchical Clustering Complicates Baraminological Analysis.” Journal of Creation 34, no. 3 (December): 64–73
Dyke, Gareth J., Bonnie E. Gulas, and Timothy M. Crowe. 2003. “Suprageneric Relationships of Galliform Birds (Aves, Galliformes): A Cladistic Analysis of Morphological Characters.” Zoological Journal of the Linnean Society 137, no. 2 (February): 227–244.
European Nucleotide Archive. n.d. https://www.ebi.ac.uk/ena/browser/home
Haverschmidt, François. 2023. “Galliform.” Britannica. https://britannica.com/animal/galliform.
Hosner, Peter A., Brant C. Faircloth, Travis C. Glenn, Edward L. Braun, and Rebecca T. Kimball. 2015. “Avoiding Missing Data Biases in Phylogenomic Inference: An Empirical Study in the Landfowl (Aves: Galliformes).” Molecular Biology and Evolution 33, no. 4 (April): 1110–1125.
Jeanson, Nathaniel T., and Jason Lisle. 2016. “On the Origin of Eukaryotic Species’ Genotypic and Phenotypic Diversity: Genetic Clocks, Population Growth Curves, and Comparative Nuclear Genome Analyses Suggest Created Heterozygosity in Combination with Natural Processes as a Major Mechanism.” Answers Research Journal 9 (April 20): 81–122. https://answersresearchjournal.org/origin-eukaryotic-species-diversity/.
Lightner, Jean, Tom Hennigan, and Georgia Purdom. 2011. “Determining the Ark Kinds.” Answers Research Journal 4 (November 16): 195–201. https://answersresearchjournal.org/determining-the-ark-kinds/.
Linnaeus, Carl. 1748. Systema Naturæ. Impensis Godofr. Kieswetteri. Stockholm, Sweden. https://archive.org/details/SystemaNaturae/mode/1up?view=theater.
McCarthy, Eugene M. 2006. Handbook of Avian Hybrids of the World. New York, New York: Oxford University Press.
Mead, A. 1992. “Review of the Development of Multidimensional Scaling Methods.” Journal of the Royal Statistical Society Series D: The Statistician 41, no. 1 (March): 27–39.
National Center for Biotechnology Information (NCBI). n.d. https://www.ncbi.nlm.nih.gov.
Pedregosa, Fabian, Gaël Varoquaux, Alexandre Gramfort, Vincent Michel, Bertrand Thirion, Oliver Grisel, Mathieu Blondel, et al. 2011. “Scikit-Learn: Machine Learning in Python.” Journal of Machine Learning Research 12 (1 November): 2825–2830.
ReMine, Walter J. 1990. “Discontinuity Systematics: A New Methodology of Biosystematics Relevant to the Creation Model.” In The Proceedings of the Second International Conference on Creationism. Edited by Robert E. Walsh and Christopher L. Brooks, 207–213. Pittsburgh, Pennsylvania: Creation Science Fellowship.
Sanders, Roger and Kurt P. Wise. 2003. “The Cognitum: A Perception-Dependent Concept Needed in Baraminology.” In The Proceedings of the Fifth International Conference on Creationism. Edited by Robert L. Ivey, 445–456.
Scherer, Siegfreid. 1993. “Basic Types of Life.” Typen des Lebens Pascal-Verlag Berlin: 11–30.
Shaohong, Feng, Josefin Stiller, Yuan Deng, Joel Armstrong, Qi Fang, Andrew Hart Reeve, Duo Xie, et al. 2011. “Dense Sampling of Bird Diversity Increases Power of Comparative Genomics.” Nature 587, no. 7833 (12 November): 252–257.
Strong, James. 2010. The New Strong’s Expanded Exhaustive Concordance of the Bible. Nashville, Tennessee, Thomas Nelson Publishing.
Wise, Kurt P. 1990. “Baraminology: A Young-Earth Creation Biosystematic Method.” In The Proceedings of the Second International Conference on Creationism. Edited by Robert E. Walsh and C. L. Brooks, 345–360. Pittsburgh, Pennsylvania: Creation Science Fellowship.
Wood, Todd Charles, Kurt P. Wise, Roger Sanders, and N. Doran. 2003. “A Refined Baramin Concept.” Occasional Papers of the Baraminological Study Group 3 (July 25): 1–14. July.