The views expressed in this paper are those of the writer(s) and are not necessarily those of the ARJ Editor or Answers in Genesis.
Abstract
The BioLogos Foundation has published a popular-level article by old-earth geologists Gregg Davidson and Ken Wolgemuth presenting arguments for an old earth. One such argument involves counts of sedimentary laminations (“varves”) within the floor of Japan’s Lake Suigetsu. Their article claims that the very large number of Lake Suigetsu varve counts is strong evidence for an old earth. Creation scientists would argue that most of the lamination couplets are not true annual events. In fact, a plausible explanation for the couplets was presented in the young-earth creationist literature one year prior to Davidson and Wolgemuth’s article. Davidson and Wolgemuth, however, present a new “spin” on the argument: they claim that the correlation between these “varve” counts and radiocarbon dates (as well as tree-ring counts), proves that the Lake Suigetsu varves are true annual events, thus presenting an unanswerable argument for an old earth. However, careful examination of the papers they cite shows that this apparent agreement is the result of the typical uniformitarian circular reasoning. Furthermore, Davidson and Wolgemuth made numerous errors in their article (even within their own uniformitarian framework) which cause one to question whether they carefully read all of the technical papers they cited. Furthermore, they seem to misunderstand the recent results of the RATE research project that showed strong evidence of ubiquitous in situ radiocarbon within fossil specimens that should be radiocarbon “dead” by uniformitarian reckoning. Such results pose a serious challenge to uniformitarian assumptions underlying conventional radiocarbon age-dating methods.
Keywords: BioLogos, age of the earth, Gregg Davidson, Ken Wolgemuth, radiocarbon, varves, tree rings, Lake Suigetsu, Steel Lake, calibration curves, circular reasoning
Introduction
Six years ago the BioLogos Foundation published an article entitled Christian Geologists on Noah’s Flood: Biblical and Scientific Shortcomings of Flood Geology (Davidson and Wolgemuth 2010). As of 9/19/2016, this article was freely accessible online at http://biologos.org/
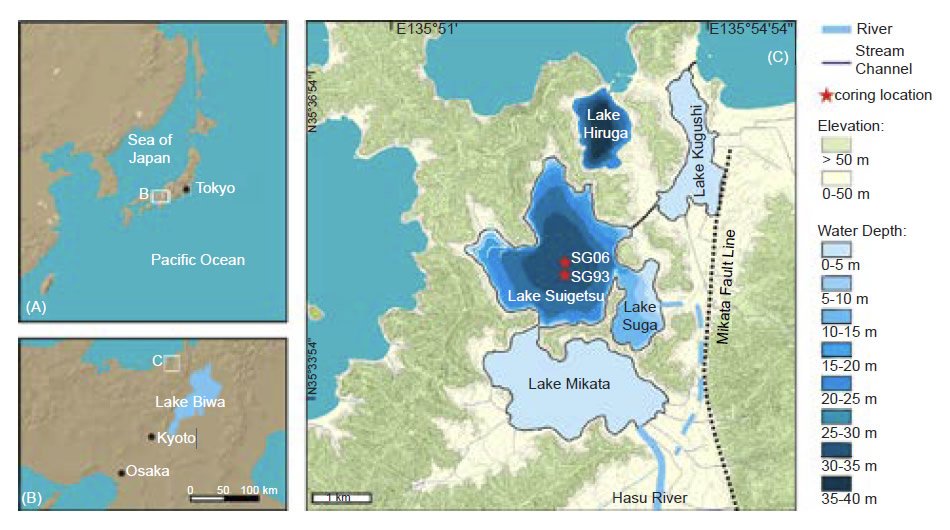
Fig. 1. Old-earth advocates claim that laminations within the sediments of Japan’s Lake Suigetsu (“moon lake”) present an unanswerable argument for an old earth.
Other old-earth advocates (Morton 2003) also believe this to be a strong argument. Likewise, on November 12, 2012, the author of the Naturalis Historia blog posted a lengthy article on Lake Suigetsu (https://thenaturalhistorian.com/
Background Information: Varves
A varve is defined as “A sedimentary bed or sequence of laminae deposited in a body of still water within one year’s time . . .” (Neuendorf, Mehl and Jackson 2005, 703). Alternating patterns of distinct laminae are commonly identified within glacial lake deposits and are generally interpreted in the following way: during the summer months as meltwaters increase flow to the lakes, layers of more coarse sediment are formed, whereas the decreased meltwater in winter results in thinner, more clay-rich layers. The net result, in theory, is an “annual” varve consisting of a summer and winter depositional couplet layer. Because varves are by definition “annual,” they have been used to measure the ages of lake deposits and as proof of ages of millions of years.
However, there is actually no empirical evidence to back the claim that varves form as annual deposits over extended periods of time. There are some varve pairs that form in a single year, but in many cases, the observational evidence shows that multiple supposed varve couplets can and have formed in a single year (Buchheim and Biaggi 1988; Lambert and Hsü 1979; Makse et al. 1997). In fact, it has been documented that at least five pairs of varve couplets can form in a single year due to fluctuations in water flow (Lambert and Hsü 1979). It appears then, that claiming a varve is an annual event is an assumption in itself; one steeped in uniformitarian thought, but not reality.
Can Many Thin Layers Form in a Short Amount of Time?
Geologists have known for quite some time that multiple laminae may form very rapidly. French creation scientist Guy Berthault performed groundbreaking laboratory experiments demonstrating that multiple laminations can form spontaneously when sediment mixtures consisting of particles of different sizes are deposited in air, running water, or still water. This occurs because particles of different sizes have a tendency to spontaneously segregate and stratify themselves. Berthault’s research was published in two papers published by the French Academy of Sciences (Berthault 1986, 1988a), and English translations of these papers were subsequently published in a prominent creation research journal (Berthault 1988b, 1990).
Even uniformitarian geologists have acknowledged that stratification can occur quickly. Almost ten years later, the results of similar experiments were published in Nature (Makse et al. 1997), although Nature did not acknowledge Berthault’s prior work (Snelling 1997).
Furthermore, these experimental results have been confirmed by field observations. Geologic activity at Mount St. Helens subsequent to the well-known May 18, 1980, eruption resulted in the formation of a 762 cm (25 feet) thick deposit consisting of many thin, alternating fine-grained and coarse-grained laminae very similar to varves. This deposit formed within just a few hours (Morris and Austin 2009, 50, 52–54).
Likewise, interpretation of other rock units consisting of many thin laminations makes more sense if one assumes that the laminae were formed rapidly. For instance, the sediments of the Green River Formation in Wyoming are thought to represent many million years of continuous deposition (Bradley 1929a, b). Yet bat, bird, fish, plant and many other fossils within the Green River Formation strongly suggest rapid, rather than slow and gradual, deposition of these fine laminae (Grande 1984). For instance, the Institute for Creation Research has on display multiple examples of fossils from the Green River Formation. One rock slab (fig. 2a) contains the fossilized fish Diplomystus dentatus and Knightia eocaena. Close inspection reveals many fine laminations (fig. 2b). Although there is disagreement among creation scientists as to whether or not the Green River Formation represents a Flood or very early post-Flood depositional environment (Oard and Whitmore 2006; Oard and Klevberg 2008; Whitmore and Garner 2008), one thing is clear: because these fish were preserved, the thin layers must have formed quickly around them, before the fish could decay or be eaten by other scavengers (Whitmore 2009).
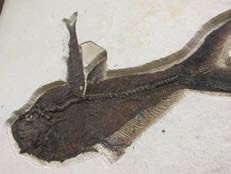
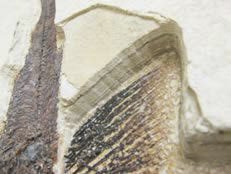
Fig. 2. (a) A fossilized Diplomystus dentatus (the large fish) and Knightia eocaena (the smaller fish) in a slab from the Green River Formation. Many laminations (b) are clearly visible and must have formed quickly before the fish could decompose. Image Credits: Steve Hopper.
Finally, the latest empirical research has demonstrated that thinly-bedded mudrocks, which make up much of the world’s deposits of laminae and the majority of the geologic record, form much differently than previously thought. In the past, uniformitarian philosophy taught that clay-rich mudrocks formed by slow settling out of nearly stagnant water. It also held that thick deposits of clay-rich rocks needed thousands and even millions of years of slow, stagnant clay deposition, as is observed in parts of the deep ocean today. However, recent research by Schieber, Southard and Thaisen (2007) and Schieber and Yawar (2009), using the Indiana University Flume Laboratory, has demonstrated that the commonly observed laminated mudrocks, so prevalent throughout the rock record and around the globe, formed by moving water, and energetic deposition. Their experiments showed that mudrocks, and laminae in particular, form not by slow deposition out of a stagnant water column, but by flowing water at speeds of 0.3 m/sec (1 ft/sec). Laminated sediments were found to form by persistent currents and lateral transport, not merely by deposition from suspension. Individual laminae (and “varves”) result from changes in flow conditions under intermittently energetic conditions (Lazar et al. 2015), not from annual events.
Thus energetic conditions are known to result in the deposition of varve-like laminae. Lest it be argued that such energetic depositional conditions never occurred in Lake Suigetsu, numerous turbidite and flood debris layers have been recognized in the drill-cores of the lake’s bottom sediments and attributed to “past extreme events” (Schlolaut et al. 2014).
Diatom Layers in Lake Suigetsu
But can creation scientists account for the large number of counted varves in this particular lake? Davidson and Wolgemuth claim that more than 100,000 Lake Suigetsu varves have been counted (Davidson and Wolgemuth 2010, 7). As we will see, this is something of a gross exaggeration. Uniformitarian scientists initially estimated around 100,000 varves, but the number that was claimed to have actually been counted was just a little more than 29,000. In reality, it is evident that even that claim is dubious once the reported specific details of their counting methodology are unraveled.
Even so, this at first seems to be more than can be easily accommodated into the Bible’s short 6000-year timescale. However, when one considers Lake Suigetsu’s geological setting, creation scientists can plausibly account for this number of patterns. In fact, creation scientists have already addressed the claim that laminations in this particular lake prove an old earth (Oard 2009, 131).
Between 1991 and 1993, sediment cores were extracted from both Lake Suigetsu and Lake Tougouike. Fukusawa (1999, 237) describes the lithology of these Lake Suigetsu varves:
Clay mineral composition in these varved sediments would be reflected by eolian dust concentrations, transported from Chinese Loess Plateau, and by precipitations around both lakes. Also, formation of iron sulfides and carbonates in varves would be caused by cyclic changes of sea-water invasion, originated from sea-level changes. Annual to decadal oscillations of dust and iron mineral concentrations since the last glacial were detected in varved sequences of both lake sediments.
The cores themselves are composed of gray and dark gray clay, interspersed with white layers composed of diatom assemblages. Each gray and white couplet was assumed to represent an annual event, with the white layer representing diatom blooming during the spring, and the gray layer representing deposition in the autumn/winter (Kitigawa et al. 1995, 371–372).
Uniformitarian scientists have acknowledged that diatom blooms can occur several times per year (Wallace, Frank, and Founie 2006). Even so, it seems at first glance a “stretch” to claim that this many varve sequences could form in just the 4500 years or so since the Flood.
However, since diatom skeletons are composed of hydrated silica (Gasse 1994, 335), diatom productivity can be enhanced by increases in dissolved silica within lacustrine (lake) environments. One such source of silica is aeolian (wind-blown) silicon-containing dust. There is strong evidence of much greater amounts of wind-blown dust during the most recent ice age (creation scientists would argue that the post-Flood Ice Age was the only ice age). For instance, the “ice age” portions of the deep ice cores from Greenland contain much higher dust concentrations (3–100 times greater) than are found in the upper, more recent portions of the cores. Elevated dust concentrations about three times greater than those in the upper core sections are also found in deep Antarctic cores (Paterson 1991, 81; Ruth et al. 2003, 1).
Furthermore, volcanic ash can increase the amounts of dissolved silica in lacustrine environments (Wallace, Frank, and Founie 2006). As we see in the next section, greatly enhanced volcanic activity is expected within the Creation/Flood Ice Age model.
The Creation/Flood Ice Age Model
The Creation/Flood Ice Age model explains why one would expect large amounts of wind-blown dust toward the end of the post-Flood Ice Age (Oard 1990, 2006). Rapid seafloor spreading (Baumgardner 1990, 1994a, 1994b, 2003) and extensive volcanic activity during the Genesis Flood (largely during the latter half) would have resulted in significant warming of the post-Flood oceans. This would have led to dramatically increased evaporation in the years after the Flood, which in turn would have resulted in increased rain and snowfall. Stratospheric aerosols resulting from volcanic activity during the Flood would have reflected significant amounts of sunlight, resulting in a cooling effect that would be greatest during the summer and autumnal months (Bradley 1988, 221). The resulting summer cooling would have greatly reduced summer melting of snow and ice, allowing thick ice sheets to form in the early years after the Flood. Residual post-Flood volcanic activity would have replenished these stratospheric aerosols, allowing the growth of these ice sheets to continue for many years.

Fig. 3. The Creation/Flood Ice Age model plausibly explains the past existence of millions of woolly mammoths in Siberia, as well as their eventual extinction.
The Arctic Ocean would also have been much warmer and ice-free immediately after the Flood. Warm, moist ocean air would have prevented the lowlands of Siberia from glaciating and would have enabled millions of woolly mammoths to live in Alaska, Siberia, and the Yukon. This explains the lack of glaciation in the Siberian lowlands and the ability of millions of woolly mammoths to survive in regions that today are much too cold for such creatures to exist, especially in large numbers. Uniformitarian scientists, however, cannot make use of this mechanism, because most claim that Arctic sea ice was already present for many thousands of years before the time most woolly mammoths are thought to have died out, 10,000–14,000 years ago (Mueller 2009). The presence of millions of woolly mammoths in Siberia (fig. 3) during the Ice Age is a major mystery for uniformitarian scientists, but one which is solved by the post-Flood Ice Age model (Oard 2006).
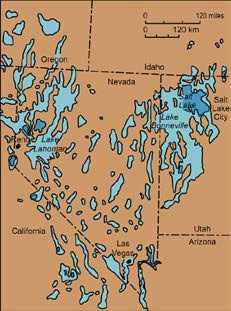
Fig. 4. The past existence of large “pluvial lakes” in what is today’s arid American Southwest can be explained by higher precipitation rates resulting from warm post-Flood oceans.
Furthermore, the Creation/Flood Ice Age model explains much higher rates of past rainfall in parts of the world that today are very arid and dry (for example, Vardiman 2003; Vardiman and Brewer 2011). Both uniformitarian and creation scientists would agree that the Sahara, the Middle East, and the American Southwest once received much higher past amounts of rainfall. For example, large “pluvial lakes” were present in the American Southwest (fig. 4). Because the moisture content of air decreases rapidly with decreasing temperature (Lutgens and Tarbuck 2010, 103), and because uniformitarian paleoclimatologists generally assume very cold ice age temperatures (Bintanja, van de Wal, and Oerlemans 2005; Cuffey et al. 1995), uniformitarian scientists have great difficulty explaining how such heavy precipitation could occur during an ice age. However, dramatically increased evaporation from much warmer post-Flood oceans would result in much greater rainfall during the Ice Age, solving this climate mystery.
Dust Storms at the End of the Ice Age and Lake Suigetsu Varves
With the passing of time, the oceans gradually cooled, resulting in a decrease in global precipitation rates. Likewise, diminishing volcanic activity would reduce the amount of stratospheric aerosols (Austin 1998), allowing the ice sheets to melt back toward their present boundaries.
As meltwater flowed out onto the Arctic Ocean, this less dense freshwater melt would have tended to form a layer on top of the denser saltwater, and this meltwater would have frozen, resulting in a layer of sea ice. The “locking up” of large amounts of water as sea ice (not to mention the surviving Greenland and Antarctic ice sheets) and the gradual decrease in ocean evaporation rates, would have combined to “dry out” the atmosphere toward the end of the Ice Age.
The newly-formed layer of Arctic Sea ice, and the resulting colder high-latitude temperatures, would have set up strong temperature gradients between the low and high latitudes, resulting in strong winds. This, combined with the dry conditions, would have resulted in large dust storms, likely comparable in magnitude to those in the 1930s “Dust Bowl” in the United States (Oard 2000; 2006, 157–173).
These dry, cold conditions may have led to the extinction of the mammoths (Oard 2006, 157), and the resulting dust storms explain the fact that many mammoth remains are found in frozen hills of windblown silt called loess. It also explains the presence of large and highly variable dust content within both the Greenland and Antarctic deep ice cores. Finally, it is also consistent with recent evidence that at least some of the woolly mammoths were asphyxiated by dust (Fisher et al. 2014).
Oard (2009, 131) explains how dust storms at the end of the Ice Age could explain the presence of thousands of varves within Lake Suigetsu:
But couplets can be created rapidly, and this would have been especially true during the Ice Age. Diatom blooms can occur several times a year in a lake for example, during the spring and fall turnovers. So even a uniform rate can be faster than one year. Blowing dust was probably much greater during the Ice Age (Oard 2004). The Greenland ice sheet shows that Ice Age dust was 40 to 100 times greater than at present (Oard 2005). Dust originating from eastern Asia (Svennson et al. 2000) that would have crossed Japan likely occurred in pulses associated with strong, dry cold fronts. Each pulse of dust falling into the lake could have caused a diatom bloom. Consequently, dozens of diatom/clay couplets could have occurred each year as long as those atmospheric conditions persisted.
Since windblown dust and volcanic ash can cause diatom blooms, and since both would have been present in large quantities during the post-Flood Ice Age, the presence of even thousands of varves in Lake Suigetsu is not necessarily a “problem” for recent creation. In fact, it may actually be back-handed evidence for the Creation/Flood Ice Age model. But what about the claim that the correlation between radiocarbon measurements and varve and tree-ring counts proves that the Lake Suigetsu varves are annual events? As we shall see, this apparent correlation is the result of the typical uniformitarian circular reasoning. In order to explain why this is the case, however, it is first necessary to discuss some background information regarding radiocarbon dating.
Background Information: Radiocarbon Dating
Energetic cosmic rays (mainly protons) collide with atmospheric molecules, producing free neutrons as a result. These neutrons interact with nitrogen atoms to produce carbon-14 (Faure and Mensing 2005, 615):

Because carbon-14 (radiocarbon) is unstable, it spontaneously decays back into nitrogen-14, while emitting a beta particle (an electron) and antineutrino in the process:

Within organisms which are alive today, approximately one carbon atom in a trillion will be a radiocarbon atom (Benson 1991, 895). Once an organism dies, it no longer takes in 14C, and the 14C/C ratio within the organism will decrease. In the following discussion, we derive the equation (based on uniformitarian assumptions) which expresses age as a function of measured 14C within the remains of an organism. However, let us state categorically and unequivocally that, as creation scientists, we are firmly convinced that the underlying assumptions of this derivation are invalid, particularly the assumption (discussed below) that the 14C/C ratio within the biosphere has remained more or less constant for many thousands of years. However, in order to show the reader how Davidson and Wolgemuth obtained the results depicted in their Figures 5 and 7, it is necessary for us to go through this derivation, even though we do not accept its validity. We will first show that Davidson and Wolgemuth’s use of the information in their cited papers was outrageously simplistic, even within a uniformitarian framework. Then we discuss the evidence against those uniformitarian assumptions in a later section.
We indicate the starting amount of radiocarbon atoms (per gram of carbon) with the notation 14C0. The remaining amount of radiocarbon atoms (per gram of carbon) after some time t is indicated by 14C and is given (Aardsma 1991, 17; Benson 1991, 894; Faure and Mensing 2005, 615) by the equation

The value λ is called the radiocarbon decay constant. One can rearrange this equation to obtain an expression for the time that has elapsed since the death of the organism:

Replacing 14C(t) in Eq. (4) with 14C0/2 (half the starting amount of radiocarbon atoms C0) yields an expression for the half-life, the time required for half the original number of radiocarbon atoms to decay back into nitrogen:

The radiocarbon half-life is 5730 years. This is somewhat different from the original estimate of 5568 years, measured by Willard Libby, the inventor of radiocarbon dating. For the sake of consistency, radiocarbon experts often use the half-life of 5568 years in calculations, even though it is less accurate. A value of 5568 years for the half-life implies that λ has a value of 1.24 × 10⁻⁴ yrs-1. The value of 1/λ is perhaps somewhat easier to remember; 1/λ = 8033 yrs.
If one divides both sides of Eq. (3) by 14C0 and multiplies both sides by 100, the left-hand side of the equation becomes the percentage of original radiocarbon remaining within the organism, expressed in units of “% 14C0”. Taking the natural logarithm of both sides of the equation then results in

These equations were derived (Aardsma 1991, 21) under the following assumptions:
- The rate of radiocarbon production has not varied in the past.
- The global radiocarbon system has been operating long enough that it can treated as a system in “steady state”, at least for time periods for which the radiocarbon method is applicable.
- Radiocarbon has always been uniformly distributed throughout the biosphere, oceans, and atmosphere.
- The number of stable carbon atoms (12C and small amounts of 13C) in carbon reservoirs has been constant in the past, over the entire globe.
These assumptions assume a uniformitarian worldview, which we reject. Moreover, even uniformitarian scientists realize that these assumptions are not strictly correct (Stuiver, Reimer, and Reimer 2016). For instance, the amount of atmospheric radiocarbon increased during the Maunder Minimum (Damon and Peristykh 2000) due to increased cosmic ray flux into the atmosphere. Hence, the global rate of radiocarbon production has varied slightly even in the fairly recent past. Furthermore, it is usually assumed that increasing amounts of atmospheric carbon dioxide, derived from radiocarbon-poor fossil fuels, are diluting the concentration of atmospheric radiocarbon (Graven 2015).
Because the radiocarbon dating method is based on uniformitarian assumptions, “old” radiocarbon dates simply cannot be viewed as “proof” of an old earth. For instance, assumption (2) above implicitly assumes that the earth is older than allowed by a straightforward reading of Scripture, since it would take multiple tens of thousands of years for the radiocarbon system to reach a steady state (Libby 1955, 8–9). Also, the method assumes that the atmospheric concentration of radiocarbon has not changed for several tens of thousands of years (Yanjun et al. 2005, 817). Likewise, one would expect much higher amounts of carbon (particularly stable 12C) in the lush pre-Flood biosphere, based on all the Paleozoic and Mesozoic fossils (including the plants in the voluminous coal beds) being pre-Flood organisms that all lived at the same time (Baumgardner et al. 2003; Baumgardner 2005), thus contradicting assumption #4.
Furthermore, even within a uniformitarian worldview, radiocarbon dating is much more complicated than these simple equations seem to imply, and a naïve application of Eq. (4) to specimens that can be dated by eyewitness testimony will almost never (never?) yield a calendar age that would be uncritically accepted by uniformitarian scientists. Hence the need for calibration curves to convert radiocarbon ages to calendar ages which are acceptable to uniformitarians (Reimer 2012). Radiocarbon experts often perform numerous corrections before obtaining a radiocarbon calendar age. Stuiver, Reimer, and Reimer (2016) list the following factors that must be considered when attempting to obtain a radiocarbon age for a specimen that pre-dates the mid-1950s:
- Choice of a calibration dataset (different calibration data sets are required for marine and non-marine samples).
- Possible laboratory offset in radiocarbon measurements.
- Consideration of possible sources of error other than analytical error when reporting the uncertainty in the radiocarbon age.
- Reservoir corrections, due to the fact that marine (and lake) organisms are exposed to different 14C levels than non-marine organisms.
- The percentage of marine carbon should first be estimated and taken into account for samples which may contain a mix of marine and terrestrial carbon.
- A half-life correction, if the laboratory used the modern half-life value of 5730 years, rather than the “Libby half-life” of 5568 years.
- The hemisphere from which the sample was obtained (Northern and Southern Hemispheres have different calibration curves).
- If the organism lived for more than 20–30 years, this must be taken into account by using the calibration curve to obtain a moving average.
- Correction for fractionation effects, namely, the δ13C correction (carbon isotope ratios can fluctuate due to natural biochemical processes).
The Lake Suigetsu Varve Chronology: Subtleties in the Analysis
Now that we have covered the necessary background material, we critique Davidson and Wolgemuth’s claim that correlation between measured amounts of radiocarbon and varve/tree-ring counts proves that most of the Lake Suigetsu laminations must be annual events. We do this by carefully examining the argument presented in their article. It should be noted that Davidson and Wolgemuth’s argument is based upon a number of older papers published in the secular literature (Kitigawa and van der Plicht 2000; Reimer et al. 2004; Tian, Brown, and Hu 2005). To avoid confusion, we will refer primarily to these papers, although we recognize that a number of more recent papers on this subject have since been published (for example, Katsuta et al. 2007; Nakagawa et al. 2012; Schlolaut et al. 2014). Uniformitarian scientists originally estimated the deepest sediments in Lake Suigetsu to be about 100,000 years old, although they have since revised that estimated age upward to 150,000 or 200,000 years (Nakagawa et al. 2012, 171). However, these estimates are based on assumed past sedimentation rates, radiocarbon dating of plant macrofossils buried within the varves (Bronk Ramsey et al. 2012; Kitagawa et al. 1995; Kitigawa and van der Plicht 1998, 2000; Staff, Bronk Ramsey and Nakagawa 2010; Staff et al. 2011, 2012, 2013), and 40Ar/39Ar dating of tephra laminae within the cored lake sediments (Smith et al. 2011; 2013; Staff et al. 2012), not on actual lamination counts.
After briefly describing varves and tree-rings, Davidson and Wolgemuth (2010, 7) state the following:
Varves form in many lakes around the world. In one lake in Japan, Lake Suigetsu, a sediment core was collected in 1991 nearly 250 feet in length.6 The core contained an uninterrupted sequence of varves, with a total count in excess of 100,000. [Footnote in original]
That last sentence is misleading for two reasons. First, it is clear from the original technical papers (Kitigawa et al. 1995; Kitigawa and van der Plicht 1998, 2000) that the researchers did not count 100,000 varve laminae in the cored varve sequences; rather, this was an estimated number based on observed changes in varve thicknesses (Kitigawa and van der Plicht 1998, 505–506). In fact, the claimed number of counted varves was actually just 29,100 (Kitigawa and van der Plicht 1998, 506–507). (We will discuss later the counting methods used and their limitations.)
Second, although the sequence of 29,100 laminae may itself have been uninterrupted, the start date for this varve chronology was uncertain. Hence, the chronology constructed for this varve sequence was a “floating” one (Kitigawa and van der Plicht 1998, 505–506), in which the start date had to be determined by a method other than simple counting. This will have important implications for Davidson and Wolgemuth’s Figure 7, discussed later.
Tree-Rings: Their Figure 5
Davidson and Wolgemuth then state (2010, 7):
We will simply measure how much carbon-14 is currently found in each tree ring. Carbon-14 decays with time, so if each tree ring represents one year of growth, we should see a steady decline in the carbon-14 content of each successive ring. Figure 5 shows tree-ring carbon-14 data from living trees extending back 4000 rings.7 The nearly straight line formed by the data means that it might be possible for a year here or there to have a missing or double ring, but overall, each ring represents one year at least back 4000 years. [Footnote in original]
However, this claim is extremely misleading. even if one accepts, for the sake of argument, the uniformitarian assumptions (discussed later) that were used to derive Eqs. (4) and (6). Davidson and Wolgemuth (2010) are telling the reader that they plotted the amounts of measured radiocarbon in real varves and real tree-rings against the ages of those varves and tree-rings, and that those ages were obtained by simple counting. However, the blue curve in both their Figure 5 and ours was apparently not constructed from actual data points, but is rather a close-up of the (uniformitarian) IntCal04 northern hemisphere radiocarbon calibration curve for the last 4000 years (Reimer et al. 2004). Note that the Reimer et al. (2004) paper discusses the IntCal04 calibration curve and is cited by Davidson and Wolgemuth (2010) in reference 7 in their endnotes. The IntCal04 calibration curve expresses calibrated years BP (before present; that is, years before AD 1950) as a function of radiocarbon years BP. Of course, the fact that uniformitarian scientists need calibration curves to convert radiocarbon “years” into calibrated calendar years ought to be a “tip-off” that radiocarbon dating, even within a uniformitarian framework, may not be quite as simple as Wolgemuth and Davidson seem to think that it is. It is true that this part of the calibration curve was constructed using tree-ring data, but this was not a trivial process; in fact, a random walk model (Buck and Blackwell 2004; Reimer et al. 2004, 1030) was used to obtain the resulting calibration curve. As of 9/23/2016, this calibration curve was posted online at www.radiocarbon.org/
Davidson and Wolgemuth (2010) apparently inserted (very naively, we might add) the radiocarbon years BP from the calibration curve into Eq. (3), treating the radiocarbon age as the time t in the equation. Following the procedure used to derive Eq. (6) that we described earlier, they then calculated the percentage of original carbon-14 that would theoretically still remain (under uniformitarian assumptions) after this time t had elapsed. They then took the natural logarithms of these percentages [see Eq. (6)] and plotted them against calendar years BP to obtain the blue curves in their Figures 5 and 7. This same procedure was used to produce our Fig. 6, which bears a remarkable resemblance to their blue curve (our Fig. 5). Coincidence?
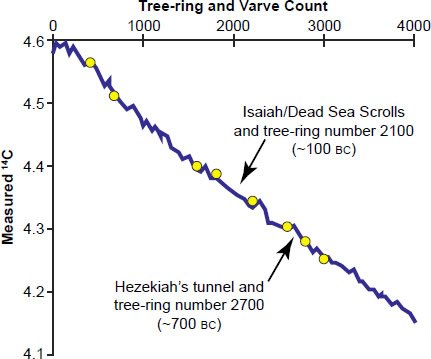
Fig. 5. Adapted from Figure 5 from Davidson and Wolgemuth (2010), who in their caption state: “Measured carbon‑14 in tree rings (solid line) and in varves (circles) back to 4000 rings or varves. Varve data is from Steel Lake, Minnesota . . . . ‘Measured carbon-14’ is shown as the natural log of 14C activity.” Their graph purports to show “measured carbon-14” versus tree ring and varve counts.
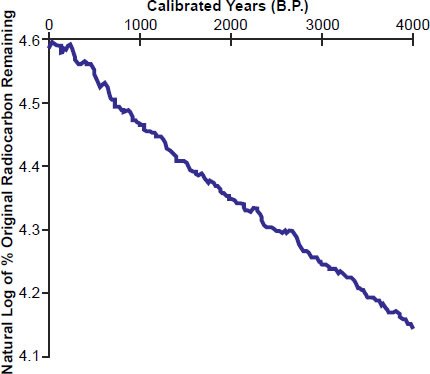
Fig. 6. Graph constructed by inserting radiocarbon ages from the IntCal04 radiocarbon calibration curve into Eq. (6). Note that this procedure, which was apparently used by Davidson and Wolgemuth to obtain their Figures 5 and 7, is incorrect even within a uniformitarian framework, as it naively ignores a host of complicating effects that real radiocarbon dating specialists must take into account when attempting to “date” a specimen.
But this is outrageously simplistic. If one thinks the logic through, Davidson and Wolgemuth (2010) are implicitly claiming that Eq. (4) is all that a uniformitarian radiocarbon analyst needs to determine the age of a specimen: just make a radiocarbon measurement, insert it into Eq. (4), and voila!—one has the specimen’s age. But as noted earlier, radiocarbon specialists must deal with a host of complications in order to attempt to obtain a specimen’s true calendar age. Even within a uniformitarian framework, a radiocarbon dating expert would never expect Eq. (4), by itself, to yield the true calendar age of a specimen. Even though Davidson and Wolgemuth likely simplified the details for the benefit of the non-specialists they are trying to persuade, to give the impression that radiocarbon dating is that simple borders on being deceptive.
Moreover, the apparent radiocarbon ages on the calibration curve do not necessarily correspond to actual radiocarbon measurements. Remember that the calibration curve was constructed to give the best overall “fit” to a large number of calculated radiocarbon ages and their respective calendar ages. Theoretically, this best-fit curve does not necessarily have to pass through any particular data point. This is obvious from the figures in the appendix of Reimer et al. (2004), which describes the construction of the most recent section of the IntCal04 terrestrial radiocarbon calibration curve. Many of the data points in those figures do not overlap the calibration curve, even when their error bars and the uncertainties in the calibration curve are taken into account. This is why it is so misleading for Davidson and Wolgemuth (2010) to claim that the numbers on their vertical axis represent “measured carbon-14.” They most certainly do not. Rather, those numbers represent the amounts of radiocarbon that Wolgemuth and Davidson calculated would still be remaining in the specimens (given uniformitarian assumptions) after the supposed calendar age of the specimen had elapsed. But their calculation naively assumes that the only quantity needed to determine a specimen’s age is the amount of radiocarbon remaining, completely ignoring the real-world complications (fractionation effects, the hemisphere from which the sample was obtained, whether the sample was terrestrial or marine, etc.) that confront genuine radiocarbon experts. It would have been far more accurate to label the vertical axes on their Figures 5 and 7 as “calculated carbon-14”—because that is actually what Davidson and Wolgemuth plotted. Moreover, because Davidson and Wolgemuth ignored the real-world complications in obtaining radiocarbon ages, these are incorrectly calculated amounts of carbon-14—even by uniformitarian reckoning.
The Steel Lake (Minnesota) Varves
There is another misleading aspect to their Figure 5 (reproduced as our Fig. 5). Davidson and Wolgemuth (2010, 8) said this:
Carbon-14 has also been measured in varves. The carbon-14 record for varves in Steel Lake, Minnesota is shown as circles in Figure 5. Note that they fall on top of the tree ring data, which means 4000 varves, at least in this lake, must also equal 4000 years.
However, there is a big problem with this claim. If one reads the Steel Lake paper (Tian, Brown, and Hu 2005) cited by Davidson and Wolgemuth (2010), the radiocarbon ages for the Steel Lake varves fell on the calibration curve only after the raw radiocarbon ages were calibrated and after a “local correction” was applied to the varve counts—but Davidson and Wolgemuth neglected to tell their readers this. This is clearly seen in Figure 4b of the Tian, Brown, and Hu (2005, 514) paper, which, as of 9/23/2016, was archived at https://www.life.illinois.edu/
Tian, Brown, and Hu (2005, 514) describe the method they used to “correct” the varve ages:
Specifically, we added 120 and 115 years to the intervals between 262 and 582 varve BP and between 2217 and 2357 varve BP, respectively. The selection of 120 and 115 years was based on comparisons between the original varve counts and calibrated 14C ages (Table 1, column 8) and on linear regression of the adjusted varve counts and the calibrated 14C ages. [Emphases ours]
Davidson and Wolgemuth’s argument implicitly assumes that the radiocarbon ages and varve counts are independent of one another. But the Tian, Brown, and Hu (2005) paper makes it clear that this is not the case. In fact, the abstract of the paper (Tian, Brown, and Hu 2005, 510) states the following:
Application of appropriate correction factors to these two intervals results in excellent agreement between the varve and 14C chronologies. These results, together with other varve studies, demonstrate that an independent age-determination method, such as 14C dating, is usually necessary to verify, and potentially correct, varve chronologies. [Emphasis ours]
Davidson and Wolgemuth (2010) completely missed the main point of the paper they cite: the varve and radiocarbon ages are not independent of one another. Hence, the apparent agreement between the radiocarbon ages and varve counts (obtained only after calibration of the radiocarbon dates and application of a “local correction” to the varve counts) proves nothing.
Parenthetically, Davidson and Wolgemuth (2010) appear to have mistaken the IntCal04 radiocarbon calibration curve for the IntCal98 calibration curve. They cite (Reimer et al. 2004) in their reference 7, which is the reference for the IntCal04 radiocarbon calibration curve, which we used to construct our Fig. 6. Tian, Brown, and Hu (2005), however, used the IntCal98 calibration curve to construct their Figures 4a and 4b (Stuiver et al. 1998; Tian, Brown, and Hu 2005). However, given the similarity between the two calibration curves, it is easy to see how someone could mistake the later calibration curve for the earlier one. For the reader’s convenience, we have plotted the uncorrected Lake Steel data and the IntCal04 calibration curve on the same graph (our Fig. 7). Our curve has ten data points rather than eight because three of the Lake Steel data points were very closely spaced (see Table 1 in Tian et al. 2005). Tian et al. (2005) and Davidson and Wolgemuth (2010) did not attempt to plot two of these three closely-spaced data points, whereas we did. Five (out of ten) of the uncorrected data points completely “miss” the calibration curve, even when analytical uncertainties are taken into account.
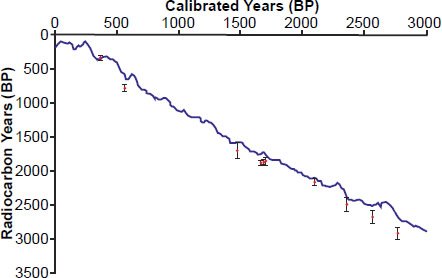
Fig. 7. The IntCal04 radiocarbon calibration curve for the last 3000 (calibrated) calendar years BP. For comparison, the uncalibrated radiocarbon ages for the Steel Lake (Minnesota, USA) varves are plotted against their respective (uncorrected) varve counts.
Digression: Tree-Rings and the Biblical Timescale
Because Davidson and Wolgemuth (2010) mention tree-rings in their argument, it would be helpful to briefly digress and discuss this subject in some more detail. The oldest living trees, the bristlecone pines (Pinus longaeva) of the White Mountains in California have been “dated” by counting tree-rings to ages exceeding 4700 years old. These dates were determined by simply counting tree-rings and assuming tree-rings are exclusively formed as annual events, similar to the assumption for “varves” as discussed above. Because a straightforward reading of the biblical genealogies in Genesis gives a date to the Flood of about 4300 years before present, the ages for living trees exceeding this timeframe have been used as an argument against the accuracy of the biblical timeline.
However, tree-rings, like varves, are assumed to only be annual. In fact, there have been several publications documenting that the formation of more than one tree-ring per year is a common occurrence. Glock, Studhalter, and Agerter (1960) concluded that development of multiple layers in a single year (sometimes called “false rings”) was more common than a single layer forming in a year and that very few annual increments consist of only one ring layer. Mirov (1967), in his book on the genus Pinus, concluded that tree “rings” formed after nearly every cloudburst, tying the appearance of rings to rainfall events in the dry White Mountains climate.
Glock, Studhalter, and Agerter (1960) have also shown that the so-called “false rings” that are so common in dry climate trees like the Bristlecone Pine are indistinguishable from the true annual rings. Therefore, the claims that trees are older than 4700 years are just that, claims based on the poor assumption that trees preserve exclusively annual rings. The data that have been collected to date show this to be false. Tree-rings cannot provide an accurate record of past years.
To extend the tree-ring chronologies beyond that of a single tree record cross-matching of trees must be used, as well as cross-matching with the tree-ring records in wooden beams in old houses. This involves finding two or more closely-spaced living or dead trees, and wooden beams in old houses from the same tree species, and identifying the common sections of their tree-ring records that overlap so that any missing years from tree to tree (or beam to beam) can be added to the overall dates, giving a more extended timeframe. The resultant tree-ring chronology enables claims to be made of trees being older than that allowed by a strict reading of the biblical chronology. Instead, the claimed tree-ring chronology is really only a composite tree-ring history that has not been objectively calibrated to yield reliable dates.
Ferguson (1970) erected a continuous tree-ring chronology for the bristlecone pines of the White Mountains reaching back over 7000 years based on cross matching of several living trees and 17 specimens of dead wood. That tree-ring chronology is reproduced here in Fig. 8. Yet Suess (1970) used 315 14C measurements of bristlecone pine tree-rings from Ferguson’s collection to construct a calibration curve between those bristlecone pine tree-rings and 14C. Note that only the first 1200 years back were based on living trees, and then the cross-matching of the living trees with the dead wood specimens was only based on one living tree and one dead wood specimen. It is thus evident that the “art” of cross-matching of tree-rings as thin as a thousandth of an inch or less is very subjective because of being dependent on the visual assessment of the investigator. One might argue that the use of computer statistical programs to facilitate this process has removed the subjectivity from the method. However, one expert advises that dating should always be performed visually prior to checking with a computer program (Speer 2010, 12, 14). Likewise, Baillie (2015, 85) advises that such computer programs should be used as “backups” and that it is “a dangerous course to allow statistics to overrule human judgement.” Hence, a statistical computer program is seen primarily as an independent confirmation of a visual match, rather than a replacement for the visual matching process.
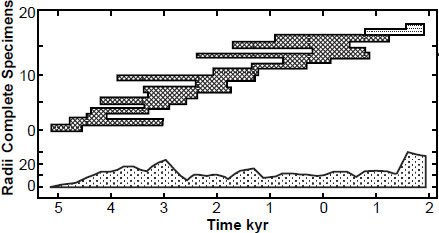
Fig. 8. The “master” tree-ring chronology based on living trees (light dotted hatching) and dead wood specimens (dark cross-hatching) of bristlecone pine with apparent overlapping age ranges based on cross matching (after Dickin 2005; Ferguson 1970). The upper diagram shows the range of each specimen, while the lower diagram shows the total number of radii from which the raw data were derived.
But again, Yamaguchi (1986) has shown that the cross-matching of trees is an inexact science as two trees growing right next to one another will often not exhibit the same tree-ring growth pattern. Scientists are forced to pick matches based on 14C dates, using the carbon dates to match ring patterns that are not unique. This leads to more circular reasoning when dating cross-matched tree-rings, as the onus is then placed back on the accuracy of the 14C dates to date the overlapping section of the tree-rings.
The calendar years BP on the horizontal axis of the IntCal04 calibration curve were obtained from tree-ring chronologies constructed from Douglas firs, German and Irish oak trees, and bristlecone pines (Reimer et al. 2004, 1031–1033). These trees can have lifespans of several hundred years, and some Douglas firs may be more than 1000 years old (https://www.nwf.org/
With the exception of perhaps a few bristlecone pines, none of these maximum possible tree ages are anywhere near 4000 years in age. This means that the numbers on the horizontal axis of Davidson and Wolgemuth’s (and our) Fig. 5 could not have been obtained merely by counting tree-rings in individual trees. Rather, uniformitarian scientists counted rings, identified what they believed were corresponding rings in different trees, dead specimens, and wooden beams from old houses, and then overlapped the different tree-ring counts to form millennial-long chronologies. Hence, this is not quite the trivial exercise that Davidson and Wolgemuth (2010) make it out to be. Furthermore, as noted earlier, radiocarbon dating is used to facilitate this cross-matching process.
Constant Decay Rates and Circular Reasoning
Davidson and Wolgemuth also claim (2010, 7) that “[t]he nearly straight line formed by the data means that it might be possible for a year here or there to have a missing or double ring, but overall, each ring represents one year at least back 4000 years.” However, there are multiple problems with this statement.
First, their blue line is not quite as straight as they make it out to be. This is especially obvious if one plots the radiocarbon years of the calibration curve versus the calendar years (our Fig. 9). But because Wolgemuth and Davidson (incorrectly!) converted the radiocarbon ages (derived under uniformitarian assumptions) into “measured” carbon-14, this fact is obscured on their graph. The disagreement between calendar and radiocarbon ages is even more apparent if one plots the entire calibration curve from 0 to a (presumed) age of 26,000 years (our Fig. 10). Furthermore, as we have noted earlier, the numbers on the horizontal axis are not tree-ring counts at all—they are simply calibrated calendar years BP from the IntCal calibration curve. Yes, tree-rings were used to construct this calibration curve, but the numbers on the horizontal axis of Davidson and Wolgemuth’s Figure 5 (and our Fig. 5) do not necessarily correspond to any particular ring counts within real-world trees.
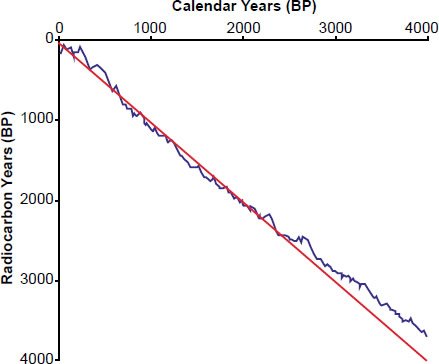
Fig. 9. The IntCal04 radiocarbon calibration curve for the last 4000 (calibrated) calendar years BP. If the radiocarbon age were always equal to the true calendar age, then the blue curve and the red line should coincide. Of course, if that were the case, there would be no need for a radiocarbon calibration curve in the first place!

Fig. 10. The IntCal04 radiocarbon calibration curve for the last ~25,000 (calibrated) calendar years BP. The discrepancy between calendar ages and apparent radiocarbon ages becomes much more pronounced for greater calibrated ages.
Davidson and Wolgemuth (2010) then state, “A straight line (as opposed to curving upward or downward) is also confirmation that radioactive decay rates have remained constant over this time period.” There are a number of problems with this statement.
First, Davidson and Wolgemuth (2010) demonstrate a misunderstanding of what creation scientists believe about accelerated rates of nuclear decay. While we do believe that the decay rates for the heavier nuclides were accelerated tremendously during the Flood event and (possibly) during the Creation Week (Vardiman, Snelling, and Chaffin 2000, 2005), such accelerated decay would have decelerated at the end of the Flood. Hence, creation scientists think, as do uniformitarian scientists, that decay rates have been essentially constant during most of the post-Flood period, although there is intriguing evidence suggesting this may not be strictly true (for example, Cardone, Mignani, and Petrucci 2009). Furthermore, because creation scientists found that the magnitude of the accelerated decay seemed to be proportional to the atomic weights of the parent radioisotopes, they think that the decay rates for the lighter nuclides (such as radiocarbon) would not have been significantly altered even during such episodes of accelerated decay. So accelerated decay during the Flood is thought to have only resulted in about 20% additional reduction in the amount of 14C (Baumgardner 2005, 621).
Second, the fact that decay rates are (at least approximately) constant in the present (under “normal” conditions persisting since the time of the Flood) has been experimentally verified by direct measurements, so it is not clear why Davidson and Wolgemuth (2010) think that creation scientists would argue otherwise.
Third, remember that Davidson and Wolgemuth’s “measured” carbon-14 values in their Figure 5 (and our Fig. 5) are actually calculated amounts of radiocarbon (and calculated incorrectly at that, even given uniformitarian assumptions). And Eq. (3), which they used to calculate these radiocarbon amounts, assumes a constant decay rate. So Davidson and Wolgemuth (2010) are assuming a constant decay rate, and then using that assumption to “prove” a constant decay rate! There is a name for this—it’s called circular reasoning.
But it’s worse than that, because their blue line diverges significantly (our Figs. 9 and 10) from the straight line that would be expected if the radiocarbon age equaled the true calendar age. This is especially true for older calendar ages (our Fig. 10).
So although creation scientists would agree that the radiocarbon decay rate has remained essentially constant within at least the last 4000 years or so, the method which Davidson and Wolgemuth (2010) used to “prove” this is definitely fallacious.
However, creation scientists can plausibly account for the divergence between the blue and red curves in our Figs. 9 and 10, and this is discussed below in more detail in the section entitled “Flood Misconceptions”.
Hezekiah’s Tunnel
Davidson and Wolgemuth (2010) then note that the carbon-14 age assigned to timber from Hezekiah’s tunnel agrees well with the age assigned by the biblical record. Even here, however, Davidson and Wolgemuth oversimplify things. Even these radiocarbon dates were obtained with the use of a calibration curve, after correcting for isotopic fractionation! As noted by the authors (Frumkin, Shimron, Rosenbaum 2003, 170–171):
After correction for isotopic fractionation with the use of measured δ13C, and based on the 14C half-life of 5,568 yr, the conventional dates for the ancient plaster organic materials are 2,620 ± 35 yr BP for a piece of wood (SR53; Table 1), and 2,505 ± 35 yr BP for a short-lived plant (SR61). Calibrated with the OxCal program20 using the INTCAL 98 calibration curve21, these correspond within 1σ uncertainty to calendar age ranges of 822–796 BC for the wood sample, and a multiple range of 790–760 and 690–540 BC for the short-lived plant. [Footnotes in original; emphasis ours.]
Thus uniformitarian scientists use calibration curves even for relatively young artifacts! So even when the radiocarbon age apparently confirms the biblical age, Davidson and Wolgemuth are still underestimating the difficulties associated with the method!
Flood Misconceptions
Davidson and Wolgemuth (2010) then argue that plots of tree-ring and varve counts against measured radiocarbon should result in figures noticeably different from their Figure 5 (and our Fig. 5) had the Flood occurred, and they plot these hypothetical scenarios on their Figure 6, reproduced here as our Fig. 11. However, the four illustrations in their Figure 6 are naïve oversimplifications.

Fig. 11. Adapted from Figure 6 from Davidson and Wolgemuth (2010), who in their caption state: “Data from Figure 5 with solid circles added to show what the data would look like beyond 4000 varves for various scenarios . . .” “Measured carbon-14’ is the same as in [their] Figure 5.”
First, they assume that the only time in earth history during which large numbers of non-annual laminations could have formed is during the Genesis Flood itself (their Figure 6a; our Fig. 11a). But as already noted, thousands of diatom blooms could have plausibly formed in Lake Suigetsu even in the ~4300 years since the Flood, due to the large amounts of volcanic ash and windblown dust during the post-Flood Ice Age.
Second, their Figure 6b (our Fig. 11b) does not represent creationist thinking, in that the creation scientists of the RATE project concluded that the total mass of 14C in the pre-Flood world was probably comparable to what it is today (Baumgardner 2005, 618). However, this radiocarbon would have been tremendously diluted by the greater amounts of total carbon in the pre-Flood world.
For this same reason, their Figure 6c (our Fig. 11c) does not represent creation thinking, as it assumes a faster past radiocarbon decay rate. And, as already noted, creation scientists think that the radiocarbon decay rate would have been hardly affected by an episode of accelerated nuclear decay due to 14C having a very light atomic weight and very short current half-life compared to the orders of magnitude of accelerated decay of 238U with its much heavier atomic weight and very much longer current half-life (Vardiman, Snelling, and Chaffin 2005).
However, the best way to refute these oversimplifications is to present what creation scientists really think about this subject, and to compare this with what is observed. We now do this (and indirectly address their Figure 6d; our Fig. 11d).
Note that their Figure 6a (our Fig. 11a) implies that creation scientists would expect fossil specimens from the Flood to have apparent radiocarbon ages of just 4300 years or so, when these apparent radiocarbon ages actually tend to be inflated by a factor of ten. (Note that their Figure 6 incorrectly implies that the Flood occurred ~6000 years ago, rather than ~4300.)
However, explaining this inflation of apparent radiocarbon ages is quite simple. Creation scientists have calculated, based upon estimated amounts of carbon in coal, oil, oil shale, natural gas, and fossiliferous limestone, that the amount of carbon in the pre-Flood biosphere was probably 300–700 times greater than it is today. However, this estimate was quite “soft” (Baumgardner 2005, 618), and Baumgardner has since suggested a value closer to 250 times greater than it is today (Baumgardner 2016, pers. comm.). For the sake of argument, let’s assume that it was 250 times greater than today’s value. Today, there is about one radiocarbon atom per trillion carbon atoms in the biosphere. This ratio corresponds to a value of 100 percent modern carbon (100 pMC). In other words, this would be the ratio expected to be found in a recently deceased organism in today’s world.
However, in the pre-Flood world, the greater amount of total carbon would imply that the huge amount of normal 12C in living organisms would have diluted the small amount of 14C which accumulated in the ~1656 years of the pre-Flood era. Thus pre-Flood organisms buried during the Flood would have had a much smaller 14C/C ratio, corresponding to about 1/250 this value, or 0.4 pMC. If a scientist were to naively use this value of 0.4 pMC and Eq. (4) to calculate the age of a specimen dating from the Flood, without realizing that the 14C/C ratio had not remained constant during that time, this would result in an apparent age inflated by a factor of ~10:
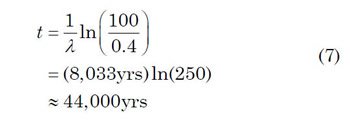
Of course, this is what is actually observed. In the instances in which radiocarbon has been measured in the fossilized remains of “Phanerozoic” creatures (which actually perished during the Flood), these values tend to be between 0.1 and 0.5 pMC, corresponding to apparent radiocarbon ages of ~43,000 to 55,000 years (Baumgardner 2005, 595). Indeed, the samples from ten U.S. coal beds with conventional ages ranging from ~35 to ~320 million years yielded 14C ages that averaged ~48,500 years for the pre-Flood plants buried in those coal beds during the Flood (Baumgardner 2005, 604–606). As the amount of radiocarbon in the atmosphere gradually “built up” in the post-Flood world, the discrepancy between apparent radiocarbon ages and calendar ages would have decreased with increasingly younger samples, thus explaining the trends shown in our Figs. 9 and 10.
However, this alone does not explain the observed “scatter” in these radiocarbon ages. In principle, one might naively expect all specimens from the time of the Flood to have the exact same radiocarbon age. However, there are complicating factors that would prevent this, and these have been addressed (Baumgardner 2005, 614–616). Organic materials contain some nitrogen, and nitrogen may be converted into radiocarbon after interaction with thermal neutrons. Hence, the actual radiocarbon within a given specimen would consist of two parts, a “background” amount that would be essentially the same for all specimens, and a variable part that would depend upon both the nitrogen content of the sample and the local neutron flux (indirectly resulting from accelerated decay of any nearby associated uranium during the Flood event). Since both nitrogen content and local thermal neutron flux within the crustal environment can vary, this could likely explain the observed “scatter” in the amount of measured radiocarbon in specimens that date from the Flood.
Our Fig. 12 presents a much more realistic (albeit qualitative) creation model for the 14C/12C ratio as a function of time. Assuming no primordial 14C at Creation, the 14C/12C ratio would have started at zero. Carbon-14 production in the atmosphere would have caused this ratio to increase during the 1656 years that elapsed between Creation and the Flood. However, this 1656-year duration would not have been sufficient for the amount of 14C in the biosphere to have yet reached a condition of steady state. As the fountains of the great deep were broken up (Genesis 7:11), carbon-containing minerals dissolved in these waters would have introduced additional carbon into the biosphere, causing an abrupt decrease in the 14C/12C ratio. In the 4300 years since the Flood, additional radiocarbon would have been produced, causing the 14C/12C ratio to increase over time. By the time of the Industrial Revolution, this ratio would have begun to “level off,” although a true steadystate condition may not yet have been reached. Since the beginning of the Industrial Revolution, the introduction of anthropogenic carbon dioxide into the atmosphere, as well as nuclear bomb tests performed in the 1950s and 1960s, would have then altered the 14C/12C ratio somewhat.

Fig. 12. A qualitative illustration of the manner in which creation scientists believe the 14C/12C ratio has varied throughout history.
Moreover, the RATE findings (Baumgardner et al. 2003; Baumgardner 2005) call for a radically revised understanding of how 14C methods must be applied to organisms fossilized since the Flood cataclysm. Fig. 13 provides a tentative approximate description of atmospheric 14C levels since the onset of the Flood approximately 4350 years ago. At the onset of the Flood (c. 2350 BC) the atmospheric 14C level would have been on the order of 0.4% of its modern value, at 200 years after the Flood (2150 BC) it was 26%, at 500 years after the Flood (1850 BC) it was 51% of its modern value, at 1000 years after the Flood (1350 BC) it was 74% of its modern value, at 1500 years after the Flood (850 BC) it was 86% of its modern value, and at 2000 years after the Flood (350 BC) it was 94.3% of its modern value. The radiocarbon levels versus calendar age in this figure imply a profound telescoping of radiocarbon dates if the radiocarbon levels are interpreted in the conventional way, for example, 482 BC radiocarbon age instead of 350 BC calendar age, 990 BC instead of 850 BC, 1918 BC instead of 1350 BC, 4315 BC instead of 1850 BC, 9327 BC instead of 2150 BC, and 47996 BC instead of 2350 BC. Based on the RATE findings, the rapid rise in the atmospheric 14C level after the Flood was a consequence of outgassing of 14C (as CO2) from the continental crust. This 14C was generated during the Flood by thermal neutrons reacting with nitrogen and 13C atoms, and the neutrons were a consequence of the rapid uranium and thorium decay during the Flood as described by Baumgardner (2005, 614–616.)

Fig. 13. A qualitative proposal describing atmospheric 14C levels since the onset of the Flood approximately 4350 years ago.
Of course, this more complicated atmospheric radiocarbon history implies, as we have noted earlier, that the standard radiocarbon decay equation, our Eq. (3), is simply wrong.
In Situ Radiocarbon within Ancient Specimens
It should be noted that Davidson and Wolgemuth (2010) are overlooking a much larger issue involving radiocarbon. With a half-life of just 5730 years, radiocarbon decays so quickly that even the most sensitive accelerator mass spectrometers should not be able to detect any radiocarbon in specimens more than about 100,000 years old. Yet both uniformitarian and creation scientists have repeatedly measured radiocarbon in fossil specimens said to be many millions of years old. By 1970, more than 15,000 catalogued specimens apparently contained radiocarbon (Whitelaw 1970). It was generally assumed that these anomalous detections of radiocarbon were occurring because β counters can be “fooled” by cosmic rays. However, accelerator mass spectrometers, which do not suffer from this defect, have also repeatedly detected radiocarbon in “ancient” fossil specimens (Giem 2001). Detectable radiocarbon has consistently been found in coal (Baumgardner 2005), fossilized wood (Snelling 2000, 2008), and even dinosaur fossils (Thomas and Nelson 2015). The very fact that any radiocarbon at all is detectable in specimens claimed to be millions of years old is a powerful argument against the “millions of years” espoused by Davidson and Wolgemuth (2010). The ubiquitous presence of 14C at levels far above instrument detection levels in Phanerozoic fossils collapses the presumed 500 million years of Phanerozoic history into merely thousands. In fact, radiocarbon has even been detected in diamonds, which are ostensibly billions of years old (Baumgardner 2005; Baumgardner et al. 2003; Taylor and Southon 2007).
Uniformitarians (Bertsche 2008) have attempted to argue that this radiocarbon is the result of either in situ or laboratory contamination. While this may sometimes be true, it strains credulity to think that this is true in all cases. In any case, these specific accusations have been well responded to repeatedly (Baumgardner 2007, 2015), but uniformitarians continue to ignore such rebuttals and keep on repeating the same fallacious claims.
During most of our critique of Davidson and Wolgemuth’s use of Eqs. (4) and (6), we have focused on Davidson and Wolgemuth’s misuse of the uniformitarian calibration curves, temporarily overlooking the flawed uniformitarian assumptions underlying the derivation of those equations. But of course, that error, though embarrassing, is a mere “speck” in the eye of their method compared to the “plank” of these flawed uniformitarian assumptions (Matthew 7:3–5).
In addition to the ubiquitous presence of radiocarbon in Phanerozoic fossils, the RATE team also found other evidence challenging uniformitarian assumptions. The retention of significant amounts of helium in zircon crystals is another argument for accelerated nuclear decay that collapses1.5 billion years of alleged history into just 6000 years (Humphreys 2005). Likewise, orphan radiohalos in granite are still yet another argument for accelerated nuclear decay (Snelling 2005).
50,000 Lake Suigetsu Varves?
Davidson and Wolgemuth (2010, 9) then present their Figure 7 for the Lake Suigetsu varves, a graph of “measured carbon-14” versus tree-ring and varve counts. We here reproduce that figure as our Fig. 14. They then claim that the straightness (linearity) of the line on the graph requires one of two possible explanations. The first possibility is that 50,000 varves really do represent approximately 50,000 years, which would imply that the earth is at least 50,000 years old. Furthermore, since they claim there are actually about 100,000 Lake Suigetsu varves, the earth must be even older, at least 100,000 years old.

Fig. 14. Adapted from Figure 7 from Davidson and Wolgemuth (2010), who state in their caption: “tree-ring number (solid line) and varve number (circles) vs. measured carbon-14. Varves less than 5000 are from Steel Lake, Minnesota; varves greater than 5000 are from Lake Suigetsu, Japan. ‘Measured carbon-14’ is shown as the natural log of the carbon-14 activity. Vertical bars represent the magnitude of uncertainty in the measured value.”
The following is what they present as the only other option (Davidson and Wolgemuth 2010, 9):
God started with a fast rate of carbon-14 decay and dozens of diatom blooms and die-offs each year, but then intentionally and precisely slowed down each independent and unrelated process in such a way as to make it falsely look as if the data confirms [sic] the accuracy of carbon-14 and varve counting as legitimate methods of determining age. [Emphasis theirs.]
Wolgemuth and Davidson (2010) correctly reject this second option, noting that God would never deceive anyone. But is it really true that rejection of the second option implies that the first option is true?
No, it does not. First of all, the line is not as straight as they suggest. In our Fig. 15, we have attempted to reproduce Davidson and Wolgemuth’s Figure 7 (our Fig. 14). We did this by plotting the data from the Appendix in Kitigawa and van der Plicht (1998, 511–515). We then converted the radiocarbon ages into “measured carbon-14” using Davidson and Wolgemuth’s (incorrect) procedure. We used that same procedure to obtain error bars for the “measured carbon-14”. Note the similarity between the yellow dots in Figs. 14 and 15. Davidson and Wolgemuth’s Figure 7 (our Fig. 14) seems to contain more data points than one would have obtained just from the Kitigawa and van der Plicht (1998) paper, so Davidson and Wolgemuth probably combined these data with data from an updated paper (Kitigawa and van der Plicht 2000).
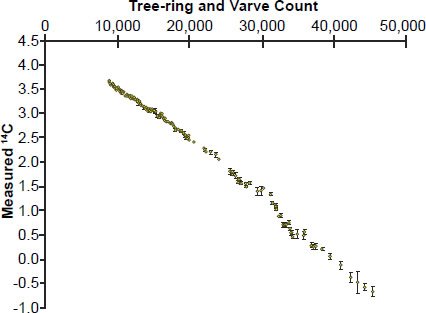
Fig. 15. Attempt to reproduce Davidson and Wolgemuth’s Figure 7 (our Fig. 14) using data in the appendix of Kitigawa and van der Plicht (1998). The greater number of data points in Davidson and Wolgemuth’s Figure 7 probably results from additional data points obtained from Kitigawa and van der Plicht (2000), although Davidson and Wolgemuth (2010) did not cite that particular paper.
Again, the true disagreement between apparent radiocarbon ages and calendar ages is more evident if one simply plots radiocarbon ages versus calibrated ages (our Fig. 16). In fact, Fig. 3 in Kitigawa and van der Plicht (1998) is very similar to our Fig. 16.
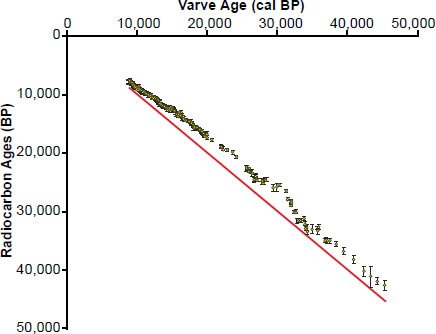
Fig. 16. Despite Davidson and Wolgemuth’s claim, the radiocarbon ages obtained from Lake Suigetsu almost never agree with their respective varve ages.
Second, Davidson and Wolgemuth (2010) simply did not carefully read the papers they cite. We have already noted that the varve ages depicted in Davidson and Wolgemuth’s Figure 7 (our Fig. 14) were obtained from what was originally a “floating” varve chronology (Kitigawa et al. 1995, 374–375; Kitigawa and van der Plicht 1998, 506). Although this chronology (for depths between 10.42 and 30.45 m) was thought to cover a period of 29,100 years (Kitigawa and van der Plicht 1998, 506–507), the researchers did not know the “start date” for this part of the chronology. So how was this start date determined? Kitigawa and van der Plicht (1998, 507) explain:
In order to reconstruct the calendar timescale, we compared the Lake Suigetsu chronology with calibration curves obtained from the absolute German oak (shifted by 41 yr at 5241 BC to the older direction, Kromer et al. 1996) and the floating German pine (Kromer and Becker 1993) using the least squares minimization. The revised German oak and the floating German pine calibration curves were combined into one calibration curve by moving the age of the German pine chronology.
Figure 2 shows the best match between the tree-ring and the Lake Suigetsu chronologies, estimated by minimizing the weighted sum of squared differences between the 14C ages of macrofossils and the tree-ring calibration curve . . . . Using this match, we defined the absolute time scale for the Lake Suigetsu varves chronology. The 29,100-yr Lake Suigetsu chronology then covers the absolute age range from 8830 to 37,930 cal BP.
In other words, the start date of 8830 years for the varve sequence was obtained from the best overall match between the floating varve chronology and an absolute chronology obtained from German oak and German pine tree-rings. It was not obtained by simple counting. This is the reason that the second set of yellow circles in Davidson and Wolgemuth’s Figure 7 (our Fig. 14) starts at 8830 calendar years on the horizontal axis, rather than at zero. In retrospect, this should have been a “tip-off” to Davidson and Wolgemuth (2010) that these varve ages were not obtained by simple counting. How does one “simply” count to 8830, if you have “skipped” the first 8829 integers? Obviously, other assumptions and methodologies must have come into play to obtain this age assignment.
It is also misleading for Davidson and Wolgemuth to state that the Lake Suigetsu varves “continue to about 100,000” (Davidson and Wolgemuth 2010, 9). As noted earlier, the researchers did not count sequences of 100,000 varve laminae (Kitigawa et al. 1995; Kitigawa and van der Plicht 1998, 2000). Rather, the figure of 100,000 was estimated based on observed changes in varve thicknesses (Kitigawa and van der Plicht 1998, 505, 506).
In fact, it’s an exaggeration even to say, as do Davidson and Wolgemuth (2010), that the researchers counted 50,000 varves. The actual number of claimed counted laminations was 29,100, as noted earlier. Because an age of 8830 years was assigned to the first varve, this means that the varve chronology extended to 8830 + 29,100 = 37,930 cal years BP. This is evident from Kitigawa and van der Plicht’s (1998) Fig. 1, where varve ages less than about ~40,000 years BP are indicated by a solid line, while ages greater than this are indicated by a dashed line (Kitigawa and van der Plicht 1998, 507– 508), indicating that those ages were uncertain.
So why do Davidson and Wolgemuth claim that 50,000 years are represented by the Lake Suigetsu chronology? Kitigawa and van der Plicht (1998, 506) did tentatively assign ages greater than ~38,000 years, but this was done by “assuming a constant sedimentation in the Glacial (0.62 mm yr-1).” In other words, these tentative ages did not result from a counting process at all, but rather from the assumption of a constant sedimentation rate.
Davidson and Wolgemuth’s argument assumes that the varve and radiocarbon ages are independent of one another, when a careful reading of the very papers that they cite shows that this is not the case.
Have 50,000 Lake Suigetsu Varves Been Physically Counted?
However, it is not at all certain from the methods employed by the original investigators that even 29,100 varves were visibly counted (Kitigawa and van der Plicht 1998). Yet Marshall et al. (2012) claim to have used “varve counting” to extend the chronology back to at least 50,000 years. So what methods have been used to “count” the varve laminae, and have they really thus counted 50,000 varves?
Schlolaut et al. (2012) describe in detail how the varves in the sediment cores were visually counted using thin section microscopy. The split drilled sediment core was cut into 10 cm (3.9 in) long segments which were freeze dried then impregnated with synthetic resin under vacuum. The blocks were glued to glass slides, and then ground and polished down to ≈20 μm for visual counting of the varves under a petrographic microscope.
But how were the varves identified in order to be visually counted? An idealized varve with its main seasonal layers first had to be determined to then use as a “template” for identifying and thus visually counting the varves. Key components of the idealized varve were a basal layer with specific diatoms containing siderite (FeCO3) overlain by a layer of detrital silt-sized quartz and feldspar grains (spring), overlain by a layer of light amorphous organic material (summer), overlain another layer of specific diatoms either below or within the base of an overlying siderite layer (autumn), and covered by a clay layer (winter) (Schlolaut et al. 2012).
However, Schlolaut et al. (2012, 56) admitted:
Usually not all of the sub-layers formed every year and in a considerable portion of years no seasonal layers formed at all, in which case non-seasonal, mixed layers formed . . . The thickness of the mixed layers ranges from a sub-millimetre scale up to 12 mm and they therefore represent time windows of 1 year to over 120 years (the mean sedimentation rate in the LGIT is less than 1 mm/a).
Siderite layers are the most frequently and consistently occurring type of seasonal layer and often delimit the mixed layers. Hence, counting is mainly based on (the base of) siderite layers . . .
Since mixed layers occur frequently in the Suigetsu sediment, and since these represent time intervals of multiple years without any distinguishable seasonal layers, the microscope count of the LGIT is necessarily incomplete. That is, the number of counted varves is smaller than the number of years that passed during the formation of the studied part of the core. Therefore the count must be complemented by varve interpolation.
So how was such varve interpolation accomplished?
The main prerequisite for interpolation is the knowledge of the mean sedimentation rate (SR) which is the mean sediment accumulation in millimeter per year within a predefined sediment interval” (Schlolaut et al. 2012, 56). But deposition rate of these sediments was never witnessed or directly measured, so the determination of this SR is based on the assumption of deep time, which is then used to assign a deep time scale to these varves! Indeed, Schlolaut et al. (2012, 68) admit that “on average as many as 50% of the varves are indistinguishable”! Thus 50,000 varves were never visually counted, but as many as 50% were interpolated assuming steady sedimentation rate over assumed deep time.
However, that assumed sedimentation rate was punctuated by “event” layers due to “past extreme events, mostly the result of floods or earthquakes” (Schlolaut et al. 2014). Extreme precipitation events produced flood layers due to turbidity flows from surface runoff, landslides or subaqueous slope failures. Indeed, some 362 of the 369 identified “event” layers were interpreted due to flood events, many more than previously identified by Katsuta et al. (2007). While the few most recent “event” layers could be correlated with known historic floods, all the earlier events were simply inferred. Indeed, most “event” layers were not visually identified in the sediment core, but were determined by micro-XRF scanning of the core. Elements such as Si, K, Ca, Ti, Mn, and Fe were used to identify and determine the boundaries not only of “event” layers, but also the claimed varves, based on the expected mineralogical variations such as siderite in the sediments (Katsuta et al. 2007; Marshall et al. 2012; Schlolaut et al. 2014).
Further significant “event” layers identified in the lake sediment cores were visible tephra (volcanic ash) layers, the result of violent volcanic eruptions (Nakagawa et al. 2012; Smith et al. 2011; 2013). Some of these have been correlated with eruptions from known nearby Japanese volcanoes using geochemical and mineralogical analyses. Many of them were also Ar-Ar dated. Furthermore, because these tephras and flood “event” layers often have plant macrofossils buried in them, these were used to 14C date the layers (Bronk Ramsey et al. 2012; Kitagawa et al. 1995; Kitigawa and van der Plicht 1998, 2000; Staff, Bronk Ramsey and Nakagawa 2010; Staff et al. 2011, 2012, 2013). Similarly, 14C had also been used to date the same tephras in other parts of Japan (Miyairi et al. 2004; Nakagawa et al. 2012). Yet it is significant that Kitagawa et al. (1995) show diagrammatically in their Fig. 2 that between correlated tephras in closely adjacent drill-holes there are different numbers of “varve” laminae in each drill-hole, which should not be the case if they are truly annual varves.
It might thus be argued that, because multiple techniques (varve counting, 14C, Ar-Ar) have been used on these Lake Suigetsu sediment cores (Nakagawa et al. 2012; Staff et al. 2012), the claimed 50,000 years’ worth of varves is firmly established. However, we have already demonstrated how as many as 50% of the claimed varves are mixed layers which required the assumed mean sedimentation rate to assign time durations to them. And many of the claimed varves were not visually identified, but like many of the “event” layers were delineated by μXRF scanning analyses of the sediment cores. Then both 14C and Ar-Ar dating were used to establish the dates for various “event” layers and tephras, which were then used to adjust the dates of the “counted” varves and the mean sedimentation rate used to interpolate years into the mixed layers (Marshall et al. 2012; Nakagawa et al. 2012; Schlolaut et al. 2012, 2014; Smith et al. 2013; Staff et al. 2012). But the 14C chronology has been calibrated against tree-ring counts, while the tree-ring chronologies used for that calibration were established using 14C dating to cross-match growth ring patterns from tree to tree. Similarly, the 40K decay constant essential to calculating Ar-Ar dates has itself been adjusted and thus calibrated against the 238U decay constant to bring K-Ar, Ar-Ar, and U-Pb into agreement (Snelling 2016). And here in Japan 14C dating of organic materials in the tephras has been used to corroborate and adjust the Ar-Ar dating of them using the 14C calibration curves based on tree-ring chronologies (Nakagawa et al. 2012; Smith et al. 2013; Staff et al. 2012).
So what is the bottom line? None of these dating methods are truly independent and thus objective. They are inter-calibrated and adjusted to agree because of the assumption they are supposed to agree, due to the assumed uniformity of geologic and physical processes that willfully ignores the evidence for the global Flood cataclysm and its aftermath. The 50,000 annual varves were never visually counted and only represent 50,000 years because they were “dated” as such using crosscalibrated, adjusted-to-agree, dating methods based on assumptions built on the foundation of assumed deep time.
Conclusion
Contrary to the claims of Davidson and Wolgemuth (2010), the Lake Suigetsu and Steel Lake varves do not present an unanswerable challenge to a recent creation. Furthermore, since pulses of dust and volcanic ash can stimulate diatom blooms, the presence of a large number of diatom layers in Lake Suigetsu may actually be a back-handed confirmation of the Creation/Flood Ice Age model. Furthermore, there are two reasons that the apparent correlation between tree-ring and varve counts and “measured” amounts of radiocarbon cannot be used as “proof” that the Lake Suigetsu varves represent annual events. First, the “measured” amounts of radiocarbon do not appear to be measured amounts at all (!), but instead appear to have been incorrectly obtained from a northern hemisphere radiocarbon calibration curve. Second, Davidson and Wolgemuth’s argument hinges on the assumption that tree-ring counts, varve counts, and radiocarbon dates are independent of one another, but a careful reading of the very papers they cite shows that this is not the case.
Furthermore, this should have been clear from a cursory reading of even the popular-level literature. Many popular science articles (for example, Boyle 2012; Spector 2012) have noted that uniformitarian radiocarbon experts are excited about the Lake Suigetsu chronology because they believe that it will help them to calibrate radiocarbon dates. Hence it should have been obvious to Davidson and Wolgemuth, from just the popular literature alone, that radiocarbon dating, even within a uniformitarian framework, is more complicated than one would infer from the rudimentary descriptions found in high school and introductory college physics and chemistry textbooks.
Given the many errors in their 2010 article which is still posted on the BioLogos website, it grieves us that Davidson and Wolgemuth have been using such fallacious arguments for so many years in an attempt to dissuade Christians from believing the straightforward and trustworthy history contained in their Bibles, a history authored by the Creator Himself.
References
Aardsma, G. E. 1991. Radiocarbon and the Genesis Flood. El Cajon, California: Institute for Creation Research.
Austin, S. A. 1998. “The Declining Power of Post-Flood Volcanoes.” Acts & Facts 27 (8). El Cajon, California: Institute for Creation Research.
Baillie, M. G. L. 2015. Tree-Ring Dating and Archaeology. London and New York: Routledge Taylor & Francis Group.
Baumgardner, J. R. 1990. “3-D Finite Element Simulation of the Global Tectonic Changes Accompanying Noah’s Flood.” In Proceedings of the Second International Conference on Creationism. Vol. 2. Edited by R. E. Walsh and C. L. Brooks, 35–45. Pittsburgh, Pennsylvania: Creation Science Fellowship.
Baumgardner, J. R. 1994a. “Computer Modeling of the Large Scale Tectonics Associated with the Genesis Flood.” In Proceedings of the Third International Conference on Creationism. Edited by R. E. Walsh, 49–62. Pittsburgh, Pennsylvania: Creation Science Fellowship.
Baumgardner, J. R. 1994b. “Runaway subduction as the driving mechanism for the Genesis Flood.” In Proceedings of the Third International Conference on Creationism. Edited by R. E. Walsh, 63–75. Pittsburgh, Pennsylvania: Creation Science Fellowship.
Baumgardner, J. R. 2003. “Catastrophic Plate Tectonics: The Physics Behind the Genesis Flood.” In Proceedings of the Fifth International Conference on Creationism. Edited by R. L. Ivey, Jr., 113–126. Pittsburgh, Pennsylvania: Creation Science Fellowship.
Baumgardner, J. R. 2005. “14C Evidence for a Recent Global Flood and a Young Earth.” In Radioisotopes and the Age of the Earth: Results of a Young-Earth Research Initiative. Vol. 2. Edited by L. Vardiman, A. A. Snelling, and E. F. Chaffin, 587–630. El Cajon, California: Institute for Creation Research; Chino Valley, Arizona: Creation Research Society.
Baumgardner, J. R. 2007, 2015. “Are the RATE Radiocarbon (14C) Results Caused by Contamination?” https://answersingenesis.org/
Baumgardner, J. R., A. A. Snelling, D. R. Humphreys, and S. A. Austin. 2003. “Measurable 14C in Fossilized Organic Materials: Confirming the Young Earth Creation-Flood Model.” In Proceedings of the Fifth International Conference on Creationism. Edited by R. L. Ivey, Jr., 127–142. Pittsburgh, Pennsylvania: Creation Science Fellowship.
Benson, H. 1991. University Physics. New York: John Wiley & Sons, Inc.
Berthault, G. 1986. “Experiments on Lamination of Sediments, Resulting from a Periodic Graded-Bedding Subsequent to Deposition—A Contribution to the Explanation of Lamination of Various Sediments and Sedimentary Rocks.” Compte Rendus Acadèmie des Sciences, Paris 303. Sèrie II (17): 1569–1574.
Berthault, G. 1988a. “Sedimentation of a Heterogranular Mixture: Experimental Lamination in Still and Running Water.” Compte Rendus Acadèmie des Sciences, Paris 306. Sèrie II: 717–724.
Berthault, G. 1988b. “Experiments on Lamination of Sediments.” Ex Nihilo Technical Journal 3 (1): 25–29.
Berthault, G. 1990. “Sedimentation of a Heterogranular Mixture: Experimental Lamination in Still and Running Water.” Ex Nihilo Technical Journal 4: 95–102.
Bertsche, K. 2008. “RATE’s Radiocarbon: Intrinsic or Contamination?” Talk Origins Archive. http://www.talkorigins.org/
Bintanja, R., R. S. W. van de Wal, and J. Oerlemans. 2005. “Modelled Atmospheric Temperatures and Global Sea Levels Over the Past Million Years.” Nature 437 (7055): 125–128.
Boyle, R. 2012. “This Mud Could Revolutionize How Scientists Study the Past.” Popular Science Online. http://www.popsci.com/
Bradley, R. S. 1988. “The Explosive Volcanic Eruption Signal in Northern Hemisphere Continental Temperature Records.” Climatic Change 12 (3): 221–243.
Bradley, W. H. 1929a. “Varves and the Duration of Eocene Epoch.” Geological Society of America Bulletin 40 (1): 133.
Bradley, W. H. 1929b. “The Varves and Climate of the Green River Epoch.” U.S. Geological Survey Professional Paper 158: 87–110.
Bronk Ramsey, C., R. A. Staff, C. L. Bryant, F. Brock, H. Kitagawa, J. van der Plicht, G. Schlolaut, et al. 2012. A Complete Terrestrial Radiocarbon Record for 11.2 to 52.8 kyr B.P.” Science 338 (6105): 370–374.
Buchheim, H. P., and R. Biaggi. 1988. “Laminae Counts Within a Synchronous Oil Shale Unit: A Challenge to the ‘Varve’ Concept.” Geological Society of America Annual Meeting Abstracts with Programs 20: A317.
Buck, C. E., and P. G. Blackwell. 2004. “Formal Statistical Models for Estimating Radiocarbon Calibration Curves.” Radiocarbon 46 (3): 1093–1102.
Cardone, F., R. Mignani, and A. Petrucci. 2009. “Piezonuclear Decay of Thorium.” Physics Letters A 373 (22): 1956–1958.
Cuffey, K. M., G. D. Clow, R. B. Alley, M. Stuiver, E. D. Waddington, and R. W. Saltus. 1995. “Large Arctic Temperature Change at the Wisconsin-Holocene Glacial Transition.” Science 270 (5235): 455–458.
Damon, P. E., and A. N. Peristykh. 2000. “Radiocarbon Calibration and Application to Geophysics, Solar Physics, and Astrophysics.” Radiocarbon 42 (1): 137–150.
Davidson, G., and K. Wolgemuth. 2010. Christian Geologists on Noah’s Flood: Biblical and Scientific Shortcomings of Flood Geology. Grand Rapids, Michigan: BioLogos Foundation.
Davidson, G., and K. Wolgemuth. 2012. “How Old is the Earth? What God’s Creation Professes.” Christian Research Journal 35 (1): 54–57.
Dickin, A. P. 2005. Radiogenic Isotope Geology. 2nd ed. Cambridge, United Kingdom: Cambridge University Press.
Faure, G., and T. M. Mensing. 2005. Isotopes: Principles and Applications. 3rd ed. Hoboken, New Jersey: John Wiley & Sons, Inc.
Ferguson, C. W. 1970. “Dendrochronology of the Bristlecone Pine, Pinus aristata: Establishment of a 7484-year Chronology in the White Mountains of Eastern-Central California, USA.” In Radiocarbon Variations and Absolute Chronology, Proceedings of the 12th Nobel Symposium. Edited by I. U. Olsson, 571–593. New York: Wiley.
Fisher, D. C., E. A. Shirley, C. D. Whalen, Z. T. Calamari, A. N. Rountrey, A. N. Tikhonov, B. Buigues, F. Lacombat, S. Grigoriev, and P. A. Lazarev. 2014. “X-Ray Computed Tomography of Two Mammoth Calf Mummies.” Journal of Paleontology 88 (4): 664–675.
Frumkin, A., E. Shimron, and J. Rosenbaum. 2003. “Radiometric Dating of the Siloam Tunnel, Jerusalem.” Nature 425 (6954): 169–171.
Fukusawa, H. 1999. “Varved Lacustrine Sediments in Japan: Recent Progress.” The Quaternary Research (Daiyonki-Kenkyu) 38(3): 237–243. (English translation)
Gasse, F. 1994. “Lacustrine Diatoms for Reconstructing Past Hydrology and Climate.” In Long-Term Climate Variations. Vol. 22. Edited by J.-C. Duplessy and M.-T. Spyridakis, 335–369. Berlin, Germany: Springer-Verlag.
Giem, P. 2001. “Carbon-14 Content of Fossil Carbon.” Origins (GRI) 51: 6–30.
Glock, W. S., R. A. Studhalter, and S. R. Agerter. 1960. “Classification and Multiplicity of Growth Patterns in the Branches of Trees.” Smithsonian Miscellaneous Collections 140 (1): 1–292.
Grande, L. 1984. Paleontology of the Green River Formation with a Review of the Fish Fauna. Bulletin 63. 2nd ed. Laramie, Wyoming: Geological Survey of Wyoming.
Graven, H. D. 2015. “Impact of Fossil Fuel Emissions on Atmospheric Radiocarbon and Various Applications of Radiocarbon Over This Century.” Proceedings of the National Academy of Sciences 112 (31): 9542–9545.
Humphreys, D. R. 2005. “Young Helium Diffusion Age of Zircons Supports Accelerated Nuclear Decay.” In Radioisotopes and the Age of the Earth: Results of a Young-Earth Research Initiative. Vol. 2. Edited by L. Vardiman, A. A. Snelling, and E. F. Chaffin, 25–100. El Cajon, California: Institute for Creation Research; Chino Valley, Arizona: Creation Research Society.
Katsuta, N., M. Takano, S. Kawakami, S. Togami, H. Fukusawa, M. Kumazawa, and Y. Yasuda. 2007. “Advanced Micro-XRF Method to Separate Sedimentary Rhythms and Event Layers in Sediments: Its Application to Lacustrine Sediment from Lake Suigetsu, Japan.” Journal of Paleolimnology 37 (2): 259–271.
Kitigawa, H., H. Fukuzawa, T. Nakamura, M. Okamura, K. Takemura, A. Hayashida, and Y. Yasuda. 1995. “AMS 14C Dating of Varved Sediments from Lake Suigetsu, Central Japan and Atmospheric 14C Change During the Late Pleistocene.” In Proceedings of the 15th International 14C Conference. Edited by G. T. Cook, D. D. Harkness, B. F. Miller, and E. M. Scott. Radiocarbon 37 (2): 371–378.
Kitigawa, H., and J. van der Plicht. 1998. “A 40,000-Year Varve Chronology from Lake Suigetsu, Japan: Extension of the 14C Calibration Curve.” In Proceedings of the 16th International 14C Conference. Edited by W. G. Mook and J. van der Plicht. Radiocarbon 40 (1): 505–515.
Kitigawa, H., and J. van der Plicht. 2000. “Atmospheric Radiocarbon Calibration Beyond 11,900 Cal BP from Lake Suigetsu Laminated Sediments.” Radiocarbon 42 (3): 370–381.
Kromer, B., J. Ambers, M. G. L. Baillie, P. E. Damon, V. Hesshaimer, J. Hofmann, O. Joris, et al. 1996. “Report: Summary of the workshop ‘Aspects of High-Precision Radiocarbon Calibration’.” Radiocarbon 38 (3): 607–610.
Kromer, B., and B. Becker. 1993. “German Oak and Pine 14C Calibration, 7200–9349 BC.” In Calibration 1993. Edited by M. Stuiver, A. Long, and R. S. Kra. Radiocarbon 35 (1): 125–135.
Lambert, A., and K. Hsü. 1979. “Non-Annual Cycles of Varve-Like Sedimentation in Walensee, Switzerland.” Sedimentology 26 (3): 453–461.
Lazar, O. R., K. M. Bohacs, J. H. S. MacQuaker, J. Schieber, and T. M. Demko. 2015. “Capturing Key Attributes of Fine-Grained Sedimentary Rocks in Outcrops, Cores, and Thin Sections: Nomenclature and Description Guidelines.” Journal of Sedimentary Research 85 (3): 230–246.
Libby, W. F. 1955. Radiocarbon Dating. 2nd ed. Chicago, Illinois: University of Chicago Press.
Lutgens, F. K., and E. J. Tarbuck. 2010. The Atmosphere: An Introduction to Meteorology. 11th ed. New York: Prentice Hall.
Makse, H. A., S. Havlin, P. R. King, and H. E. Stanley. 1997. “Spontaneous Stratification in Granular Mixtures.” Nature 386 (6623): 379–382.
Marshall, M., G. Schlolaut, T. Nakagawa, H. Lamb, A. Brauer, R. Staff, C. Bronk Ramsey, et al. 2012. “A Novel Approach to Varve Counting Using μXRF and X-Radiography in Combination with Thin-Section Microscopy, Applied to the Late Glacial Chronology from Lake Suigetsu, Japan.” Quaternary Geochronology 13: 70–80.
Mirov, N. T. 1967. The Genus Pinus. New York: Ronald Press Co.
Miyairi, Y., K. Yoshida, Y. Miyazaki, H. Matsuzaki, and I, Kaneoka. 2004. “Improved 14C Dating of a Tephra Layer (AT Tephra, Japan) Using AMS on Selected Organic Fractions.” Nuclear Instruments and Methods in Physics Research B (223–224): 555–559.
Morris, J., and S. A. Austin. 2009. Footprints in the Ash: The Explosive Story of Mt. St. Helens. 3rd printing. Green Forest, Arkansas: Master Books.
Morton, G. R. 2003. “Why Radiocarbon Dating Works – Lake Suigetsu.” http://barryhisblog.blogspot.com/
Mueller, T. 2009. “Ice Baby.” National Geographic 215 (5): 30–55. http://ngm.nationalgeographic.com/
Nakagawa, T., K. Gotanda, T. Haraguchi, T. Danhara, H. Yonenobu, A. Brauer, U. Yokoyama, et al. 2012. “SG06, A Fully Continuous and Varved Sediment Core from Lake Suigetsu, Japan: Stratigraphy and Potential for Improving the Radiocarbon Calibration Model and Understanding of Late Quaternary Climate Changes.” Quaternary Science Reviews 36: 164–176.
Neuendorf, K. K. E., J. P. Mehl Jr., and J. A. Jackson. 2005. Glossary of Geology. 5th ed. Alexandria, Virginia: American Geological Institute.
Oard, M. J. 1990. An Ice Age Caused by the Genesis Flood. El Cajon, California: Institute for Creation Research.
Oard, M. J. 2000. “The Extinction of the Woolly Mammoth: Was It a Quick Freeze?” Creation Ex Nihilo Technical Journal 14 (3): 24–34.
Oard, M. J. 2006. Frozen in Time: Woolly Mammoths, the Ice Age, and he Biblical Key to Their Secrets. 2nd printing. Green Forest, Arkansas: Master Books.
Oard, M. J. 2005. The Frozen Record: Examining the Ice Core History of the Greenland and Antarctic Ice Sheets. El Cajon, California: Institute for Creation Research.
Oard, M. J. 2009. “Do Varves Contradict Biblical History?” In Rock Solid Answers: The Biblical Truth Behind 14 Geological Questions. Edited by M. J. Oard and J. K. Reed, 125–148. Green Forest, Arkansas: Master Books.
Oard, M. J., and J. H. Whitmore. 2006. “The Green River Formation of the West-Central United States: Flood or Post-Flood?” Journal of Creation 20 (1): 46–49.
Oard, M. J., and P. Klevberg. 2008. “Green River Formation Very Likely Did Not Form in a Postdiluvial Lake.” Answers Research Journal 1: 99–108.
Paterson, W. S. B. 1991. “Why Ice-Age Ice is Sometimes ‘Soft’”. Cold Regions Science and Technology 20 (1): 75–98.
Reimer, P. J. 2012. “Refining the Radiocarbon Time Scale.” Science 338 (6105): 337–338.
Reimer, P. J., M. G. L. Baillie, E. Bard, A. Bayliss, J. W. Beck, C. J. H. Bertrand, P. G. Blackwell, et al. 2004. “INTCAL04 Terrestrial Radiocarbon Age Calibration, 0–26 Cal Kyr BP.” Radiocarbon 46 (3): 1029–1058.
Ruth, U., D. Wagenbach, J. P. Steffensen, and M. Bigler. 2003. “Continuous Record of Microparticle Concentration and Size Distribution in the Central Greenland NGRIP Ice Core During the Last Glacial Period.” Journal of Geophysical Research: Atmospheres 108 (D3): 4098. doi:10.1029/2002JD002376.
Schieber, J., J. Southard, and K. Thaisen. 2007. “Accretion of Mudstone Beds from Migrating Floccule Ripples.” Science 318 (5857): 1760–1763.
Schieber, J., and Z. Yawar. 2009. “A New Twist on Mud Deposition—Mud Ripples in Experiment and Rock Record.” The Sedimentary Record 7 (2): 4–8.
Schlolaut, G., M.H. Marshall, A. Brauer, T. Nakagawa, H.F. Lamb, R.A. Staff, C. Bronk Ramsey, et al. 2012. “An Automated Method for Varve Interpolation and Its Application to the Late Glacial Chronology from Lake Suigetsu, Japan.” Quaternary Geochronology 13: 52–69.
Schlolaut, G., A. Brauer, M. H. Marshall, T. Nakagawa, R. A. Staff, C. Bronk Ramsey, H. F. Lamb, et al. 2014. “Event Layers in the Japanese Lake Suigetsu ‘SG06’ Sediment Core: Description, Interpretation and Climatic Implications.” Quaternary Science Reviews 83: 157–170.
Smith, V. C., D. F. Mark, R. A. Staff, S. P. E. Blockley, C. Bronk Ramsey, C. L. Bryant, T. Nakagawa, et al. 2011. “Toward Establishing Precise 40Ar/39Ar Chronologies for Late Pleistocene Paleoclimate Archives: An Example From the Lake Suigetsu (Japan) Sedimentary Record.” Quaternary Science Reviews 30 (21): 2845–2850.
Smith, V. C., R. A. Staff, S. P. E. Blockley, C. Bronk Ramsey, T. Nakagawa, D. F. Mark, K. Takemura, and T. Danhara. 2013. “Identification and Correlation of Visible Tephras in the Lake Suigetsu SG06 Sedimentary Archive, Japan: Chronostratigraphic Markers for Synchronising of East Asian/West Pacific Palaeoclimatic Records Across the Last 150 ka.” Quaternary Science Reviews 67: 121–137.
Snelling, A. A. 1997. “Sedimentation Experiments: Nature Finally Catches Up!” Creation Ex Nihilo Technical Journal 11 (2): 125–126.
Snelling, A. A. 2000. “Conflicting ‘Ages’ of Tertiary Basalt and Contained Fossilized Wood, Crinum, Central Queensland, Australia.” Creation Ex Nihilo Technical Journal 14 (2): 99–122.
Snelling, A. A. 2005. “Radiohalos in Granites: Evidence for Accelerated Nuclear Decay.” In Radioisotopes and the Age of the Earth: Results of a Young-Earth Research Initiative.Vol. 2. Edited by L. Vardiman, A. A. Snelling, and E. F. Chaffin, 101–207. El Cajon, California: Institute for Creation Research; Chino Valley, Arizona: Creation Research Society.
Snelling, A. A. 2008. “Radiocarbon Ages for Fossil Ammonites and Wood in Cretaceous Strata near Redding, California.” Answers Research Journal 1: 123–144.
Snelling, A. A. 2016. “Determination of the Radioisotope Decay Constants and Half-lives: Potassium-40 (40K).” Answers Research Journal 9: 171–196.
Spector, D. 2012. “The Most Important Records for Dating Old Objects Were Just Found in a Japanese Lake.” Business Insider. http://www.businessinsider.com/
Speer, J. H. 2010. Fundamentals of Tree-Ring Research. Tucson, Arizona: University of Arizona Press.
Staff, R. A., C. Bronk Ramsey, and T. Nakagawa. 2010. “A Re-Analysis of the Lake Suigetsu Terrestrial Radiocarbon Calibration Dataset.” Nuclear Instruments and Methods in Physics Research B 268 (7–8): 960–965.
Staff, R. A., C. Bronk Ramsey, C. L. Bryant, F. Brock, R. L. Payne, G. Schlolaut, M. H. Marshall, et al. 2011. “New 14C Determinations from Lake Suigetsu, Japan: 12,000 to 0 Cal BP.” Radiocarbon 53 (3): 511–528.
Staff, R. A., T. Nakagawa, G. Schlolaut, M. H. Marshall, A. Brauer, H. F. Lamb, C. Bronk Ramsey, et al. 2012. “The Multiple Chronological Techniques Applied to the Lake Suigetsu SG06 Sediment Core, Central Japan.” Boreas 42 (2): 259–266.
Staff, R. A., G. Schlolaut, C. Bronk Ramsey, F. Brock, C. L. Bryant, H. Kitagawa, J. van der Plicht, et al. 2013. “Integration of the Old and New Lake Suigetsu (Japan) Terrestrial Radiocarbon Calibration Data Sets.” Radiocarbon 55 (4): 2049–2058.
Stuiver, M., P. J. Reimer, and R. Reimer. 2016. CALIB Manual, chapter 1. https://web.archive.org/web/20161224051948/http://calib.qub.ac.uk/calib/manual/chapter1.html.
Stuiver, M., P. J. Reimer, E. Bard, J. W. Beck, G. S. Burr, K. A. Hughen, B. Kromer, G. McCormac, J. van der Plicht, and M. Spurk. 1998. “INTCAL98 Radiocarbon Age Calibration, 24,000 – 0 cal BP.” Radiocarbon 40 (3): 1041–1083.
Suess, H. E. 1970. “Bristlecone-Pine Calibration of the Radiocarbon Time-Scale 5200 BC to the Present.” In Radiocarbon Variations and Absolute Chronology, Proceedings of the 12th Nobel Symposium. Edited by I. U. Olsson, 303–311. New York: Wiley.
Svennson, A., P. E. Biscaye, and F. E. Grousset. 2000. “Characterization of the Late Glacial Continental Dust in the Greenland Ice Core Project Ice Core.” Journal of Geophysical Research 105 (D4): 4637–4656.
Taylor, R. E., and J. Southon. 2007. “Use of Natural Diamonds to Monitor 14C AMS Instrument Backgrounds.” Nuclear Instruments and Methods in Physics Research B 259 (1): 282–287.
Thomas, B., and V. Nelson. 2015. “Radiocarbon in Dinosaur and Other Fossils.” Creation Research Society Quarterly 51 (4): 299–311.
Tian, J., T. A. Brown, and F. S. Hu. 2005. “Comparison of Varve and 14C Chronologies from Steel Lake, Minnesota, USA.” The Holocene 14 (4): 510–517.
Vardiman, L. 2003. “Hypercanes Following the Genesis Flood.” In Proceedings of the Fifth International Conference on Creationism. Edited by R. L. Ivey Jr., 17–28. Pittsburgh, Pennsylvania: Creation Science Fellowship.
Vardiman, L., A. A. Snelling, and E. F. Chaffin, eds. 2000. Radioisotopes and the Age of the Earth: A Young-Earth Creationist Research Initiative. El Cajon, California: Institute for Creation Research; St. Joseph, Missouri: Creation Research Society.
Vardiman, L., A. A. Snelling, and E. F. Chaffin, eds. 2005. Radioisotopes and the Age of the Earth: Results of a Young-Earth Creationist Research Initiative. El Cajon, California: Institute for Creation Research; Chino Valley, Arizona: Creation Research Society.
Vardiman, L., and W. Brewer. 2011. “A Well-Watered Land: Numerical Simulations of a Hypercyclone in the Middle East.” Answers Research Journal 4: 55–74.
Wallace, A. R., D. G. Frank, and A. Founie. 2006. “Freshwater Diatomite Deposits in the Western United States.” United States Geological Survey Fact Sheet 2006-3044. Edited by J. W. Hendley II.
Whitelaw, R. L. 1970. “Time, Life, and History in the Light of 15,000 Radiocarbon Dates.” Creation Research Society Quarterly 7 (1): 56–71.
Whitmore, J. H., and P. Garner. 2008. “Using Suites of Criteria to Recognize Pre-Flood, Flood, and Post-Flood Strata in the Rock Record with Application to Wyoming (USA).” In Proceedings of the Sixth International Conference of Creationism. Edited by A. A. Snelling, 425–448. Pittsburgh, Pennsylvania: Creation Science Fellowship, and Dallas, Texas: Institute for Creation Research.
Whitmore, J. H. 2009. “Fossil Preservation” In Rock Solid Answers: The Biblical Truth Behind 14 Geological Questions. Edited by M. J. Oard and J. K. Reed, 231–244. Green Forest, Arkansas: Master Books.
Yamaguchi, D. K. 1986. “Interpretation of Cross-Correlation Between Tree-Ring Series.” Tree-Ring Bulletin 46: 47–54.
Yanjun, C., W. Beck, P. Zicheng, and Z. Zhaofeng. 2005. “Effect of Dead Carbon on the 14C Dating of the Speleothem.” Chinese Science Bulletin 50 (8): 817–821.
