The views expressed in this paper are those of the writer(s) and are not necessarily those of the ARJ Editor or Answers in Genesis.
Abstract
Analyses and numerical simulations were conducted on three recent nor’easters which formed on the East Coast of the United States to explore the effects of warmer-than-normal sea-surface temperatures on their wind and precipitation fields. The purpose of the study was to determine how warmer sea-surface temperatures in the Atlantic Ocean following the Genesis Flood would have enhanced nor’easters. Wind and precipitation fields for the actual storms were compared with simulated storms using the NCAR WRF model to insure that the model was accurately replicating the storms. The sea-surface was then increased by about 10°C (18°F) and the models rerun for the three storms. The wind fields and precipitation patterns were compared to the simulated actual storms to find how much the storms had been enhanced and the precipitation footprint changed. The WRF model accurately replicated the actual storms and the warmer sea-surface temperatures dramatically increased the wind speeds and precipitation. The enhanced storms moved more quickly off the Eastern seaboard than the actual storms and formed a larger and heavier snow shield over the northeastern United States and southeastern Canada. The additional accumulation of snow from the larger snow shields likely contributed to the Laurentide Ice Sheet following the Genesis Flood.
Keywords: Nor’easter, blizzard, snowstorm, numerical simulation, Weather Research and Forecasting Model, WRF, NCAR, March 16–18, 2007 St. Patrick’s Day Storm, April 14–17, 2007, nor’easter, February 5–6, 2010, North American blizzard, Snowmaggedon, ice age, Genesis Flood.
Introduction
A nor’easter is a type of synoptic-scale storm which occurs along the east coast of the United States and the Atlantic coast of Canada. It is so named because the storm travels toward the northeast along the coast and the winds spiral around the storm from the northeast in coastal areas. The storm has characteristics very similar to a hurricane. It often features a low pressure area whose center of rotation is just off the east coast and whose leading winds in the left forward quadrant rotate onto land. Fig. 1 shows a satellite image of the intense nor’easter responsible for the North American blizzard of 2006. The precipitation pattern is similar to that of other extratropical storms. Nor’easters can cause severe coastal flooding, coastal erosion, hurricane force winds, and heavy snow or rain. Nor’easters occur at any time of the year but mostly in the winter season (Kocin and Uccellini 1990). A few of the more notable nor’easters are:
- The Great Blizzard of 1888—One of the worst blizzards in U.S. History.
- The Perfect Storm of 1993—A very unusual storm which evolved into a hurricane, caused severe damage to coastal areas, especially Massachusetts, and killed 13 people.
- The Storm of the Century of 1993—A superstorm which affected the entire eastern U.S., and parts of Canada and Cuba. It caused $6.65 billion in damage and killed 310 people.
- The North American Blizzard of 1996—A severe snowstorm which brought up to 120 cm (4 ft.) of snow to areas of the mid-Atlantic and northeastern U.S., and killed a total of 154 people.
- The North American Blizzard of 2003—Dropped over 60 cm (2 ft.) of snow in several major cities, including Boston and New York City, affected large areas of the Northeastern U.S., and killed a total of 27 people.
- The December 2010 North American Blizzard—A major blizzard which affected large metropolitan areas including Philadelphia, New York City, Providence, and Boston. In some areas, the storm brought up to 60 cm (2 ft.) of snow.
- The 2011 Halloween Nor’Easter—A rare, historic nor’easter, which produced record breaking snowfall for October in many areas of Northeastern U.S., especially New England. The storm produced a maximum of 80 cm (32 in.) of snow in Massachusetts and killed 31 people.

Fig. 1. Visible satellite image of the February 11–13, 2006, nor’easter featuring a hurricane-like “eye” (NASA).
Nor’easters frequently produce blizzard conditions. A blizzard is a severe snowstorm characterized by strong winds. By definition, the difference between a blizzard and a snowstorm is the strength of the wind. To be a blizzard, a snowstorm must have winds in excess of 56 kph (35 mph) with blowing or drifting snow which reduces visibility to 400 m (¼ mi.) or less and must last for a prolonged period of time—typically three hours or more. Blizzards can bring near-whiteout conditions, and can paralyze regions for days at a time, particularly where snowfall is rare. The 1972 Iran blizzard, which caused approximately 4,000 deaths, was the deadliest in recorded history. Nor’easters can be devastating, especially in the winter months, when most damage and deaths are cold-related. The storms are known for bringing extremely cold air southward from the Arctic air mass. They thrive on the temperature contrast between converging polar air masses and warm ocean water off the North American coast.
Oard (1990) and Austin et al. (1994) have argued that heat released from catastrophic processes of the Genesis Flood would have heated the oceans. Ocean drilling of sediments has found that the oceans were at least 20°C (36°F) hotter in the past than today (Kennett et al. 1975; Shackleton and Kennett 1975). Also, Heezen and Tharp (1977) published images of the ocean floor obtained in the 1960s which show mid-ocean ridges and undersea volcanoes that released large quantities of heat during past earth upheavals. Higher sea-surface temperatures would have evaporated larger quantities of water vapor from the oceans, energized mid-latitude storms and hurricanes, and precipitated large quantities of rain and snow on the continents. Previous numerical simulation studies by Vardiman and Brewer (2010a, 2010b, 2010c, 2011, 2012) have verified many of these predictions.
It is hypothesized in this study that warmer than normal oceans would have energized nor’easters; generated larger, more intense circulations; and produced heavier precipitation farther inland over large regions of the northeastern United States and southeastern Canada for several hundred years following the Genesis Flood. The greater frequency and more intense nor’easters which probably developed during the ice age would have likely contributed significant quantities of snow to the Laurentide ice sheet in eastern Canada and the United States. This study analyzed the wind and precipitation fields for three simulated nor’easters to determine how much a warmer Atlantic Ocean would have enhanced nor’easters. The three storms were different meteorologically and reasonably well typified the nor’easters that commonly occur on the east coast of the United States. The first storm was driven by a deep, open wave that crossed the upper United States from northwest to the southeast. The second occurred during passage of a series of deep, closed circulations that crossed the United States mid-way between the Canadian and Mexican borders from west to east. The third was a shallow wave that traveled along the United States/Mexican border and turned northeast as it crossed the East Coast into the Atlantic Ocean. Comparisons were made between the three actual nor’easters and the simulated storms to ensure that the numerical model was faithfully replicating them. The sea-surface temperatures in the Atlantic were then artificially warmed by about 10°C (18°F) and the storms analyzed for any changes.
Numerical Methods
Vardiman (2008) proposed simulating the ice age in Yosemite National Park using the NCAR Mesoscale Meteorology Model (MM5) (NCAR 2003). Vardiman and Brewer (2010a) ended up using the Weather Research and Forecasting Model (WRF) (NCAR 2007) for the Yosemite project rather than the older MM5 model because it had more capabilities and was actively supported by the National Center for Atmospheric Research (NCAR). The MM5 model was described in detail in Vardiman (2008) and is very similar to the WRF model used in the current Nor’easter project. The main features of the WRF model used in this study were:
- Equations: Fully compressible, Euler non-hydrostatic with a run-time hydrostatic option available. Conservative for scalar variables.
- Prognostic Variables: Velocity components u and v in Cartesian coordinate, vertical velocity w, perturbation potential temperature, perturbation geopotential, and perturbation surface pressure of dry air. Optionally, turbulent kinetic energy and any number of scalars such as water vapor mixing ratio, rain/snow mixing ratio, cloud water/ice mixing ratio, and chemical species and tracers.
- Vertical Coordinate: Terrain-following, dry hydrostatic-pressure, with vertical grid stretching permitted. Top of the model is a constant pressure surface.
- Horizontal Grid: Arakawa C-grid staggering.
- Time Integration: Time-split integration using a 2nd- or 3rd-order Runge-Kutta scheme with smaller time steps for acoustic and gravity-wave modes. Variable time step capability.
- Spatial Discretization: 2nd- to 6th-order advection options in the horizontal and vertical.
- Turbulent Mixing and Model Filters: Sub-grid scale turbulence formulation in both coordinate and physical space. Divergence damping, external-mode filtering, vertically implicit acoustic step off-centering. Explicit filter option.
- Initial Conditions: Three dimensional for real-data, and one-, two- and three-dimensional for idealized data. Digital filtering initialization (DFI) capability available (real-data cases).
- Lateral Boundary Conditions: Periodic, open, symmetric, and specified options available.
- Top Boundary Conditions: Gravity wave absorbing (diffusion, Rayleigh damping, or implicit Rayleigh damping for vertical velocity). Constant pressure level at top boundary along a material surface. Rigid lid option.
- Bottom Boundary Conditions: Physical or free-slip.
- Earth’s Rotation: Full Coriolis terms included.
- Mapping to Sphere: Four map projections are supported for real-data simulation: polar stereographic, Lambert conformal, Mercator, and latitude-longitude (allowing rotated pole). Curvature terms included.
- Nesting: One-way interactive, two-way interactive, and moving nests. Multiple levels and integer ratios.
- Nudging: Grid (analysis) and observation nudging capabilities available.
- Global Grid: Global simulation capability using a polar Fourier filter and periodic east-west conditions.
WRF was installed on the EPIPHANY 44-node parallel processor at the Institute for Creation Research offices in Dallas, Texas, in the fall of 2008. Wes Brewer developed the support software for inputting and storing the data needed for conducting simulations in the southeastern United States. Topographic and meteorological data for the three nor’easters were imported into the model. The meteorological data used in this study were downloaded from the Research Data Archive (RDA) which is maintained by the Computational and Information Systems Laboratory (CISL) at the National Center for Atmospheric Research (NCAR). The original data were available from the RDA (http://dss.ucar.edu) in dataset number ds083.2. Prognostic data were exported and displayed on vis5d a free graphic package available on the internet.
Fig. 2 shows the largest spatial domain established for simulations of the nor’easter cases, all centered on Washington DC. Three domains were used to compute fields over progressively larger areas with coarser resolutions, but only the largest domain was used in this analysis because of the large size of the nor’easters. The smallest domain had dimensions of 630 km (391 mi.) east/west and of 480 km (298 mi.) north/south and a 3 km (1.86 mi.) grid spacing. The medium domain was three times larger than the smallest domain with dimensions of 1,890 km (1,174 mi.) east/west and 1,440 km (894 mi.) north/south and a grid spacing of 9 km (5.6 mi.). The largest domain was nine times larger than the smallest domain with dimensions of 5,600 km (3,478 mi.) east/west and 4,320 km (2,683 mi.) north/south and a grid spacing of 27 km (16.8 mi.).

Fig. 2. The largest of three spatial domains used for the simulation of the nor’easters. The domains were centered on Washington DC at 38° 50’ N 77° W. The green area is low elevation, and the brown and white areas are high elevations.
March 16–18, 2007
Nor’easter (St. Patrick’s Day Storm)
A complex snowstorm struck the eastern United States on March 16–18, 2007. This storm came on the heels of a brief warm spell and rain event which had produced flooding from Pennsylvania northward into New England. Flooding began on the 15th and was ongoing in many locations as the snow began.
Snowfall totals for the storm ranged from a few inches in Ohio, Maryland, and along the east coast to about 60 cm (2 ft.) in east-central New York State. Snowfall was also heavy from central Pennsylvania eastward into New Jersey. There were reports of as much as 45 cm (18 in.) of snow in isolated parts of central Pennsylvania. Snowfall was less in New England and along the coast. The coastal plain saw periods of freezing rain and ice pellets with limited snowfall over Long Island and southeastern New England. The areal extent of the snowfall and amount rank this as a major snowstorm and likely the second largest snowstorm of the winter of 2006–2007. The Valentine’s Day storm of February 13–14, 2007, affected a larger area and produced upwards of 90 cm (3 ft.) of snowfall in New York State.
Figs. 3–8 show an infrared satellite image, the 300 mb chart (~30,000 ft above sea level), the 500 mb chart (~20,000 ft above sea level), the 850 mb chart (~5,000 ft above sea level), the surface chart, and the 24-hour accumulated precipitation chart, at 1200 UTC (0700 EST) on Saturday, March 17, 2007, over the continental United States. The St. Patrick’s Day storm was driven by a high-speed jet core in the upper troposphere and a shortwave trough shown in the 300 mb chart which traveled across the United States from west to east. The trough deepened as it approached the east coast and then lifted northward as it moved into the Atlantic. The satellite image shows the nor’easter extending along the east coast from near Florida to Maine. A cold front lay across the southeastern United States from Alabama to the Carolinas. A low pressure center developed off the coast of North Carolina and moved northward toward New York City. Surface winds between 5 and 10 m/s (10–20 kts) spiraled counterclockwise around the low-pressure center as it moved northeastward along the east coast producing a cloud band and precipitation shield. Radar reflectivities of 40 dBz (indications of moderate to heavy precipitation) were common along the entire east coast and several hundred kilometers inland. Accumulated 24-hour precipitation (water equivalent) exceeded 1.25 cm (0.5 in.) over the eastern United States and 2.5 cm (1 in.) over the Appalachians on March 16. On March 17 the accumulated 24-hour precipitation exceeded 5 cm (2 in.) along a major portion of the mid-Atlantic Coast. Most of the precipitation was in the form of snow in the mid-Atlantic and northeastern states.

Fig. 3. Infrared satellite image at 1200 UTC (0700 EST) on Saturday, March 17, 2007 (NASA).

Fig. 4. 300 mb chart at 1200 UTC (0700 EST) on Saturday, March 17, 2007 (NOAA).

Fig. 5. 500 mb chart at 1200 UTC (0700 EST) on Saturday, March 17, 2007 (NOAA).

Fig. 6. 850 mb chart at 1200 UTC (0700 EST) on Saturday, March 17, 2007 (NOAA).

Fig. 7. Surface chart at 1200 UTC (0700 EST) on Saturday, March 17, 2007 (Unisys a).

Fig. 8. 24-hour accumulated precipitation (inches water equivalent) ending at 1200 UTC (0700 EST) on Saturday, March 17, 2007 (NOAA).
Fig. 9 shows the global sea-surface temperatures for April 7, 2007. The data for this chart were not available in March of 2007 due to NASA equipment outages. However, the difference in the sea-surface temperature display between March 16 and April 7 would have been relatively minor. The simulation of the storm on March 16–18, 2007, used the actual sea-surface temperatures. Note the strong north/south temperature gradient off the east coast of the United States. The sea-surface temperature south of Cape Hatteras, North Carolina, was about 20–25°C (68–77°F) and about 10°C (40°F) colder 160 km (100 mi.) to the north. The warm temperatures south of Cape Hatteras contributed greatly to the development of the Valentine’s Day and St. Patrick’s Day nor’easters.

Fig. 9. Global sea-surface temperatures (°C) at 0000 UTC (1900 EST) on Saturday, April 7, 2007 (Unisys b).
The model calculations closely duplicated the wind and precipitation patterns of the actual storm. Figs. 10–13 show the simulated winds in the upper atmosphere at 10 km (~30,000 ft.), the simulated winds in the lower atmosphere at 850 mb (~5,000 ft.), and two periods of accumulated 12-hour precipitation ending Saturday morning, March 17, 2007. The simulated upper-level 10 km (~30,000 ft.) winds were very similar to the actual winds as the storm moved across the eastern United States and off the coast. For example the 50 m/s (~100 kt) isocontour of the 10 km (~30,000 ft.) wind in Fig. 10 on Saturday morning March 17, 2007, is almost identical to the 50 m/s (100 kt) contour of the 300 mb winds shown in Fig. 4. The speed and trajectories of the simulated winds at 1.5 km (~5,000 ft.) in Fig. 11 are also about the same as the actual winds on the 850 mb chart in Fig. 6. And the sum of the two 12-hour simulated accumulated maps in Figs. 12 and 13 of about 100 mm (~4 in.) in the path of the storm as it moved up the east coast was a little more than the actual 24-hour accumulated precipitation of about 75 mm (3 in.) shown in Fig. 8.

Fig. 10. Isotachs of simulated 10 km (~30,000 ft.) wind speed for actual sea-surface temperatures at 1200 UTC (0700 EST) on Saturday, March 17, 2007. Isotach envelope is 50 m/s (~100 kts).

Fig. 11. Isotachs of simulated wind speed for actual sea-surface temperature at 850 mb (~5,000 ft above sea level) at 1200 UTC (0700 a.m. EST) on Saturday, March 17, 2007. Isotachs are in intervals of 10 m/s (~20 kts).

Fig. 12. Simulated 12-hour accumulated precipitation in mm (~0.04 in.) ending at 0000 UTC (1900 EST) on Saturday, March 17, 2007, for the actual sea-surface temperature.

Fig. 13. Simulated 12-hour accumulated precipitation in mm (~0.04 in.) ending at 1200 UTC (0700 EST) on Saturday, March 17, 2007, for the actual sea-surface temperature.
Figs. 14 and 16–18 show the wind and precipitation fields at selected levels in the St. Patrick’s Day storm when the sea-surface temperature was artificially warmed to 40°C (104°F). Fig. 14 is a display of the isotachs of wind speed greater than 50 m/s (~100 kts) in the jet stream which typically flows around the globe at an altitude between about 7–12 km (23,000–39,000 ft.). On the west side of the low-pressure trough the air is traveling from the north-northwest at a speed slightly faster than that of the actual storm shown in Fig. 10. At the bottom of the trough the wind turns sharply eastward and the speed is much greater than the actual storm. To the east of the trough the wind flows in a northeast direction and at a speed greater than the actual storm over a much larger area.
In the exit region of the storm over Maine the air diverges, similar to the flow from a nozzle (Hess 1979). Fig. 15 shows the divergence and convergence regions and vertical circulations relative to a typical jet core. This divergence creates low pressure in the upper atmosphere on the left side of the jet core and high pressure on the right side. The low pressure to the left aloft draws air upward from the lower levels in the atmosphere creating a counter-clockwise circulation on the left side of the jet stream, cloudiness and precipitation. The high pressure on the right side of the jet core forces air downward creating a clockwise flow. In Fig. 14 air is also drawn westward by these circulations to flow into the back side of the storm. Notice that the air is drawn westward over the top of the main jet stream near the bottom of the trough and under the main jet stream farther to the north. The large blue area to the right of the trough indicates light winds in the descending air. A similar but much weaker circulation pattern occurs at slower isotachs in the actual storm.

Fig. 14. Isotachs of simulated 10 km (~30,000 ft.) wind speed for sea-surface temperature = 40°C (104°F) at 1200 UTC (0700 EST) on Saturday, March 17, 2007. Isotach envelope is 50 m/s (~100 kts). Lower-level flow indicated by dashed arrows.

Fig. 15. Divergence and convergence regions and circulations on horizontal and vertical slices through a jet core in the upper atmosphere. Air generally flows parallel to the constant pressure surfaces shown as red, curved lines in the upper part of the figure (geostrophic). But air tends to flow across constant pressure surfaces at the entrance and exit regions of the jet core shown as black, constant wind-speed contours (ageostrophic). This produces secondary transverse and vertical circulations.

Fig. 16. Isotachs of simulated wind speed for sea-surface temperature = 40°C (104°F) at 850 mb (~5,000 ft above sea level) at 1200 UTC (0700 EST) on Saturday, March 17, 2007. Isotachs are in intervals of 20 m/s (~40 kts).
Fig. 16 is a display of the isotachs at the 850 mb level (~5,000 ft.) at 20 m/s (40 kt) intervals for the enhanced St. Patrick’s Day nor’easter. A high-speed counterclockwise circulation is present off the southeastern coast of Canada and all along the east coast of the United States. Winds were from the northeast along the entire coastline from eastern Canada to Florida. The wind speed exceeded 60 m/s (120 kts) in the Atlantic which was equivalent to a category 4 hurricane. A similar wind pattern along the east coast was found by Vardiman and Brewer (2012) for hurricanes near Florida when enhanced by warm sea-surface temperatures. Notice also that a strong northerly wind flowed over the Great Lakes into the mid-western United States as part of the outer circulation. The wind speed in the main 1.5 km (5,000 ft.) circulation was up to three times that in the actual storm shown in Fig. 11. In addition, the center of circulation was farther out to sea and farther north than that in the actual storm. Over land the main storm intensity occurred over Quebec and Newfoundland rather than near North Carolina and Virginia. It is likely that severe blizzard conditions would occur under such conditions.
It is possible that the boundaries of the model simulation may have artificially influenced the circulation patterns, particularly near the eastern boundary. Air can flow through the boundaries of the model, but other effects such as pressure, temperature, and divergence interacting with the boundary may have caused some of the irregularities. The most likely cause for such an artificial influence may be that the warmer sea-surface temperature was specified only in the domain shown. One way to mitigate these effects, if they exist, would be to enlarge the domain.

Fig. 17. Simulated12-hour accumulated precipitation in mm (~0.04 in.) ending at 0000 UTC on Saturday, March 17, 2007, for sea-surface temperature = 40°C (104°F).

Fig. 18. Simulated 12-hour accumulated precipitation in mm (~0.04 in.) ending at 1200 UTC (0700 EST) on Saturday, March 17, 2007, for sea-surface temperature = 40°C (104°F).
Figs. 17 and 18 show the accumulated precipitation over two 12-hour periods for the enhanced St. Patrick’s Day nor’easter. Most of the heaviest precipitation occurred far off the east coast in the Atlantic where the storm dynamics were the strongest. The accumulated precipitation exceeded 1,000 mm (~40 in.) water equivalent per 12 hours in several locations over the ocean. The precipitation exceeded 50 mm (~2 in.) water equivalent per 12 hours generally over most of the domain except in the southern states. In addition, precipitation exceeded 120 mm (~5 in.) water equivalent per 12 hours over and around Maine and over 500 mm (20 in.) water equivalent east of Boston during the first 12-hour period ending at 0000 UTC on Saturday, March 17, 2007. During the second 12-hour period ending at 1200 UTC (0700 EST) on Saturday, March 17, 2007, the precipitation covered a larger area of Maine and Quebec and the heavy precipitation east of Boston moved northeastward into the Gulf of St. Lawrence. The precipitation streaks in Hudson Bay and the Great Lakes display lake effects due to cold air blowing from the north over warm water. The enhanced circulation also extended westward between Florida and Cuba into the Gulf of Mexico producing heavy precipitation in the southern Gulf.
The model calculations show that over 500 mm (20 in.) of snow would have fallen during 24 hours of the enhanced storm over all of Canada and the northeastern United States. This was about the same amount of snow that fell in the actual storm along the east coast. However, the enhanced storm covered all of Canada and the northeastern states rather than just along the coast. In addition, the enhanced storm would have produced 1,200 mm (~50 in.) of snow in Maine and Quebec, over twice as much as the actual storm.
April 14–17, 2007, Nor’easter
The April 14–17, 2007, Nor’easter affected major parts of eastern North America during its four-day course across the United States. The combined effects of strong winds, heavy rainfall, and high tides led to flooding, storm damage, power outages, evacuations, and disrupted traffic and commerce. In the north, heavy, wet snow caused the loss of power for several thousand homes in Ontario and Quebec. The storm caused at least 18 fatalities.
The storm started in the southwestern United States as an upper-level disturbance in the jet stream on April 13. It brought high wind and fire danger to California, Nevada, New Mexico, and Arizona. The storm then moved out into the southern Plains States bringing heavy snow to Colorado, Oklahoma, and Texas. Heavy rain and severe thunderstorms, hail, wind, and tornadoes affected parts of Texas, Louisiana, Mississippi, Alabama, Georgia, Florida, and the Carolinas. The storm moved across the mid-Atlantic States and into the Atlantic Ocean. It rapidly intensified into a major nor’easter over the warm waters of the Gulf Stream. The storm stalled just offshore from New York City and continued to strengthen. The lowest barometric pressure recorded was 968 mb (28.58 in hg), equivalent to that of a moderate category 2 hurricane.
The National Weather Service reported 192 mm (7.57 in.) of rain in Central Park by midnight of April 15, the second heaviest rainfall in 24 hours on record, and indicated that this storm caused the worst flooding since Hurricane Floyd in 1999. Major airports in the New York area resumed flights on April 16, after cancelling over 500 flights. Local rail and transit lines reported delays and cancellations affecting the MTA, NJ Transit, LIRR, and Metro-North Railroad. Power failures affected several thousand people.
On April 16 the storm produced sustained winds of nearly 45 m/s (~90 kts) on and near New Hampshire’s Mount Washington, with gusts topping out at nearly 70 m/s (~140 kts). While areas closer to the shore received heavy rainfall, higher regions inland received unseasonal snow. Several towns suffered from flooding including Mamaroneck in New York, and Bound Brook and Manville in New Jersey, while coastal towns had to deal with damage from high tides. Most major highways in Westchester County, New York, were closed on April 15 and April 16 due to extreme flooding. In Quebec, several regions including the Laurentides and Charlevoix regions received in excess of 15 cm (6 in.) of snow with areas exceeding well above 30 cm (~1 ft.) of snow.
In the city of Ottawa, 17 cm (~7 in.) of heavy wet snow fell in just a few hours causing power lines and trees to fall with scattered blackouts in several parts of the city. Similar damage was reported in the higher elevations north of Montreal and Ottawa. In total, more than 175,000 homes in Canada suffered power outages, including 160,000 Hydro-Québec customers mainly in areas from Gatineau towards Quebec City including Montreal, Lanaudière and the Laurentians with an additional 15,000 Hydro One and Hydro Ottawa customers.
In the United States over a quarter million homes lost power with New York and Pennsylvania being the hardest hit states due to the strong winds. Governor Eliot Spitzer of New York activated 3,200 members of the National Guard on alert. Richard Codey, acting governor of New Jersey, declared a state of emergency. The storm was blamed for several fatalities, including one person in a tornado in South Carolina, two people in storm-related traffic accidents in New York and Connecticut, two people in West Virginia, three people in New Jersey, and prior to its arrival in the East, five deaths in Kansas and Texas.
The Boston Marathon took place in what many considered to be the worst weather in its 110 year history. Race officials held serious talks about whether or not to cancel the race. The men’s race had the slowest winning time in 30 years (1977). In the women’s race, rainy and windy conditions led to the slowest winning time since 1985. High winds during the storm prevented emergency medical services from using helicopters for evacuation of the injured at the Virginia Tech massacre. The Internal Revenue Service delayed by two days the deadline for tax filing for victims of the nor’easter. While filing for federal disaster relief, acting governor Codey of New Jersey indicated that the storm caused $180 million in property damage in New Jersey, making it the second-worst rain storm in its history after Hurricane Floyd.
Figs. 19–24 show an infrared satellite image, the 300 mb chart (~30,000 ft above sea level), the 500 mb chart (~20,000 ft above sea level), the 850 mb chart (~5,000 ft above sea level), the surface chart, and the 24-hour accumulated precipitation chart, at 1200 UTC (0700 EST) on Monday, April 16, 2007, over the continental United States. The dynamics of the April 14–17 Nor’easter of 2007 were considerably different than the St. Patrick’s Day storm of March 16–18, 2007, discussed earlier which was driven by a high-altitude short wave moving from northwest to southeast across the United States. In this storm a high-amplitude jet core traveled around a closed circulation shown in the 300 mb chart and traveled across the United States from southwest to northeast. The closed circulation extended through all the standard levels from the surface to above 300 mb (~30,000 ft.) and was one of several which moved across the United States in April.

Fig. 19. Infrared satellite image at 1200 UTC (0700 EST) on Monday, April 16, 2007 (NASA).

Fig. 20. 300 mb chart at 1200 UTC (0700 EST) on Monday, April 16, 2007 (NOAA).

Fig. 21. 500 mb chart at 1200 UTC (0700 EST) on Monday, April 16, 2007 (NOAA).

Fig. 22. 850 mb chart at 1200 UTC (0700 EST) on Monday, April 16, 2007 (NOAA).

Fig. 23. Surface chart at 1200 UTC (0700 EST) on Monday, April 16, 2007 (Unisys a).

Fig. 24. 24-hour accumulated precipitation (inches water equivalent) ending at 1200 UTC (0700 EST) on Monday, April 16, 2007 (NOAA).
The satellite image shows the nor’easter extending from far off the coast of Florida northward to Maine with the center of circulation near New York City and a comma cloud covering the northeastern United States and southeastern Canada. The cold front was off the eastern seaboard, but several surface troughs rotated around the deep low pressure center. Surface winds exceeded 15 m/s (30 kts) near the center of circulation and extended in a counter-clockwise pattern outward as far as 1,600 km (~1000 mi.) in all directions including Quebec, Canada; St. Louis, Missouri; and Miami, Florida. A gigantic comma cloud and precipitation shield covered the mid-Atlantic states and the northeast. Radar reflectivities exceeding 40 dBz were common from Virginia northward and several hundred kilometers inland. Accumulated 24-hour precipitation (water equivalent) exceeded 1.25 cm (0.5 in.) over the entire east coast and inland from Florida to Canada and 10 cm (4 in.) along the coast from North Carolina to Maine on April 16. Most of the precipitation north and west of Boston was in the form of snow.
Fig. 25 shows the global sea-surface temperatures for Saturday, April 14, 2007, present during the April 14–17, 2007, Nor’easter actual simulation. Note the strong north/south temperature gradient off the east coast of the United States. The model calculations duplicated the wind and precipitation patterns of the actual storm reasonably well. Figs. 26–29 show the simulated winds in the upper atmosphere, the simulated winds in the lower atmosphere, and two sequential periods of accumulated 12-hour precipitation ending Sunday evening and Monday morning, April 16, 2007. The simulated upper-level 10 km (~30,000 ft.) winds were very similar to the actual winds as the storm moved across the eastern United States and off the coast. For example the 50 m/s (~100 kt) isotachs of the upper level wind in Fig. 26 on Monday morning April 16, 2007, was very similar to the 50 m/s (100 kt) contour of the 300 mb winds shown in Fig. 20. The speed and trajectories of the simulated winds at 1.5 km (~5,000 ft.) in Fig. 27 are also about the same as the actual winds on the 850 mb chart in Fig. 22. The sum of the two 12-hour charts of simulated precipitation in Figs. 28 and 29 was about 125 mm (~5 in.) in the Connecticut and Massachusetts area, which was a little more than the actual 24-hour accumulated precipitation of about 100 mm (4 in.) shown in Fig. 24. However, farther south in the New York City area the simulated precipitation was about 100 mm (4 in.), which was less than the actual 24-hour accumulated precipitation of about 150 mm (6 in.).

Fig. 25. Global sea-surface temperature in degrees celsius at 0000 UTC on Saturday, April 14, 2007 (Unisys b).

Fig. 26. Isotachs of simulated 10 km (~30,000 ft.) wind speed for actual sea-surface temperature at 1200 UTC (0700 EST) on Monday, April 16, 2007. Isotach envelope is 50 m/s (~100 kts).

Fig. 27. Isotachs of simulated wind speed for the actual storm at 850 mb (~5,000 ft above sea level) at 1200 UTC (0700 EST) on Monday, April 16, 2007. Isotachs are in intervals of 10 m/s (~20 kts).

Fig. 28. Simulated 12-hour accumulated precipitation in mm (~0.04 in.) ending at 0000 UTC on Monday, April 16, 2007, for actual sea-surface temperatures.

Fig. 29. Simulated 12-hour accumulated precipitation in mm (~0.04 in.) ending at 1200 UTC (0700 EST) on Monday, April 16, 2007, for actual sea-surface temperatures.
Figs. 30–33 show the wind and precipitation fields at selected levels for the enhanced April 14–17, 2007, Nor’easter when the sea-surface temperature was artificially warmed to 40°C (104°F). Fig. 30 is a display of the isotachs of wind speed greater than 50 m/s (~100 kts) in the jet stream. On the west side of the storm air is traveling from the west at a speed about the same as the actual storm shown in Fig. 26. As the air enters the storm it turns northeastward and the high-speed winds broaden over the east coast. In the outflow region of the storm the wind diverges over Maine, similar to the St. Patrick’s Day Storm. The divergence created low pressure in the upper atmosphere over the Gulf of St. Lawrence with a counterclockwise circulation and upward-flowing air. A reverse circulation formed over Quebec and flowed southwestward toward New York. The high pressure on the right side of the jet stream caused by the divergence region forced air downward creating a clockwise circulation. Air was drawn westward by this circulation into the back side of the storm. The large blue area of light winds to the right of the storm was similar to but farther south of the St. Patrick’s Day Storm. The orientation of the jet stream and the low-speed winds to the right of the storm were also canted more to the right because the trough associated with the storm was not as deep.
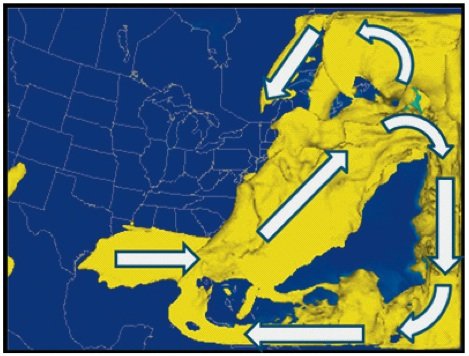
Fig. 30. Isotachs of simulated 10 km (~30,000 ft.) wind speed for sea-surface temperature = 40°C (104°F) at 1200 UTC (0700 EST) on Monday, April 16, 2007. Isotach envelope is 50 m/s (~100 kts).
Fig. 31 is a display of the isotachs at the 850 mb level (~5,000 ft.) at 20 m/s (40 kt) intervals for the enhanced April 14–17, 2007, Nor’easter. A gigantic high-speed, counter-clockwise circulation was present off the east coast of North America from south of Florida to northeastern Canada. Winds were from the northeast along the entire coastline from Florida to eastern Canada. Wind speeds exceeded 100 m/s (200 kts) in the Atlantic east of Maine, which exceeded the winds in a category 5 hurricane. This extreme circulation is similar but even larger in areal coverage than what Vardiman (2003) has called a hypercane. Notice that a strong northeasterly flow occurs along the entire east coast of the United States and reaches wind speeds over 100 m/s (200 kts). The wind speeds in the main 1.5 km (5,000 ft.) circulation were over three times greater than in the actual storm shown in Fig. 27. In addition, the center of circulation was farther out to sea and farther to the north than that in the actual storm. Over land the main storm winds were over 20 m/s (40 kts) in Maine and Quebec. Newfoundland had winds exceeding 50 m/s (100 kts). Severe blizzard conditions would occur under these conditions where the temperature was cold enough to produce snow.

Fig. 31. Isotachs of simulated wind speed for sea-surface temperature = 40°C (104°F) at 850 mb (~5,000 ft above sea level) at 1200 UTC (0700 EST) on Monday, April 16, 2007. Isotachs are in intervals of 20 m/s (~40 kts).
Figs. 32 and 33 show the accumulated precipitation over two 12-hour periods for the enhanced April 14–17, 2007, Nor’easter. Most of the heaviest precipitation occurred far off the east coast in the Atlantic, similar to the St. Patrick’s Day Storm where the storm dynamics were the strongest. The accumulated precipitation exceeded 1,000 mm (~40 in.) water equivalent per 12 hours in several locations over the ocean. The precipitation exceeded 50 mm (~2 in.) water equivalent per 12 hours generally over most of the domain except in the southern states and the northern part of the Gulf of Mexico. In addition, precipitation exceeded 100 mm (~4 in.) water equivalent per 12 hours around Newfoundland, New Brunswick, and in the ocean just south of Maine. The counterclockwise circulation around this enhanced storm also extended for long distances and produced snow streaks downwind from Hudson Bay and the Great Lakes. Heavy precipitation occurred into the southern Gulf of Mexico.

Fig. 32. . Simulated 12-hour accumulated precipitation in mm (~0.04 in.) ending at 0000 UTC on Monday, April 16, 2007, for sea-surface temperature = 40°C (104°F).

Fig. 33. Simulated 12-hour accumulated precipitation in mm (~0.04 in.) ending at 1200 UTC (0700 EST) on Monday, April 16, 2007, for sea-surface temperature = 40°C (104°F).
The model calculations show that over 500 mm (20 in.) of snow would have fallen during 24 hours of the enhanced storm over all of Canada and the northeastern United States. This was about the same amount of snow that fell in the actual storm along the east coast. However, the enhanced storm covered all of Canada and the northeastern states rather than just along the coast. In addition, the enhanced storm would have produced 1,200 mm (~50 in.) of snow in Newfoundland and New Brunswick, over twice as much as the actual storm. Most of the precipitation fell over the Atlantic, but it’s possible snow bands could have tracked inland because of the closeness of the heavy circulation and precipitation centers to Quebec.
February 5–6, 2010
North American Blizzard (Snowmaggedon)
The February 5–6, 2010, North American blizzard also known as Snowmaggedon was a nor’easter once it reached the east coast and a severe weather event that tracked from California to Arizona through northern Mexico, the American Southwest, the Midwest, Southeast, and mid-Atlantic regions. The storm created extensive flooding and landslides in Mexico, as well as historic snowfall totals in the mid-Atlantic States, rivaling the Knickerbocker Storm of 1922. The storm stretched from Mexico and New Mexico to New Jersey before moving out to sea, then turning north to impact the Maritime Provinces of Canada. The storm caused deaths in Mexico, New Mexico, Maryland, and Virginia.
Blizzard conditions were reported in a relatively small area of Maryland, but near-blizzard conditions occurred through a large part of the mid-Atlantic region. Additionally, some places across eastern West Virginia, Maryland, northern Virginia, Washington DC, Delaware, southwestern Pennsylvania, south-central Pennsylvania, southeastern Pennsylvania, and southern New Jersey received between 0.5 m and 1.0 m (20–40 in.) of snow, bringing air travel and Interstate Highway traffic to a halt. While rail service south and west of Washington DC was suspended, rail travel between Washington DC and Boston was available with only limited service. The storm was followed just three days later by the February 9–10, 2010, North American blizzard.
The main storm system originated in the Pacific Ocean, passing through California and Arizona on February 1 and 2, delivering heavy rain and mountain snow to these regions. On February 3, the system dropped into northern Mexico, before swinging northeast into southern New Mexico, and then ejecting eastward across Texas. Meanwhile a second low pressure center tracked from the northern Rockies to the Upper Midwest, bringing light snow showers to Montana, the Dakotas, parts of Minnesota, Wisconsin, Iowa, and Illinois.
On February 5, the two systems merged, stretching a band of heavy snow from Illinois eastward through Indiana, Ohio, and Pennsylvania. By evening, the northern system dissipated and the southern system began intensifying as it moved northeast from Alabama to the vicinity of Cape Hatteras. During the evening heavy snow spread eastward into Maryland, Delaware, Virginia, New Jersey, and the Washington DC area.
Overnight, as the storm system moved northeast toward Cape Hatteras, a blocking pattern over the North Atlantic prevented it from continuing this motion, and forced it to turn east. As a result, the northern edge of the heaviest snow reached the southern suburbs of New York City, and light snow fell in parts of the city itself. Upstate New York and New England were spared from this system, receiving little more than isolated snow flurries in southern sections. Easterly winds and onshore flow contributed to light snow accumulations of less than 2.5 cm (1 in.) in Boston, Cape Cod, and parts of coastal Rhode Island.
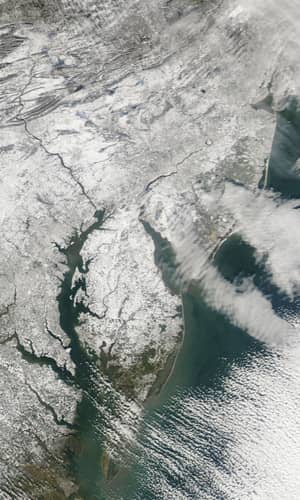
The storm was carrying an enormous amount of moisture drawn from the Gulf of Mexico as seen on the February 3, 2010, satellite imagery over Mexico, and from the Atlantic as seen in radar imagery from early on February 5, 2010. According to the National Weather Service, in the Baltimore, Maryland, region, snowfall totals exceeded 75 cm (30 in.) in many areas. In the Washington DC region, snowfall totals amounted to 50 cm (20 in.) to over 90 cm (35 in.). Fig. 34 shows the snowfall in northwest Washington DC on February 6, 2010. Rockville, Maryland reported 62 cm (24.5 in.) but there were snow drifts that made the snow almost 1 m (3 ft.) deep in some spots.

Fig. 34. Snowfall on 19th Street NW, Washington DC on Saturday, February 6, 2010.
Philadelphia had totals of over 70 cm (28 in.) of snow by 5:15 pm EST on February 6, 2010. This was the second highest snowfall in city history after the North American blizzard of 1996, and made for the first winter where the city saw two storms producing more than 50 cm (20 in.) of snow, along with the North American blizzard of 2010. Some areas in Southern New Jersey had totals of 75 cm (30 in.) of snow by 4:00 pm EST on February 6, 2010.
Figs. 35–40 show an infrared satellite image, the 300 mb chart (~30,000 ft above sea level), the 500 mb chart (~20,000 ft above sea level), the 850 mb chart (~5,000 ft above sea level), the surface chart, and the 24-hour accumulated precipitation chart, at 1200 UTC (0700 EST) on Saturday, February 6, 2010, over the continental United States. The dynamics of the February 5–6, North American Blizzard of 2010 was similar to the St. Patrick’s Day storm of March 16–18, 2007, discussed earlier which was driven by a high-altitude short wave moving from northwest to southeast across the United States. However, in the North American Blizzard of 2010 a jet core and short wave traveled across the United States from west to east at an unusually low latitude seen in the 300 mb chart of Fig. 36 almost in the position of a tropical jet. The 850 mb (5,000 ft.) circulation in Fig. 38 was centered on Washington DC but the pressure field was relatively weak.

Fig. 35. Infrared satellite image at 1200 UTC (0700 EST) on Saturday, February 6, 2010 (NASA).

Fig. 36. 300 mb chart at 1200 UTC (0700 EST) on Saturday, February 6, 2010 (NOAA.)

Fig. 37. 500 mb chart at 1200 UTC (0700 EST) on Saturday, February 6, 2010 (NOAA).
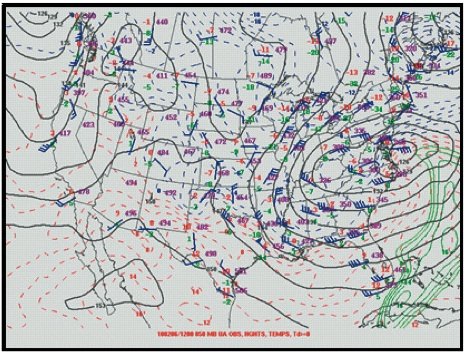
Fig. 38. 850 mb chart at 1200 UTC (0700 EST) on Saturday, February 6, 2010 (NOAA).
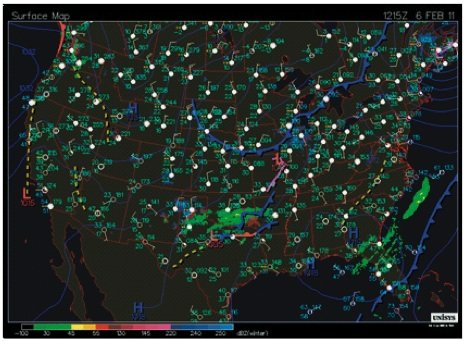
Fig. 39. Surface chart at 1200 UTC (0700 EST) on Saturday, February 6, 2010 (Unisys a).
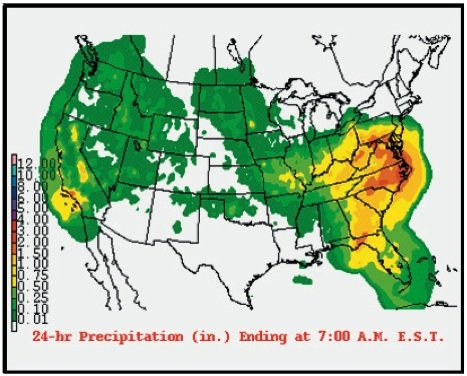
Fig. 40. 24-hour accumulated precipitation (inches water equivalent) ending at 1200 UTC (0700 EST) on Saturday, February 6, 2010 (NOAA).
The satellite image in Fig. 35 shows the nor’easter extending off the coast of Florida northward to Boston with the center of circulation east of Washington DC and a comma cloud covering the northeastern United States south of Maine. The cold front shown in Fig. 39 was completely off the east coast and the surface winds were not nearly as well organized as the other two storms. The precipitation shield shown in Fig. 40 was centered on eastern North Carolina and Virginia and extended in a broad pattern over most of the eastern United States from Florida to Pennsylvania and inland to the mid-west. Accumulated 24-hour precipitation (water equivalent) exceeded 1.25 cm (0.5 in.) over the mid-Atlantic and southeastern states and precipitation exceeded 5 cm (2 in.) over much of North Carolina, Virginia, West Virginia, and Maryland. Radar reflectivities exceeding 40 dBz were rare north of South Carolina.
Fig. 41 shows the global sea-surface temperatures for Sunday, February 7, 2010. Note again a strong north/south temperature gradient off the east coast of the United States near Cape Hatteras, North Carolina. The simulation of the storm on February 5–6, 2010, used the actual sea-surface temperatures shown in Fig. 41. The model calculations duplicated the wind and precipitation patterns of the actual storm very well. Figs. 42–45 show the simulated winds in the upper atmosphere, the simulated winds in the lower atmosphere, and two sequential periods of accumulated 12-hour precipitation ending at 0000 UTC and 1200 UTC, February 6, 2010. The simulated upper-level 10 km (~30,000 ft.) winds were very similar to the actual winds as the storm moved off the east coast. For example the 50 m/s (~100 kt) isocontour of the upper level wind in Fig. 42 on Monday morning February 6, 2010, is very similar to the 50 m/s (100 kt) contour of the 300 mb winds shown in Fig. 36. The speed and trajectories of the simulated winds at 1.5 km (~5,000 ft.) in Fig. 43 are also very similar to the actual winds on the 850 mb chart in Fig. 38. The sum of the two 12-hour charts of simulated precipitation in Figures 44 and 45 was about 100 mm (~4 in.) in eastern North Carolina and Virginia, which was a little more than the actual 24-hour accumulated precipitation of about 75 mm (3 in.) shown in Fig. 40.
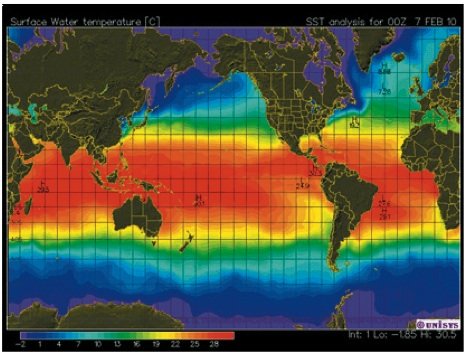
Fig. 41. Global sea-surface temperatures (°C) at 0000 UTC (1900 EST) on Sunday, February 7, 2010 (Unisys b).
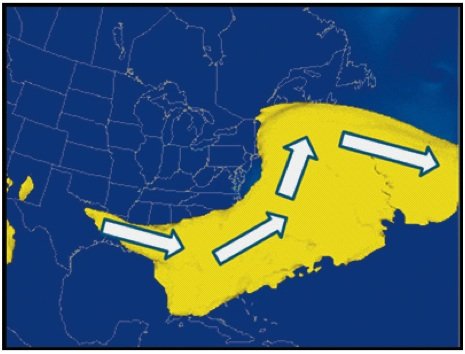
Fig. 42. Isotachs of simulated 10 km (~30,000 ft.) wind speed for actual sea-surface temperature at 1200 UTC (0700 EST) on Saturday, February 6, 2010. Isotach envelope is 50 m/s (~100 kts).
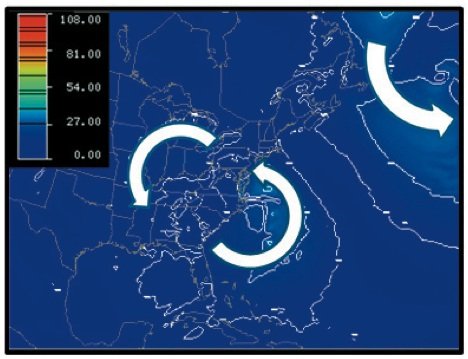
Fig. 43. Isotachs of simulated wind speed for the actual storm at 850 mb (~5,000 ft above sea level) at 1200 UTC (0700 EST) on Saturday, February 6, 2010. Isotachs are in intervals of 10 m/s (~20 kts).
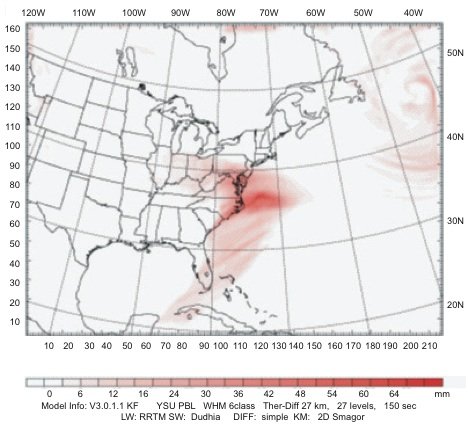
Fig. 44. Simulated 12-hour accumulated precipitation in mm (~0.04 in.) ending at 0000 UTC on Saturday, February 6, 2010 for the actual sea-surface temperatures.
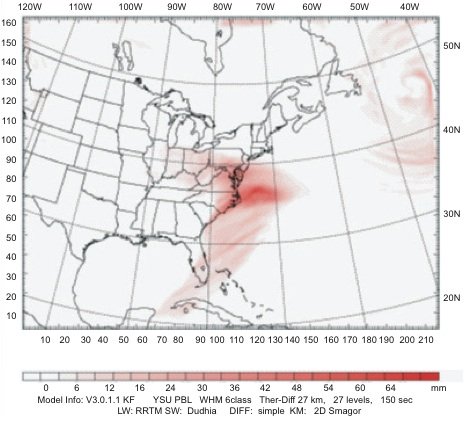
Fig. 45. Simulated 12-hour accumulated precipitation in mm (~0.04 in.) ending at 1200 UTC (0700 EST) on Saturday, February 6, 2010, for the actual sea-surface temperatures.
Figs. 46–49 show the wind and precipitation fields at selected levels for the enhanced February 5–6, 2010 North American Blizzard when the sea-surface temperature was artificially warmed to 40°C (104°F). Fig. 46 is a display of the isotachs of wind speed greater than 50 m/s (~100 kts) in the jet stream. On the west side of the storm air is traveling from Mexico at a greater speed and wider path than the actual storm shown in Fig. 42. As the air enters the storm it continues northeastward and crosses the east coast near North Carolina. In the outflow region of the storm the wind diverges over the ocean east of Boston. The divergence region is farther south than either the St. Patrick’s Day Storm or the April 14–17, 2007, Nor’Easter. However, like the other two storms the divergence pattern creates low pressure to the left of the jet stream and high pressure to the right. In this case, however, the counterclockwise circulation and upward-flowing air is positioned over the ocean east of Maine and the clockwise circulation and downward-flowing air is centered over the ocean east of Georgia. The counterclockwise circulation lifts air upward and flows southward over Quebec toward the Canadian border. The high pressure on the right side of the jet stream east of Georgia forces air downward, creates a clockwise circulation, and air flows westward over Georgia into the back of the storm. This westward flow of air rises, turns back northeast, crosses over the main jet, and flows parallel to the coastline. The large blue area of light winds to the right of the storm is smaller, farther south, and oriented more east/west than the other two cases.
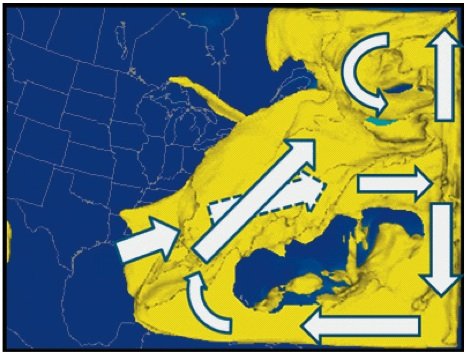
Fig. 46. Isotachs of simulated 5 km (~16,500 ft.) wind speed for sea-surface temperature = 40°C (104°F) at 1200 UTC (0700 EST) on Saturday, February 6, 2010. Isotach envelope is 50 m/s (~100 kts). Lower-level flow indicated by dashed arrows.
Fig. 47 is a display of the isotachs at the 850 mb level (~5,000 ft.) at 20 m/s (40 kt) intervals for the enhanced February 5–6, 2010, North American Blizzard. A gigantic high-speed, counter-clockwise circulation is present off the east coast of North America from northeastern Canada to south of Florida. Winds were from the northeast along the entire coastline from eastern Canada to Florida. Wind speeds exceeded 60 m/s (120 kts) in the Atlantic Ocean east of Maine, which exceeded the winds in a category 2 hurricane similar to the St. Patrick’s Day Nor’easter. Notice that a strong northeasterly flow occurred off the entire east coast. The wind speeds in the main 1.5 km (5,000 ft.) circulation were over twice that of the actual storm shown in Fig. 43. In addition, the center of circulation was farther out to sea and farther north than that in the actual storm. Over land the main storm winds were over 20 m/s (40 kts) in Maine and Quebec, and Newfoundland had winds exceeding 50 m/s (100 kts). Severe blizzard conditions would occur under these conditions where the temperature was cold enough to produce snow.
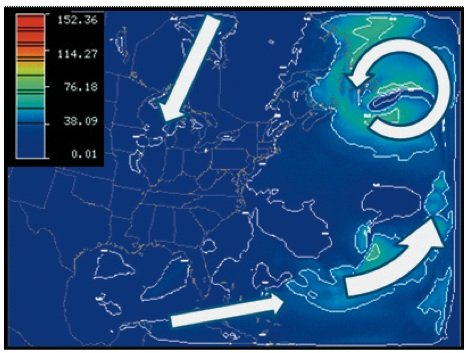
Fig. 47. Isotachs of simulated wind speed for sea-surface temperature = 40°C (104°F) at 850 mb (~5,000 ft above sea level) at 1200 UTC (0700 EST) on Saturday, February 6, 2010. Isotachs are in intervals of 20 m/s (~40 kts).
Figs. 48 and 49 show the accumulated precipitation over two 12-hour periods for the enhanced February 5–6, 2010, North American Blizzard. Most of the heaviest precipitation occurred far off the east coast in the Atlantic, similar to the St. Patrick’s Day Storm where the storm dynamics were the strongest. The accumulated precipitation exceeded 1,000 mm (~40 in.) water equivalent per 12 hours in several locations over the ocean. The precipitation exceeded 50 mm (~2 in.) water equivalent per 12 hours generally over most of the domain except in the southern states and the northern part of the Gulf of Mexico. In addition, precipitation exceeded 100 mm (~4 in.) water equivalent per 12 hours around Newfoundland, New Brunswick, and in the ocean just south of Maine. The counterclockwise circulation around this enhanced storm also extended to long distances and produced snow streaks downwind from Hudson Bay and the Great Lakes. Heavy precipitation occurred into the Gulf of Mexico.
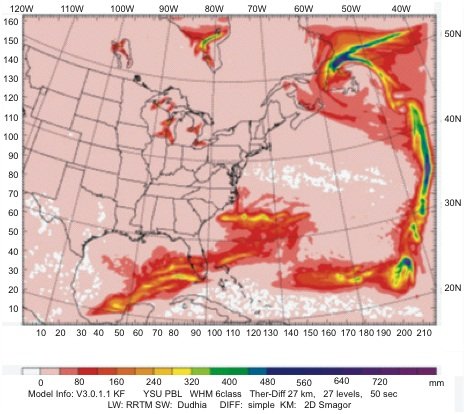
Fig. 48. Simulated 12-hour accumulated precipitation in mm (~0.04 in.) ending at 0000 UTC on Saturday, February 6, 2010, for sea-surface temperature = 40°C (104°F).
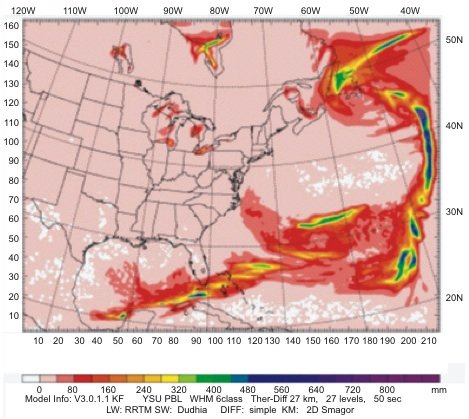
Fig. 49. Simulated 12-hour accumulated precipitation in mm (~0.04 in.) ending at 1200 UTC (0700 EST) on Saturday, February 6, 2010, for sea-surface temperature = 40°C (104°F).
The model calculations show that over 500 mm (20 in.) of snow would have fallen during 24 hours of the enhanced storm over all of Canada and the northeastern United States. This was about the same amount of snow that fell in the actual storm along the east coast. However, the enhanced storm covered all of Canada and the northeastern states with snow rather than just along the coast. In addition, the enhanced storm would have produced 1,200 mm (~50 in.) of snow in Newfoundland and New Brunswick, over twice as much as the actual storm. Most of the precipitation fell over the Atlantic, but it’s possible snow bands could have tracked inland because of the closeness of the heavy circulation and precipitation centers to Quebec.
Conclusions and Recommendations
Three nor’easters were successfully simulated using the NCAR WRF numerical model. The calculated wind fields and precipitation patterns closely matched the actual storms for the different types of weather patterns driving the nor’easters, including a deep, open wave moving across the upper tier of states from northwest to southeast, a series of deep closed lows moving from southwest to northeast midway between Canada and Mexico, and a flat wave moving from west to east along the United States/Mexico border. The calculated upper-level 10 km (~30,000 ft.) winds were in close agreement with the magnitudes and positions of the observed jet streams at 300 mb (~30,000 ft.). The calculated winds at 1.5 km (~5,000 ft.) likewise closely matched the wind speeds and patterns of the observed winds at 850 mb (~5,000 ft.). The calculated precipitation rates and distributions were very similar to the observed precipitation fields. Consequently, it is concluded that the WRF model was a good choice for simulating nor’easters.
When the surface temperature of the Atlantic Ocean was warmed to 40°C (104°F) all three nor’easters were invigorated—wind speeds were increased and new patterns emerged, both at the upper and lower levels, and precipitation was increased and redistributed. At the upper levels a complex secondary circulation developed as the jet core associated with each storm crossed the coastline into the Atlantic. The additional heat and water vapor entering the atmosphere from the warm ocean changed the storm dynamics via the thermal wind effect and invigorated the storms producing strong counter circulations on both sides of the jet cores.
On the left side of the jet cores a counterclockwise circulation developed lifting air from the lower atmosphere and amplifying the 1.5 km (5,000 ft.) circulation. A clockwise circulation developed on the right side of the jet cores forming a region of light upper-level 10 km (~30,000 ft.) winds and forcing air downward into the lower atmosphere. These two circulations were positioned farther north or south and assumed different shapes depending on the position and orientation of the main jet stream as it crossed the east coast. The farther south the position of the main jet stream the farther south was the center of the circulations. The region of upper-level light winds typically exhibited an elongated shape parallel to the main jet stream. For example, the flat wave for the February 5–6, 2010, North American Blizzard was oriented southwest/northeast as it left the east coast and the region of upper-level light winds extended northeastward from off the coast of Florida far out into the Atlantic.
Around the secondary circulations high-altitude jets of air turned westward and fed a portion of the air back into the main jet stream. The jet on the left side reconnected with the main jet stream only a short distance westward from the cores, but the jet on the right traveled a long distance westward before rising over the main jet stream. It then descended and merged into the enlarged circulation of the nor’easter on the north side of the main jet stream.
The winds in the lower atmosphere developed into gigantic counterclockwise circulations for the warmer sea-surface temperature and increased the wind speed by a factor of 2 or more. In the case of the April 14–17, 2007, Nor’easter with the deep, closed circulation, the wind speed increased to over 100 m/s (200 kts), faster than a category 5 hurricane. In this same storm the counterclockwise low-level 1.5 km (5,000 ft.) circulation extended along the entire east coast from Florida to Quebec. The center of the low-level circulations was much farther off the east coast and to the north than the observed storms and formed long bands of high winds and convection into the Gulf of Mexico and through the Strait of Florida. Northeasterly and northerly flow on the west side of the low-level circulation was stronger than winds in the observed cases and extended westward as far as central Canada and the mid-western United States.
The heaviest precipitation in the enhanced nor’easters was much farther to the east and north than the observed cases. In all cases heavy precipitation of more than 2,000 mm (~40 in.) water equivalent per 24 hours fell over the Atlantic Ocean, not on land. However, a widespread lighter precipitation of about 100 mm (4 in.) water equivalent per 24 hours fell over all of Canada and most of the United States when the sea-surface temperature was warmed to 40°C (104°F). This light rain and snow over such a large region was probably due to the moister environment caused by the warmer ocean and general lifting of the air over a large region under enhanced dynamics and reduced stability.
In addition, another 100 mm (4 in.) water equivalent per 24 hours or so fell in isolated locations over a few northeastern states and eastern Canada. The warm sea-surface temperature seems to have caused such strong dynamics that the precipitation was mainly forced off the coast over the ocean. It is likely from hints in the simulations a smaller increase in sea-surface temperature might provide more precipitation over land. Consequently, it is recommended that additional simulations be conducted for an increase in sea-surface temperature of only 5°C (9°F).
Even with the heaviest precipitation falling over the Atlantic Ocean in these simulations, the widespread lighter precipitation of about 100 mm (4 in.) water equivalent per 24 hours would have contributed to a significant accumulation of snow during the ice age. This rate would produce about 500 mm (20 in.) of snow in 24 hours. If Vardiman and Brewer (2010c) are right that during the ice age following the Genesis Flood a storm formed and moved across the United States every three days all year round, this would produce an uncompressed snow pack of about 60 m (~200 ft.) per year. Upon compression to solid ice this would produce an ice layer of about 1,200 m (4,000 ft.) in 100 years. If bands of additional precipitation were swept around the centers of circulation of enhanced nor’easters off the coast of New England, the accumulation would have been even greater. Just the accumulation of snow and ice from the widespread lighter precipitation would have been more than adequate to explain the evidence for a thick Laurentide ice sheet in eastern Canada during a recent ice age.
The pattern of upper-level winds at 10 km (~30,000 ft.) and precipitation near the eastern boundary of the domain of this study for the three nor’easters appears somewhat questionable. A similar pattern was observed in the studies of typhoons and hurricanes by Vardiman and Brewer (2011, 2012) and the reviewers raised concerns with several of our simulations. In looking at the smaller domains used in this study there didn’t appear to be any boundary effects at the edges of the small and medium-sized domains. The wind fields and precipitation patterns did not bunch near the boundaries of the smaller domains. Consequently, it was assumed that the best way to resolve this problem was to simply build an even larger domain to move the boundaries farther away from the region of interest. However, it occurred to the authors since these earlier studies that the peculiarities may be due to the assignment of sea-surface temperature to fill only the large domain but not the region beyond. The abrupt change in sea-surface temperature at the boundaries of the large domain is probably the source of the problem. Both the authors and the reviewers agree that the strong gradient likely affected the simulation. It may be possible to avoid this by assigning warmer sea-surface temperatures to the entire ocean outside as well as inside the current domains. Therefore, it is recommended that in a future study either the entire ocean be heated or a larger domain be defined and heated outside the current domains.
The authors have already begun simulations of a few additional cases with various-sized domains and a relaxation of the sea-surface temperature gradient at the eastern edge of the current domain. Indications are that the artificially large temperature gradient in the mid-Atlantic is, in fact, a major reason for the south-to-north flow off the coast to be drawn eastward and become unusually strong. However, we believe the general pattern will remain similar even after these changes are made, but the circulation should be somewhat weaker and occur farther westward than shown in this study. So, the general conclusions are likely to hold up, but the precipitation would be expected to occur farther westward in the ocean and more precipitation would occur over the northeastern United States and southeastern Canada.
Acknowledgments
The mesoscale model (WRF) and topographical data used in this study were developed and maintained by the National Center for Atmospheric Research (NCAR) available at http://www.wrf-model.org. The meteorological data used in this study were downloaded from the Research Data Archive (RDA) which is maintained by the computational and Information Systems Laboratory (CISL) at the National Center for Atmospheric Research (NCAR). The original data were available from the RDA (http://dss.ucar.edu) in dataset number ds083.2. NCAR is sponsored by the National Science Foundation (NSF). We appreciate the assistance of the reviewers in helping find errors in the manuscript and offering suggestions and improvements. Of course, any remaining errors are the responsibility of the authors. This research was funded by the National Creation Research Foundation at the Institute for Creation Research.
References
Austin, S. A., J. R. Baumgardner, D. R. Humphreys, A. A. Snelling, L. Vardiman, and K. P. Wise. 1994. Catastrophic plate tectonics: A global flood model of earth history. In Proceedings of the Third International Conference on Creationism, ed. R. E. Walsh, pp. 609–621. Pittsburgh, Pennsylvania: Creation Science Fellowship. Retrieved from http://www.icr.org/article/catastrophic-plate-tectonicsflood-model/.
Emanuel, K. A. 1987. The dependence of hurricane intensity on climate. Nature 326, no. 6112:483–485.
Heezen, B. and M. Tharp. 1977. Map of the world ocean floor. Office of Naval Research, Columbia University. Retrieved from http://www.columbia.edu/cu/news/06/08/tharp.html.
Hess, S. L. 1979. Introduction to theoretical meteorology, pp. 219–228. New York, New York: Holt, Rinehart, and Winston.
Kennett, J. P., R. E. Houtz, P. B. Andrews, A. R. Edwards, V. A. Goslin, M. Hajós, M. A. Hampton, D. G. Jenkins, S. V. Margolis, A. T. Ovenshine, and K. Perch-Nielson. 1975. In Initial reports of the deep sea drilling project, Site 284, 29, ed. J. P. Kennett et al., pp. 403–445.
Kocin, P and L. W. Uccellini. 1990. Snowstorms along the northeastern coast of the United States: 1955–1985. Monograph, vol. 22, no. 44. Boston, Massachusetts: American Meteorological Society.
NCAR. 2003. MM5 model. Retrieved from http://www.mmm.ucar.edu/mm5/.
NCAR. 2007. WRF model. Retrieved from http://www.wrf-model.org/index.php.
Oard, M. 1990. An ice age caused by the Genesis Flood. El Cajon, California: Institute for Creation Research.
Shackleton, J. J. and J. P. Kennett. 1975. Paleotemperature history of the Cenozoic and the initiation of Antarctic glaciation: Oxygen and carbon isotope analysis in DSDP sites 277, 279, and 281. In Initial reports of the deep sea drilling project 29, ed. J. P. Kennett et al., pp. 743–755.
Unisys_a. Retrieved from http://weather.unisys.com/archive/sfc_map/.
Unisys_b. Retrieved from http://weather.unisys.com/archive/sst/.
Vardiman, L. 2003. Hypercanes following the Genesis Flood. In Proceedings of the Fifth International Conference on Creationism, ed. R. L. Ivey, Jr., pp. 17–28. Pittsburgh, Pennsylvania: Creation Science Fellowship.
Vardiman, L. 2008. A proposed mesoscale simulation of precipitation in Yosemite National Park with a warm ocean. In Proceedings of the Sixth International Conference on Creationism, ed. A. A. Snelling, pp. 307–320. Pittsburgh, Pennsylvania: Creation Science Fellowship; Dallas, Texas: Institute for Creation Science.
Vardiman, L. and W. Brewer. 2010a. Numerical simulation of precipitation in Yosemite National Park with a warm ocean: A pineapple express case study. Answers Research Journal 3:23–36. Retrieved from http://www.answersingenesis.org/articles/arj/v3/n1/yosemite-pineapple-express.
Vardiman, L. and W. Brewer. 2010b. Numerical simulation of precipitation in Yosemite National Park with a warm ocean: Deep upper low and rex blocking pattern case studies. Answers Research Journal 3:119–145. Retrieved from http://www.answersingenesis.org/articles/arj/v3/n1/yosemite-numerical-simulation-precipitation.
Vardiman, L. and W. Brewer. 2010c. Numerical simulation of precipitation in Yellowstone National Park with a warm ocean: Continuous zonal flow, Gulf of Alaska low, and plunging western low case studies. Answers Research Journal 3:209–266. Retrieved from http://www.answersingenesis.org/articles/arj/v3/n1/numerical-simulation-precipitation-yellowstone.
Vardiman, L. and W. Brewer. 2011. A well-watered land: Numerical simulations of a hypercyclone in the Middle East. Answers Research Journal 4:55–74. Retrieved from http://www.answersingenesis.org/articles/arj/v4/n1/well-watered-land.
Vardiman, L. and W. Brewer. 2012. Numerical simulations of Hypercanes Charley and Fay in the Caribbean and the Gulf of Mexico over a warm ocean, Answers Research Journal 5:13–24. Retrieved from http://www.answersingenesis.org/articles/arj/v5/n1/numerical-simulations-hypercanes-charley-fay.
